
A Cyanobacteria Enriched Layer of Shark Bay Stromatolites Reveals a New Acaryochloris Strain Living in Near Infrared Light

 ,
,  , , , ,
Abstract
:
1. Introduction
2. Materials and Methods
2.1. Site Description, Sampling and Mat Sectioning
2.2. Isolation and Culturing
2.3. Liquid Culture Enrichment
2.4. Culturing on Agar Plates
2.5. Fluorescence Microscopy
2.6. Absorbance and Fluorescence Spectroscopy
2.7. Excitation Emission Matrices
2.8. HPLC Pigment Analysis
2.9. 16SSU rRNA Analysis
2.10. Flow Cytometry
2.11. Fluorometry by Pulsed Amplitude Modulated (PAM) Fluorescence
2.12. Cell Counts
3. Results
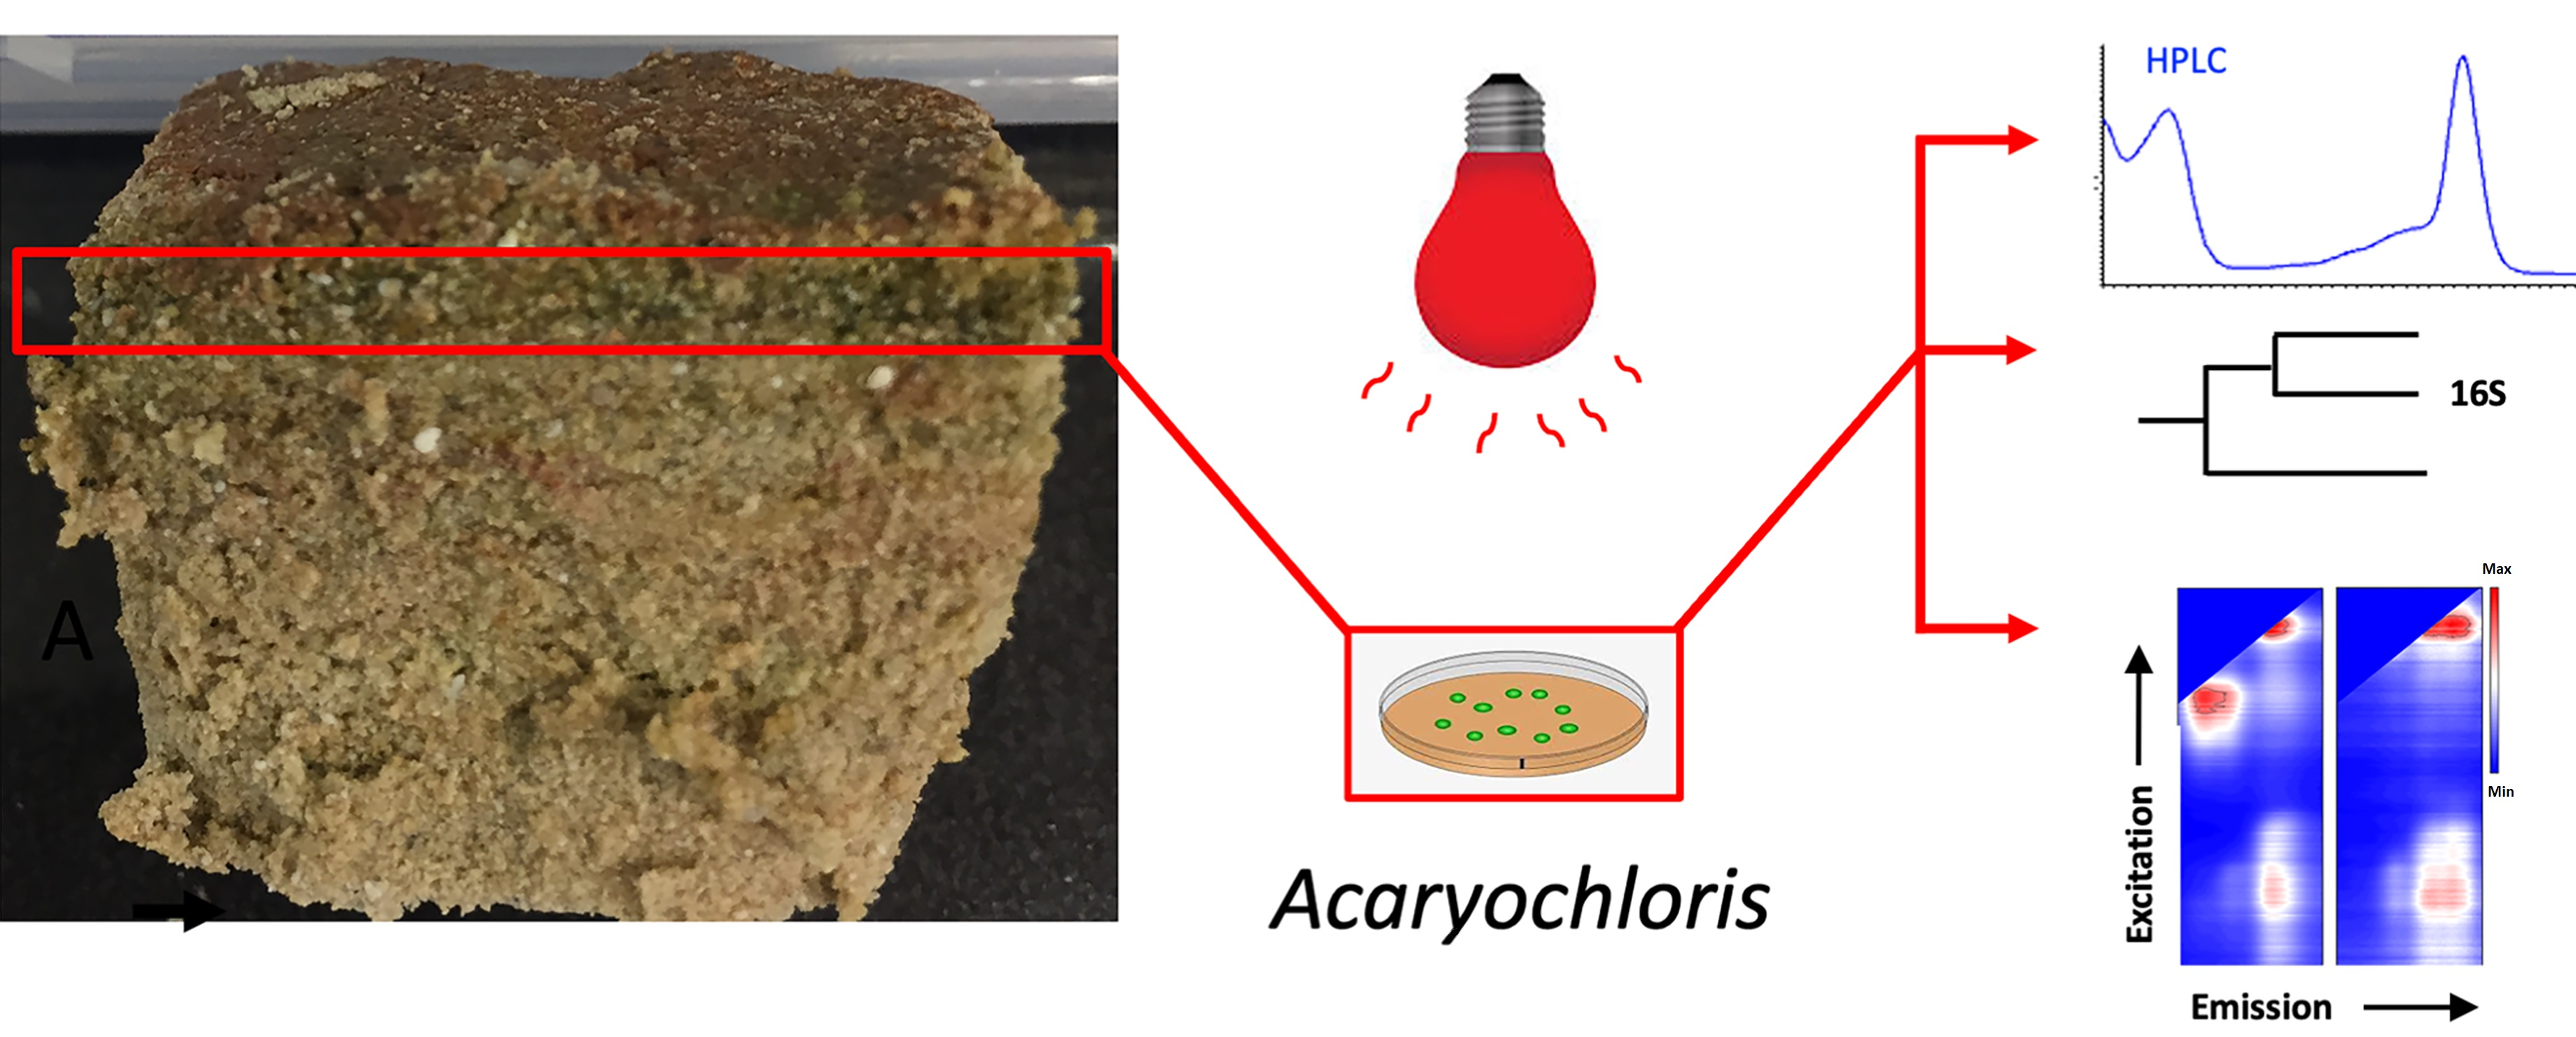
3.1. Location
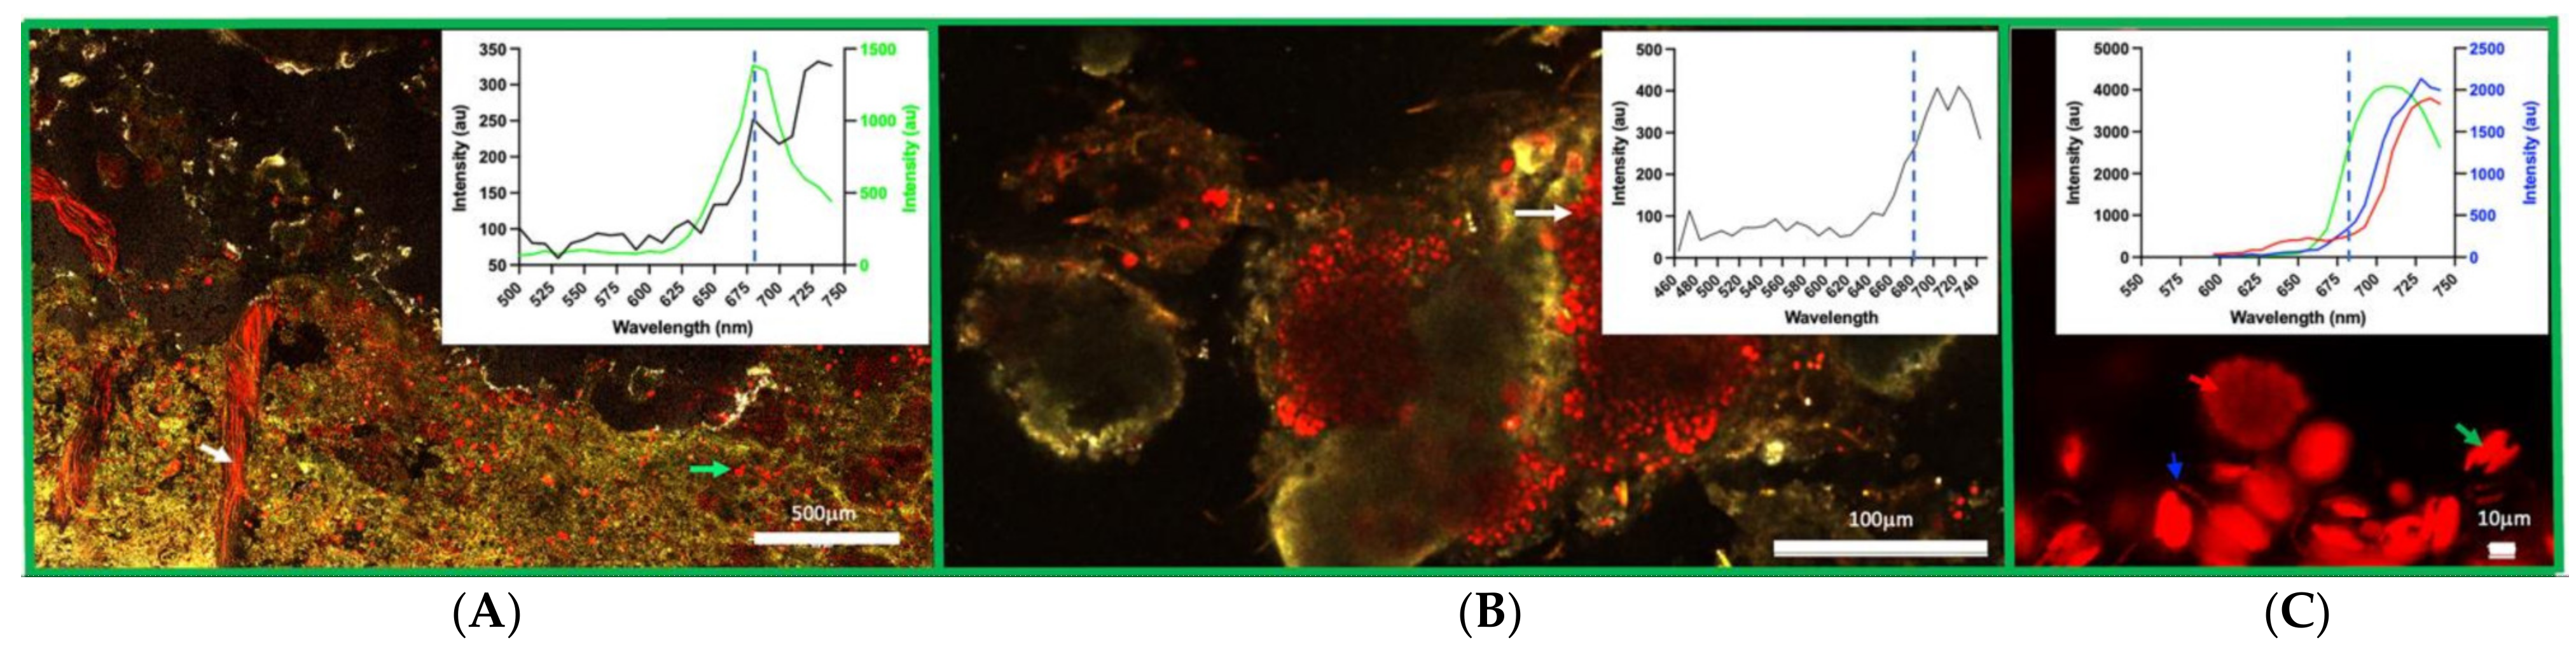
3.2. Confocal Imaging of Mat Material
3.3. Obtaining a Purified Isolate and Culture Morphology
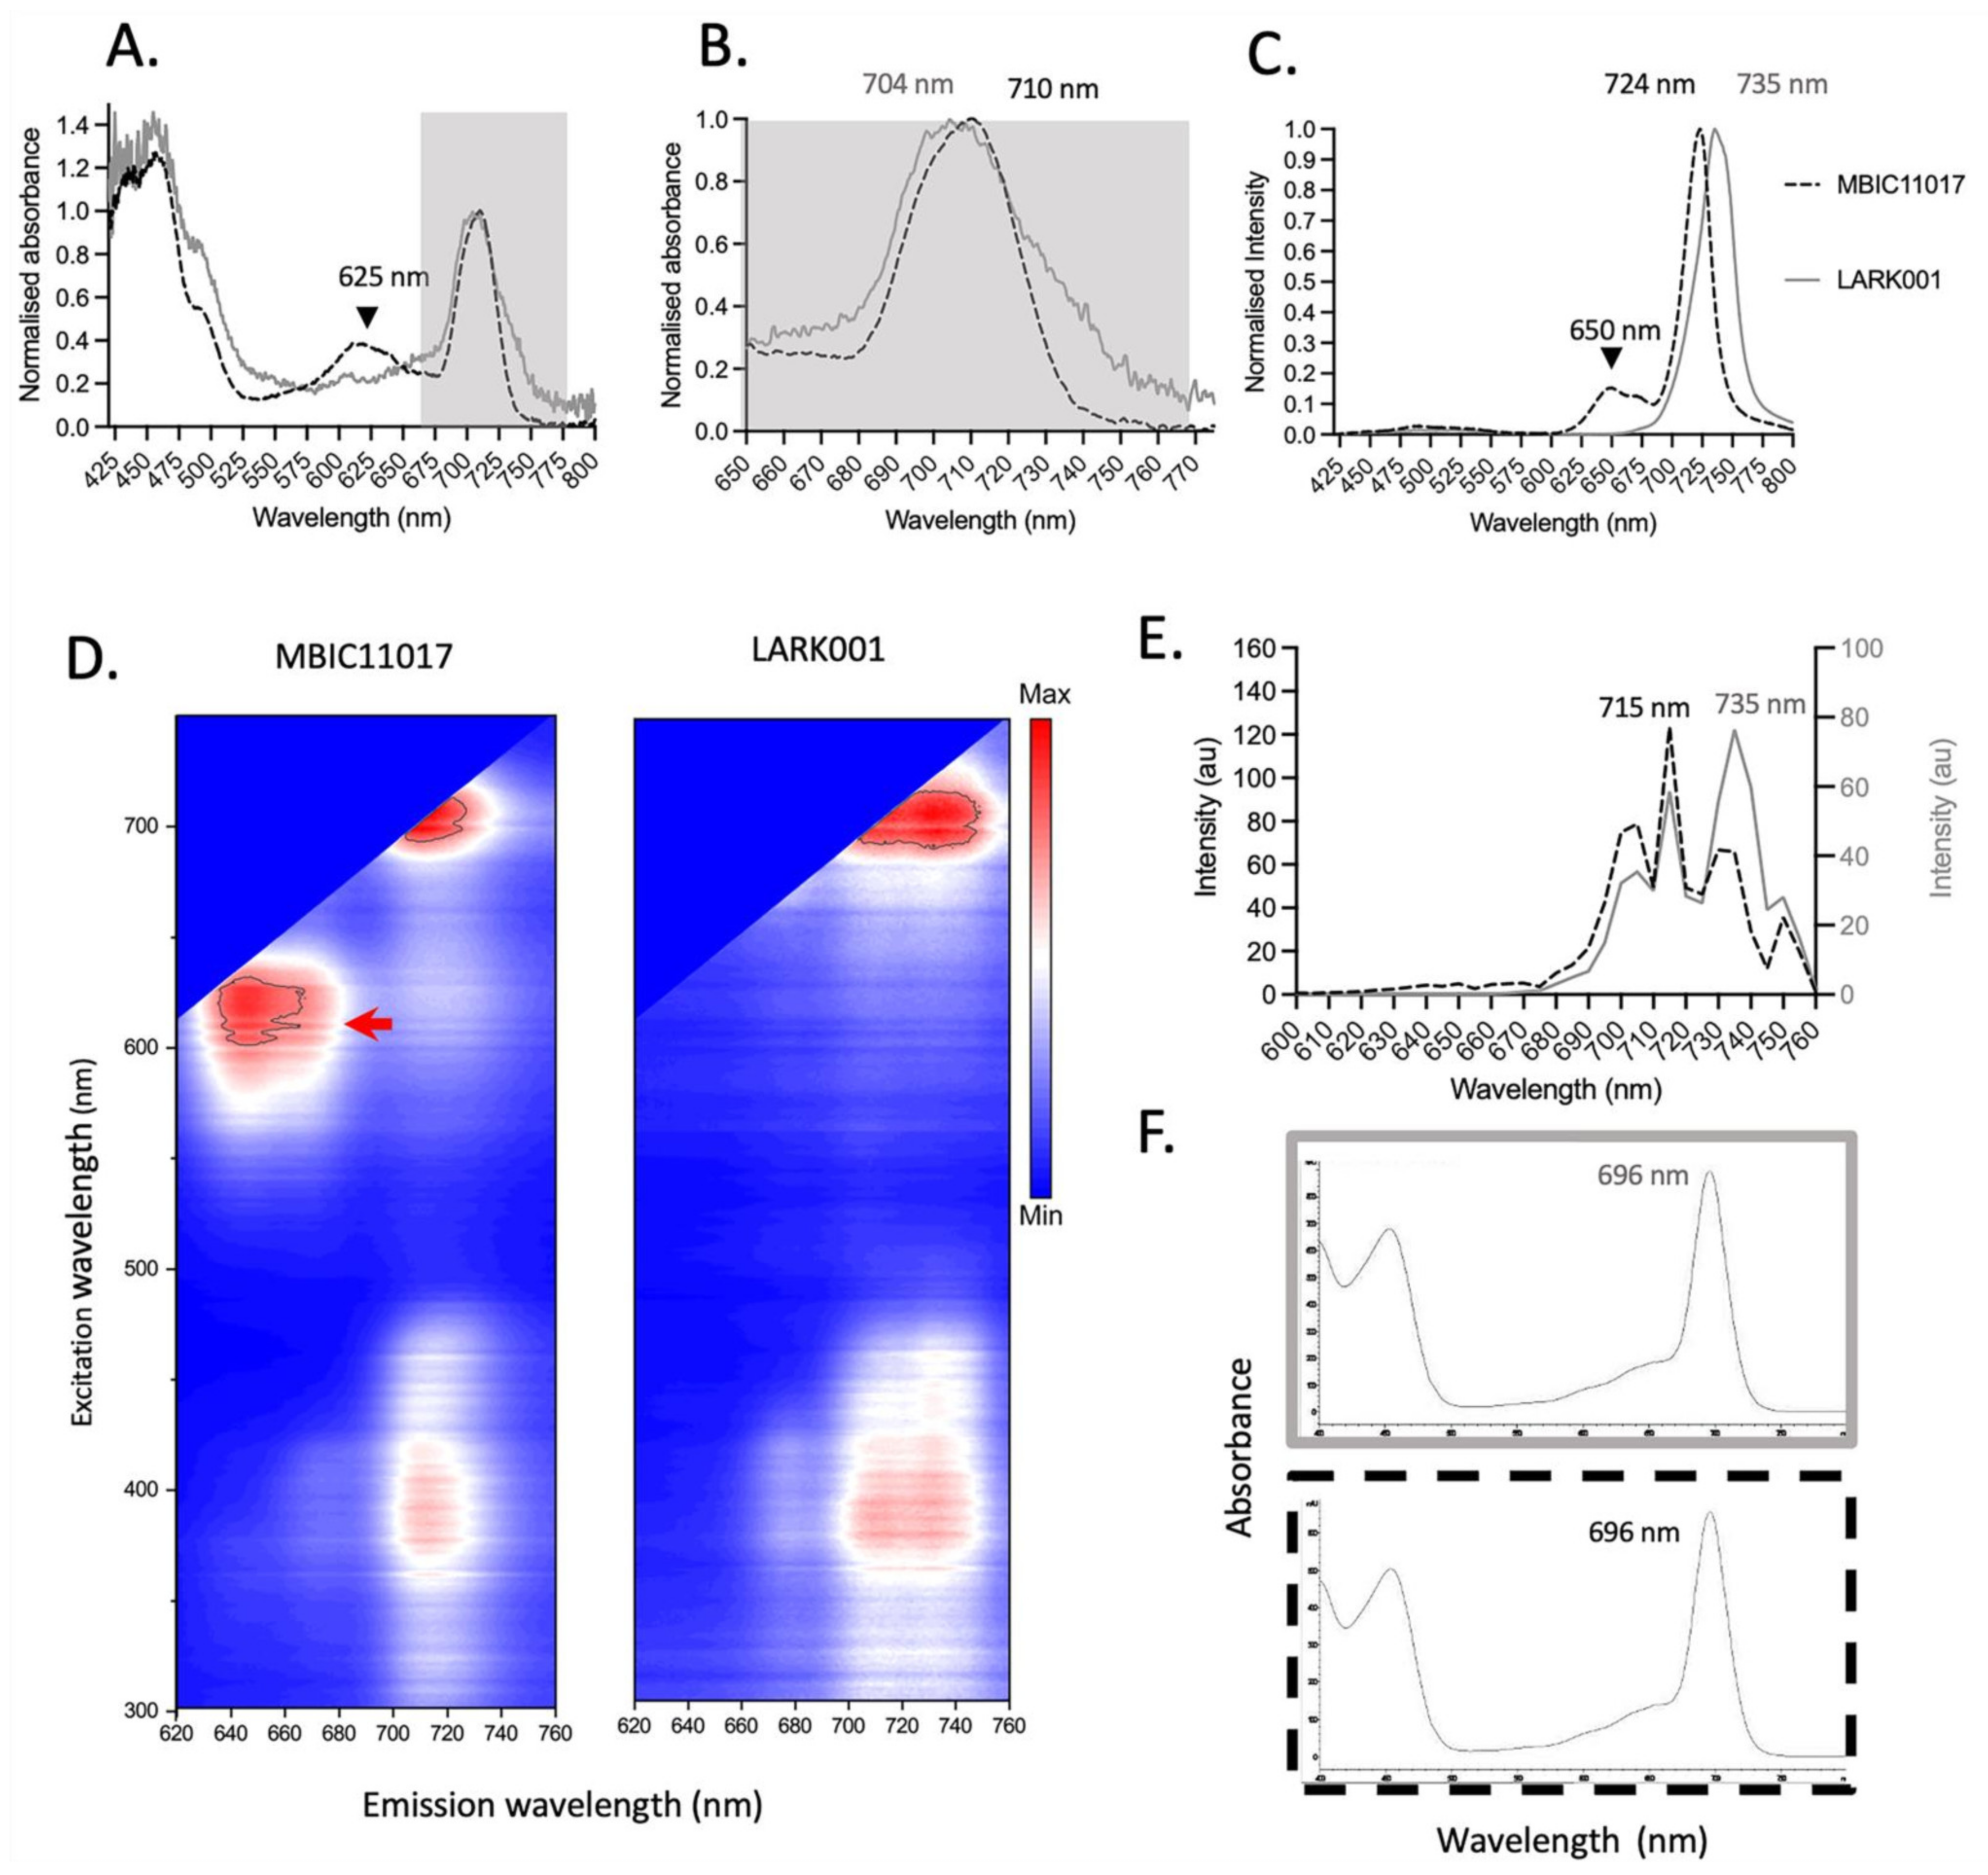
3.4. HPLC Analysis
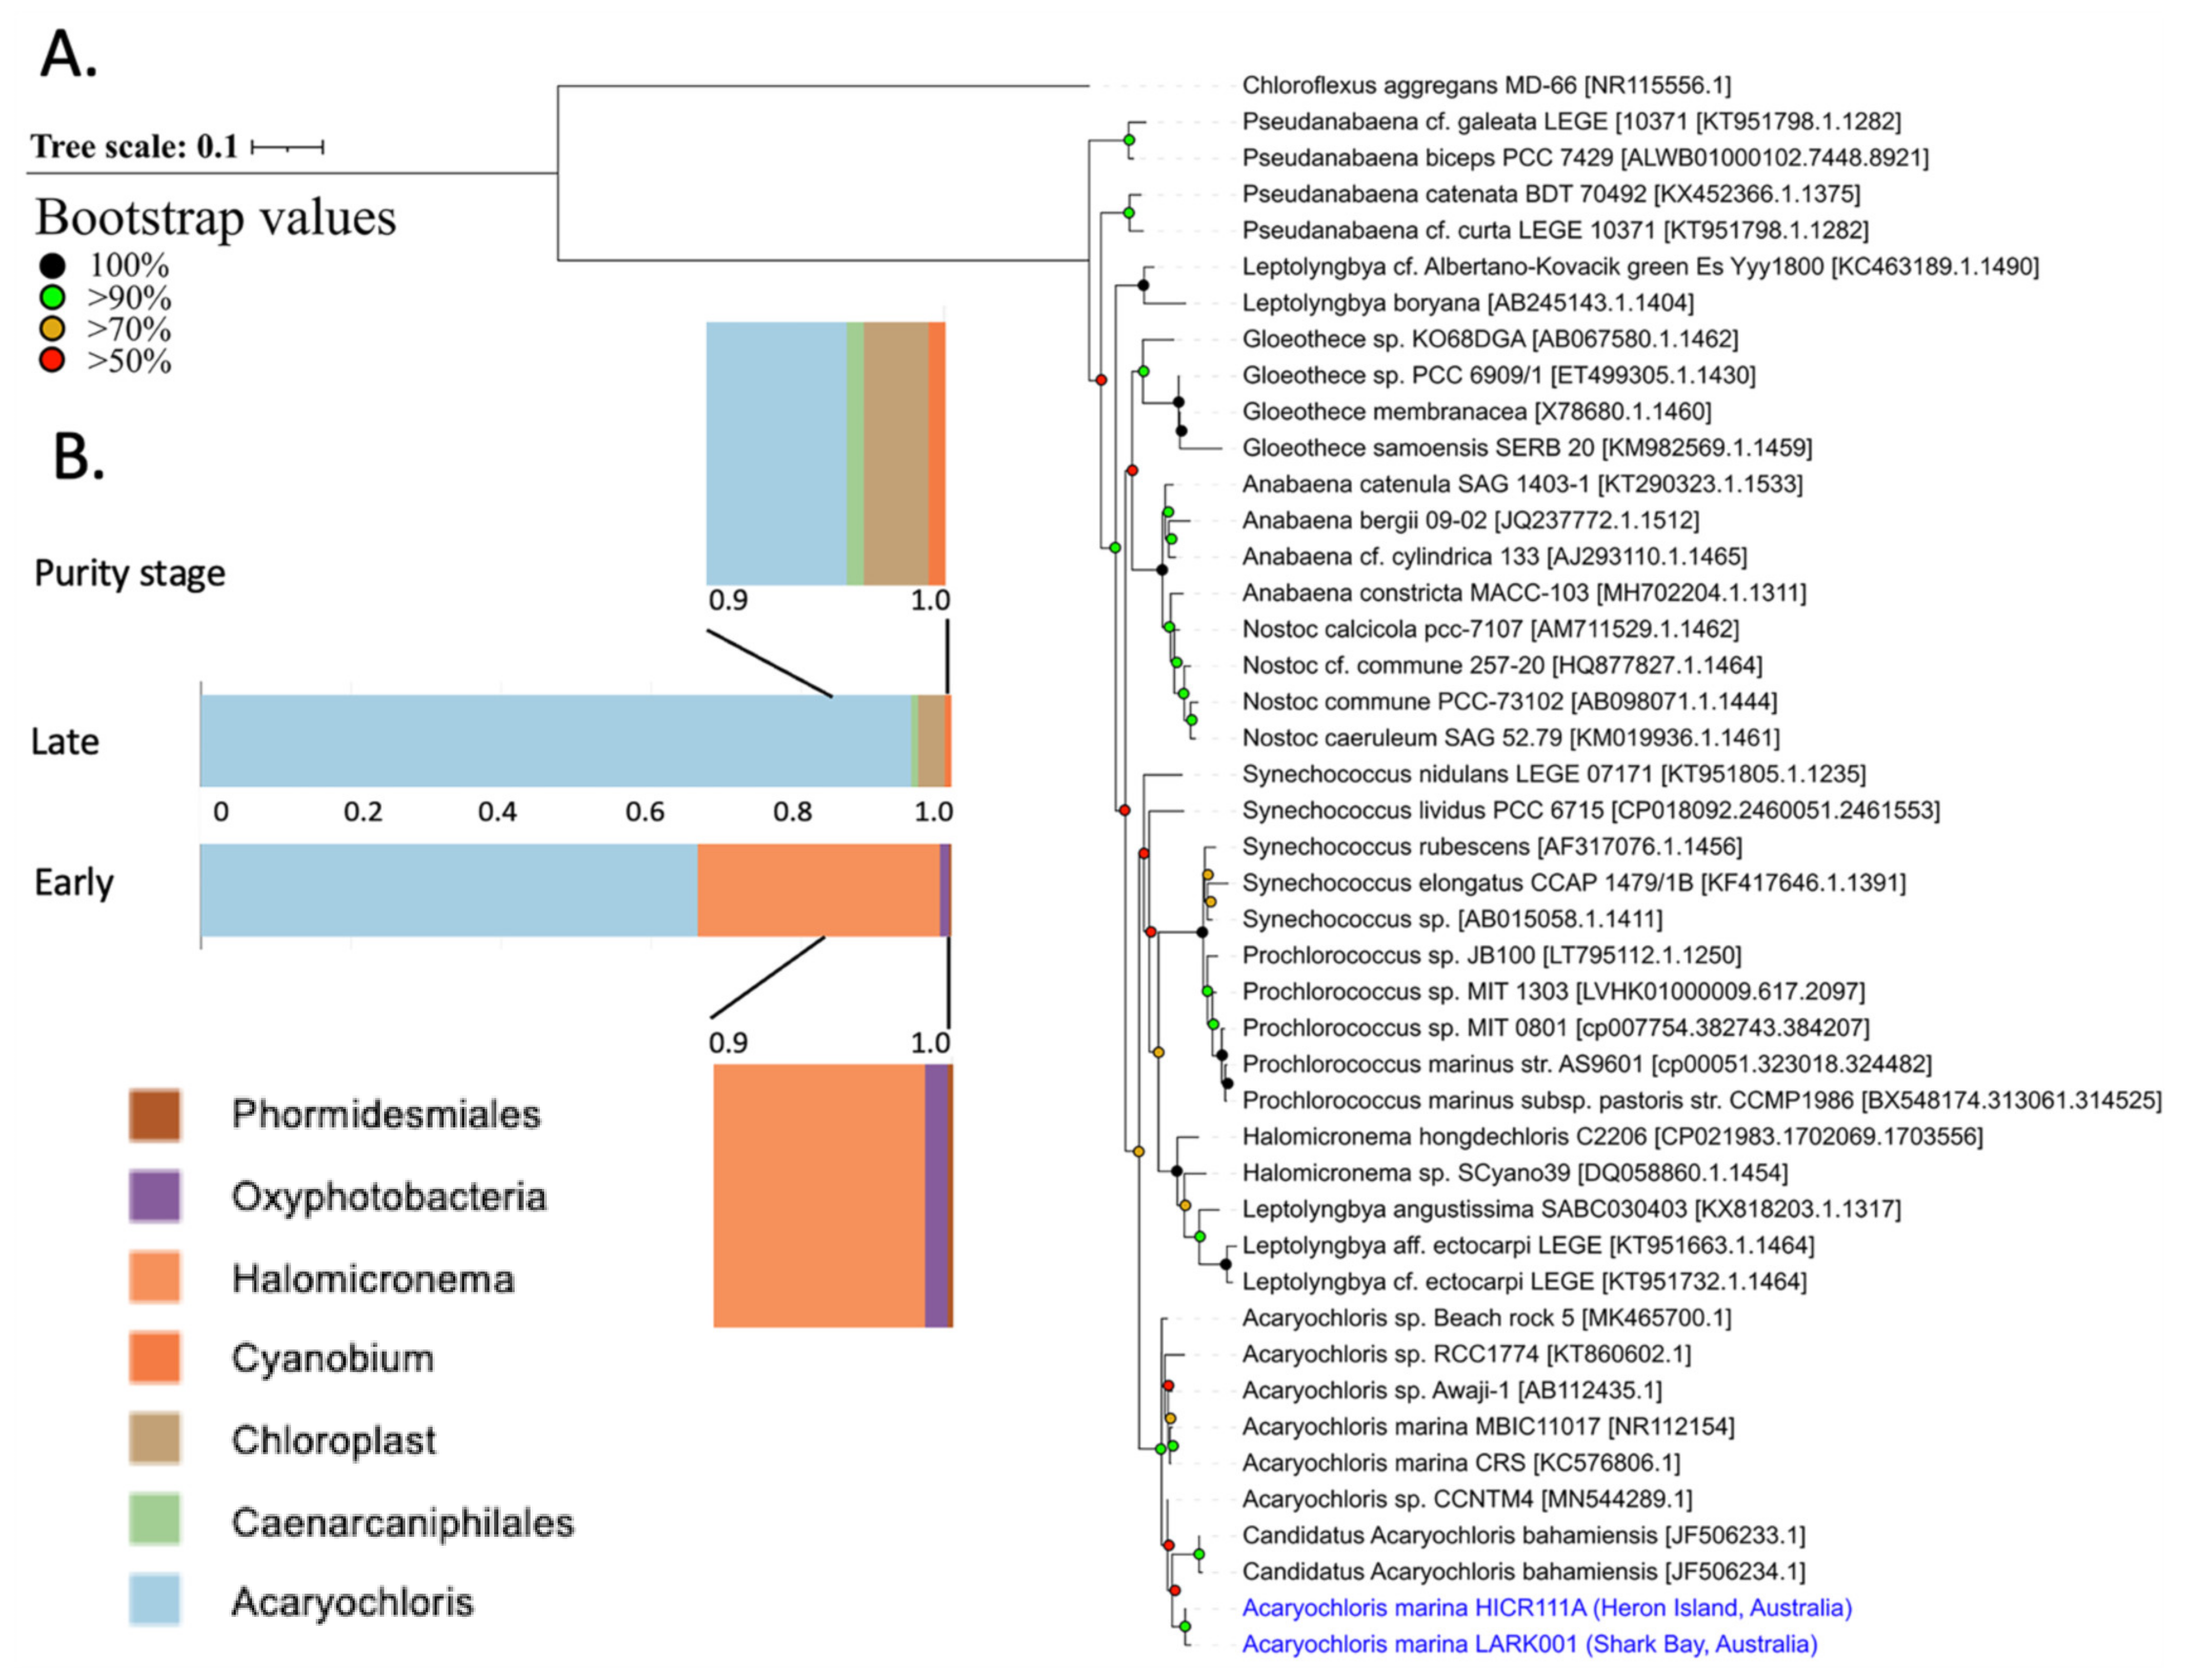
3.5. Sequence Identity
3.6. Spectroscopic Analysis
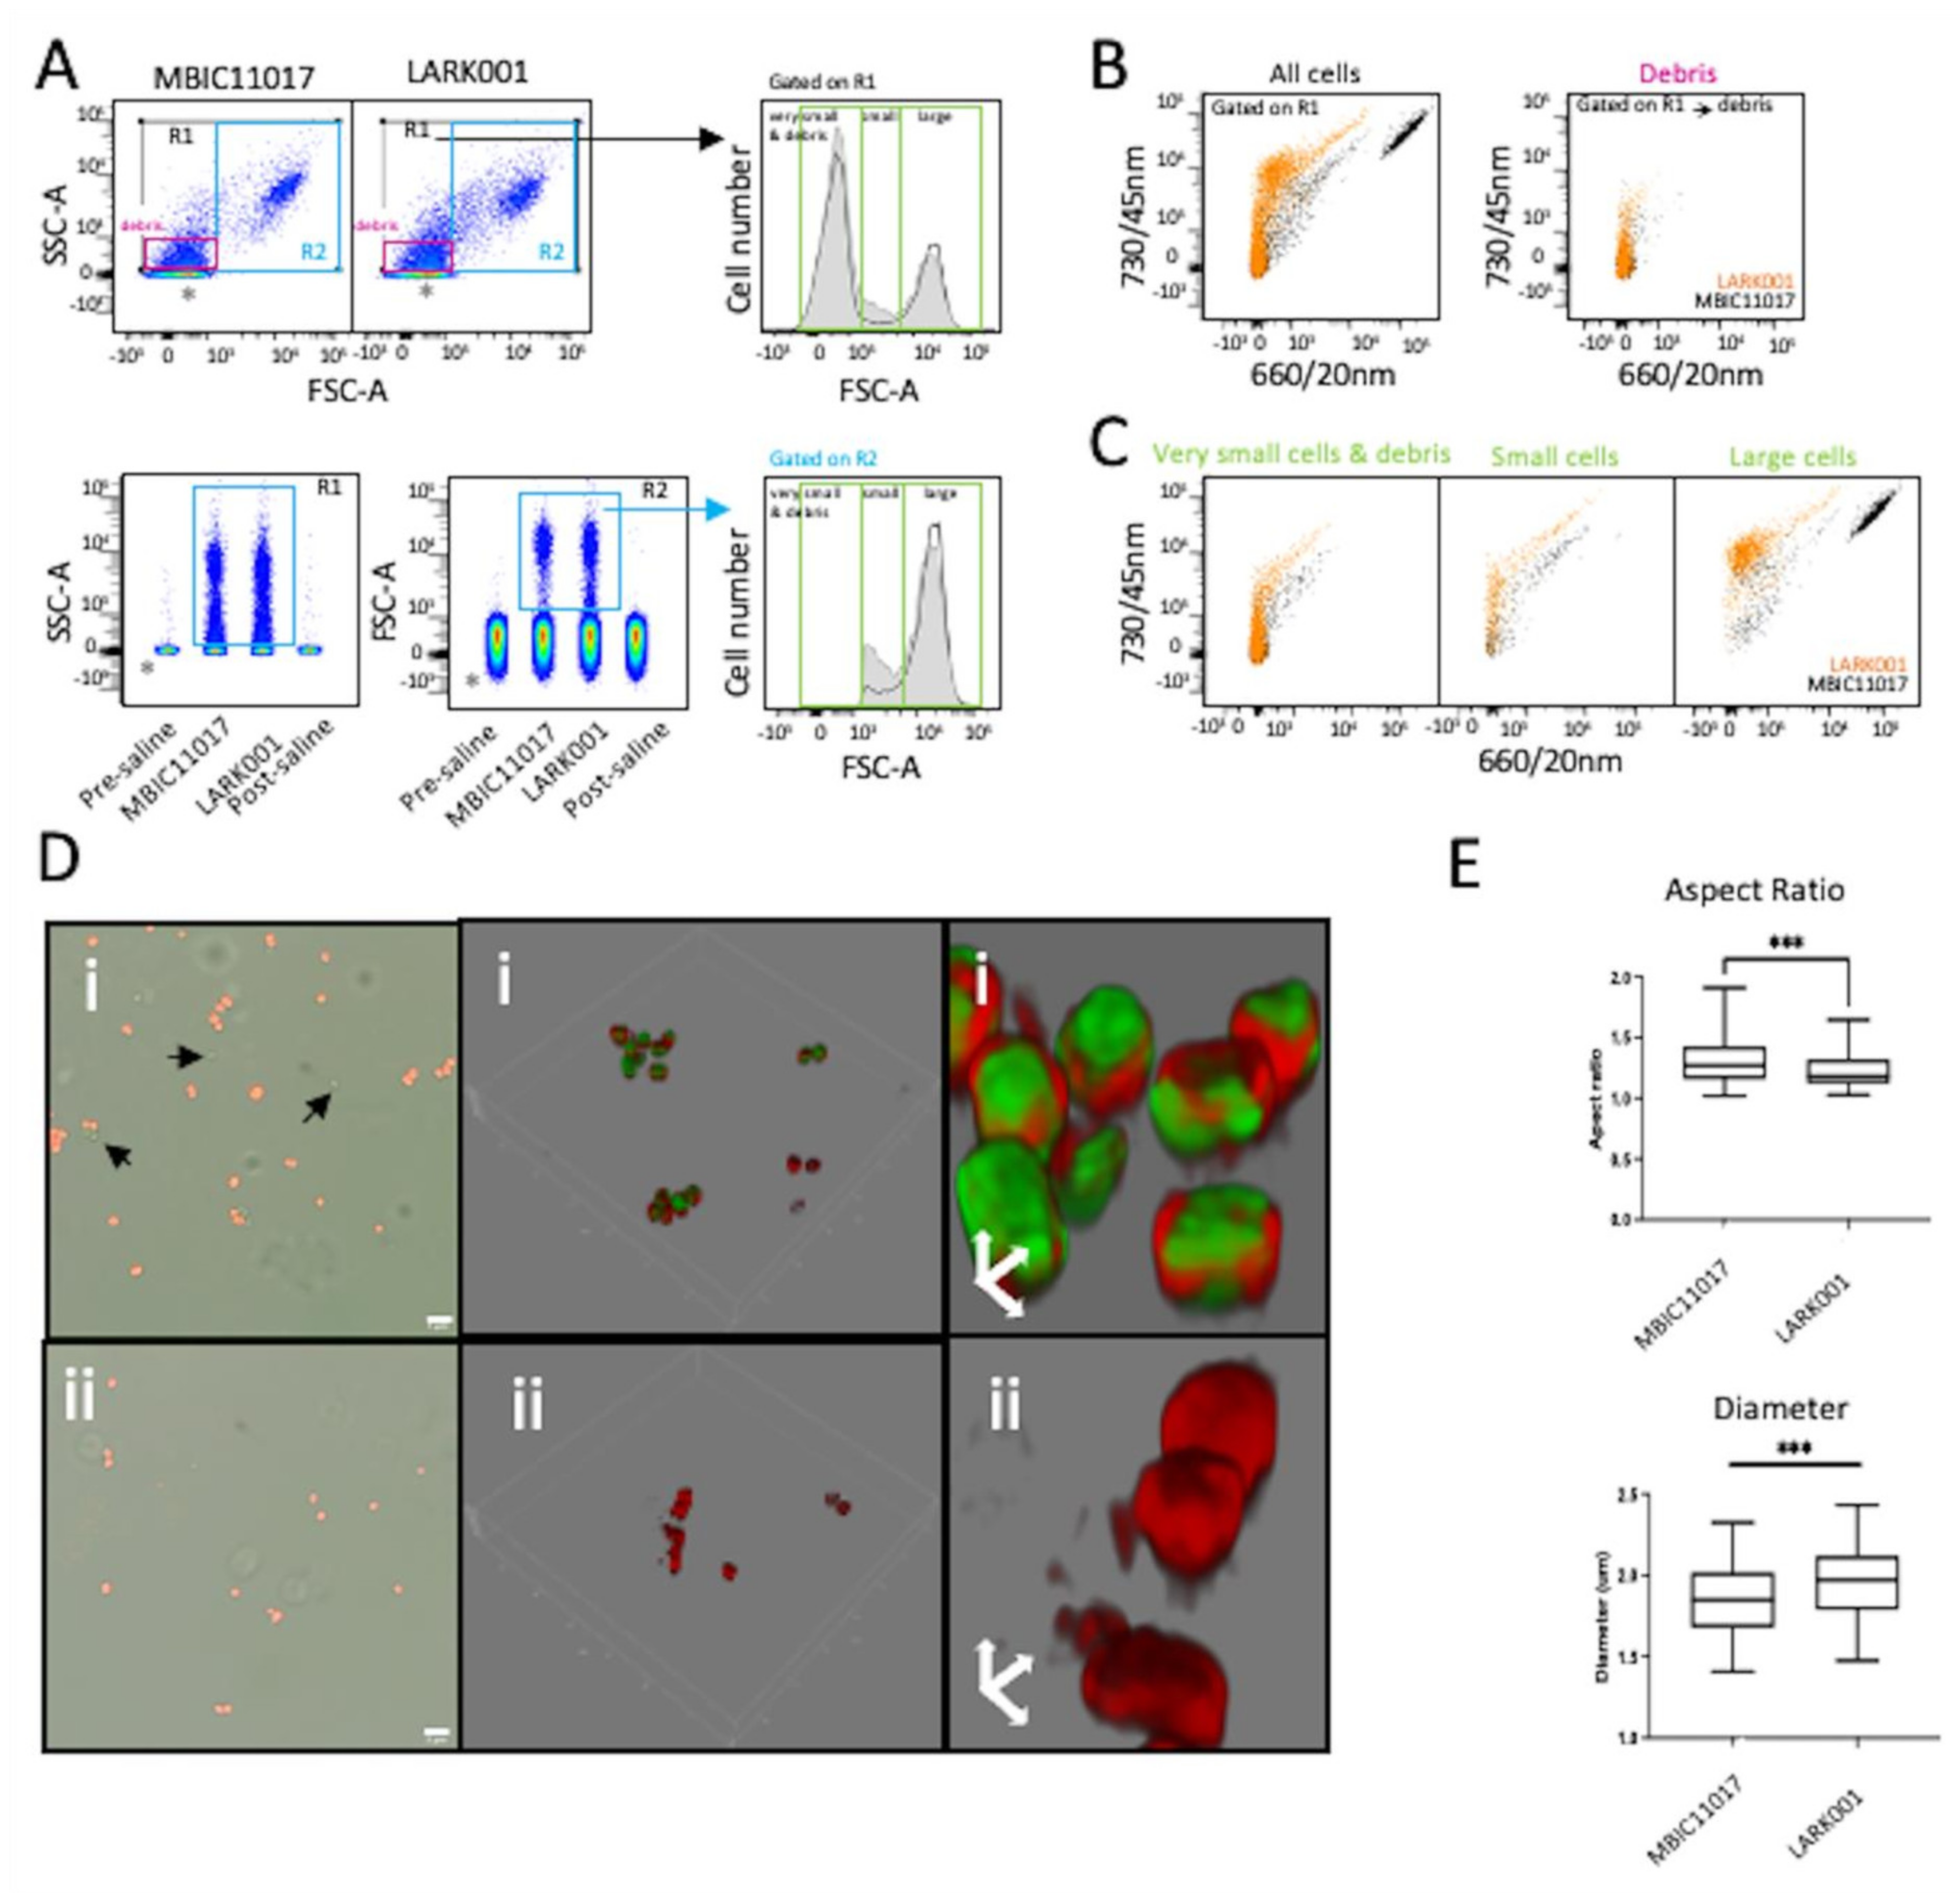
3.7. Flow Cytometry and Morphometric Analysis
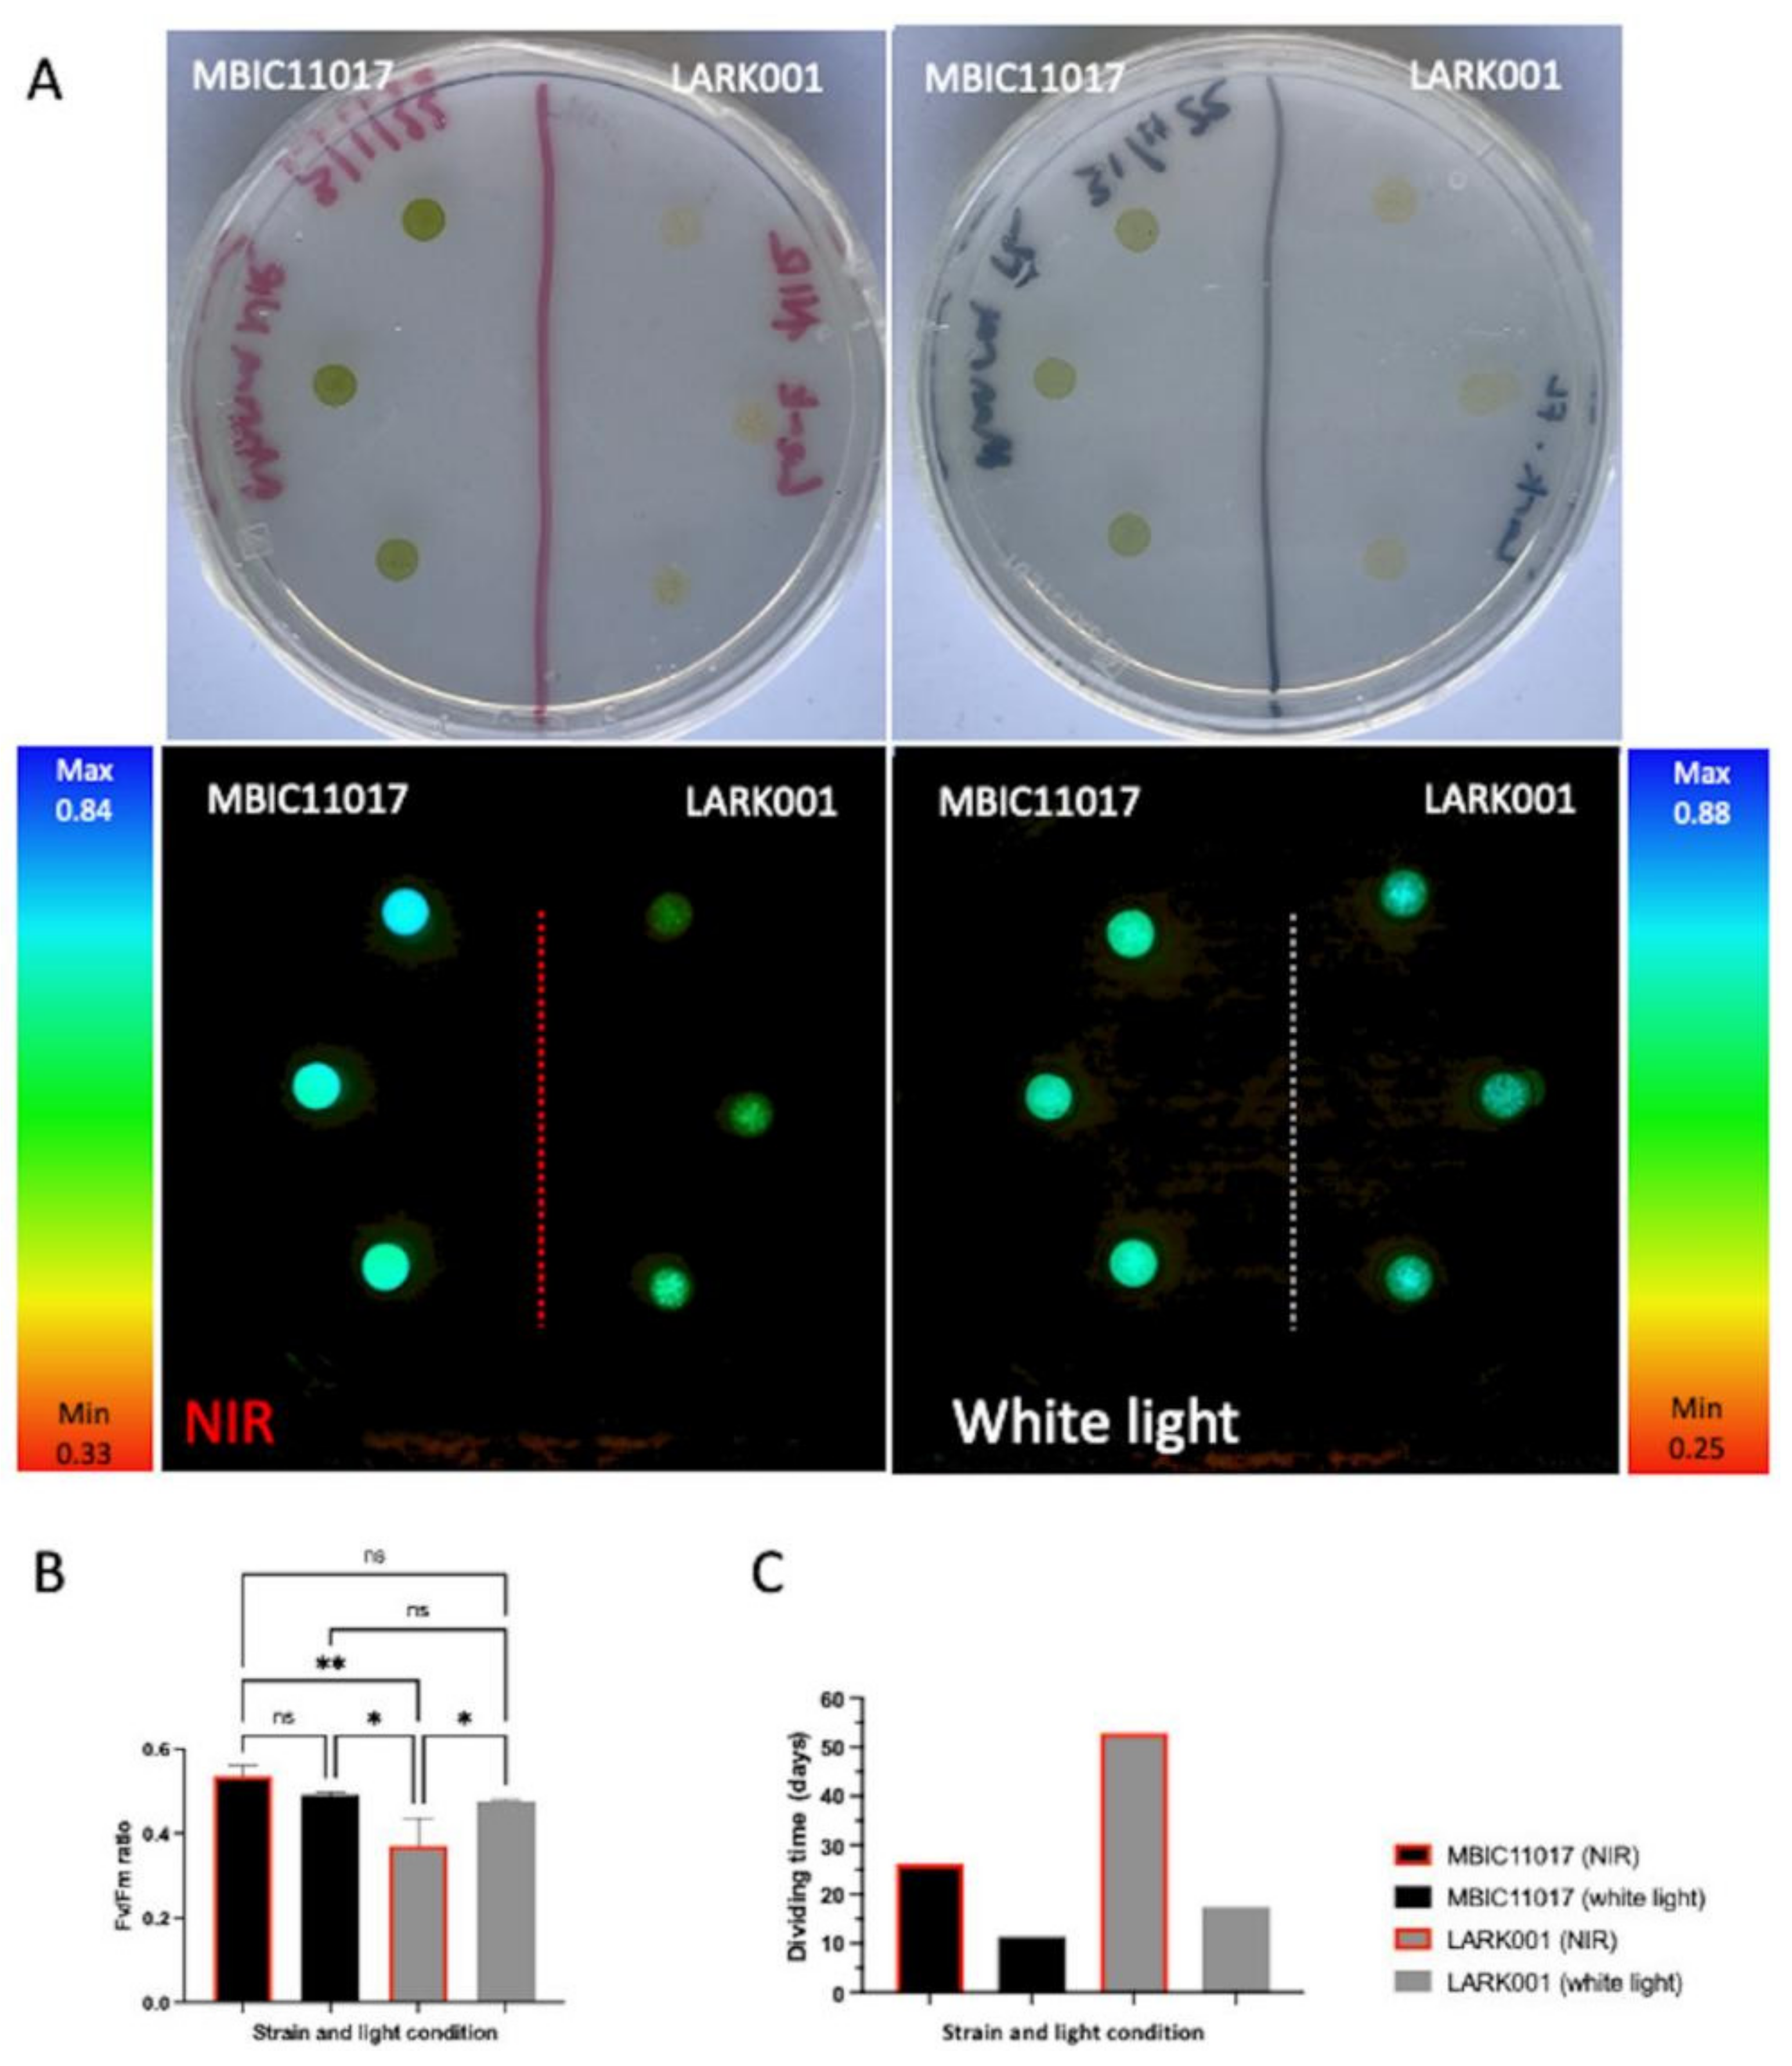
3.8. Fluorometry
4. Discussion
5. Conclusions
Supplementary Materials
Author Contributions
Funding
Informed Consent Statement
Data Availability Statement
Acknowledgments
Conflicts of Interest
References
- Holt, A. Further evidence of the relation between 2-desvinyl-2-formyl-chlorophyll a and chlorophyll d. Can. J. Bot. 1961, 39, 327–331. [Google Scholar] [CrossRef]
- Miyashita, H.; Ikemoto, H.; Kurano, N.; Adachi, K.; Chihara, M.; Miyachi, S. Chlorophyll d as a major pigment. Nature 1996, 383, 402. [Google Scholar] [CrossRef]
- Miyashita, H.; Ikemoto, H.; Kurano, N.; Miyachi, S.; Chihara, M. Acaryochloris marina gen. et sp. Nov. (cyanobacteria), an oxygenic photosynthetic prokaryote containing Chl d as a major pigment. J. Phycol. 2003, 39, 1247–1253. [Google Scholar] [CrossRef]
- Kühl, M.; Chen, M.; Ralph, P.J.; Schreiber, U.; Larkum, A.W. Ecology: A niche for cyanobacteria containing chlorophyll d. Nature 2005, 433, 820. [Google Scholar] [CrossRef] [PubMed]
- Larkum, A.W.; Kühl, M. Chlorophyll d: The puzzle resolved. Trends Plant Sci. 2005, 10, 355–357. [Google Scholar] [CrossRef] [PubMed]
- Murakami, A.; Miyashita, H.; Iseki, M.; Adachi, K.; Mimuro, M. Chlorophyll d in an epiphytic cyanobacterium of red algae. Science 2004, 303, 1633. [Google Scholar] [CrossRef] [PubMed]
- Miller, S.R.; Augustine, S.; Olson, T.L.; Blankenship, R.E.; Selker, J.; Wood, A.M. Discovery of a free-living chlorophyll d-producing cyanobacterium with a hybrid proteobacterial/cyanobacterial small-subunit rRNA gene. Proc. Natl. Acad. Sci. USA 2005, 102, 850–855. [Google Scholar] [CrossRef]
- Mohr, R.; Voss, B.; Schliep, M.; Kurz, T.; Maldener, I.; Adams, D.G.; Larkum, A.D.; Chen, M.; Hess, W.R. A new chlorophyll d-containing cyanobacterium: Evidence for niche adaptation in the genus Acaryochloris. ISME J. 2010, 4, 1456–1469. [Google Scholar] [CrossRef]
- Larkum, A.W.; Chen, M.; Li, Y.; Schliep, M.; Trampe, E.; West, J.; Salih, A.; Kühl, M. A Novel Epiphytic Chlorophyll d-containing Cyanobacterium Isolated from a Mangrove-associated Red Alga. J. Phycol. 2012, 48, 1320–1327. [Google Scholar] [CrossRef]
- Behrendt, L.; Larkum, A.W.; Norman, A.; Qvortrup, K.; Chen, M.; Ralph, P.; Sorensen, S.J.; Trampe, E.; Kühl, M. Endolithic chlorophyll d-containing phototrophs. ISME J. 2011, 5, 1072–1076. [Google Scholar] [CrossRef]
- Goh, F.; Allen, M.A.; Leuko, S.; Kawaguchi, T.; Decho, A.W.; Burns, B.P.; Neilan, B.A. Determining the specific microbial populations and their spatial distribution within the stromatolite ecosystem of Shark Bay. ISME J. 2009, 3, 383–396. [Google Scholar] [CrossRef] [PubMed]
- Loughlin, P.; Lin, Y.; Chen, M. Chlorophyll d and Acaryochloris marina: Current status. Photosynth. Res. 2013, 116, 277–293. [Google Scholar] [CrossRef] [PubMed]
- De los Rios, A.; Grube, M.; Sancho, L.G.; Ascaso, C. Ultrastructural and genetic characteristics of endolithic cyanobacterial biofilms colonizing Antarctic granite rocks. FEMS Microbiol. Ecol. 2007, 59, 386–395. [Google Scholar] [CrossRef] [PubMed]
- Airs, R.L.; Temperton, B.; Sambles, C.; Farnham, G.; Skill, S.C.; Llewellyn, C.A. Chlorophyll f and chlorophyll d are produced in the cyanobacterium Chlorogloeopsis fritschii when cultured under natural light and near-infrared radiation. FEBS Lett. 2014, 588, 3770–3777. [Google Scholar] [CrossRef]
- Averina, S.; Velichko, N.; Senatskaya, E.; Pinevich, A. Far-red light photoadaptations in aquatic cyanobacteria. Hydrobiologia 2018, 813, 1–17. [Google Scholar] [CrossRef]
- Ho, M.Y.; Bryant, D.A. Global Transcriptional Profiling of the Cyanobacterium Chlorogloeopsis fritschii PCC 9212 in Far-Red Light: Insights into the Regulation of Chlorophyll d Synthesis. Front. Microbiol. 2019, 10, 465. [Google Scholar] [CrossRef]
- Ho, M.Y.; Shen, G.; Canniffe, D.P.; Zhao, C.; Bryant, D.A. Light-dependent chlorophyll f synthase is a highly divergent paralog of PsbA of photosystem II. Science 2016, 353, aaf9178. [Google Scholar] [CrossRef]
- Ho, M.Y.; Soulier, N.T.; Canniffe, D.P.; Shen, G.; Bryant, D.A. Light regulation of pigment and photosystem biosynthesis in cyanobacteria. Curr. Opin. Plant Biol. 2017, 37, 24–33. [Google Scholar] [CrossRef]
- Miyashita, H.; Ohkubo, S.; Komatsu, H.; Sorimachi, Y.; Fukayama, D.; Fujinuma, D.; Akutsu, S.; Kobayashi, M. Discovery of chlorophyll d in Acaryochloris marina and chlorophyll f in a unicellular cyanobacterium, strain KC1, isolated from Lake Biwa. J. Phys. Chem. Biophys. 2014, 4, 1. [Google Scholar] [CrossRef]
- Nürnberg, D.J.; Morton, J.; Santabarbara, S.; Telfer, A.; Joliot, P.; Antonaru, L.A.; Ruban, A.V.; Cardona, T.; Krausz, E.; Boussac, A.; et al. Photochemistry beyond the red limit in chlorophyll f-containing photosystems. Science 2018, 360, 1210–1213. [Google Scholar] [CrossRef]
- McNamara, C.J.; Perry, T.D.; Bearce, K.A.; Hernandez-Duque, G.; Mitchell, R. Epilithic and endolithic bacterial communities in limestone from a Maya archaeological site. Microb. Ecol. 2006, 51, 51–64. [Google Scholar] [CrossRef] [PubMed]
- Partensky, F.; Six, C.; Ratin, M.; Garczarek, L.; Vaulot, D.; Probert, I.; Calteau, A.; Gourvil, P.; Marie, D.; Grebert, T.; et al. A novel species of the marine cyanobacterium Acaryochloris with a unique pigment content and lifestyle. Sci. Rep. 2018, 8, 9142. [Google Scholar] [CrossRef] [PubMed]
- Swingley, W.D.; Chen, M.; Cheung, P.C.; Conrad, A.L.; Dejesa, L.C.; Hao, J.; Honchak, B.M.; Karbach, L.E.; Kurdoglu, A.; Lahiri, S.; et al. Niche adaptation and genome expansion in the chlorophyll d-producing cyanobacterium Acaryochloris marina. Proc. Natl. Acad. Sci. USA 2008, 105, 2005–2010. [Google Scholar] [CrossRef] [PubMed]
- Fisher, A.; Wangpraseurt, D.; Larkum, A.W.D.; Johnson, M.; Kuhl, M.; Chen, M.; Wong, H.L.; Burns, B.P. Correlation of bio-optical properties with photosynthetic pigment and microorganism distribution in microbial mats from Hamelin Pool, Australia. FEMS Microbiol. Ecol. 2019, 95, fiy219. [Google Scholar] [CrossRef]
- Ruvindy, R.; White III, R.A.; Neilan, B.A.; Burns, B.P. Unravelling core microbial metabolisms in the hypersaline microbial mats of Shark Bay using high-throughput metagenomics. ISME J. 2016, 10, 183–196. [Google Scholar] [CrossRef]
- Wong, H.L.; Smith, D.-L.; Visscher, P.T.; Burns, B.P. Niche differentiation of bacterial communities at a millimeter scale in Shark Bay microbial mats. Sci. Rep. 2015, 5, 15607. [Google Scholar] [CrossRef]
- Wong, H.L.; Visscher, P.T.; White III, R.A.; Smith, D.-L.; Patterson, M.M.; Burns, B.P. Dynamics of archaea at fine spatial scales in Shark Bay mat microbiomes. Sci. Rep. 2017, 7, 1–12. [Google Scholar] [CrossRef]
- Wong, H.L.; White, R.A.; Visscher, P.T.; Charlesworth, J.C.; Vázquez-Campos, X.; Burns, B.P. Disentangling the drivers of functional complexity at the metagenomic level in Shark Bay microbial mat microbiomes. ISME J. 2018, 12, 2619–2639. [Google Scholar] [CrossRef]
- Schindelin, J.; Arganda-Carreras, I.; Frise, E.; Kaynig, V.; Longair, M.; Pietzsch, T.; Preibisch, S.; Rueden, C.; Saalfeld, S.; Schmid, B.; et al. Fiji: An open-source platform for biological-image analysis. Nat. Methods 2012, 9, 676–682. [Google Scholar] [CrossRef]
- Herdean, A.; Hall, C.C.; Pham, L.L.; Macdonald Miller, S.; Pernice, M.; Ralph, P.J. Action Spectra and Excitation Emission Matrices reveal the broad range of usable photosynthetic active radiation for Phaeodactylum tricornutum. Biochim. Biophys. Acta Bioenerg. 2021, 1862, 148461. [Google Scholar] [CrossRef]
- Van Heukelem, L.; Thomas, C.S. Computer-assisted high-performance liquid chromatography method development with applications to the isolation and analysis of phytoplankton pigments. J. Chromatogr. A 2001, 910, 31–49. [Google Scholar] [CrossRef]
- Schloss, P.D.; Westcott, S.L.; Ryabin, T.; Hall, J.R.; Hartmann, M.; Hollister, E.B.; Lesniewski, R.A.; Oakley, B.B.; Parks, D.H.; Robinson, C.J.; et al. Introducing mothur: Open-source, platform-independent, community-supported software for describing and comparing microbial communities. Appl. Environ. Microbiol. 2009, 75, 7537–7541. [Google Scholar] [CrossRef] [PubMed]
- Quast, C.; Pruesse, E.; Yilmaz, P.; Gerken, J.; Schweer, T.; Yarza, P.; Peplies, J.; Glockner, F.O. The SILVA ribosomal RNA gene database project: Improved data processing and web-based tools. Nucleic Acids Res. 2013, 41, D590–D596. [Google Scholar] [CrossRef] [PubMed]
- Katoh, K.; Standley, D.M. MAFFT multiple sequence alignment software version 7: Improvements in performance and usability. Mol. Biol. Evol. 2013, 30, 772–780. [Google Scholar] [CrossRef]
- Letunic, I.; Bork, P. Interactive Tree of Life (iTOL) v4: Recent updates and new developments. Nucleic Acids Res. 2019, 47, W256–W259. [Google Scholar] [CrossRef]
- Hill, R.; Schreiber, U.; Gademann, R.; Larkum, A.; Kühl, M.; Ralph, P. Spatial heterogeneity of photosynthesis and the effect of temperature-induced bleaching conditions in three species of corals. Mar. Biol. 2004, 144, 633–640. [Google Scholar] [CrossRef]
- Soo, R.M.; Skennerton, C.T.; Sekiguchi, Y.; Imelfort, M.; Paech, S.J.; Dennis, P.G.; Steen, J.A.; Parks, D.H.; Tyson, G.W.; Hugenholtz, P. An expanded genomic representation of the phylum cyanobacteria. Genome Biol. Evol. 2014, 6, 1031–1045. [Google Scholar] [CrossRef] [PubMed]
- Suosaari, E.P.; Reid, R.P.; Playford, P.E.; Foster, J.S.; Stolz, J.F.; Casaburi, G.; Hagan, P.D.; Chirayath, V.; Macintyre, I.G.; Planavsky, N.J.; et al. New multi-scale perspectives on the stromatolites of Shark Bay, Western Australia. Sci. Rep. 2016, 6, 20557. [Google Scholar] [CrossRef]


Publisher’s Note: MDPI stays neutral with regard to jurisdictional claims in published maps and institutional affiliations. |
© 2022 by the authors. Licensee MDPI, Basel, Switzerland. This article is an open access article distributed under the terms and conditions of the Creative Commons Attribution (CC BY) license (https://creativecommons.org/licenses/by/4.0/).
Share and Cite
Johnson, M.S.; Burns, B.P.; Herdean, A.; Angeloski, A.; Ralph, P.; Morris, T.; Kindler, G.; Wong, H.L.; Kuzhiumparambil, U.; Sedger, L.M.; et al. A Cyanobacteria Enriched Layer of Shark Bay Stromatolites Reveals a New Acaryochloris Strain Living in Near Infrared Light. Microorganisms 2022, 10, 1035. https://doi.org/10.3390/microorganisms10051035
Johnson MS, Burns BP, Herdean A, Angeloski A, Ralph P, Morris T, Kindler G, Wong HL, Kuzhiumparambil U, Sedger LM, et al. A Cyanobacteria Enriched Layer of Shark Bay Stromatolites Reveals a New Acaryochloris Strain Living in Near Infrared Light. Microorganisms. 2022; 10(5):1035. https://doi.org/10.3390/microorganisms10051035
Chicago/Turabian StyleJohnson, Michael S., Brendan P. Burns, Andrei Herdean, Alexander Angeloski, Peter Ralph, Therese Morris, Gareth Kindler, Hon Lun Wong, Unnikrishnan Kuzhiumparambil, Lisa M. Sedger, and et al. 2022. "A Cyanobacteria Enriched Layer of Shark Bay Stromatolites Reveals a New Acaryochloris Strain Living in Near Infrared Light" Microorganisms 10, no. 5: 1035. https://doi.org/10.3390/microorganisms10051035