In-situ X-ray Differential Micro-tomography for Investigation of Water-weakening in Quasi-brittle Materials Subjected to Four-point Bending

 , , , , and
Abstract
:
1. Introduction
2. Materials and Methods
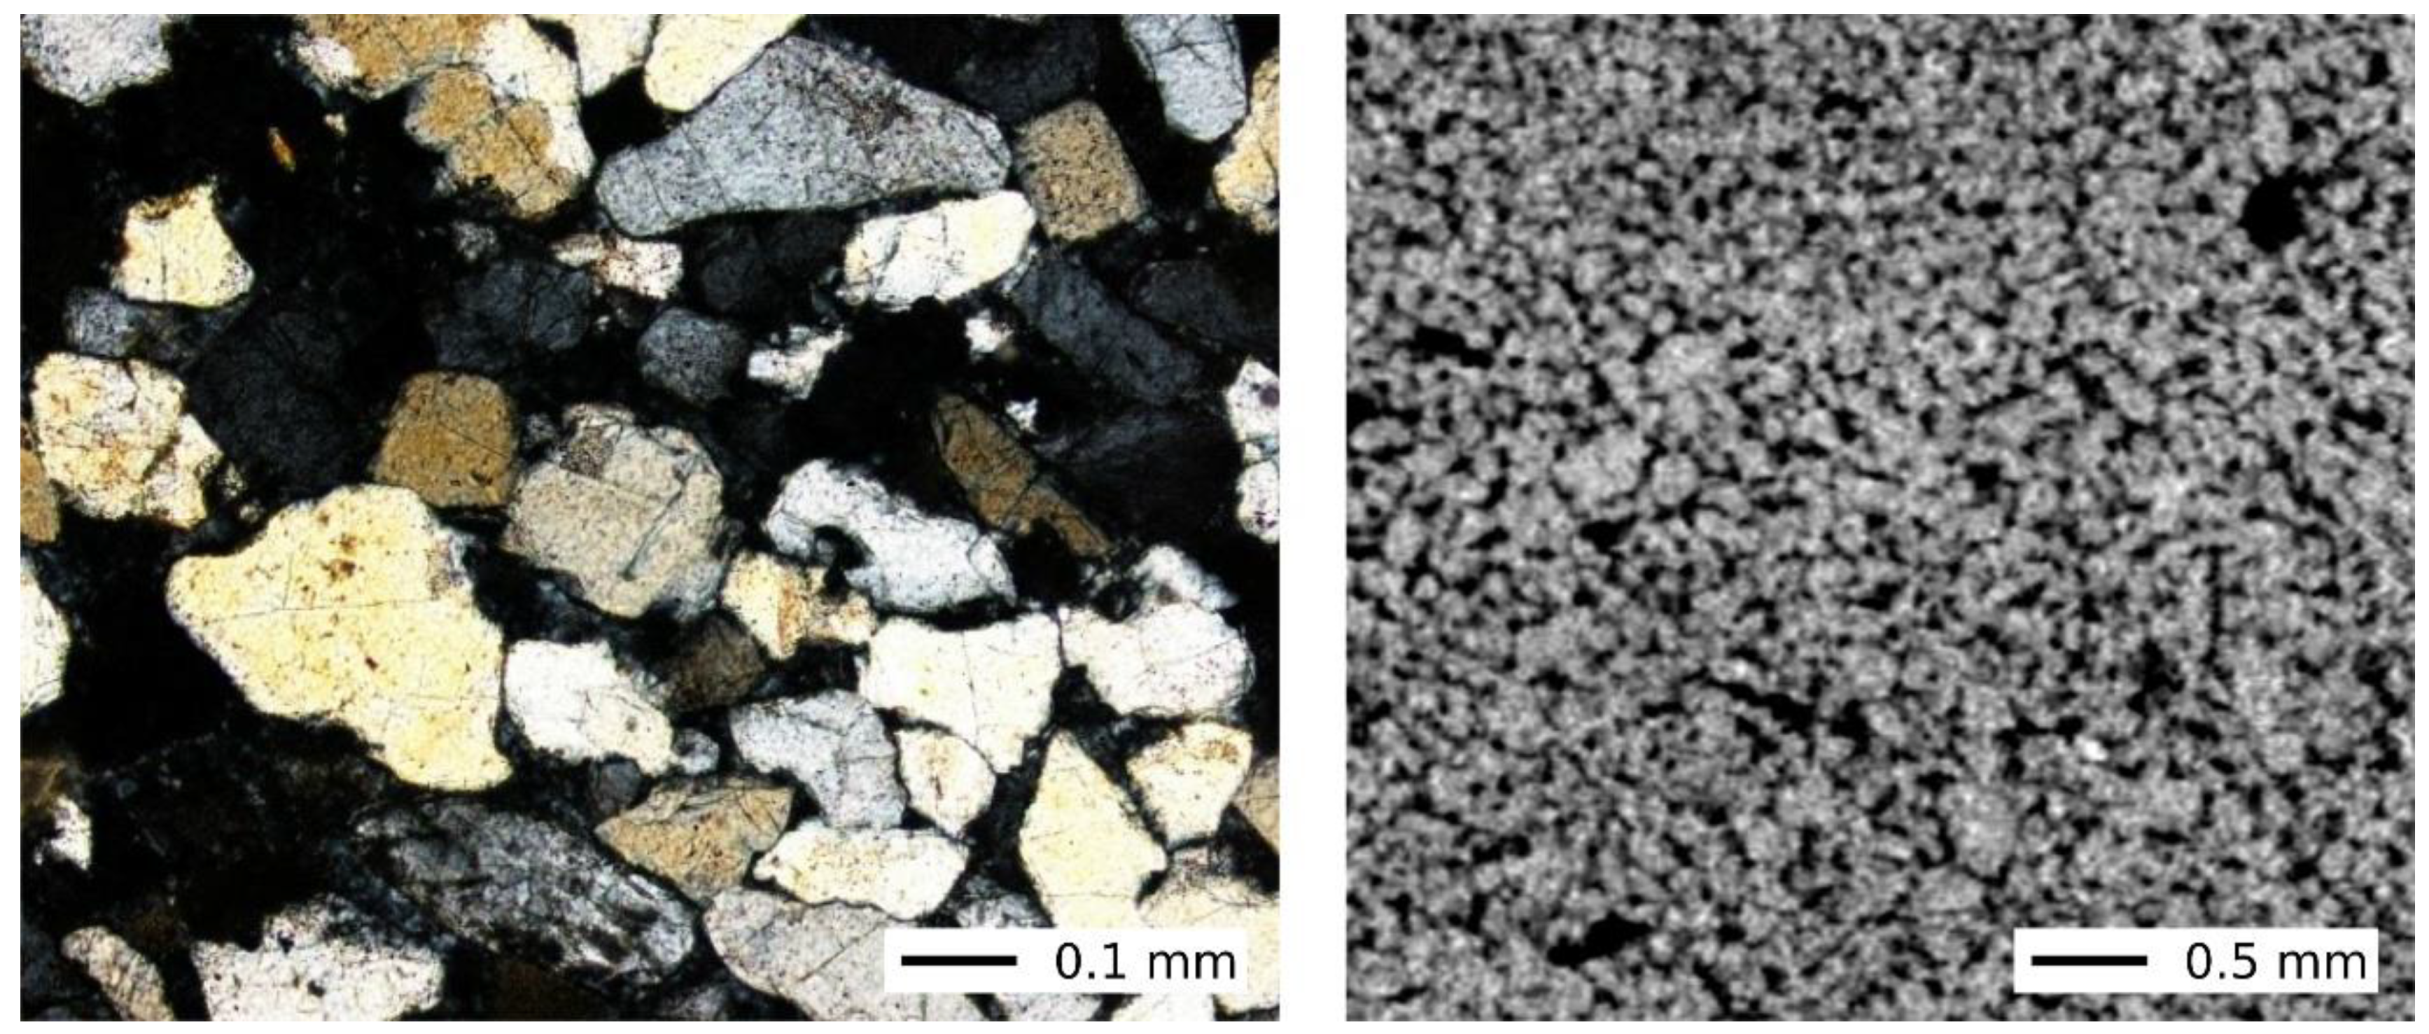
2.1. Basic Characterisation of Mšené Sandstone
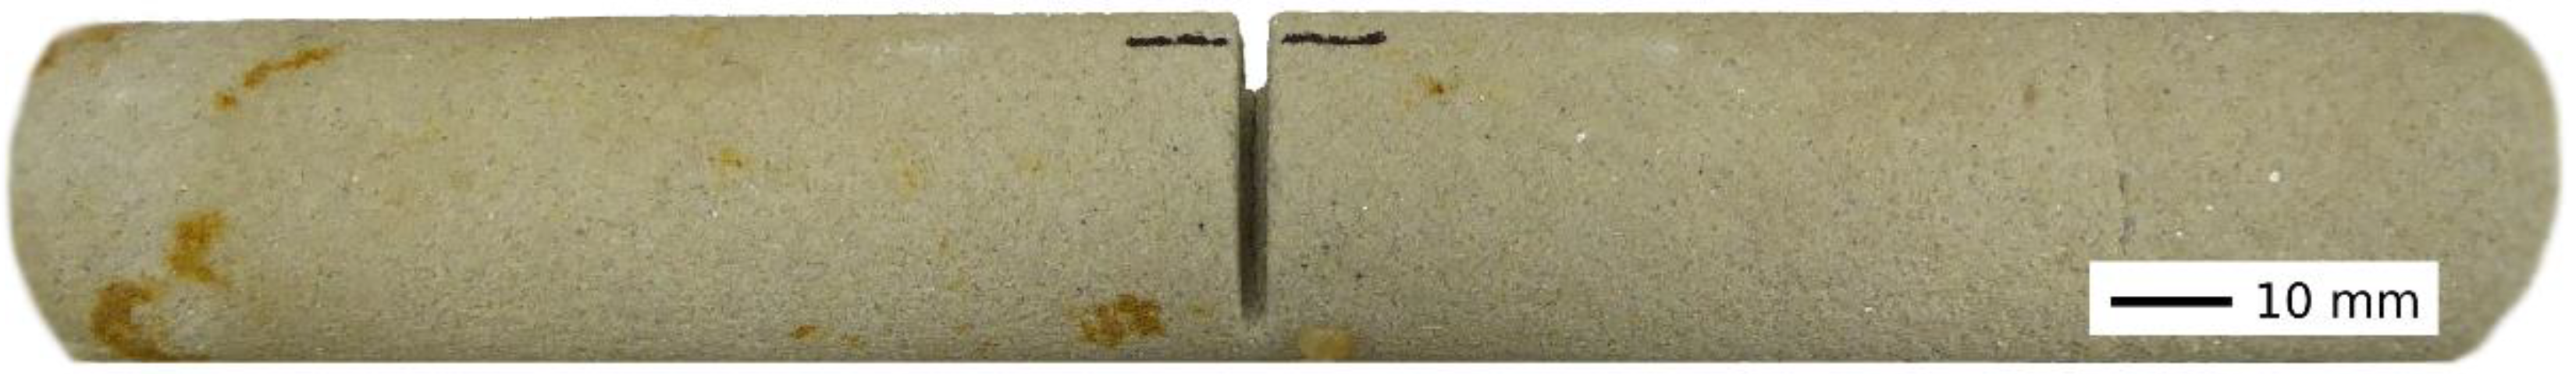
2.2. Specimens
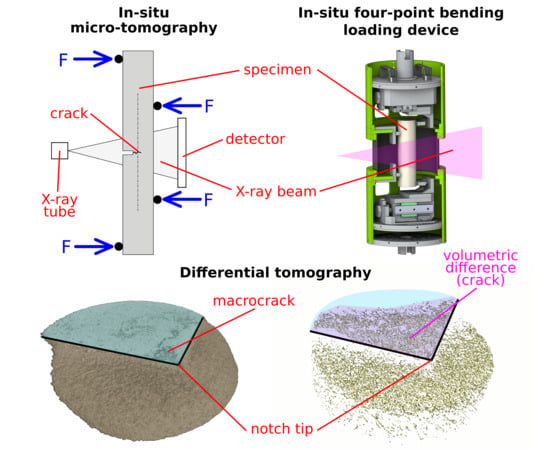
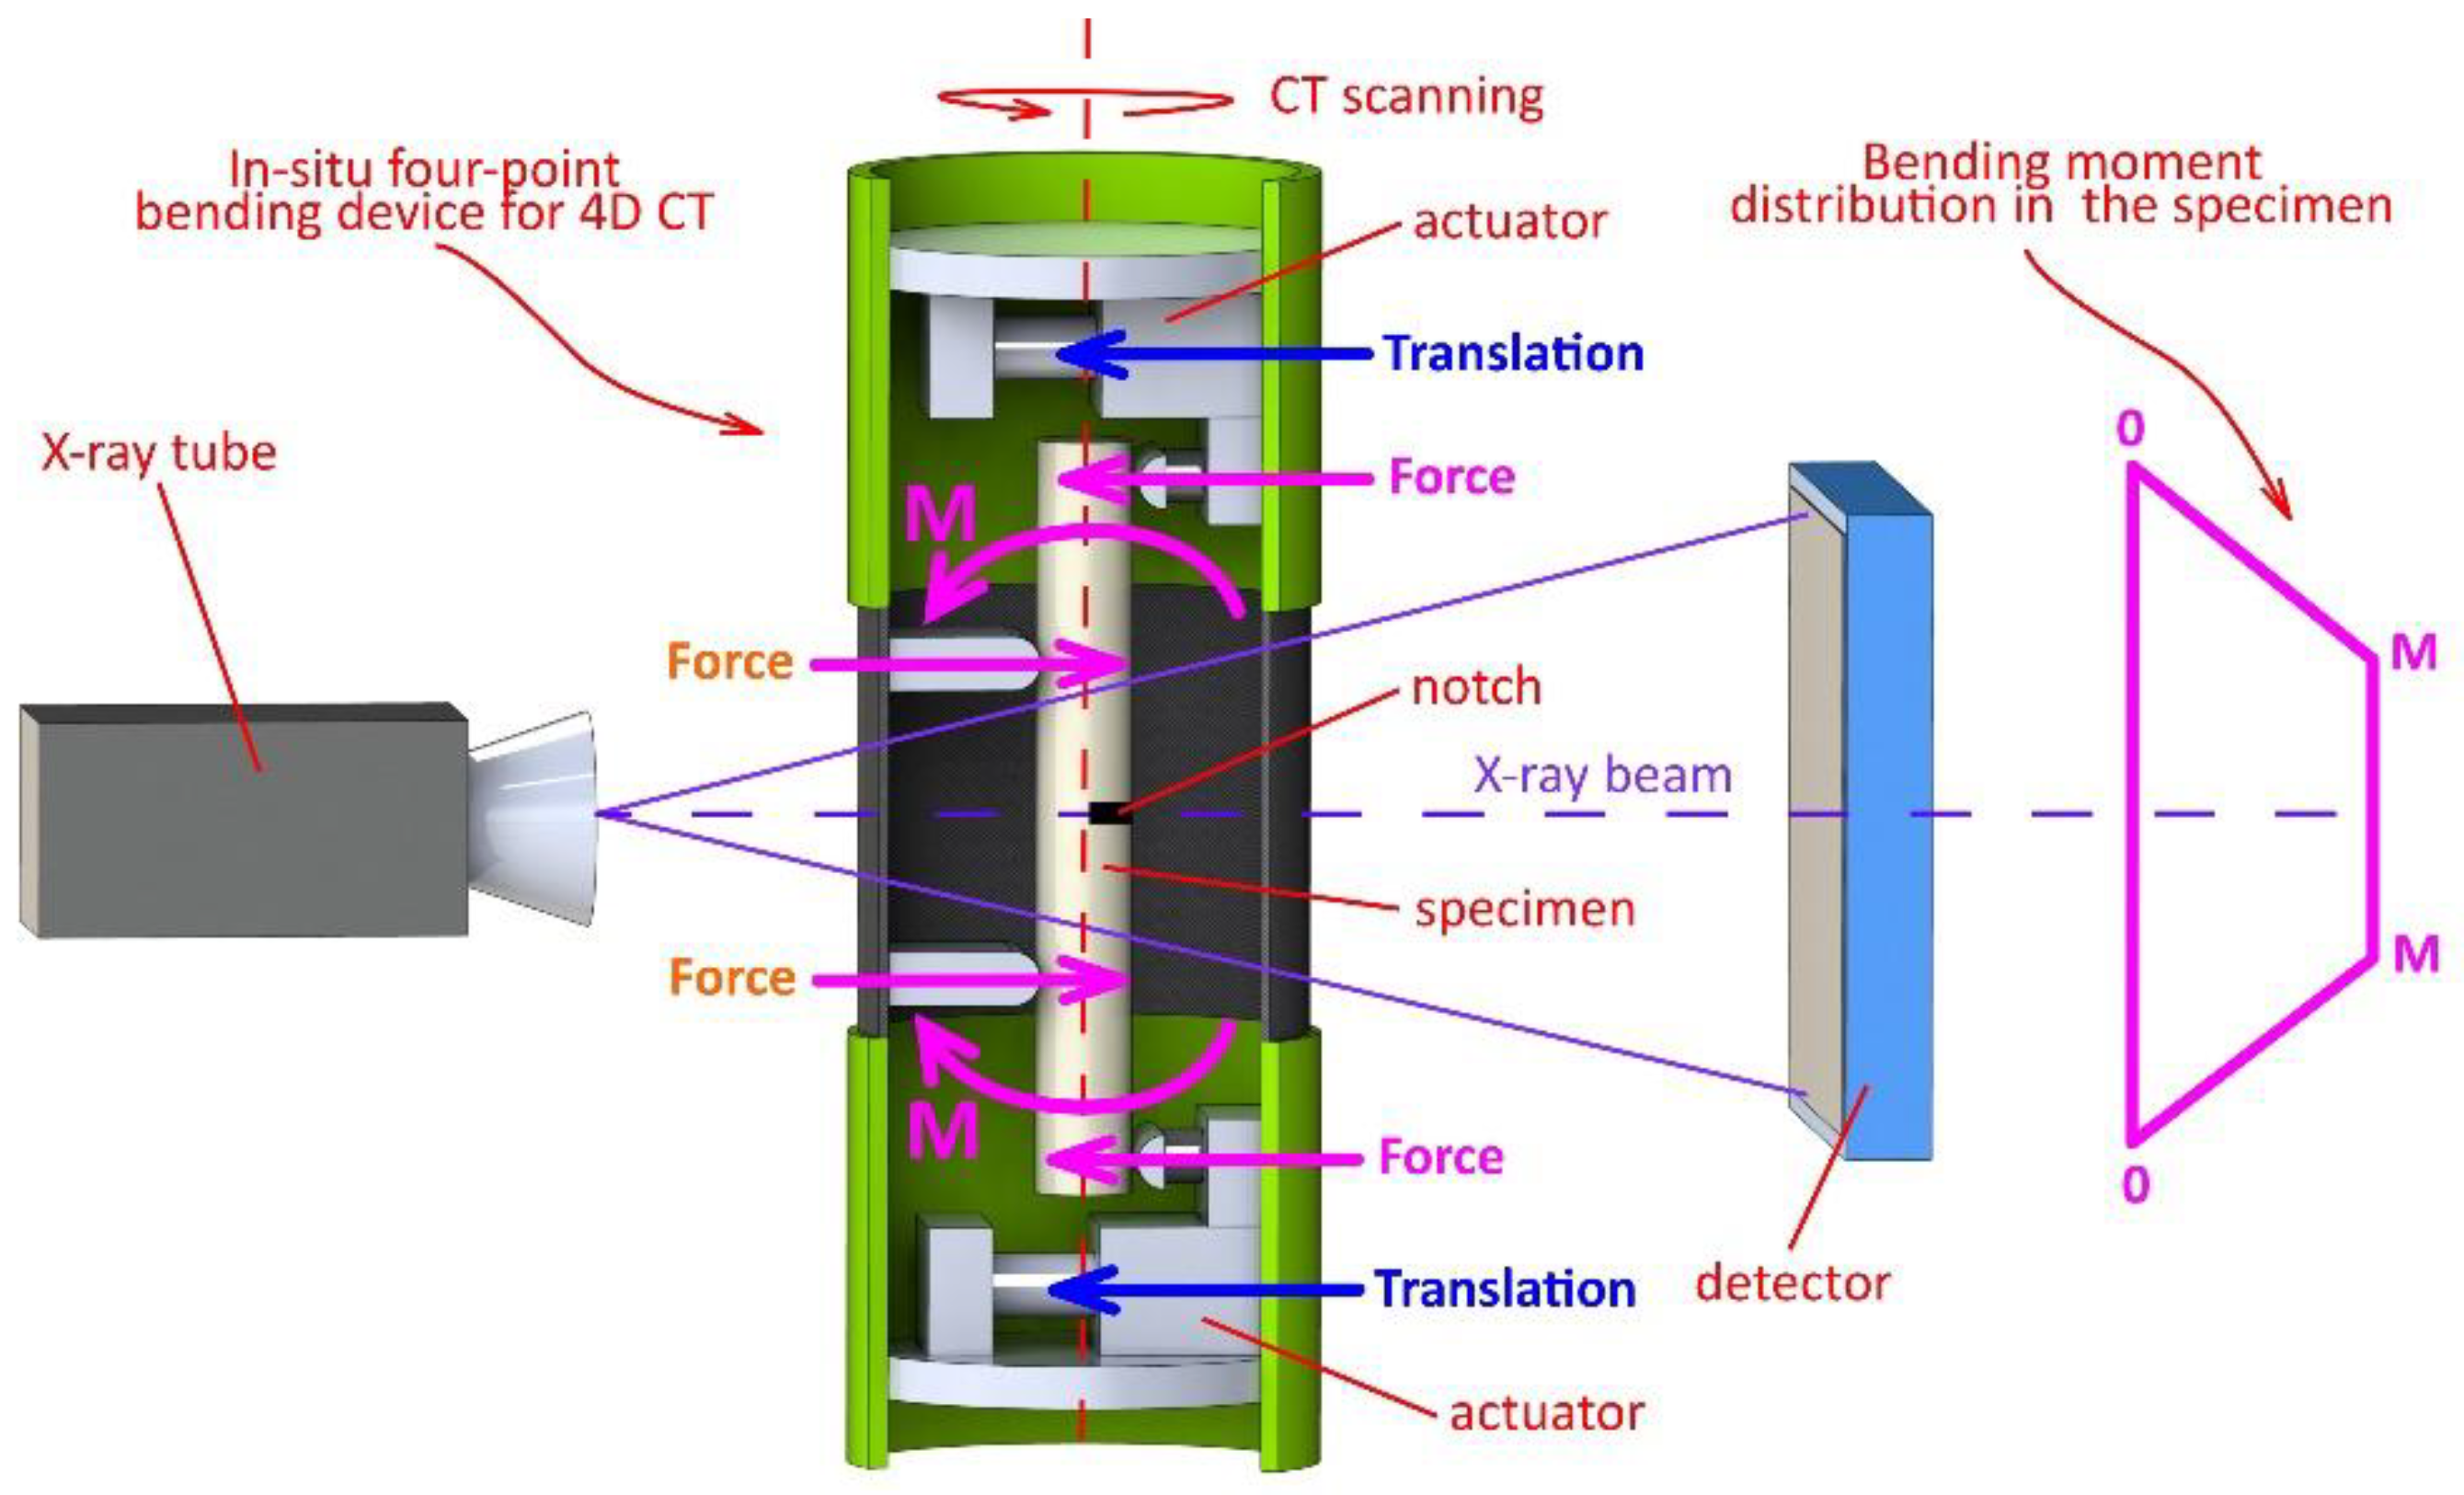
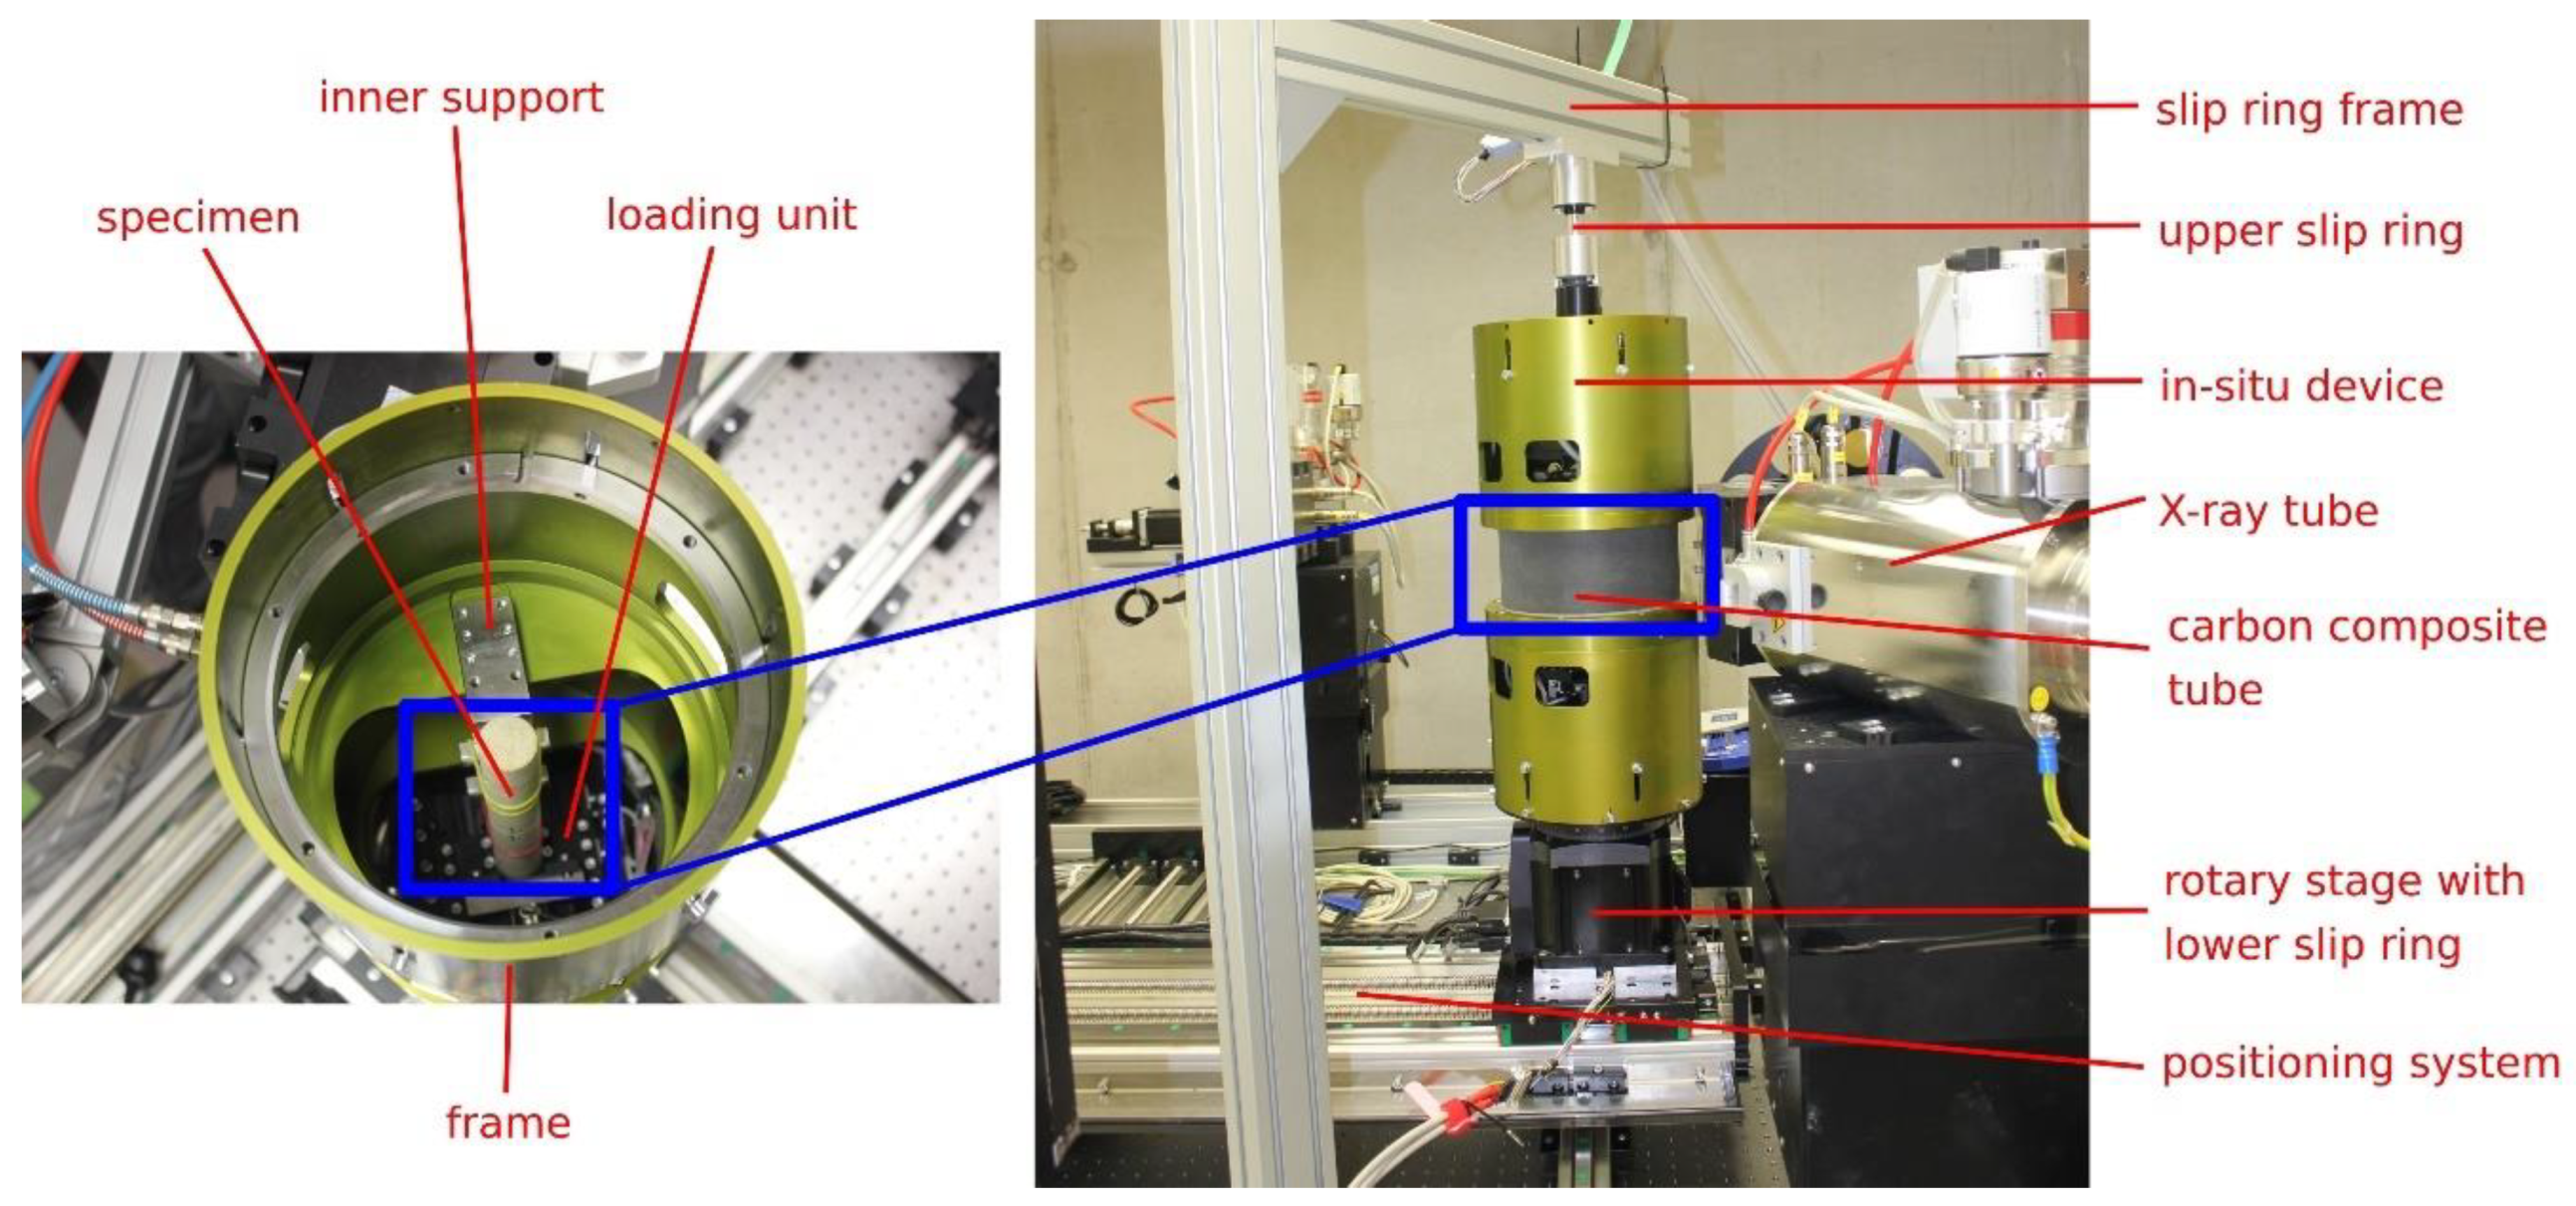
2.3. Loading Device
2.4. Loading Procedure
2.5. Radiographical Imaging and CT Reconstruction
2.6. Differential Tomography
3. Results
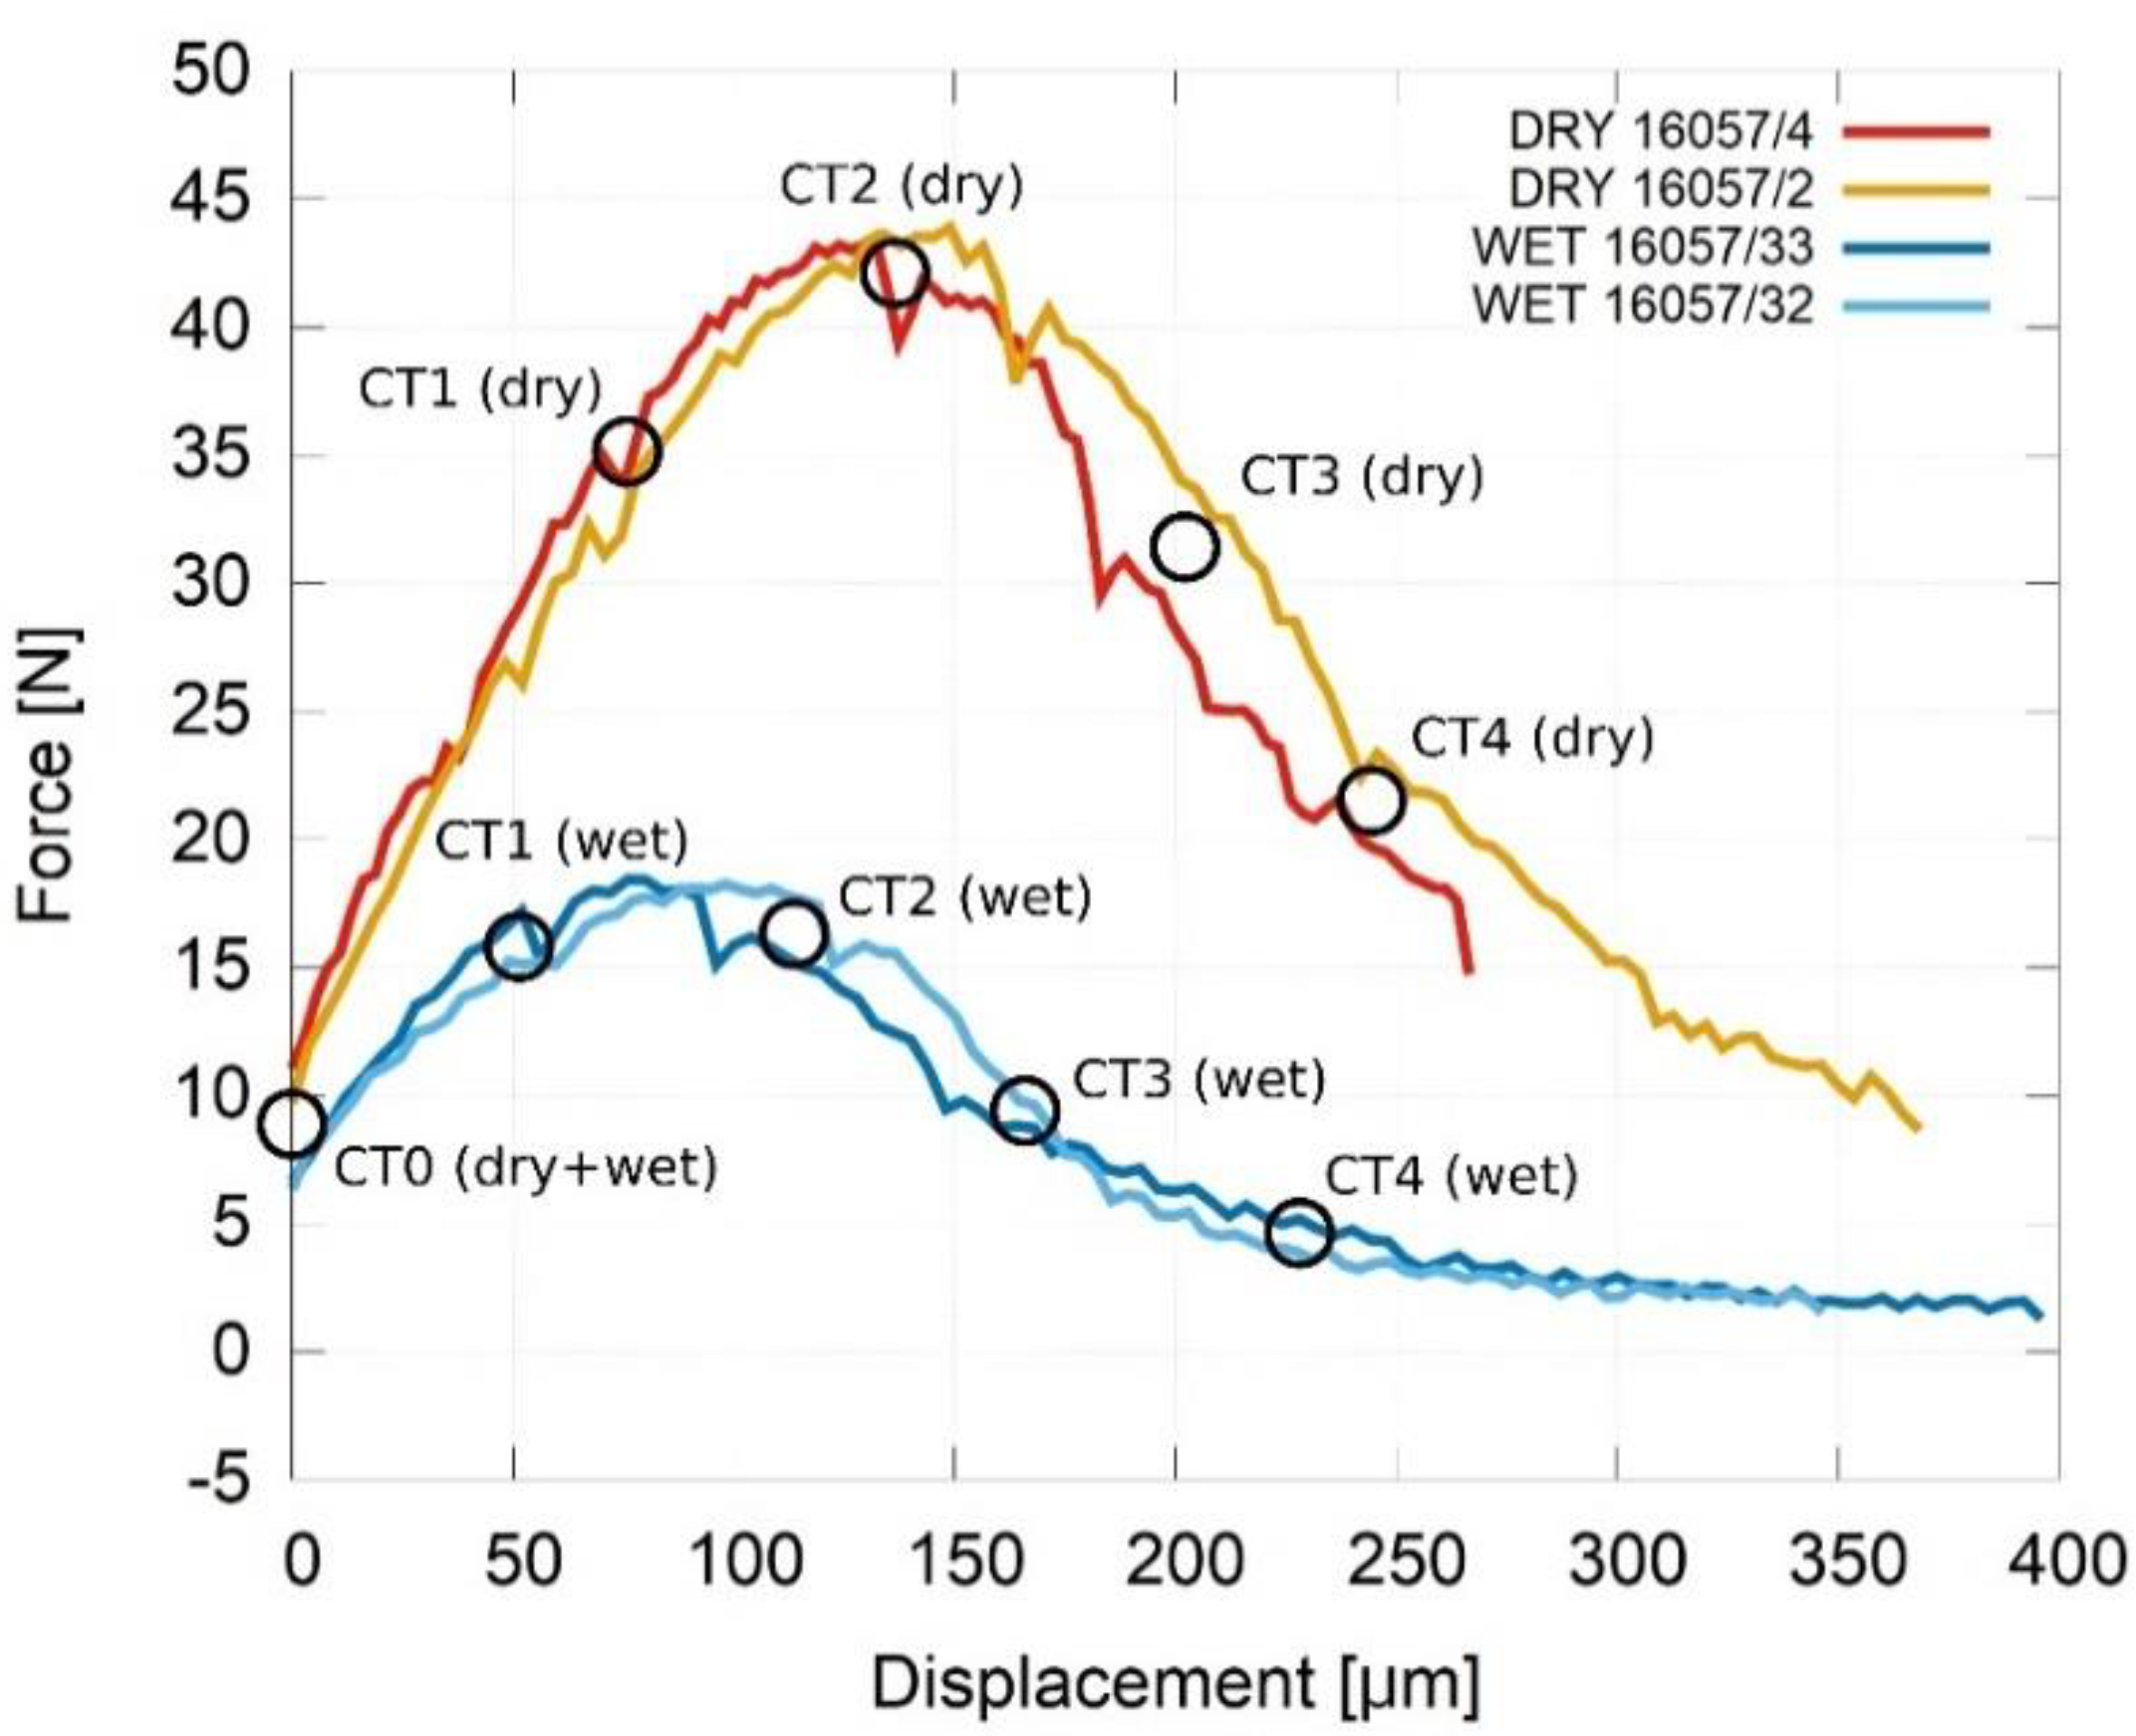
3.1. Force-Displacement Diagram
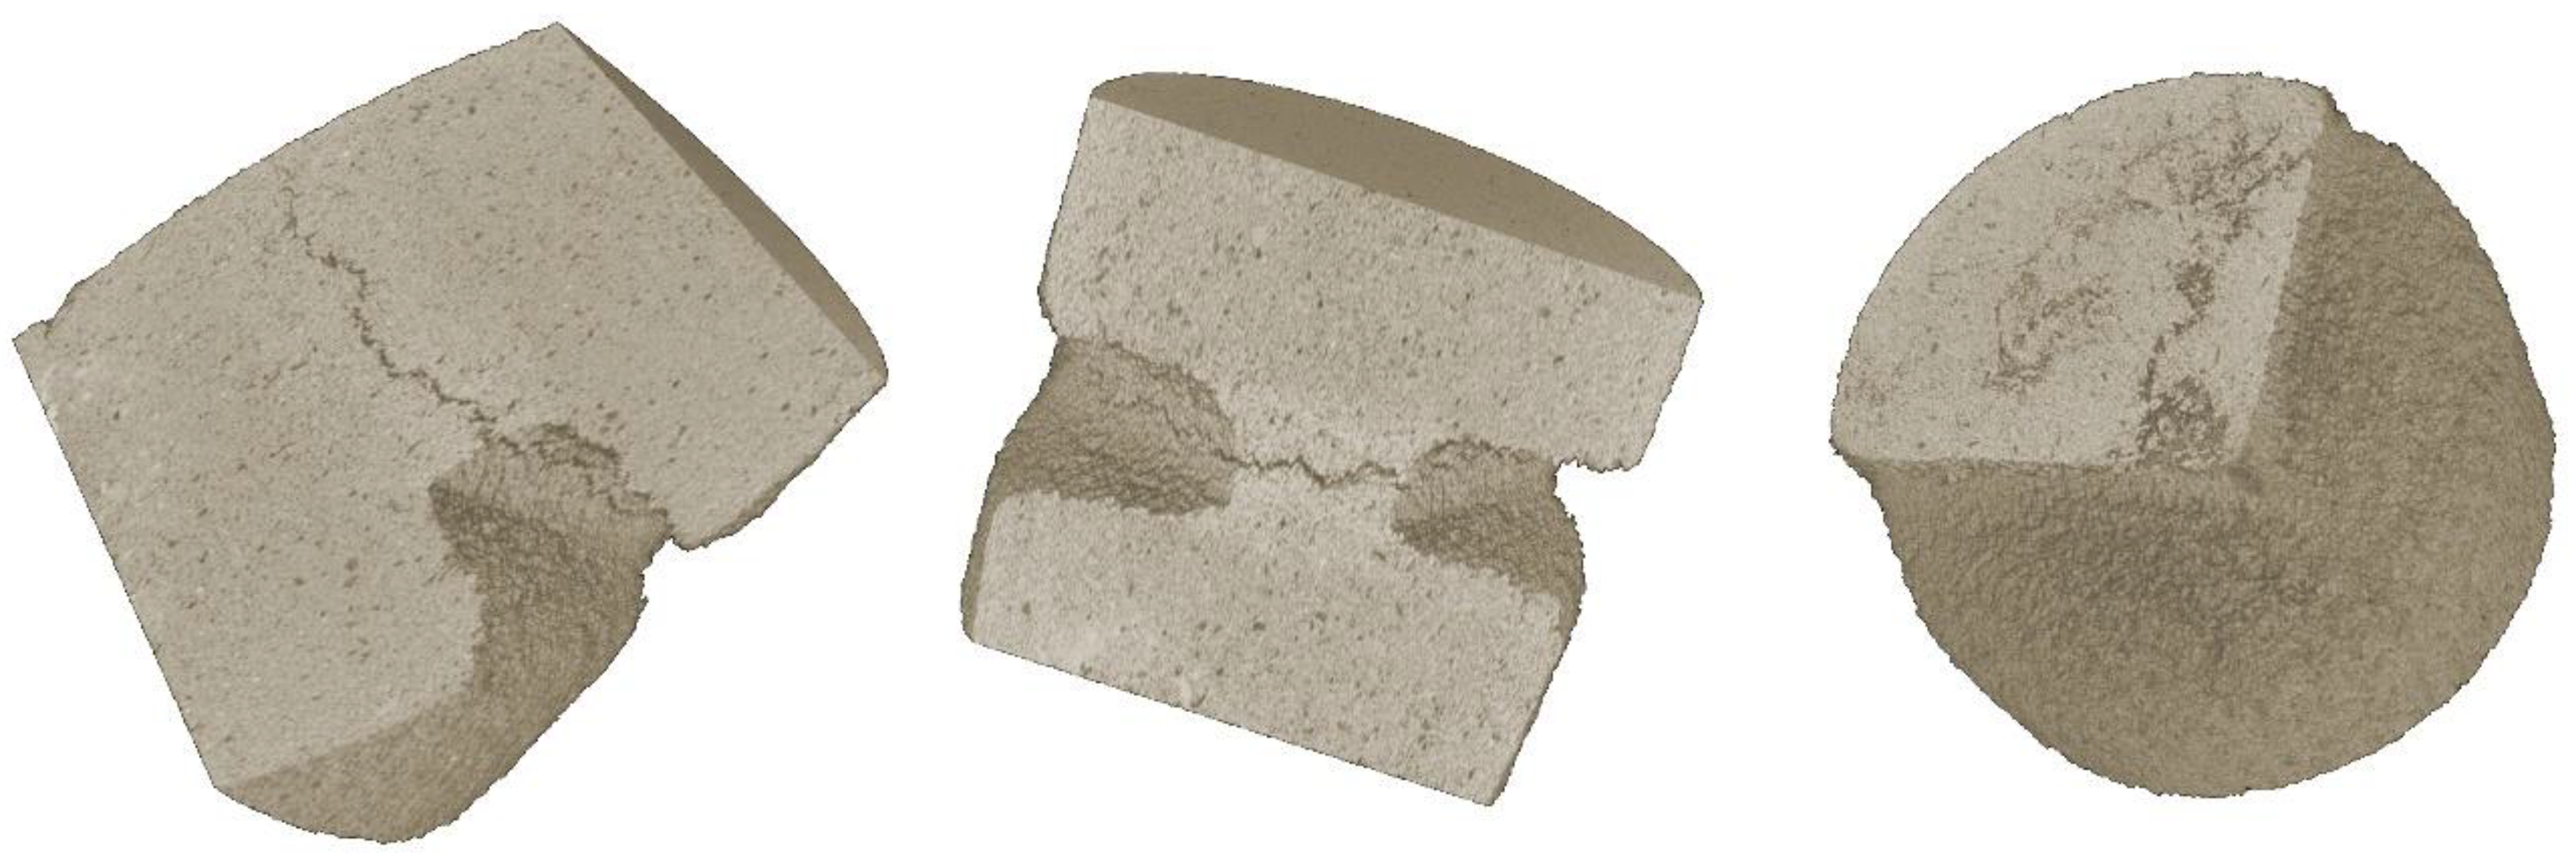
3.2. CT Reconstruction
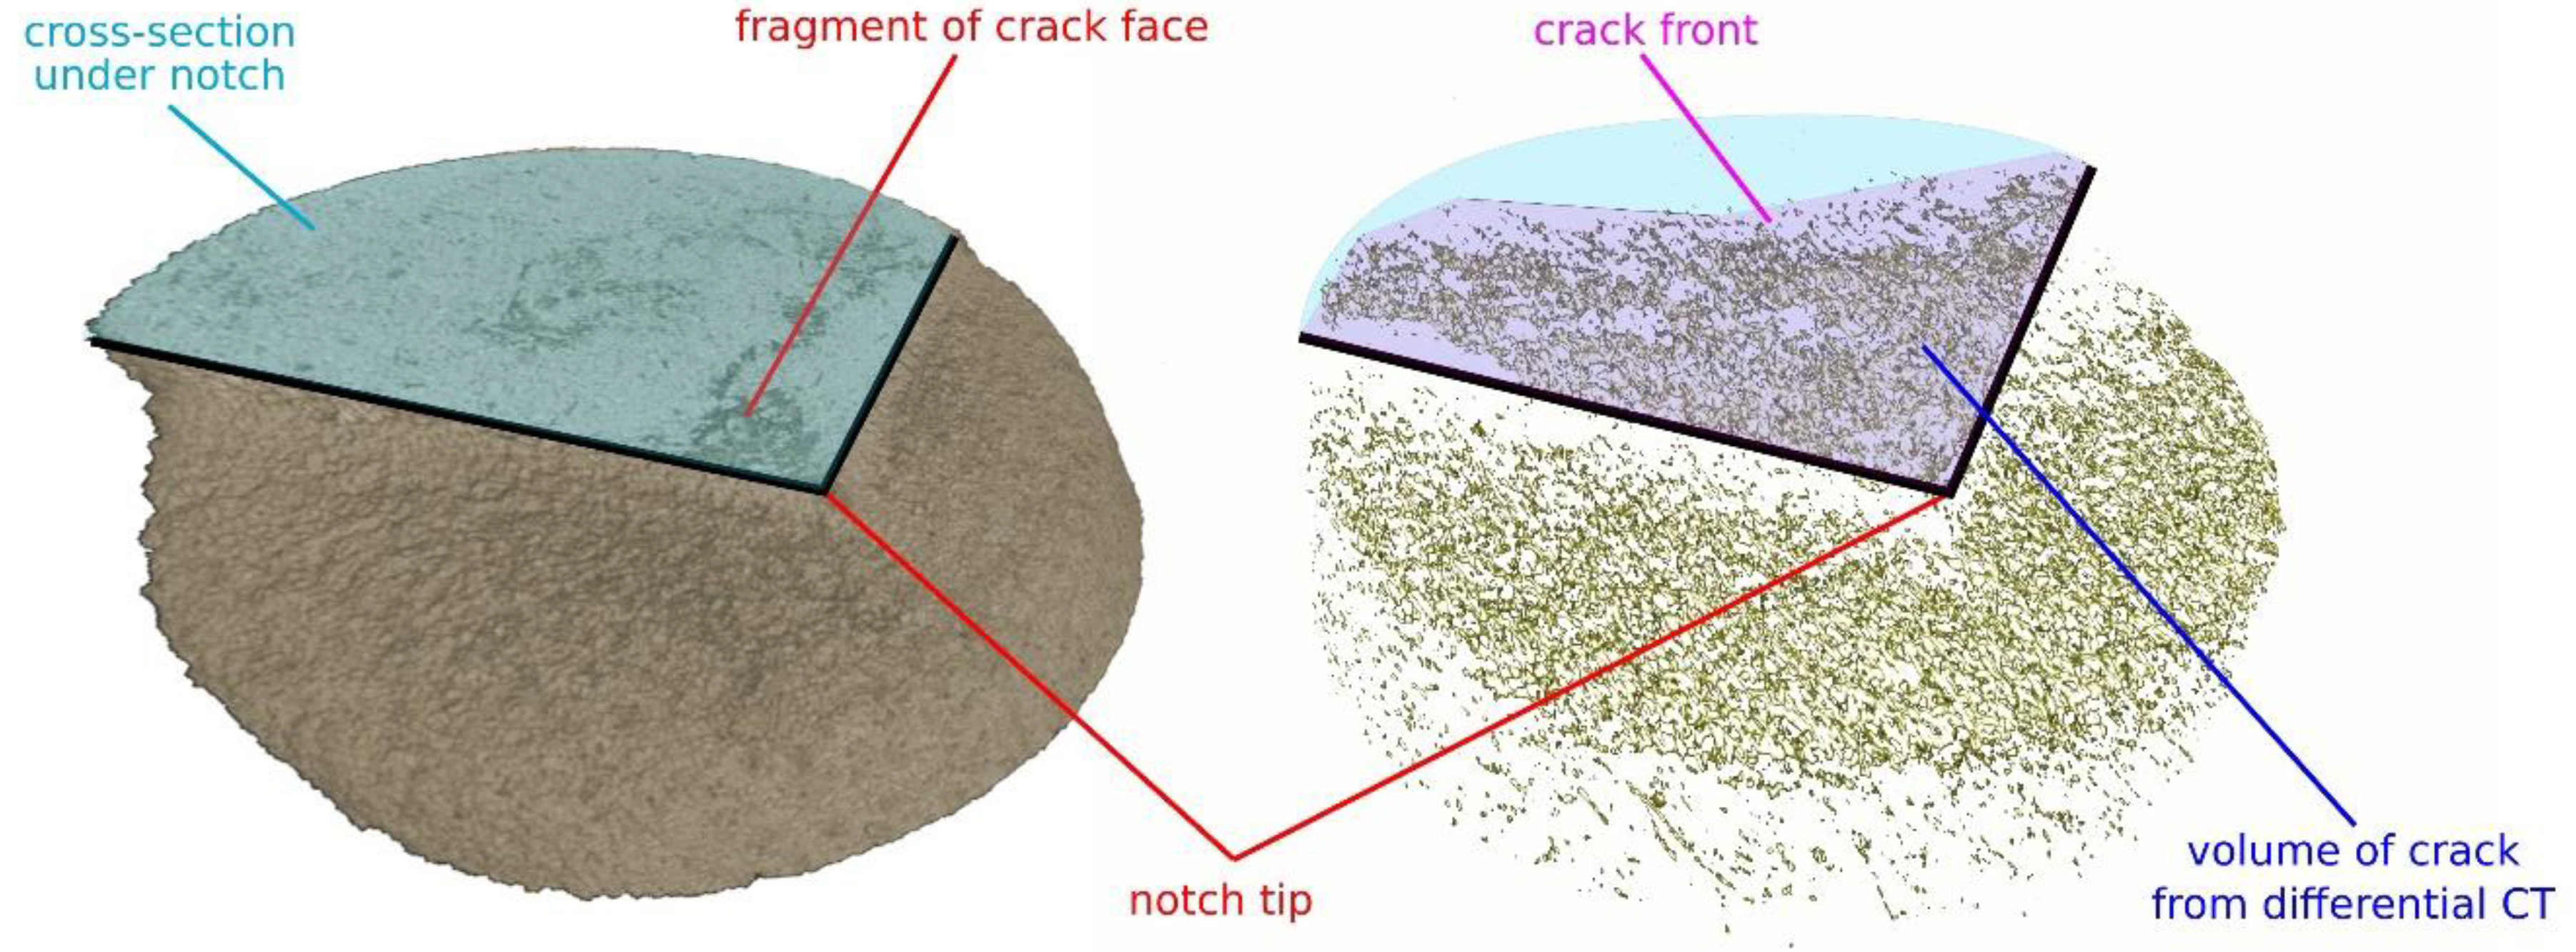
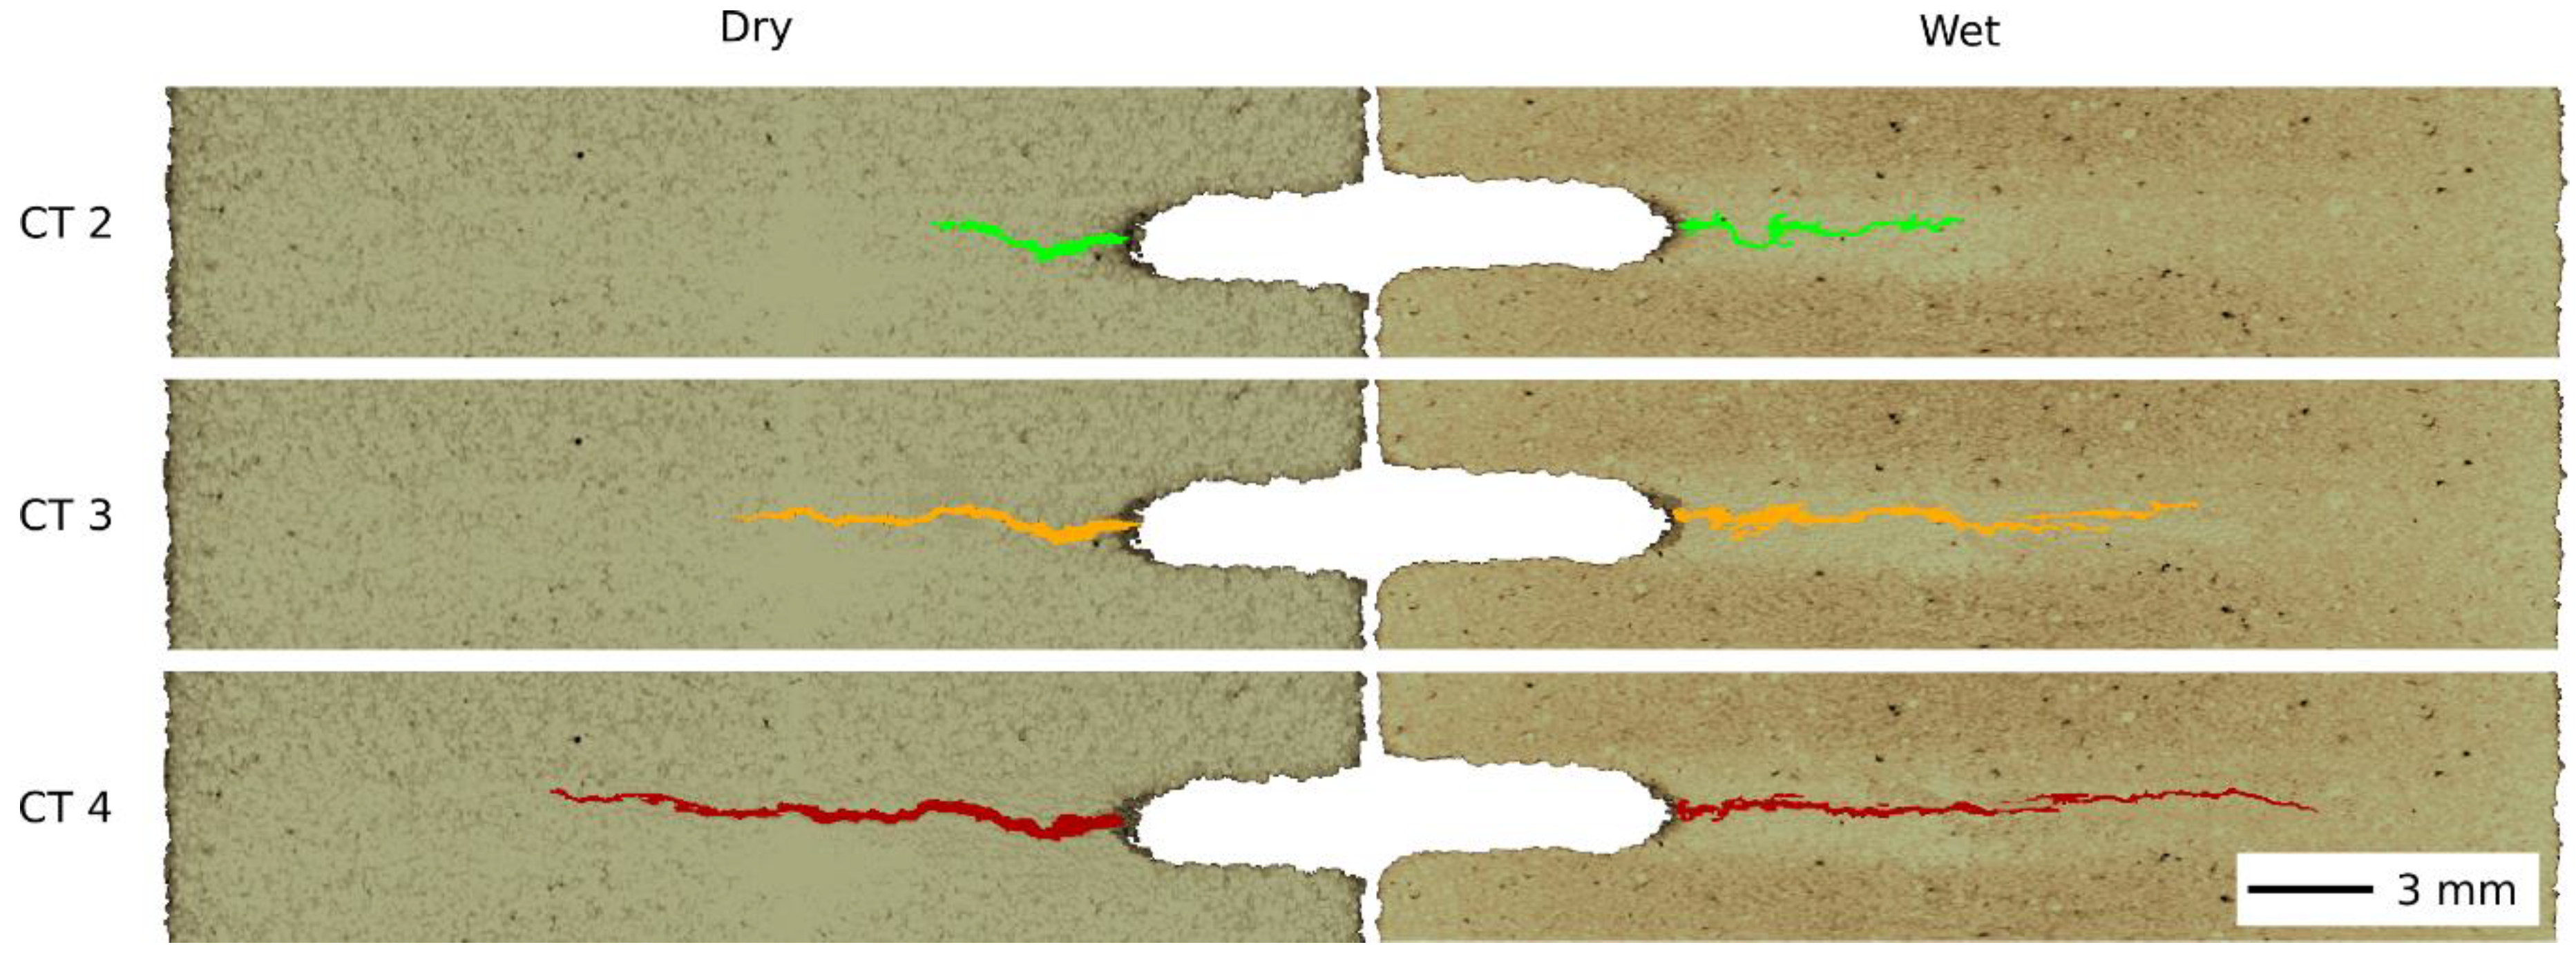
3.3. Differential Tomography
4. Discussion
- The utilised processing of the tomographic data enabled to precisely align the reconstructed 3D images and consequently perform the differential tomography procedure in order to reliably highlight the changes in specimen microstructure that occurred between the load steps. Here, the notch opening and deformation of the specimen render the common 3D image registration techniques and the subtraction of the volumes unsuitable for this application. As a result of the sub-voxel deformation of the specimen including its bending, minor movement and notch opening, the real crack shape and propagation would remain hidden in the noise.
- The force-displacement diagram was measured using the in-situ loading device and a significant difference between the dry and water-saturated specimen was identified in terms of the mechanical response. The maximum force reached in the experiments with the wet specimens was approximately 60% lower and occurred at approximately 50% lower displacement than during the experiments with the dry specimens. The resulting overall shape of the force-displacement diagrams was similar for both the dry and water-saturated specimens, but the slope of both the hardening and post-peak softening phase was lower in the case of the wet specimen.
- The mechanical behaviour of the investigated material and related water-weakening effects were in good agreement with the existing literature, where the observed peak force reduction by 60% for the water-saturated material was in agreement with results published by e.g., Singh and Sun, Nara et al. or Seto et al. [20,25,26]. However, the substantial contribution of the conducted research consists in the possibility to describe both qualitatively and quantitatively the differences in the crack geometrical properties and topology together with the corresponding microstructural response of the material and to perform a direct comparison between the dry and the water-saturated specimens. To the best of our knowledge, similar experiments have not been performed on natural quasi-brittle materials yet.
- It was possible to identify the differences in the crack characteristics of the dry and the water-saturated specimens using the differential tomography. In the results section, we have shown, for instance, the evolution of the crack length and the crack volume in the post-peak softening phase of the material response. The results revealed that the saturation of the specimens leads to higher crack length, while the crack volume is lower than in the dry state. Moreover, as the 3D image of the notch region is the output of the differential tomography procedure, other geometrical characteristics including the crack can be estimated. Furthermore, we have commented on the qualitative evaluation of the crack topology, where apparent differences in the kinking and branching of the crack were observed. Additionally, an arbitrary quantitative crack evaluation including fractal dimension calculations can be performed using the 3D image of the identified crack volume produced by the differential tomography algorithm.
5. Conclusions
Author Contributions
Funding
Conflicts of Interest
References
- Vesely, V.; Frantik, P. Reconstruction of a fracture process zone during tensile failure of quasi-brittle materials. Appl. Comput. Mech. 2010, 4, 237–250. [Google Scholar]
- Vesely, V.; Konecny, P.; Lehner, P. Influence of crack propagation on electrical resistivity and ultrasonic characteristics of normal concrete assessed by sequential TPB fracture test. Theor. Appl. Fract. Mech. 2015, 80, 2–13. [Google Scholar] [CrossRef]
- Vavro, L.; Soucek, K.; Kytyr, D.; Fila, T.; Kersner, Z.; Vavro, M. Visualization of the evolution of the fracture process zone in sandstone by transmission computed radiography. Procedia Eng. 2017, 191, 689–696. [Google Scholar] [CrossRef]
- Kytyr, D.; Fila, T.; Koudelka, P.; Kumpova, I.; Vopalensky, M.; Vavro, L.; Vavro, M. Instrumentation of four-point bending test during 4D computed tomography. Acta Polytech. CTU Proc. 2018, 18, 20–23. [Google Scholar] [CrossRef] [Green Version]
- Vavrik, D.; Benes, P.; Fila, T.; Koudelka, P.; Kumpova, I.; Kytyr, D.; Vopalensky, M.; Vavro, M.; Vavro, L. Tomographic investigation of the fracture toughness of the quasi-brittle specimens subjected to four-point bending test. Procedia Struct. Integr. 2018, 13, 1967–1970. [Google Scholar] [CrossRef]
- Hirschwald, J. Die prufung der naturlichen bausteine auf ihre wetterbestandigkeit. Z. Prakt. Geol. 1908, 16, 257–264. [Google Scholar]
- Morales Demarco, M.; Jahns, E.; Ruedrich, J.; Oyhantcabal, P.; Siegesmund, S. The impact of partial water saturation on rock strength: An experimental study on sandstone. Z. DT Ges. Geowiss. 2007, 158, 869–882. [Google Scholar] [CrossRef]
- Dyke, C.G.; Dobereiner, L. Evaluating the strength and deformability of sandstones. Q. J. Eng. Geol. Hydrogeol. 1991, 24, 123–134. [Google Scholar] [CrossRef]
- Hawkins, A.B.; McConnell, B.J. Sensitivity of sandstone strength and deformability to changes in moisture content. Q. J. Eng. Geol. Hydrogeol. 1992, 25, 115–130. [Google Scholar] [CrossRef]
- Siedel, H. Historic building stones and flooding: Changes of physical properties due to water saturation. J. Perform. Constr. Facil. 2010, 24, 452–461. [Google Scholar] [CrossRef]
- Zang, A.; Wagner, C.F.; Dresen, G. Acoustic emission, microstructure, and damage model of dry and wet sandstone stressed to failure. J. Geophys. Res. Solid Earth 1996, 101, 17507–17521. [Google Scholar] [CrossRef]
- Vasarhelyi, B.; Van, P. Influence of water content on the strength of rock. Eng. Geol. 2006, 84, 70–74. [Google Scholar] [CrossRef]
- Ojo, O.; Brook, N. The effect of moisture on some mechanical properties of rock. Min. Sci. Technol. 1990, 10, 145–156. [Google Scholar] [CrossRef]
- Burshtein, L.S. Effect of moisture on the strength and deformability of sandstone. J. Min. Sci. 1969, 5, 573–576. [Google Scholar] [CrossRef]
- Ruedrich, J.; Bartelsen, T.; Dohrmann, R.; Siegesmund, S. Moisture expansion as a deterioration factor for sandstone used in buildings. Environ. Earth Sci. 2011, 63, 1545–1564. [Google Scholar] [CrossRef] [Green Version]
- Jimenez Gonzalez, I.; Scherer, G.W. Effect of swelling inhibitors on the swelling and stress relaxation of clay bearing stones. Environ. Geol. 2004, 46, 364–377. [Google Scholar] [CrossRef]
- Guha Roy, D.; Sinhg, T.N.; Kodikara, J.; Das, R. Effect of water saturation on the fracture and mechanical properties of sedimentary rocks. Rock Mech. Rock Eng. 2017, 50, 2585–2600. [Google Scholar] [CrossRef]
- Kwasniewski, M.; Rodriguez-Oitaben, P. Effect of water on the deformability of rocks under uniaxial compression. In Proceedings of the ISRM Regional Symposium EUROCK 2009, Cavtat, Croatia, 29–31 October 2009; pp. 271–276. [Google Scholar]
- Vasarhelyi, B. Some observations regarding the strength and deformability of sandstones in dry and saturated conditions. Bull. Eng. Geol. Environ. 2003, 62, 245–249. [Google Scholar] [CrossRef]
- Singh, R.N.; Sun, G.X. An investigation into factors affecting fracture toughness of coal measures sandstones. J. Min. Metal Fuel 1990, 38, 111–118. [Google Scholar]
- Lau, C.L.P. Experimental Investigation of the Effect of Water and Temperature on Mechanical Properties of Rocks. Bachelor’s Thesis, The University of Queensland, Brisbane, Australia, 2016. [Google Scholar]
- Vavro, L.; Soucek, K. Study of the effect of moisture content and bending rate on the fracture toughness of rocks. Acta Geodyn. Geomater. 2013, 10, 247–253. [Google Scholar] [CrossRef] [Green Version]
- Utagawa, M.; Seto, M.; Katsuyama, K.; Matsui, K. Evaluation of fracture toughness of rocks in wet and chemical condition. Shigen Sozai 1998, 114, 856–861. [Google Scholar] [CrossRef]
- Zhou, Z.; Cai, X.; Ma, D.; Cao, W.; Chen, L.; Zhou, J. Effect of water content on fracture and mechanical behavior of sandstone with a low clay mineral content. Eng. Fract. Mech. 2018, 193, 47–65. [Google Scholar] [CrossRef]
- Nara, Y.; Morimoto, K.; Hiroyoshi, N.; Yoneda, T.; Kaneko, K.; Benson, P.M. Influence of relative humidity on fracture toughness of rocks: Implications for subcritical crack growth. Int. J. Solid Struct. 2012, 49, 2471–2481. [Google Scholar] [CrossRef]
- Seto, M.; Kuruppu, M.D.; Funatsu, T. Fracture toughness testing of rock at elevated temperatures and pressures. In Proceedings of the 38th U.S. Symposium of Rock Mechanics 2001, Washington, DC, USA, 7–10 July 2001; pp. 745–751. [Google Scholar]
- Hounsfield, G.N. Computerized transverse axial scanning (tomography)—Part 1. Description of the system. Br. J. Radiol. 1973, 46, 1016–1022. [Google Scholar] [CrossRef] [PubMed]
- Cnudde, V.; Boone, M.N. High-resolution X-ray computed tomography in geosciences: A review of the current technology and applications. Earth Sci. Rev. 2013, 123, 1–17. [Google Scholar] [CrossRef] [Green Version]
- Mees, F.; Swennen, R.; Van Geet, M.; Jacobs, P. Applications of X-Ray computed tomography in the geosciences. Geol. Soc. 2003, 215, 1–6. [Google Scholar] [CrossRef] [Green Version]
- Otani, J.; Obara, Y. X-Ray CT for Geomaterials: Soils, Concrete, Rocks. International Workshop on X-Ray CT for Geomaterials; CRC Press: Boca Raton, FL, USA, 2003. [Google Scholar]
- Cnudde, V.; Dewanckele, J.; Boone, M.A.; De Kock, T.; Boone, M.N.; Brabant, L.; Dusar, M.; De Ceukelaire, M.; De Clercq, H.; Hayen, R.; et al. High-resolution X-Ray CT for 3D petrography of ferruginous sandstone for an investigation of building stone decay. Microsc. Res. Tech. 2011, 74, 1006–1017. [Google Scholar] [CrossRef]
- Cardenes, V.; Cnudde, V.; De Boever, W.; Mateos, F.J. Micro-CT and mercury intrusion porosimetry characterization of the fabric of roofing slate. In Proceedings of the 1st International Conference on Tomography of Materials and Structures 2013, Ghent, Belgium, 1–5 July 2013; pp. 225–228. [Google Scholar]
- Kovarova, K.; Sevcik, R.; Weishauptova, Z. Comparison of mercury porosimetry and X-ray microtomography for porosity study of sandstones. Acta Geodyn. Geomater. 2012, 9, 541–549. [Google Scholar]
- Vavro, M.; Vavro, L.; Martinec, P.; Soucek, K. Properties, durability and use of glauconitic Godula sandstones: A relatively less known building stone of the Czech Republic and Poland. Environ. Earth Sci. 2016, 75, 1437. [Google Scholar] [CrossRef]
- Vavro, M.; Soucek, K.; Danek, T.; Matysek, D.; Georgiovska, L.; Zajicova, V. Utilization of X-ray computed micro-tomography to evaluate iron sulphide distribution in roofing slates. Q. J. Eng. Geol. Hydrogeol. 2018, 51, 169–178. [Google Scholar] [CrossRef]
- Sato, A.; Egashira, M.; Obata, M. Evaluation of preservation effect by Aquo-Siloxane method towards water permeation and material diffusion into porous rocks. Mater. Sci. Appl. 2017, 8, 419–435. [Google Scholar] [CrossRef] [Green Version]
- Koudelka, P.; Jandejsek, I.; Doktor, T.; Kytyr, D.; Jiroušek, O.; Zima, P.; Drdacky, M. Radiographical investigation of fluid penetration processes in natural stones used in historical buildings. J. Instrum. 2014, 9, C05040. [Google Scholar] [CrossRef]
- Sato, A.; Obara, Y. Analysis of pore structure and water permeation property of a shale rock by means of X-ray CT. Procedia Eng. 2017, 191, 666–673. [Google Scholar] [CrossRef]
- Sato, A.; Nishizono, J.; Fujita, K.; Obata, M. Verification of the inhibitory effect of the Aquo-Siloxane method on material migration in porous rock using the μ-focus X-ray computed tomography method. Mater. Trans. 2018, 59, 1731–1738. [Google Scholar] [CrossRef] [Green Version]
- Desarnaud, J.; Derluyn, H.; Molari, L.; De Miranda, S.; Cnudde, V.; Shahidzadeh, N. Drying of salt contaminated porous media: Effect of primary and secondary nucleation. J. Appl. Phys. 2015, 118, 114901. [Google Scholar] [CrossRef] [Green Version]
- Pavliková, M.; Pokorny, J.; Jankovsky, O.; Zaleska, M.; Vavro, M.; Soucek, K.; Pavlik, Z. The effect of the sodium sulphate solution exposure on properties and mechanical resistance of different kinds of renders. Ceram. Silik. 2018, 62, 311–324. [Google Scholar] [CrossRef]
- Sperl, M.; Drdacky, M. Non-standard experimental tests of sandstone and its pre-cracking for fracture testing. Mater. Sci. Eng. 2018, 379, 012029. [Google Scholar] [CrossRef]
- Skarżyński, Ł.; Tejchman, J. Experimental investigations of damage evolution in concrete during bending by continuous micro-CT scanning. Mater. Charact. 2019, 154, 40–52. [Google Scholar] [CrossRef]
- Pavlik, Z.; Michalek, P.; Pavlikova, M.; Kopecka, I.; Maxova, I.; Cerny, R. Water and salt transport and storage properties of Mšené sandstone. Constr. Build. Mater. 2008, 22, 1736–1748. [Google Scholar] [CrossRef]
- Shahidzadeh-Bonn, N.; Desarnaud, J.; Bertrand, F.; Chateau, X.; Bonn, D. Damage in porous media due to salt crystallization. Phys. Rev. E 2010, 81, 066110. [Google Scholar] [CrossRef] [Green Version]
- Rybarik, V. Noble Building and Sculptural Stone of the Czech Republic; Industrial Secondary School of Stonework and Sculpture in Horice: Horice, Czech Republic, 1994. [Google Scholar]
- Rybarik, V. Mšené sandstone. Kamen 1996, 3, 7–10. [Google Scholar]
- ISRM Commision on Testing Methods (Ouchterlony, F. co-ordinator). Suggested methods for determining the fracture toughness of rock. Int. J. Rock Mech. Min. Sci. Geomech. Abstr. 1988, 25, 71–96. [Google Scholar] [CrossRef]
- Rada, V.; Fila, T.; Zlamal, P.; Kytyr, D.; Koudelka, P. Multi-channel control system for in-situ laboratory loading devices. Acta Polytech. CTU Proc. 2018, 18, 15–19. [Google Scholar] [CrossRef] [Green Version]


| Bulk Density [kg/m3] | Total Porosity [% by Volume] | Water Absorption [% by Weight] |
| 1850–1930 | 26.3–29.7 | 10.8–13.3 |
| Compressive Strength (Dry) [MPa] | Compressive Strength (Water-Saturated) [MPa] | Flexural Strength (Dry) [MPa] |
| 23–33 | 19–32 | 0.9–1.6 |
| Load Step | Crack Length: Dry [mm] | Crack Length: Wet [mm] | Crack Volume: Dry [mm3] | Crack Volume: Wet [mm3] |
|---|---|---|---|---|
| CT 2 | 4.67 | 6.69 | 14.53 | 8.48 |
| CT 3 | 9.33 | 12.44 | 51.52 | 27.18 |
| CT 4 | 13.22 | 15.09 | 73.33 | 34.16 |
© 2020 by the authors. Licensee MDPI, Basel, Switzerland. This article is an open access article distributed under the terms and conditions of the Creative Commons Attribution (CC BY) license (http://creativecommons.org/licenses/by/4.0/).
Share and Cite
Koudelka, P.; Fila, T.; Rada, V.; Zlamal, P.; Sleichrt, J.; Vopalensky, M.; Kumpova, I.; Benes, P.; Vavrik, D.; Vavro, L.; et al. In-situ X-ray Differential Micro-tomography for Investigation of Water-weakening in Quasi-brittle Materials Subjected to Four-point Bending. Materials 2020, 13, 1405. https://doi.org/10.3390/ma13061405
Koudelka P, Fila T, Rada V, Zlamal P, Sleichrt J, Vopalensky M, Kumpova I, Benes P, Vavrik D, Vavro L, et al. In-situ X-ray Differential Micro-tomography for Investigation of Water-weakening in Quasi-brittle Materials Subjected to Four-point Bending. Materials. 2020; 13(6):1405. https://doi.org/10.3390/ma13061405
Chicago/Turabian StyleKoudelka, Petr, Tomas Fila, Vaclav Rada, Petr Zlamal, Jan Sleichrt, Michal Vopalensky, Ivana Kumpova, Pavel Benes, Daniel Vavrik, Leona Vavro, and et al. 2020. "In-situ X-ray Differential Micro-tomography for Investigation of Water-weakening in Quasi-brittle Materials Subjected to Four-point Bending" Materials 13, no. 6: 1405. https://doi.org/10.3390/ma13061405