
The Gold(I) Complex with Plant Hormone Kinetin Shows Promising In Vitro Anticancer and PPARγ Properties
 , , ,
, , ,  , and
, and
Abstract
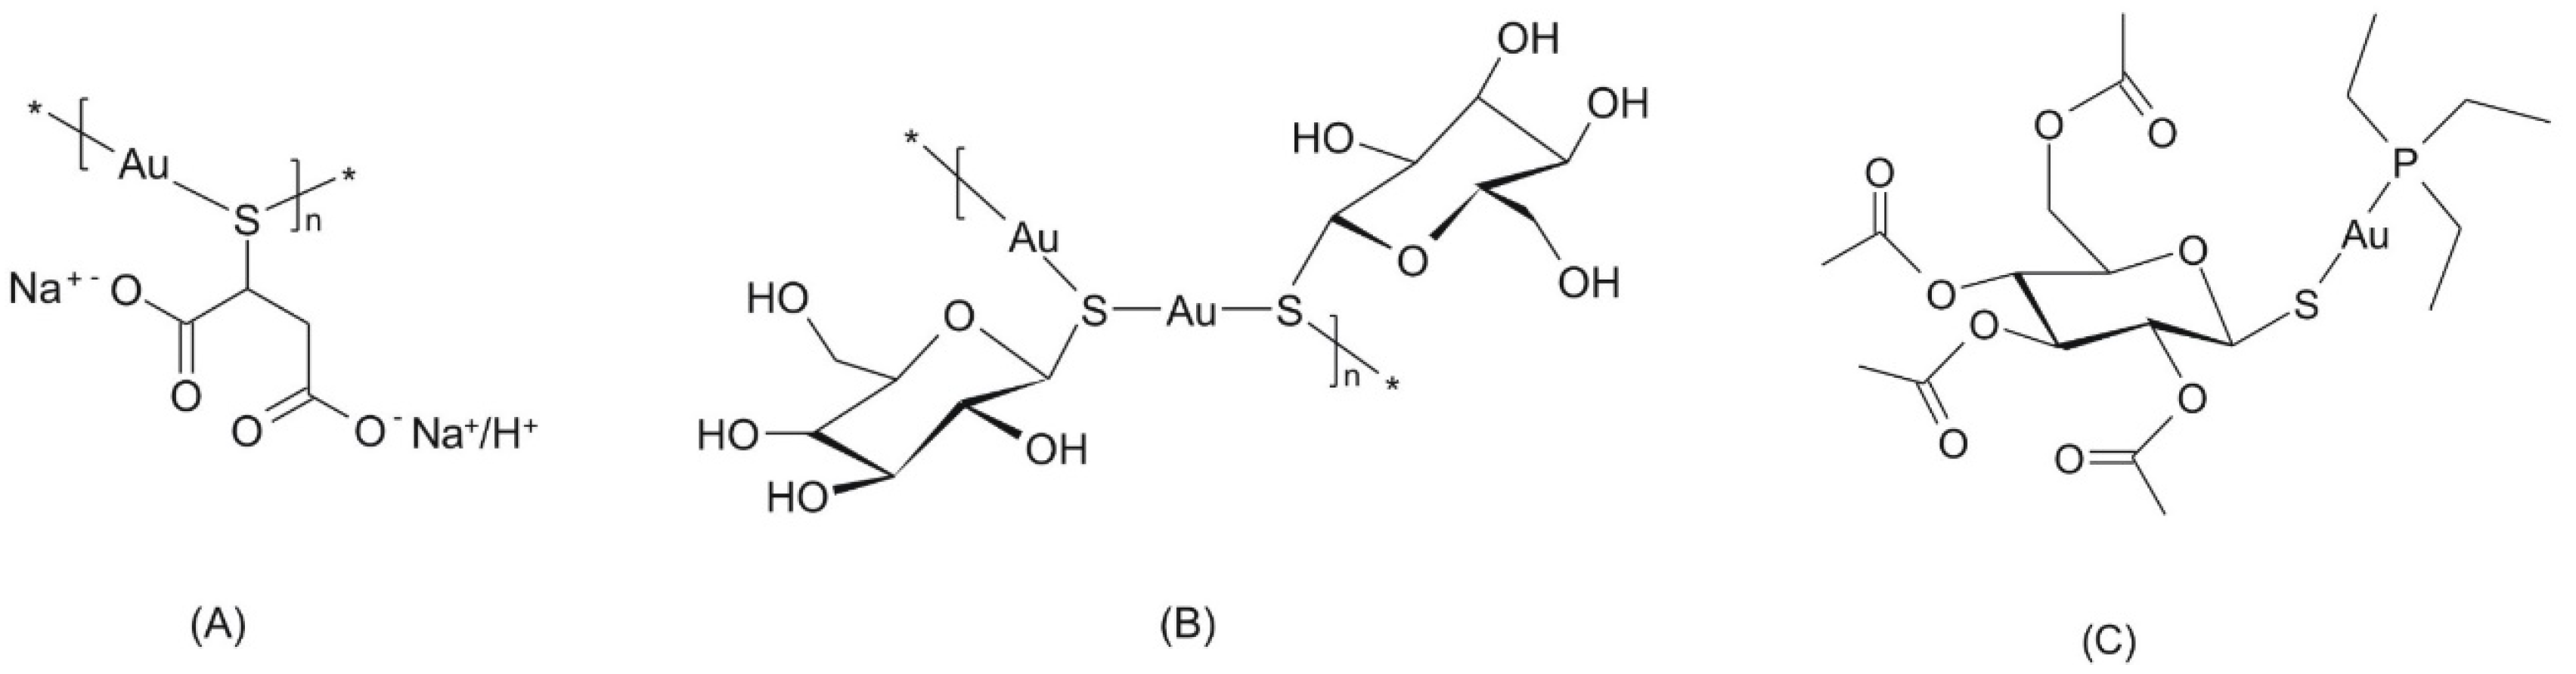
:1. Introduction
2. Results and Discussion
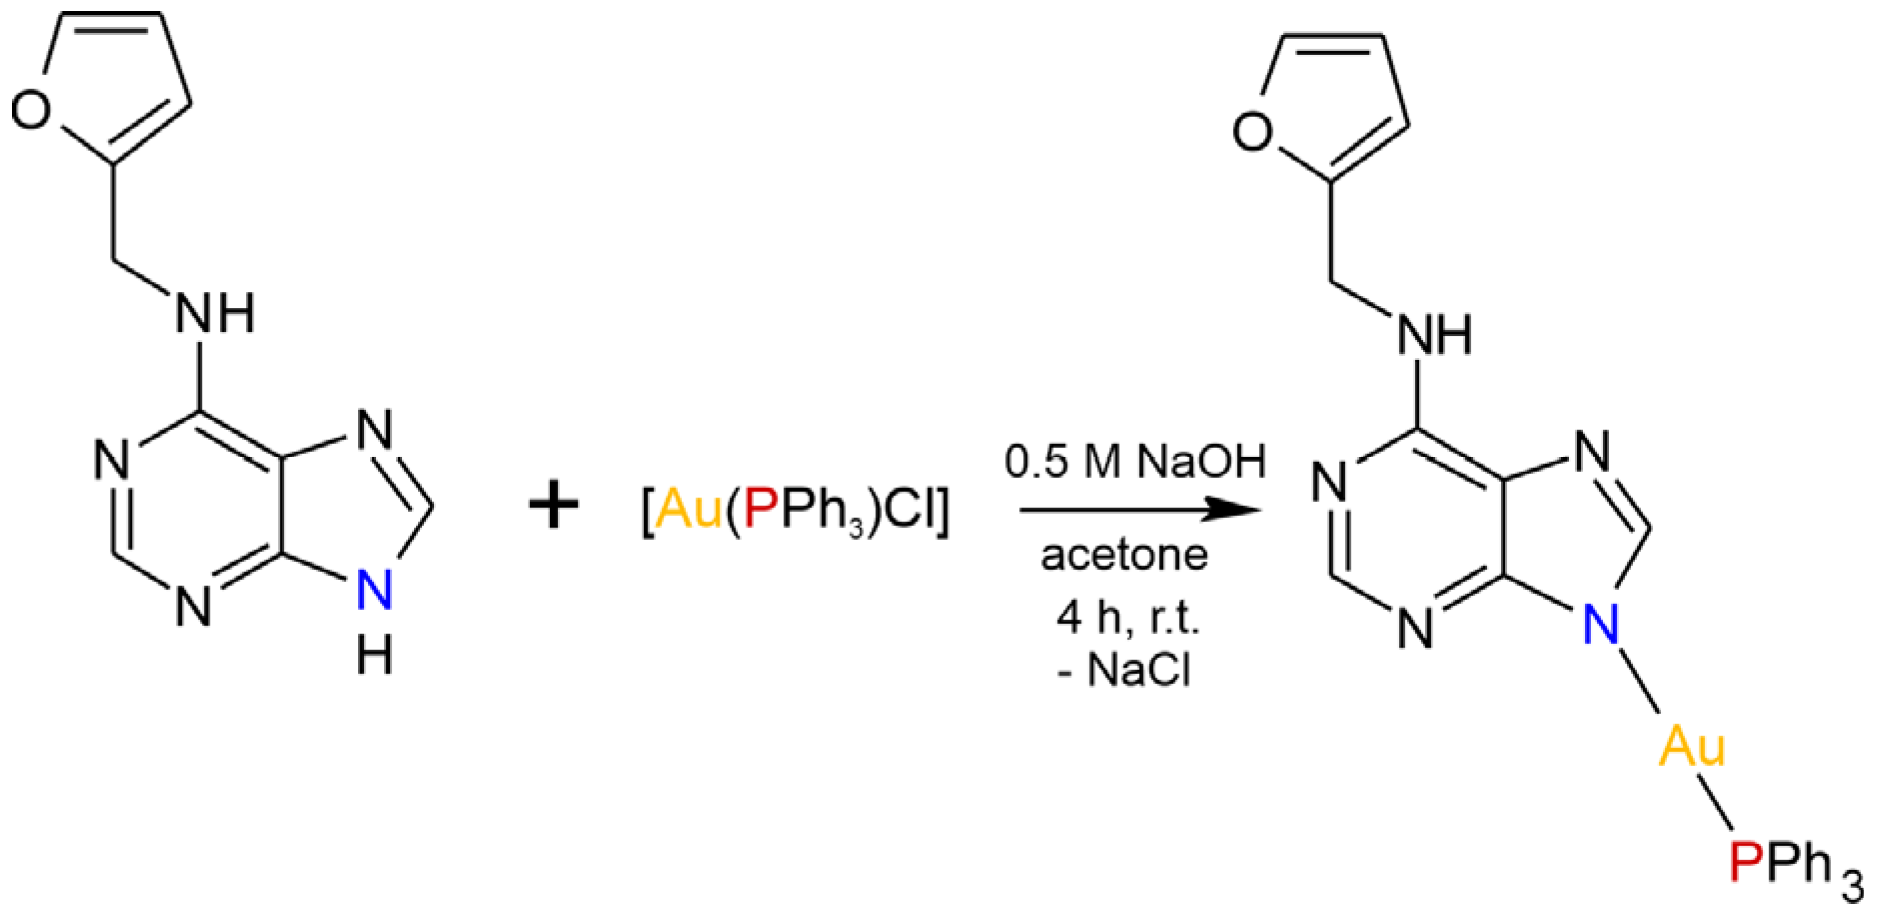
2.1. General Characterization
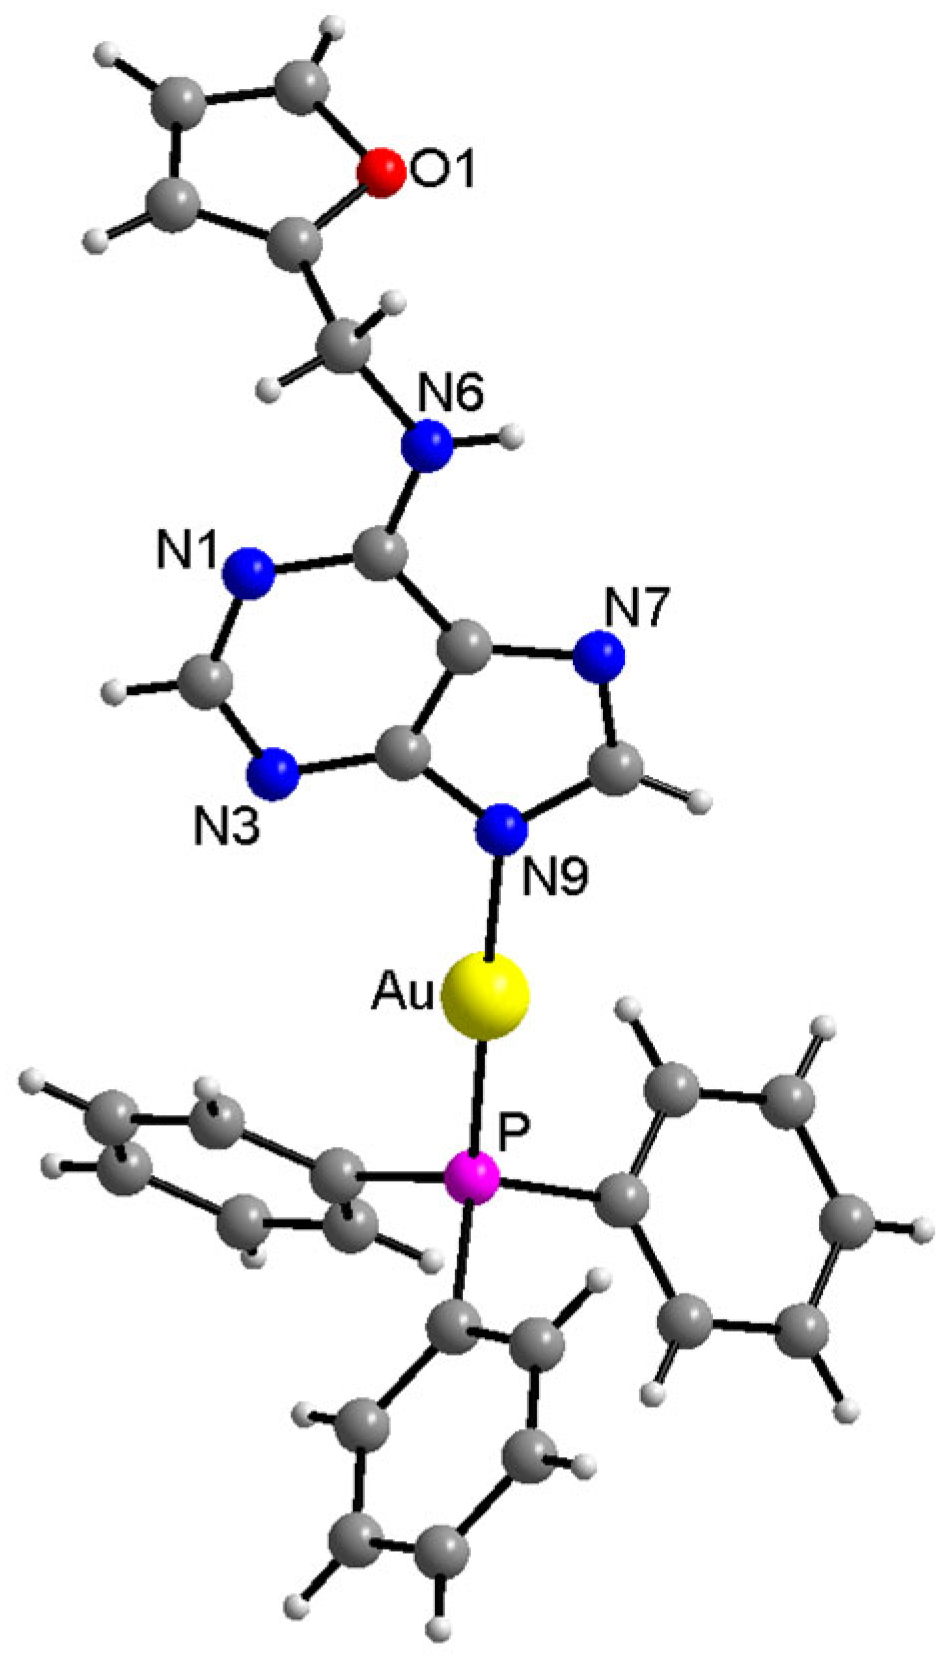
2.2. Single Crystal X-ray Analysis
2.3. In Vitro Cytotoxicity Studies
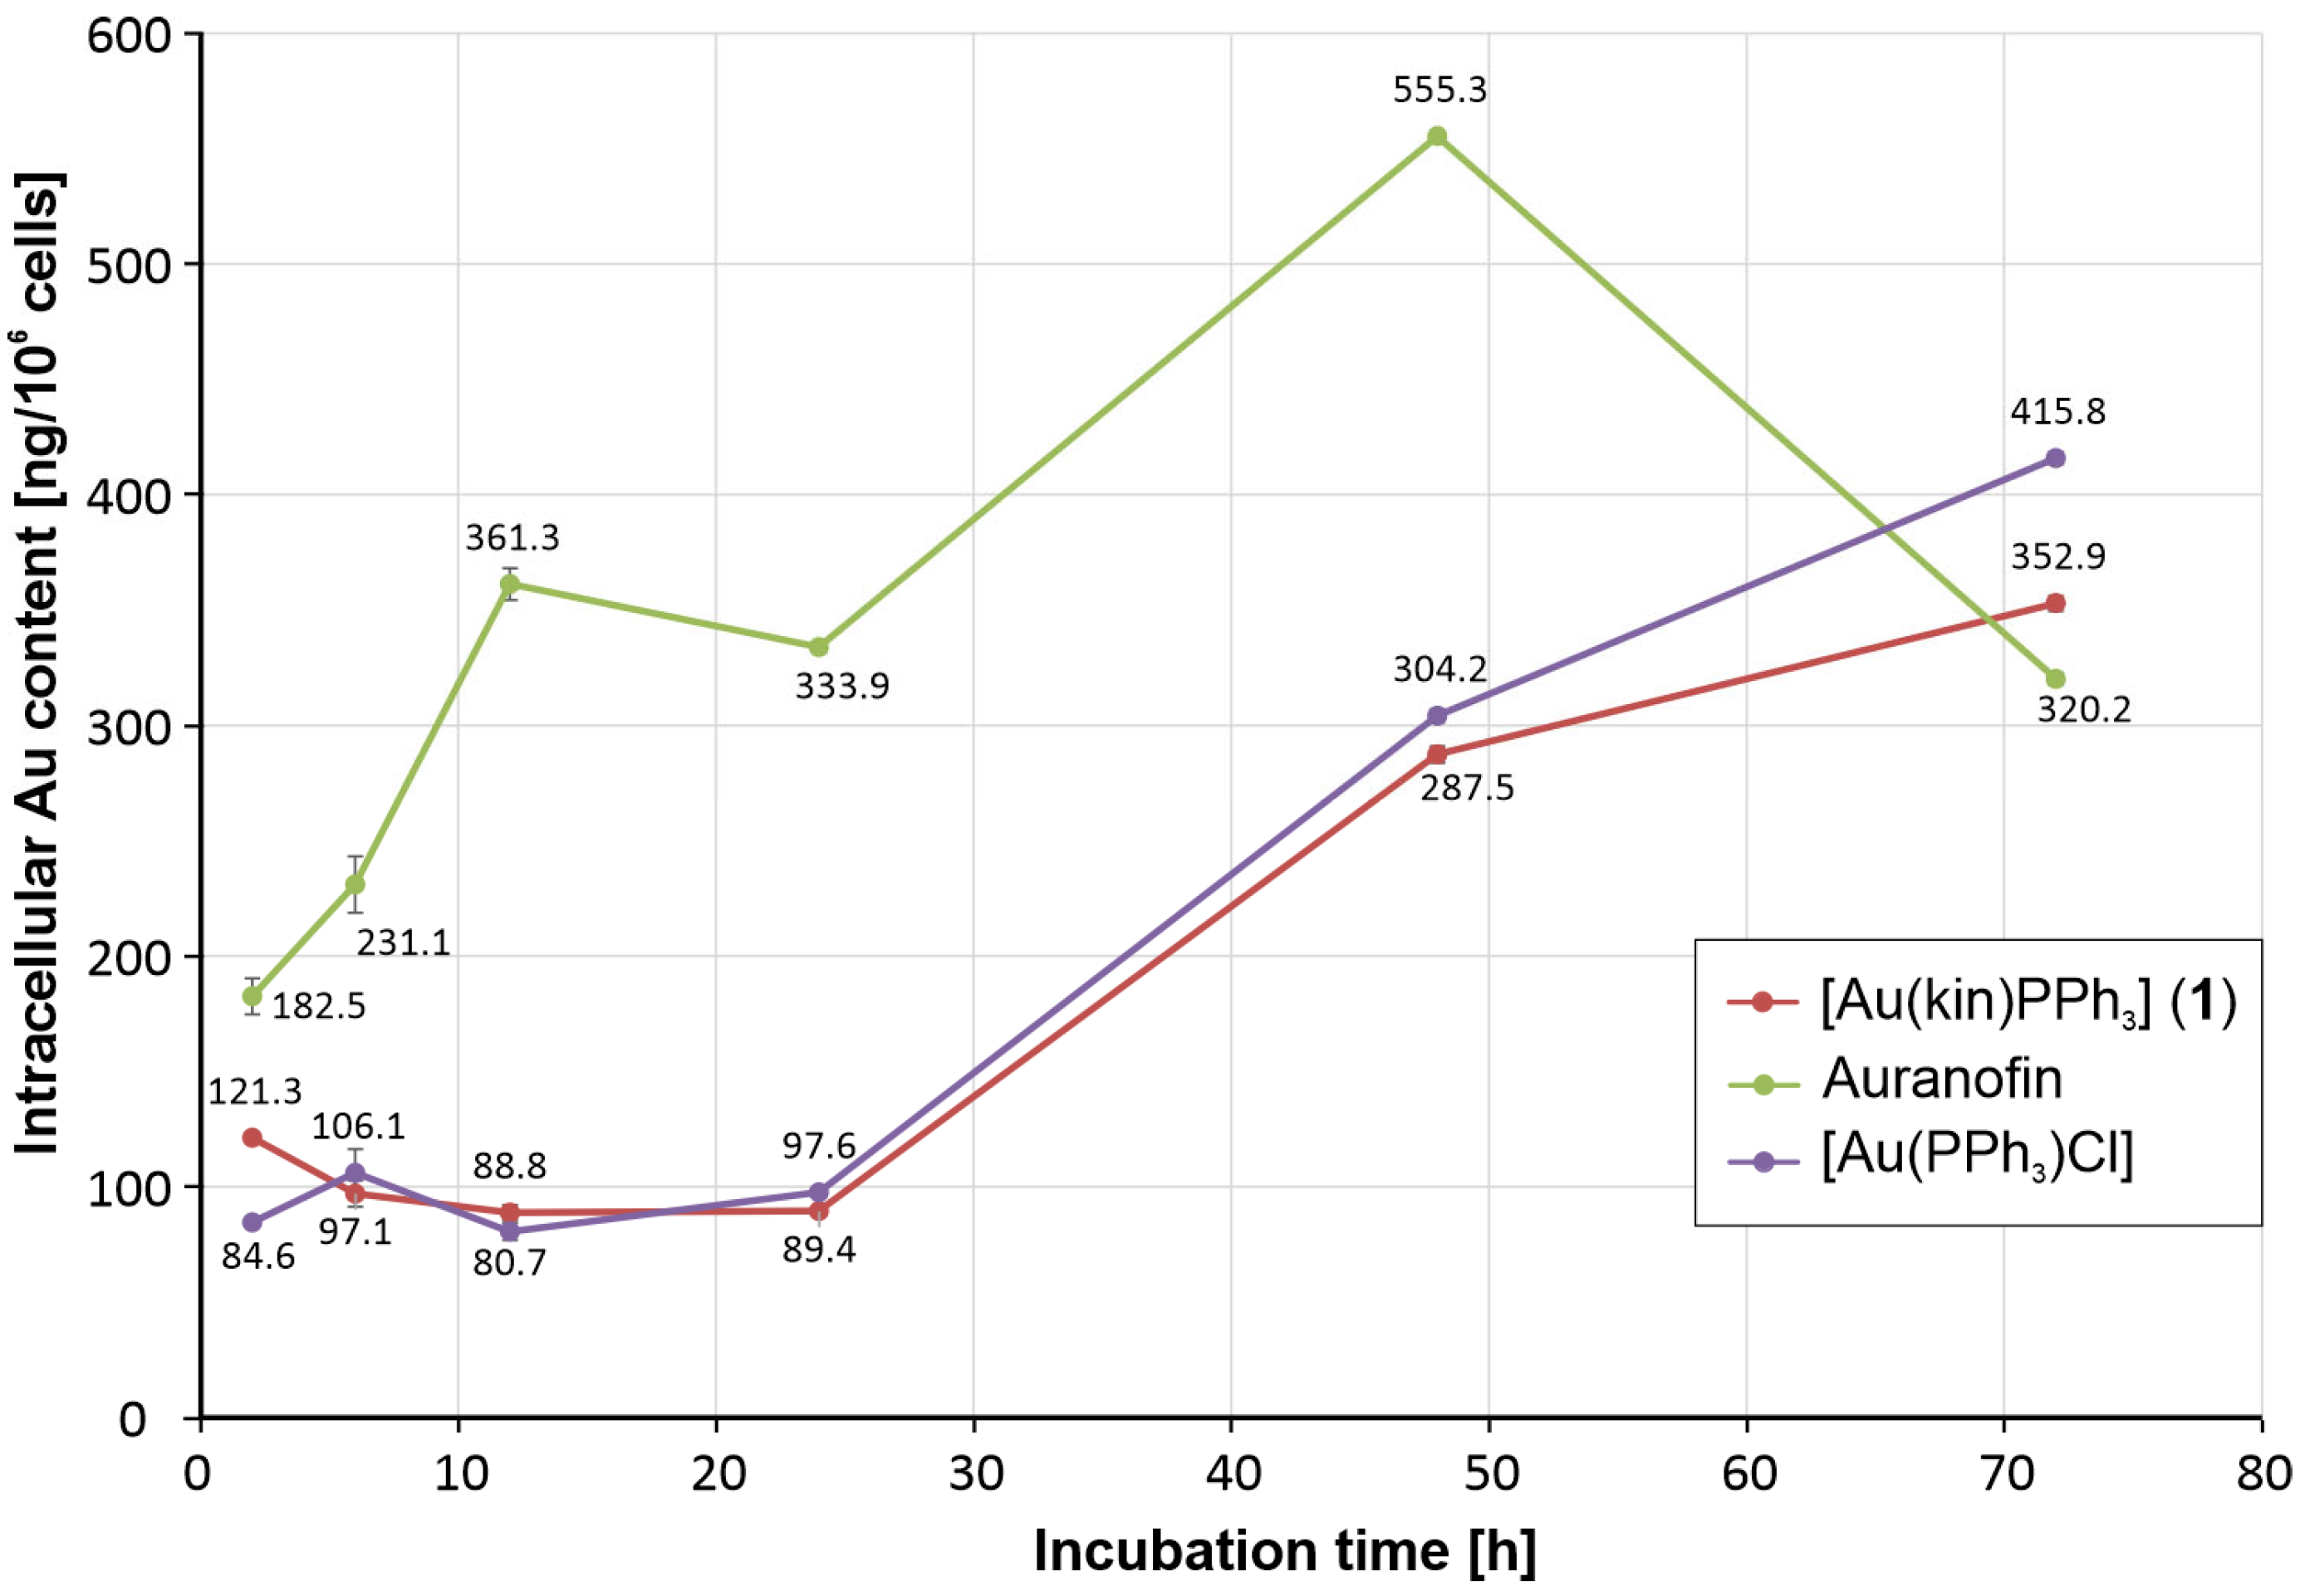
2.4. Time-Dependent In Vitro Cytotoxicity and Cellular Uptake of Gold Complexes in A2780 Cells
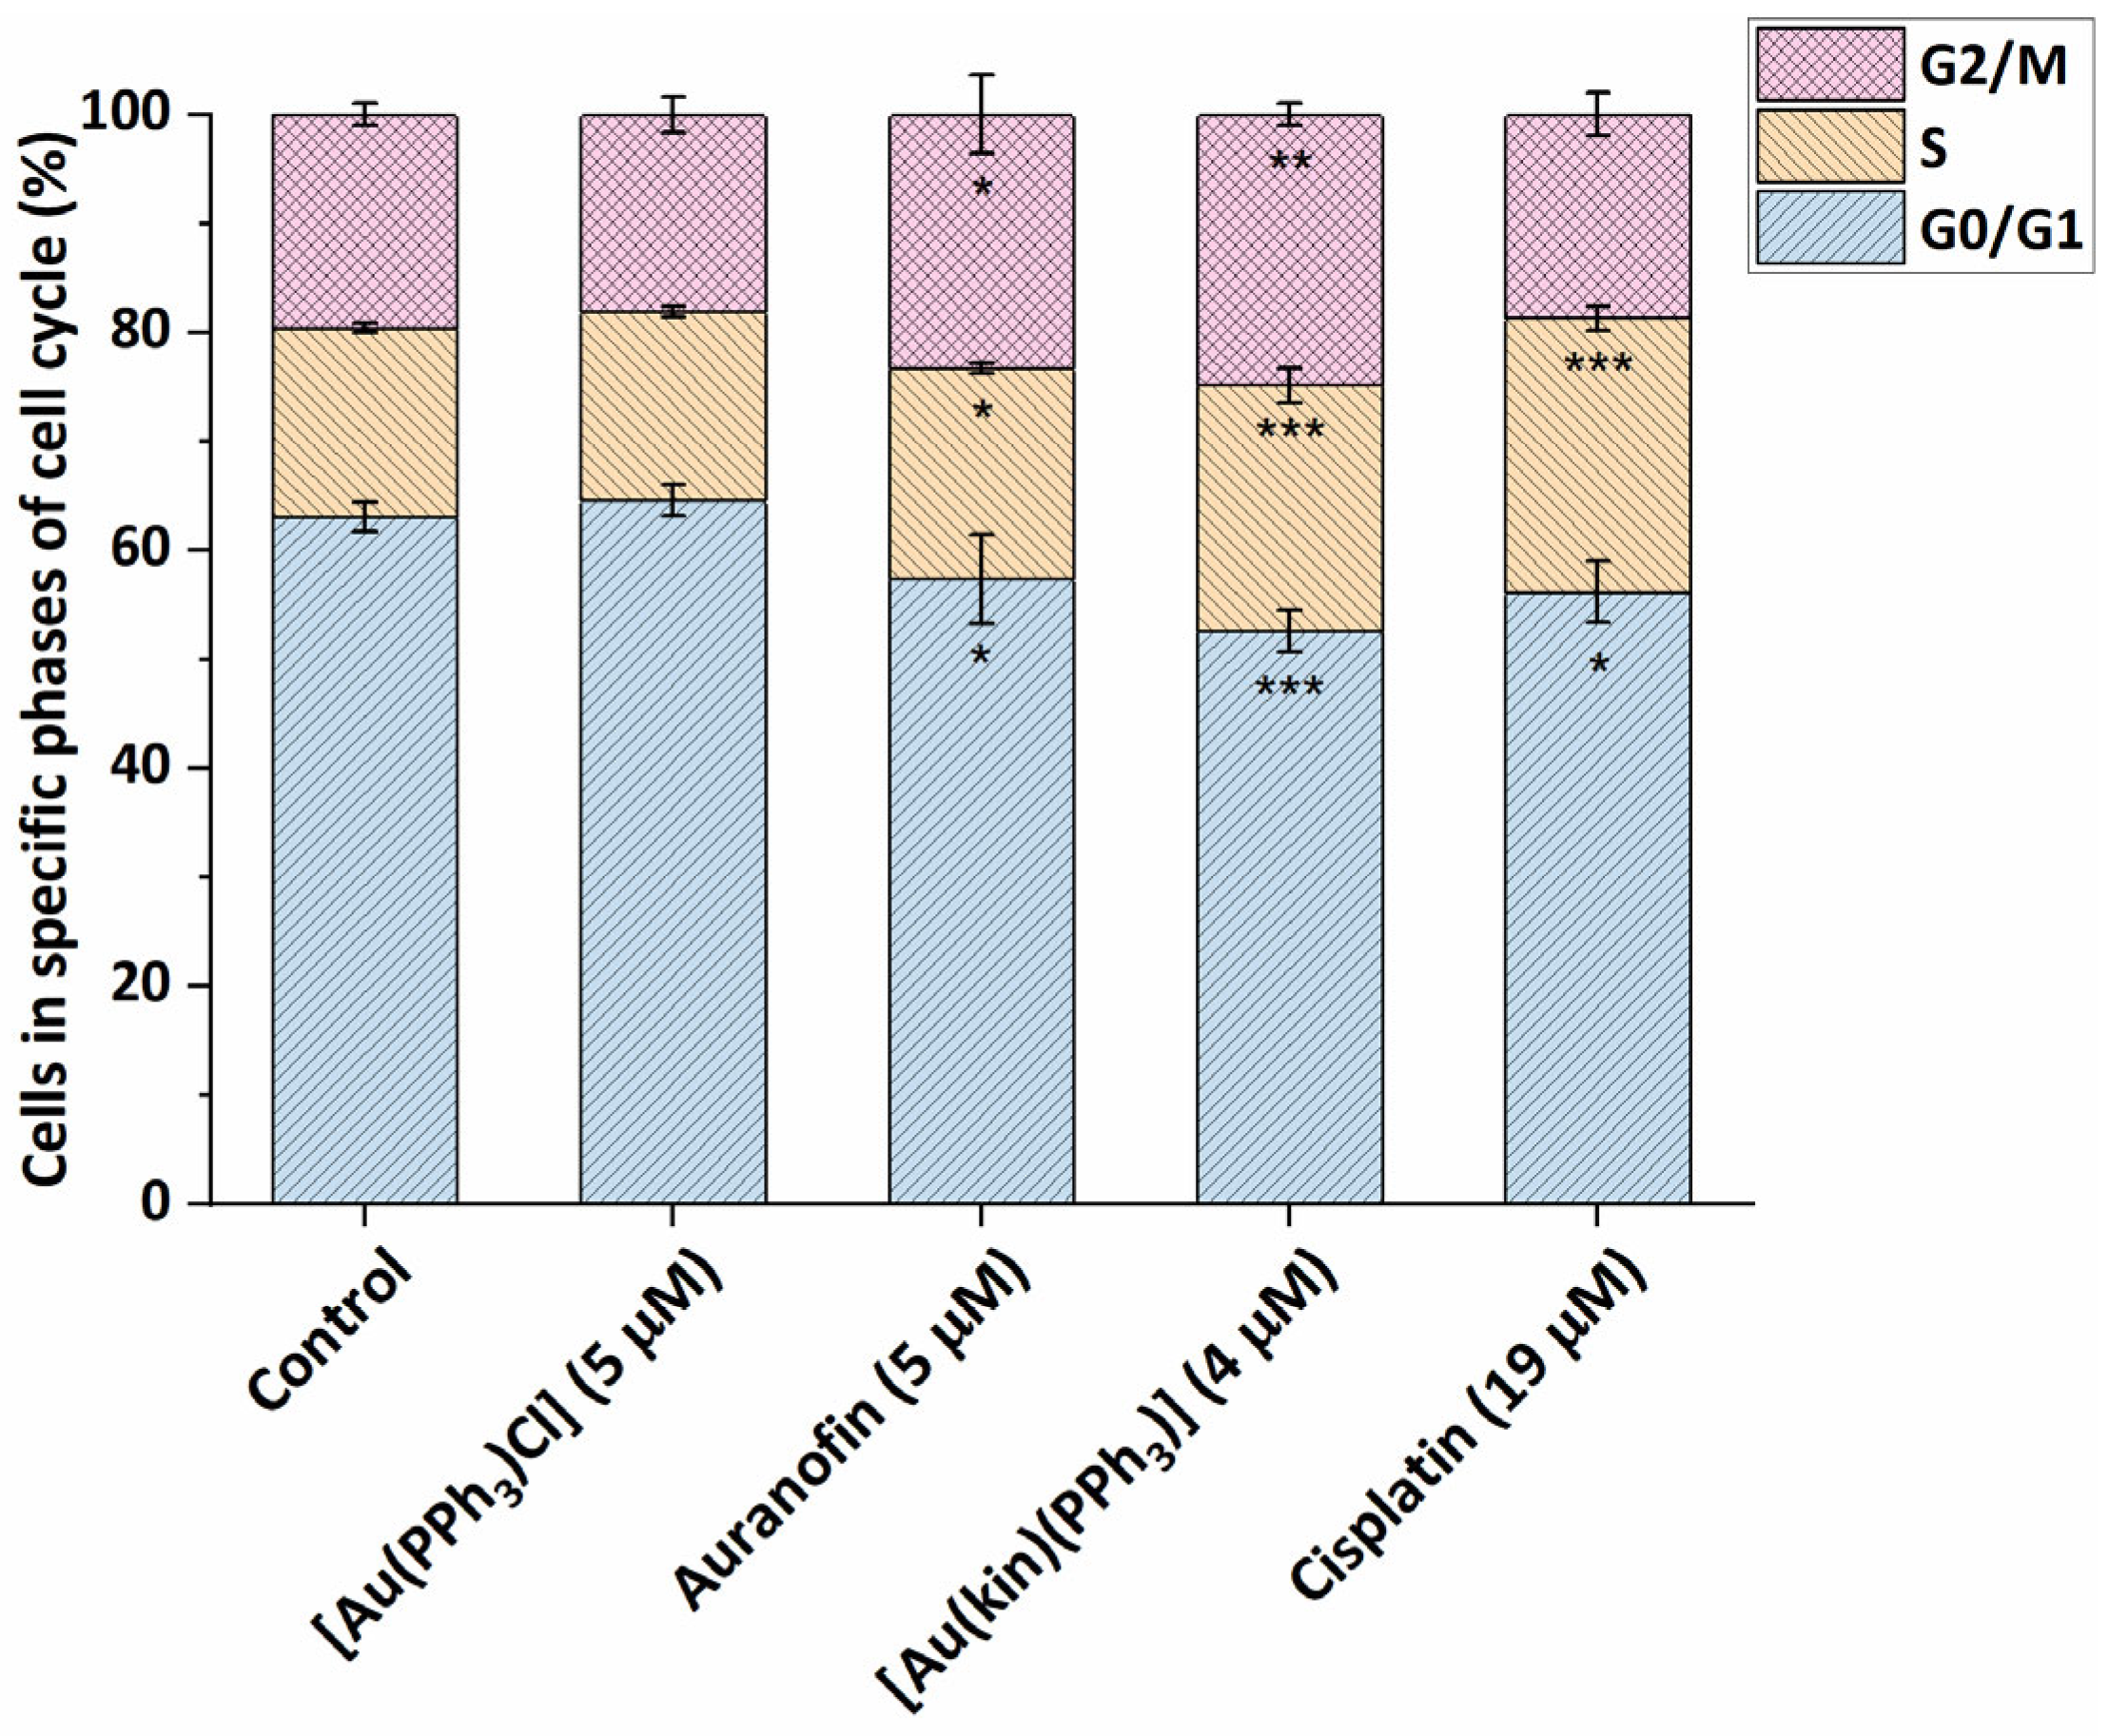
2.5. Modification of A2780 Cell Cycle by the Gold(I) Complexes
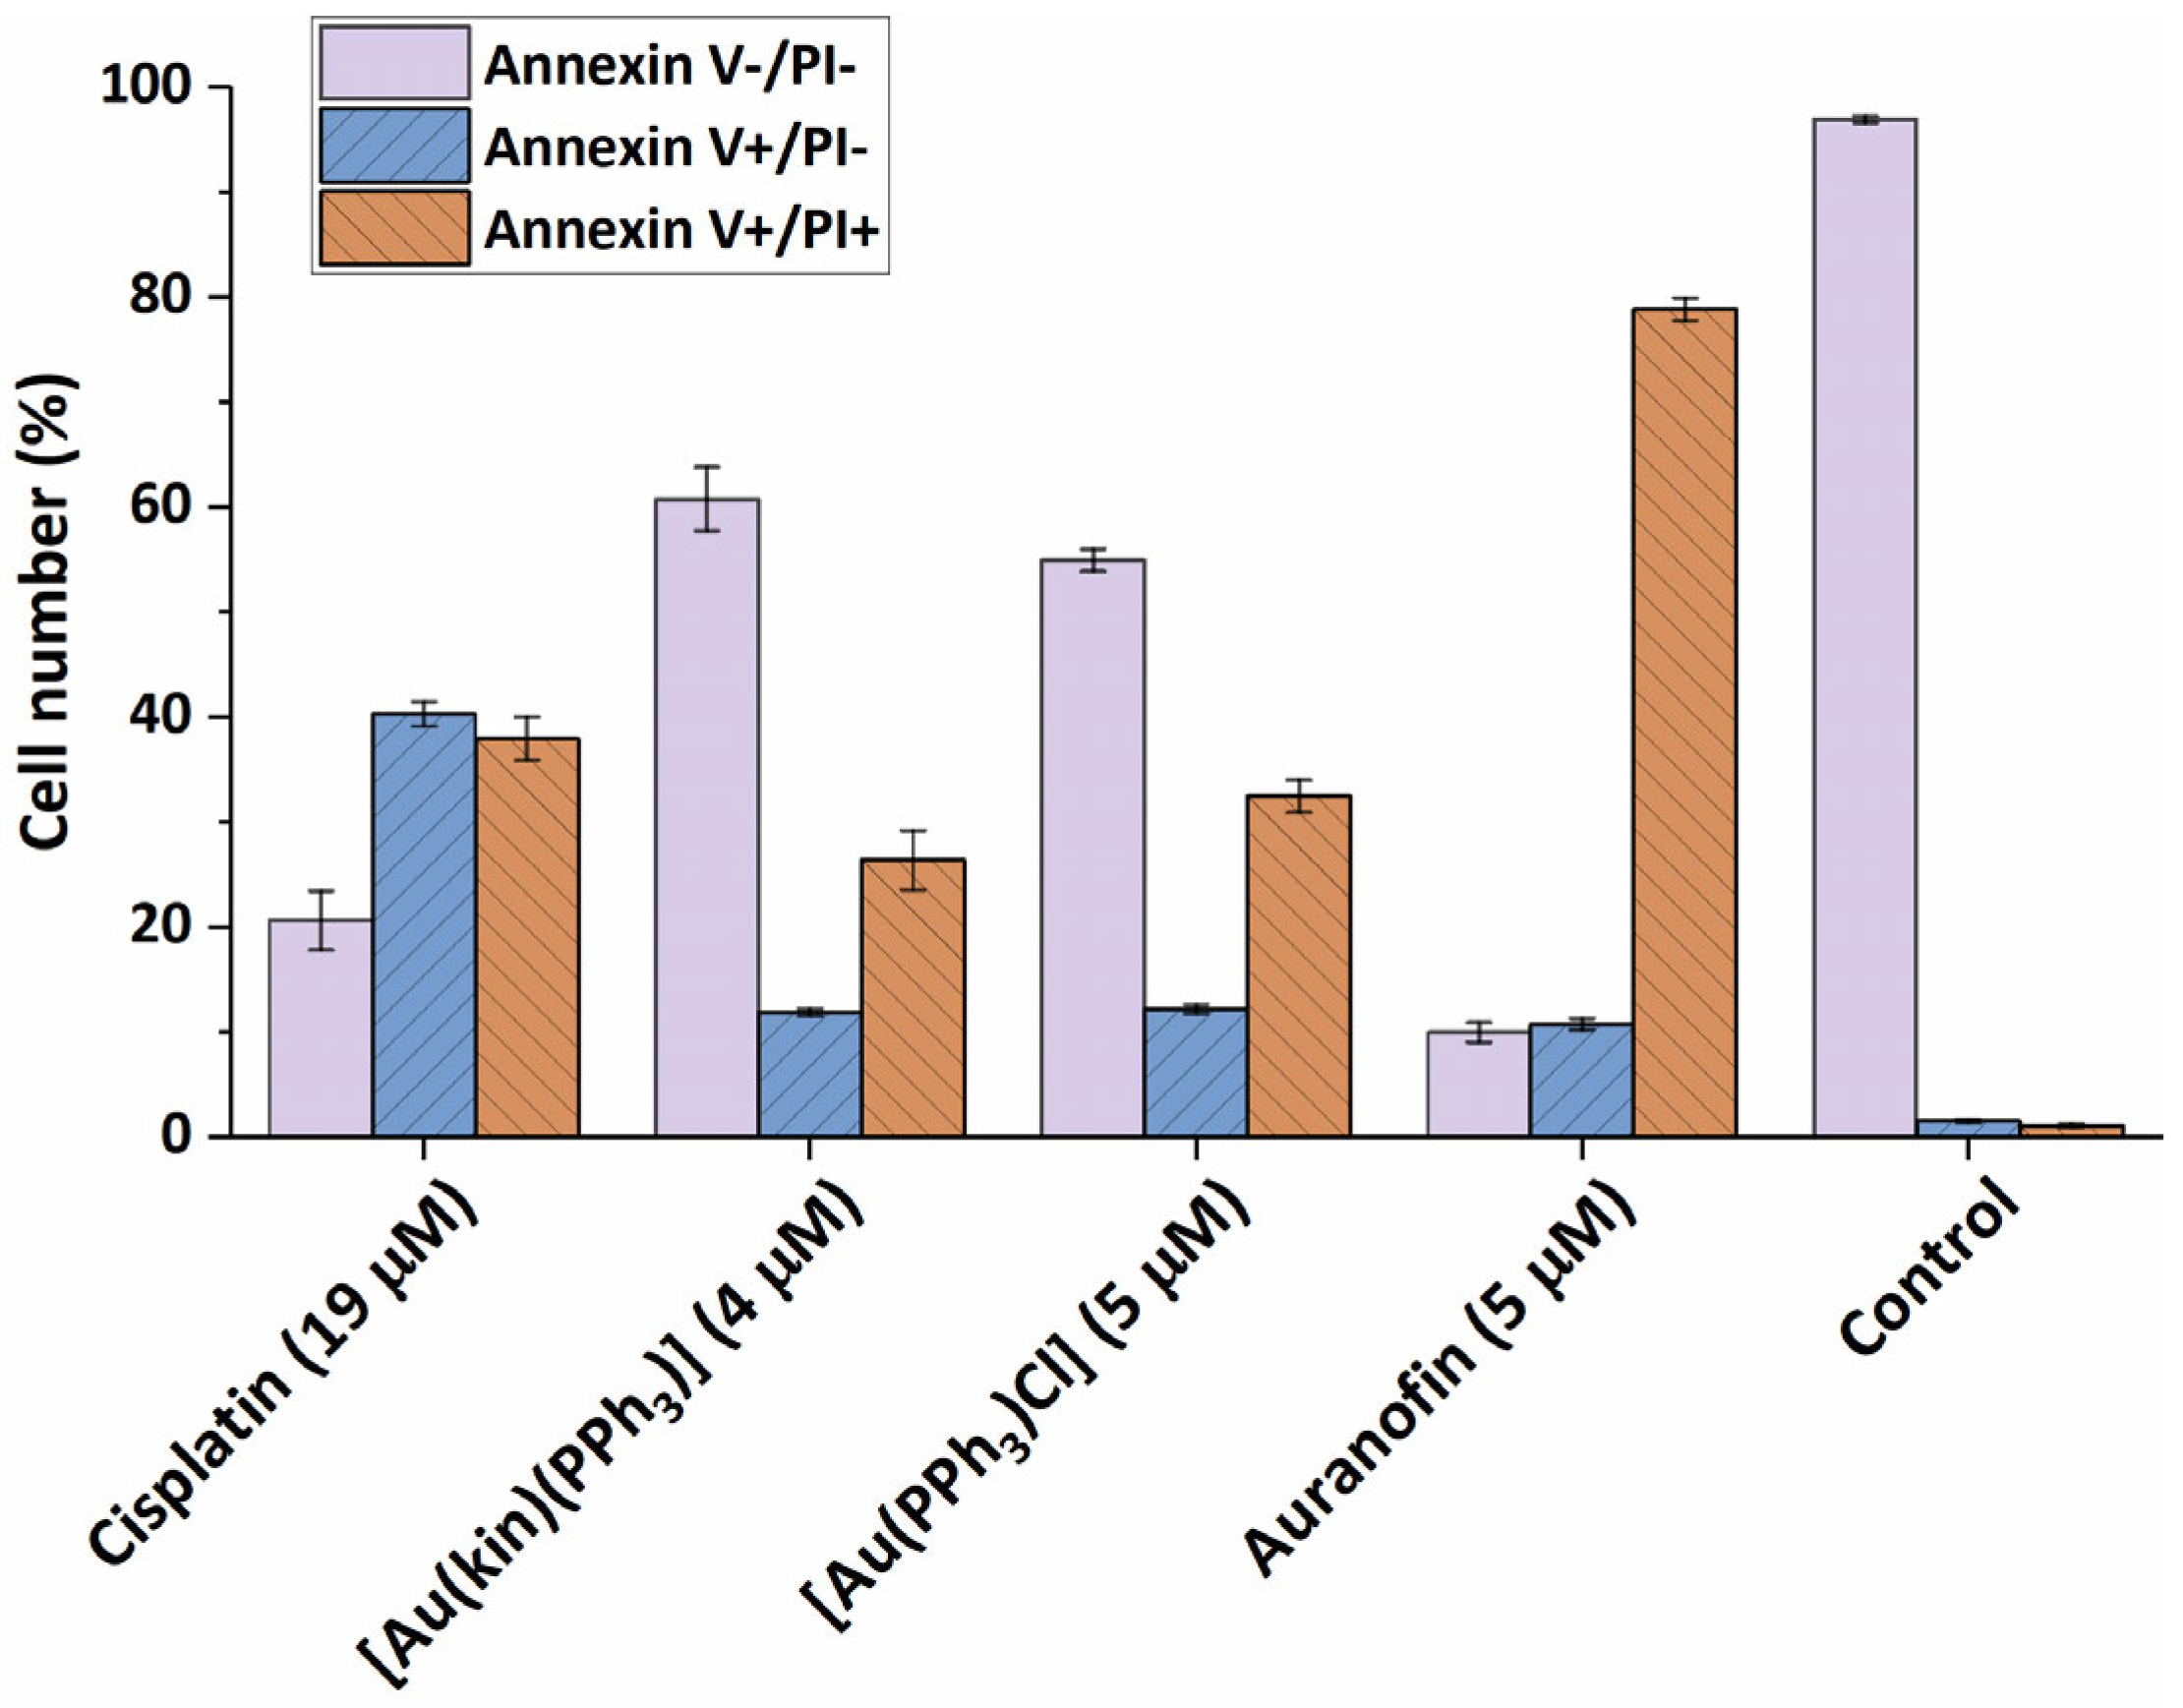
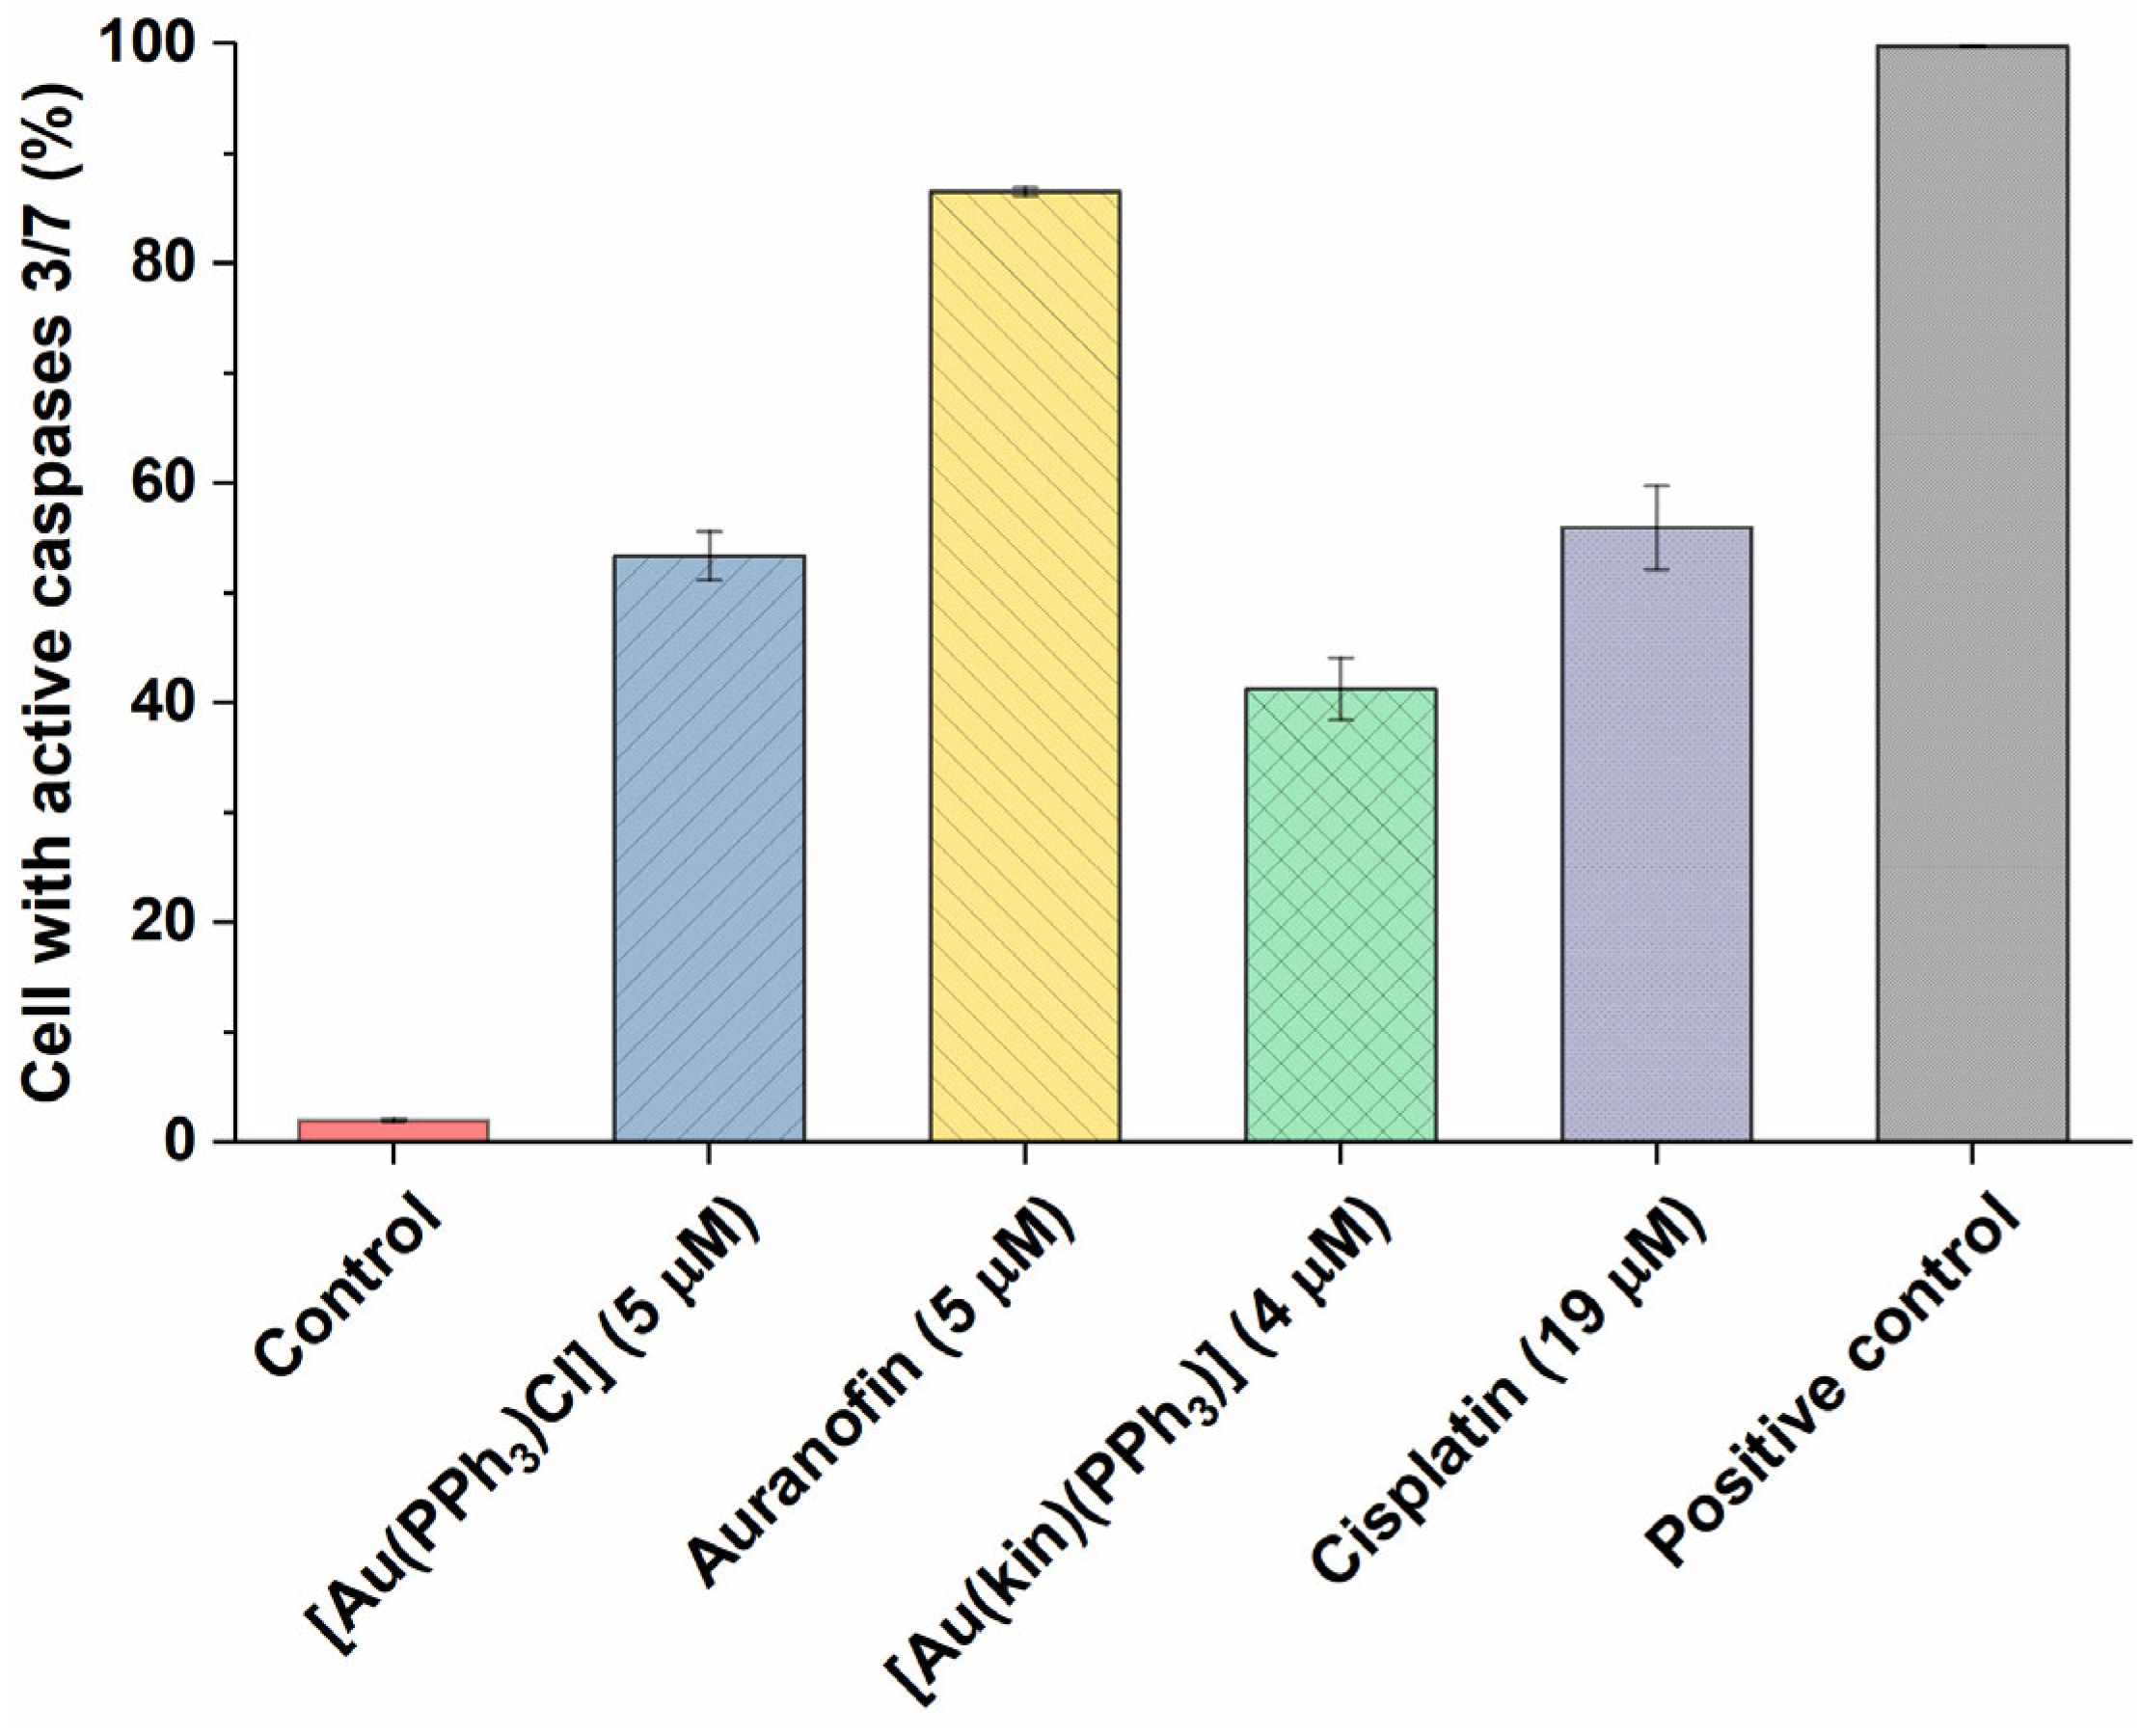
2.6. Induction of Cell Death in A2780 Cells
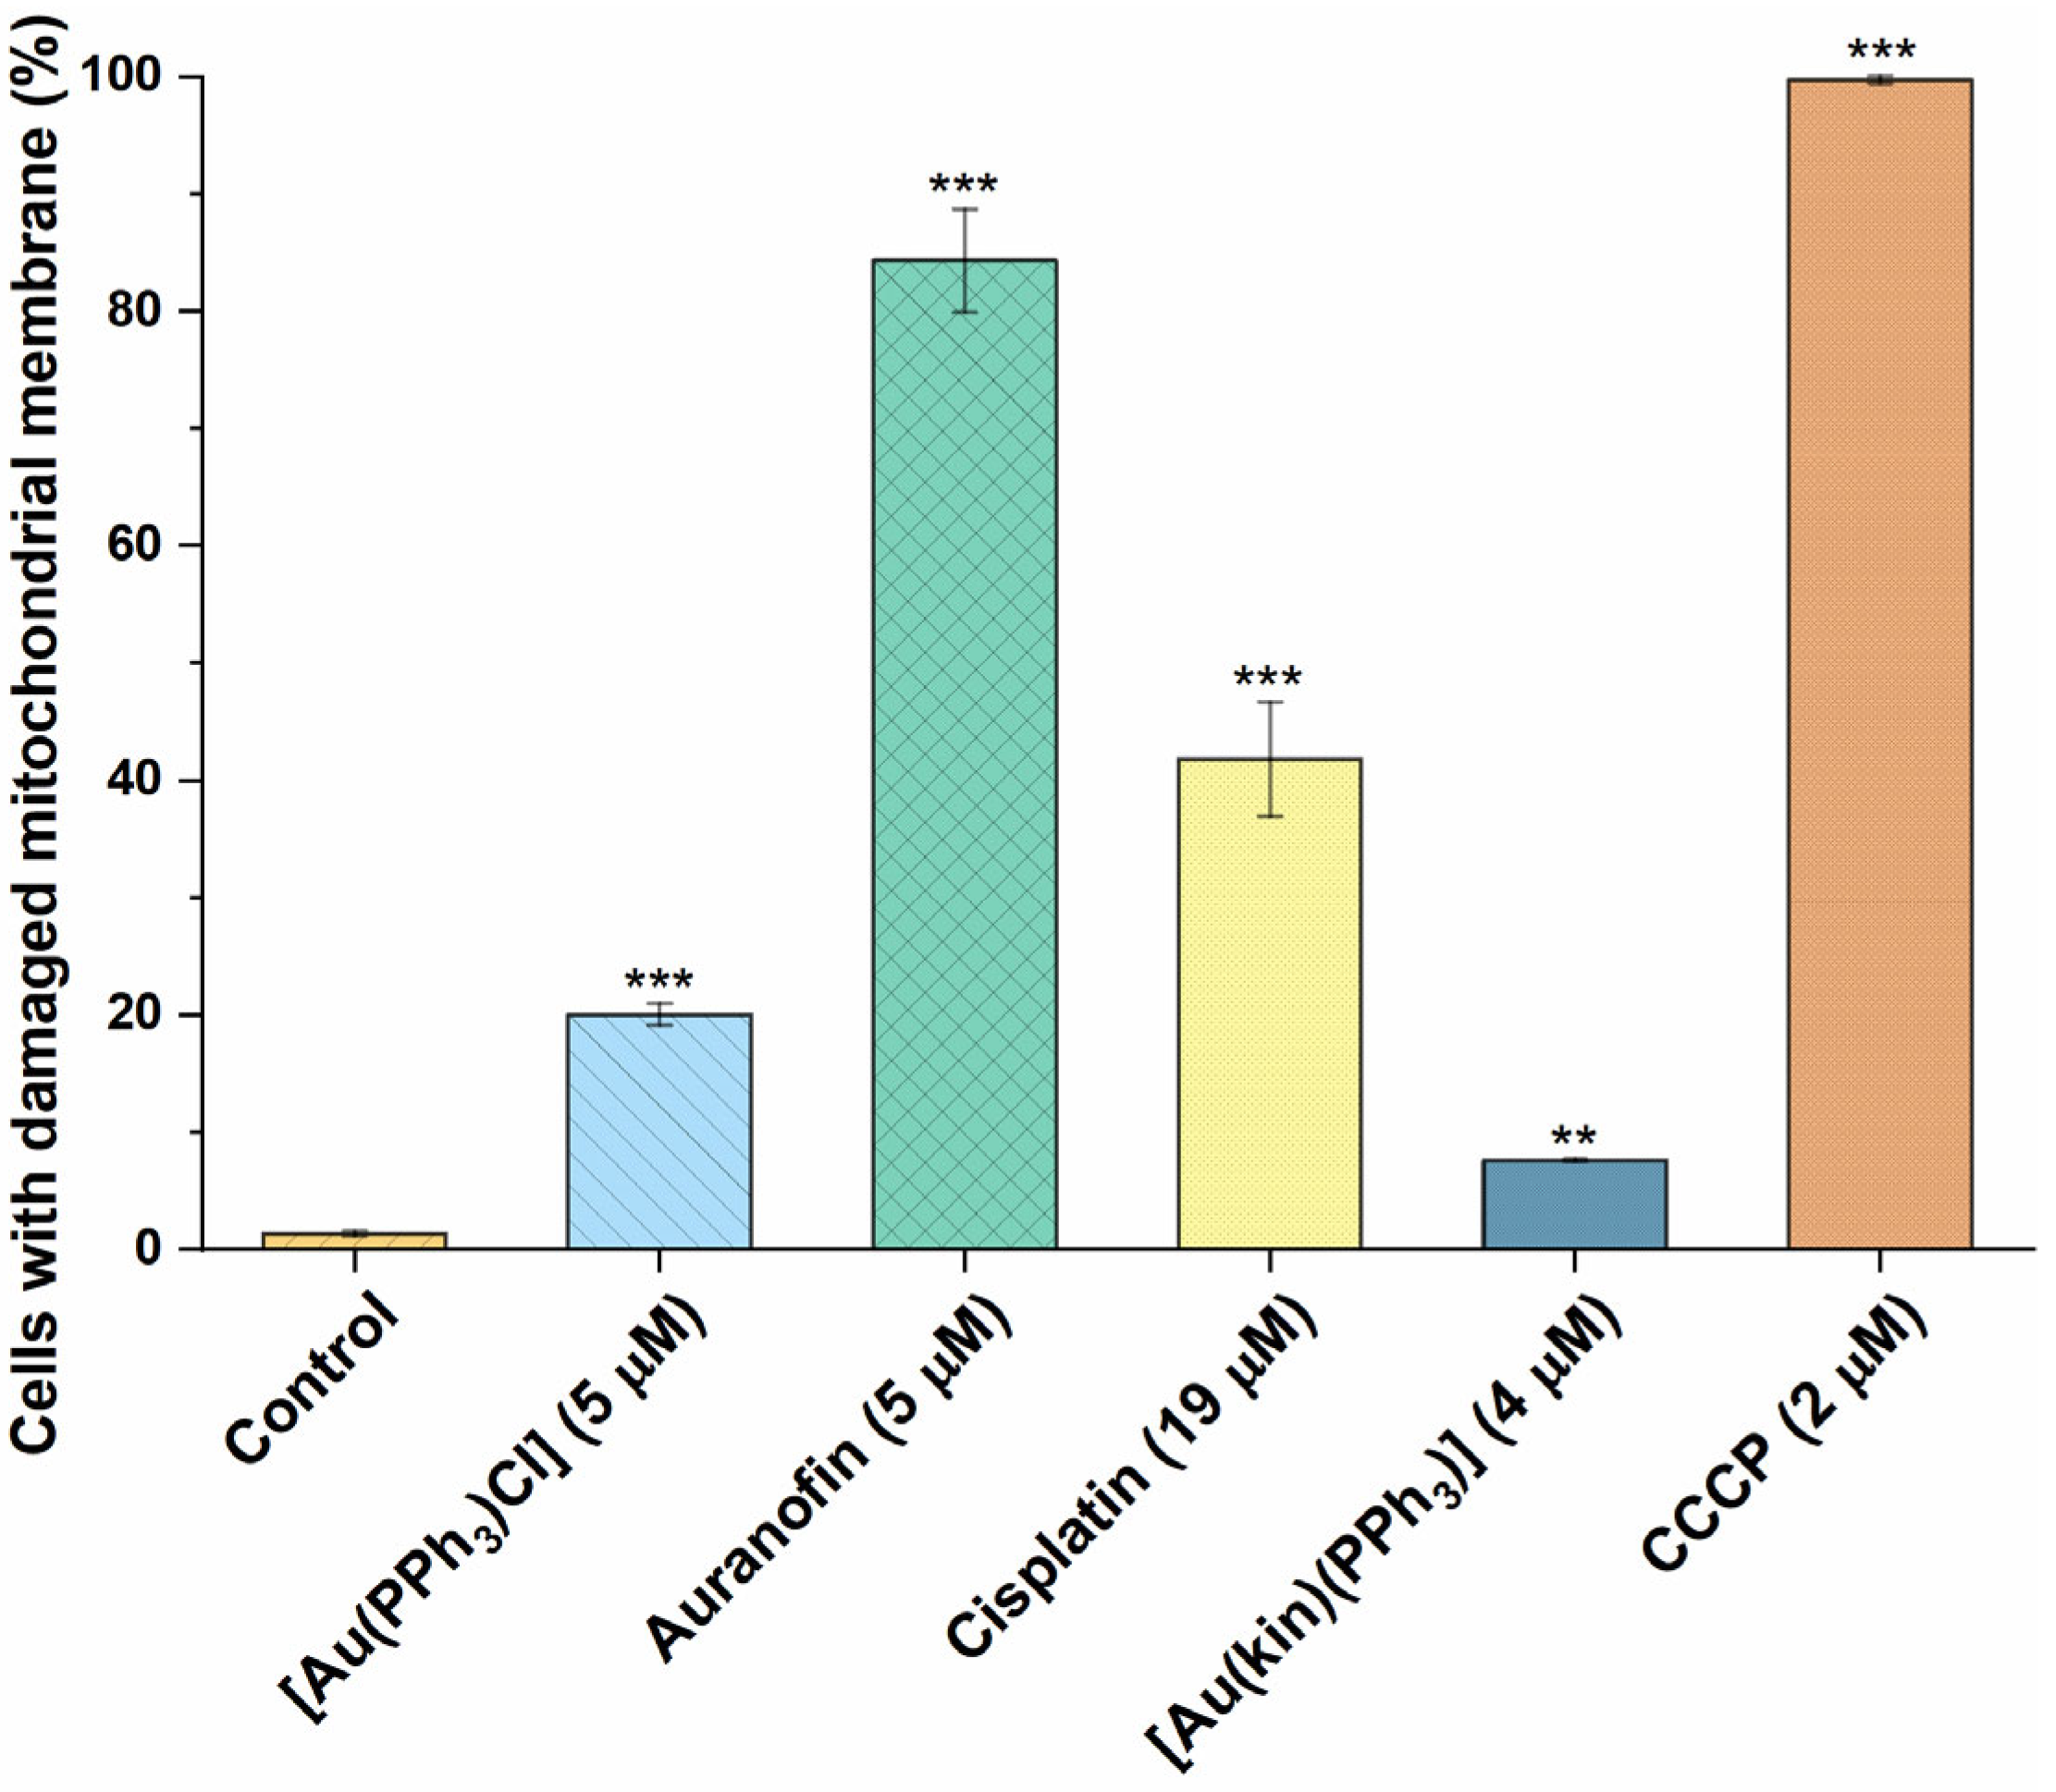
2.7. The Effect of Gold(I) Complexes on Intracellular ROS Levels and Damage to the Mitochondrial Membranes
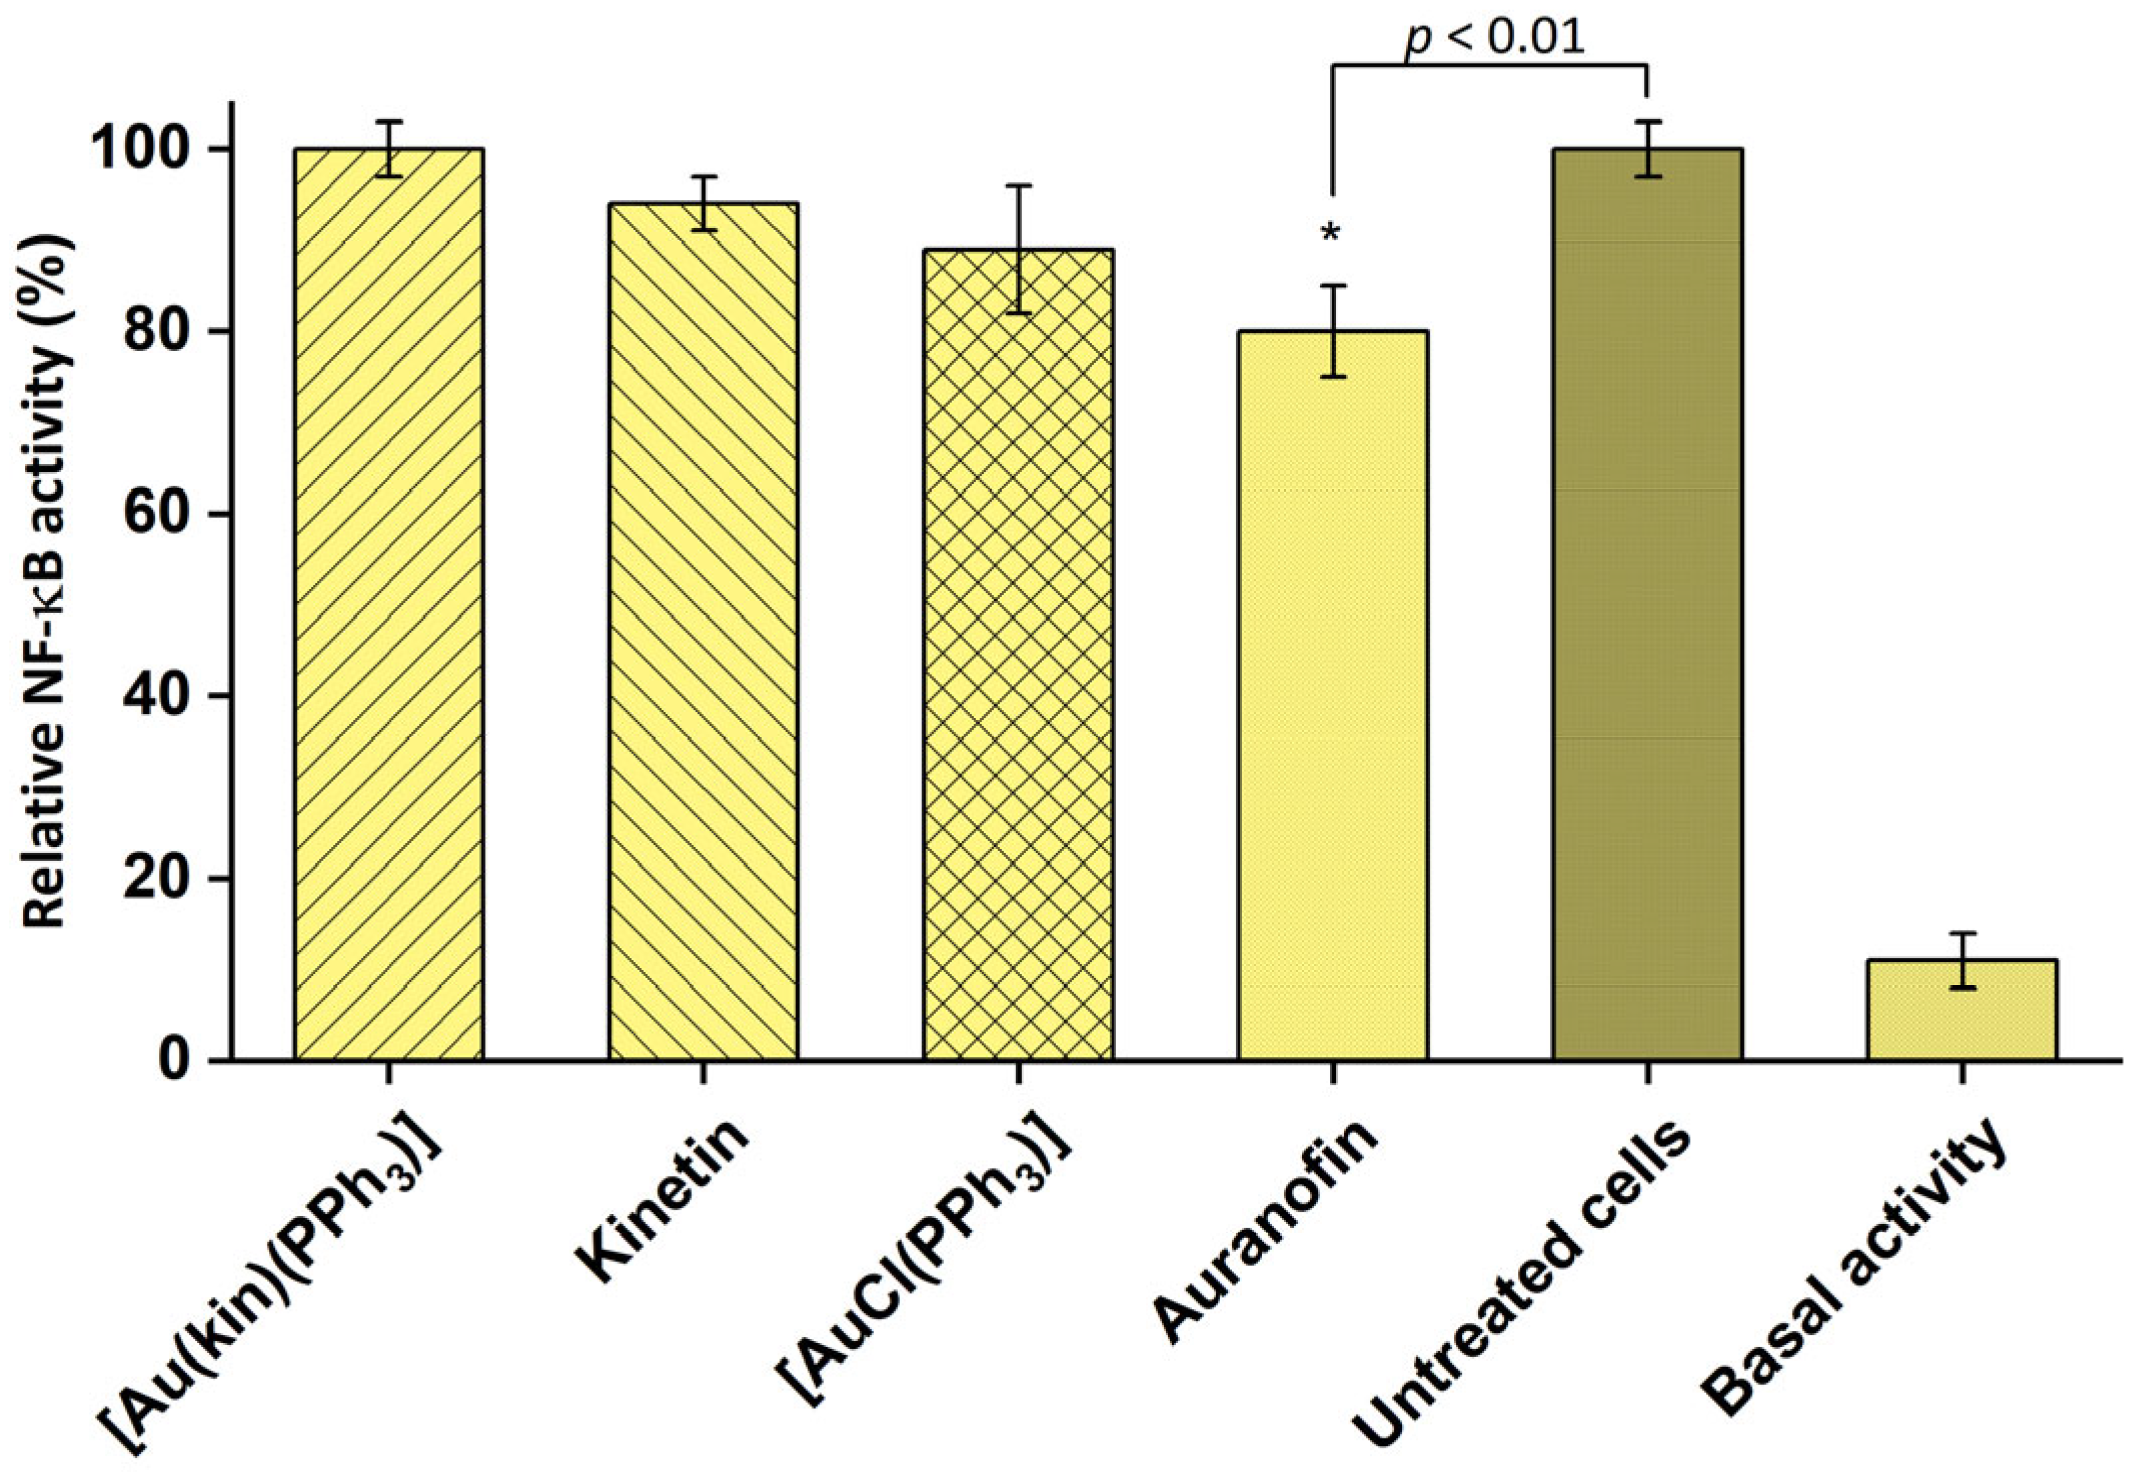
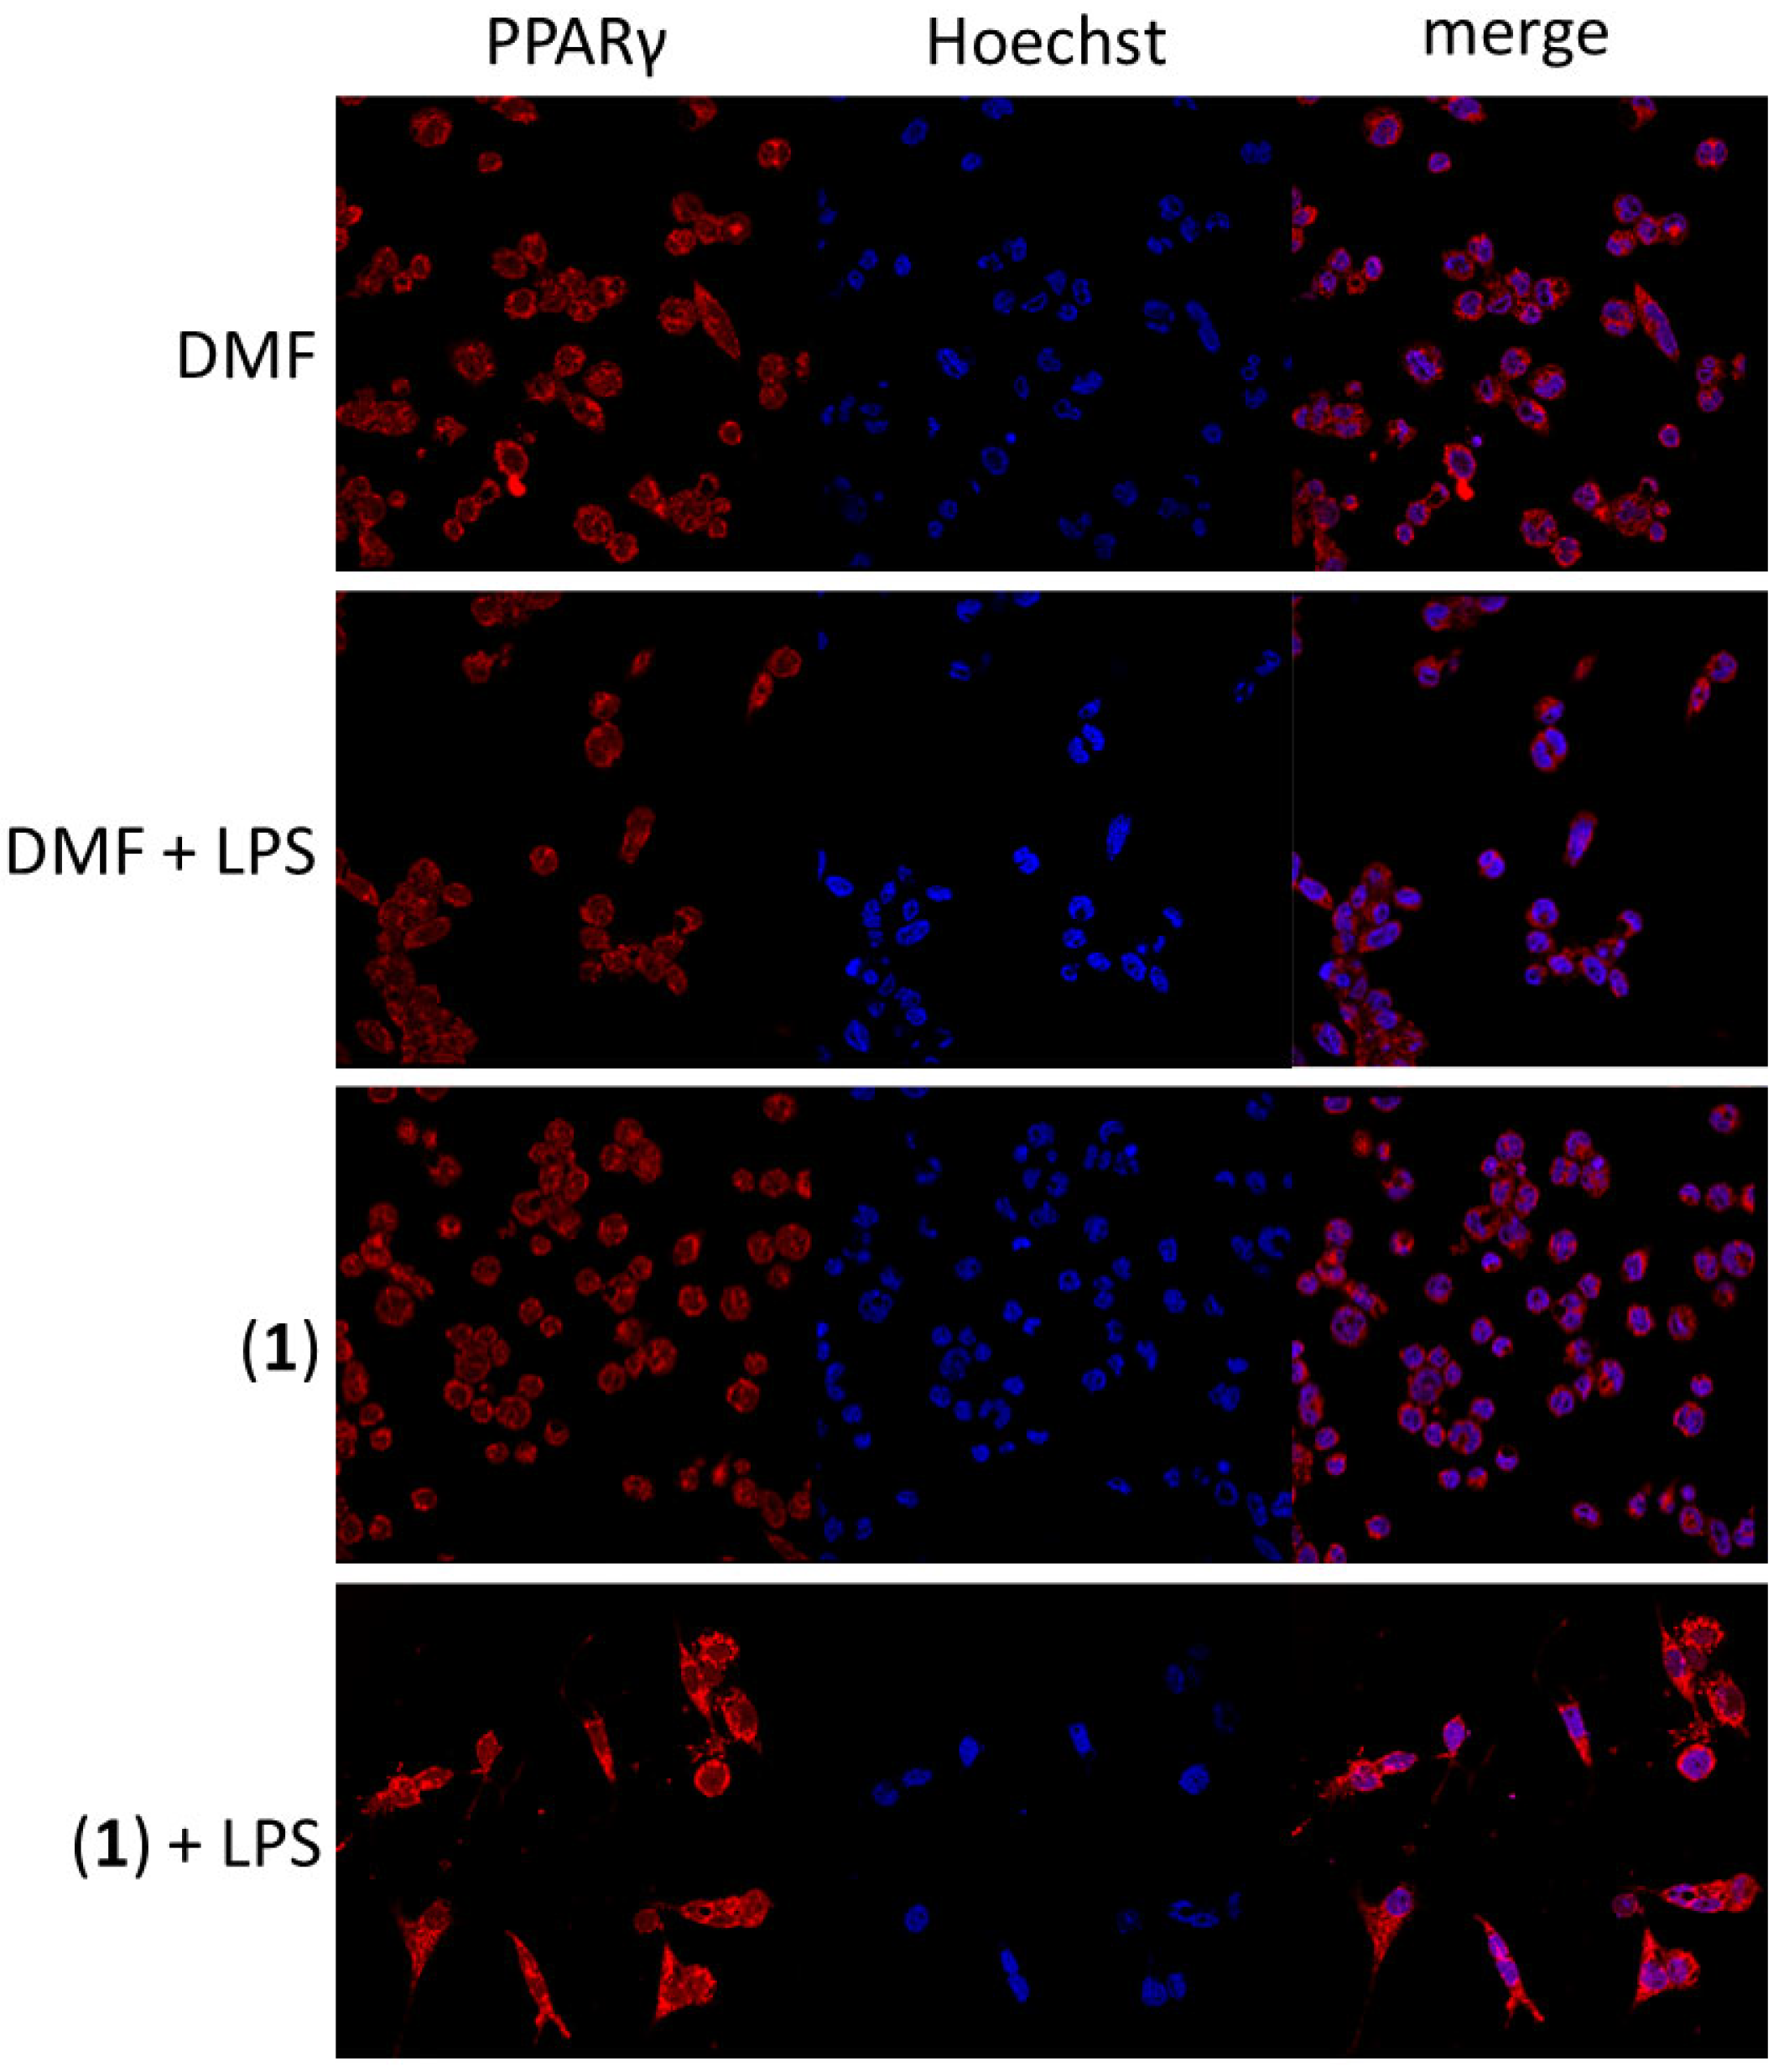
2.8. The Effect on NF-κB Activity Induced by LPS and PPARγ
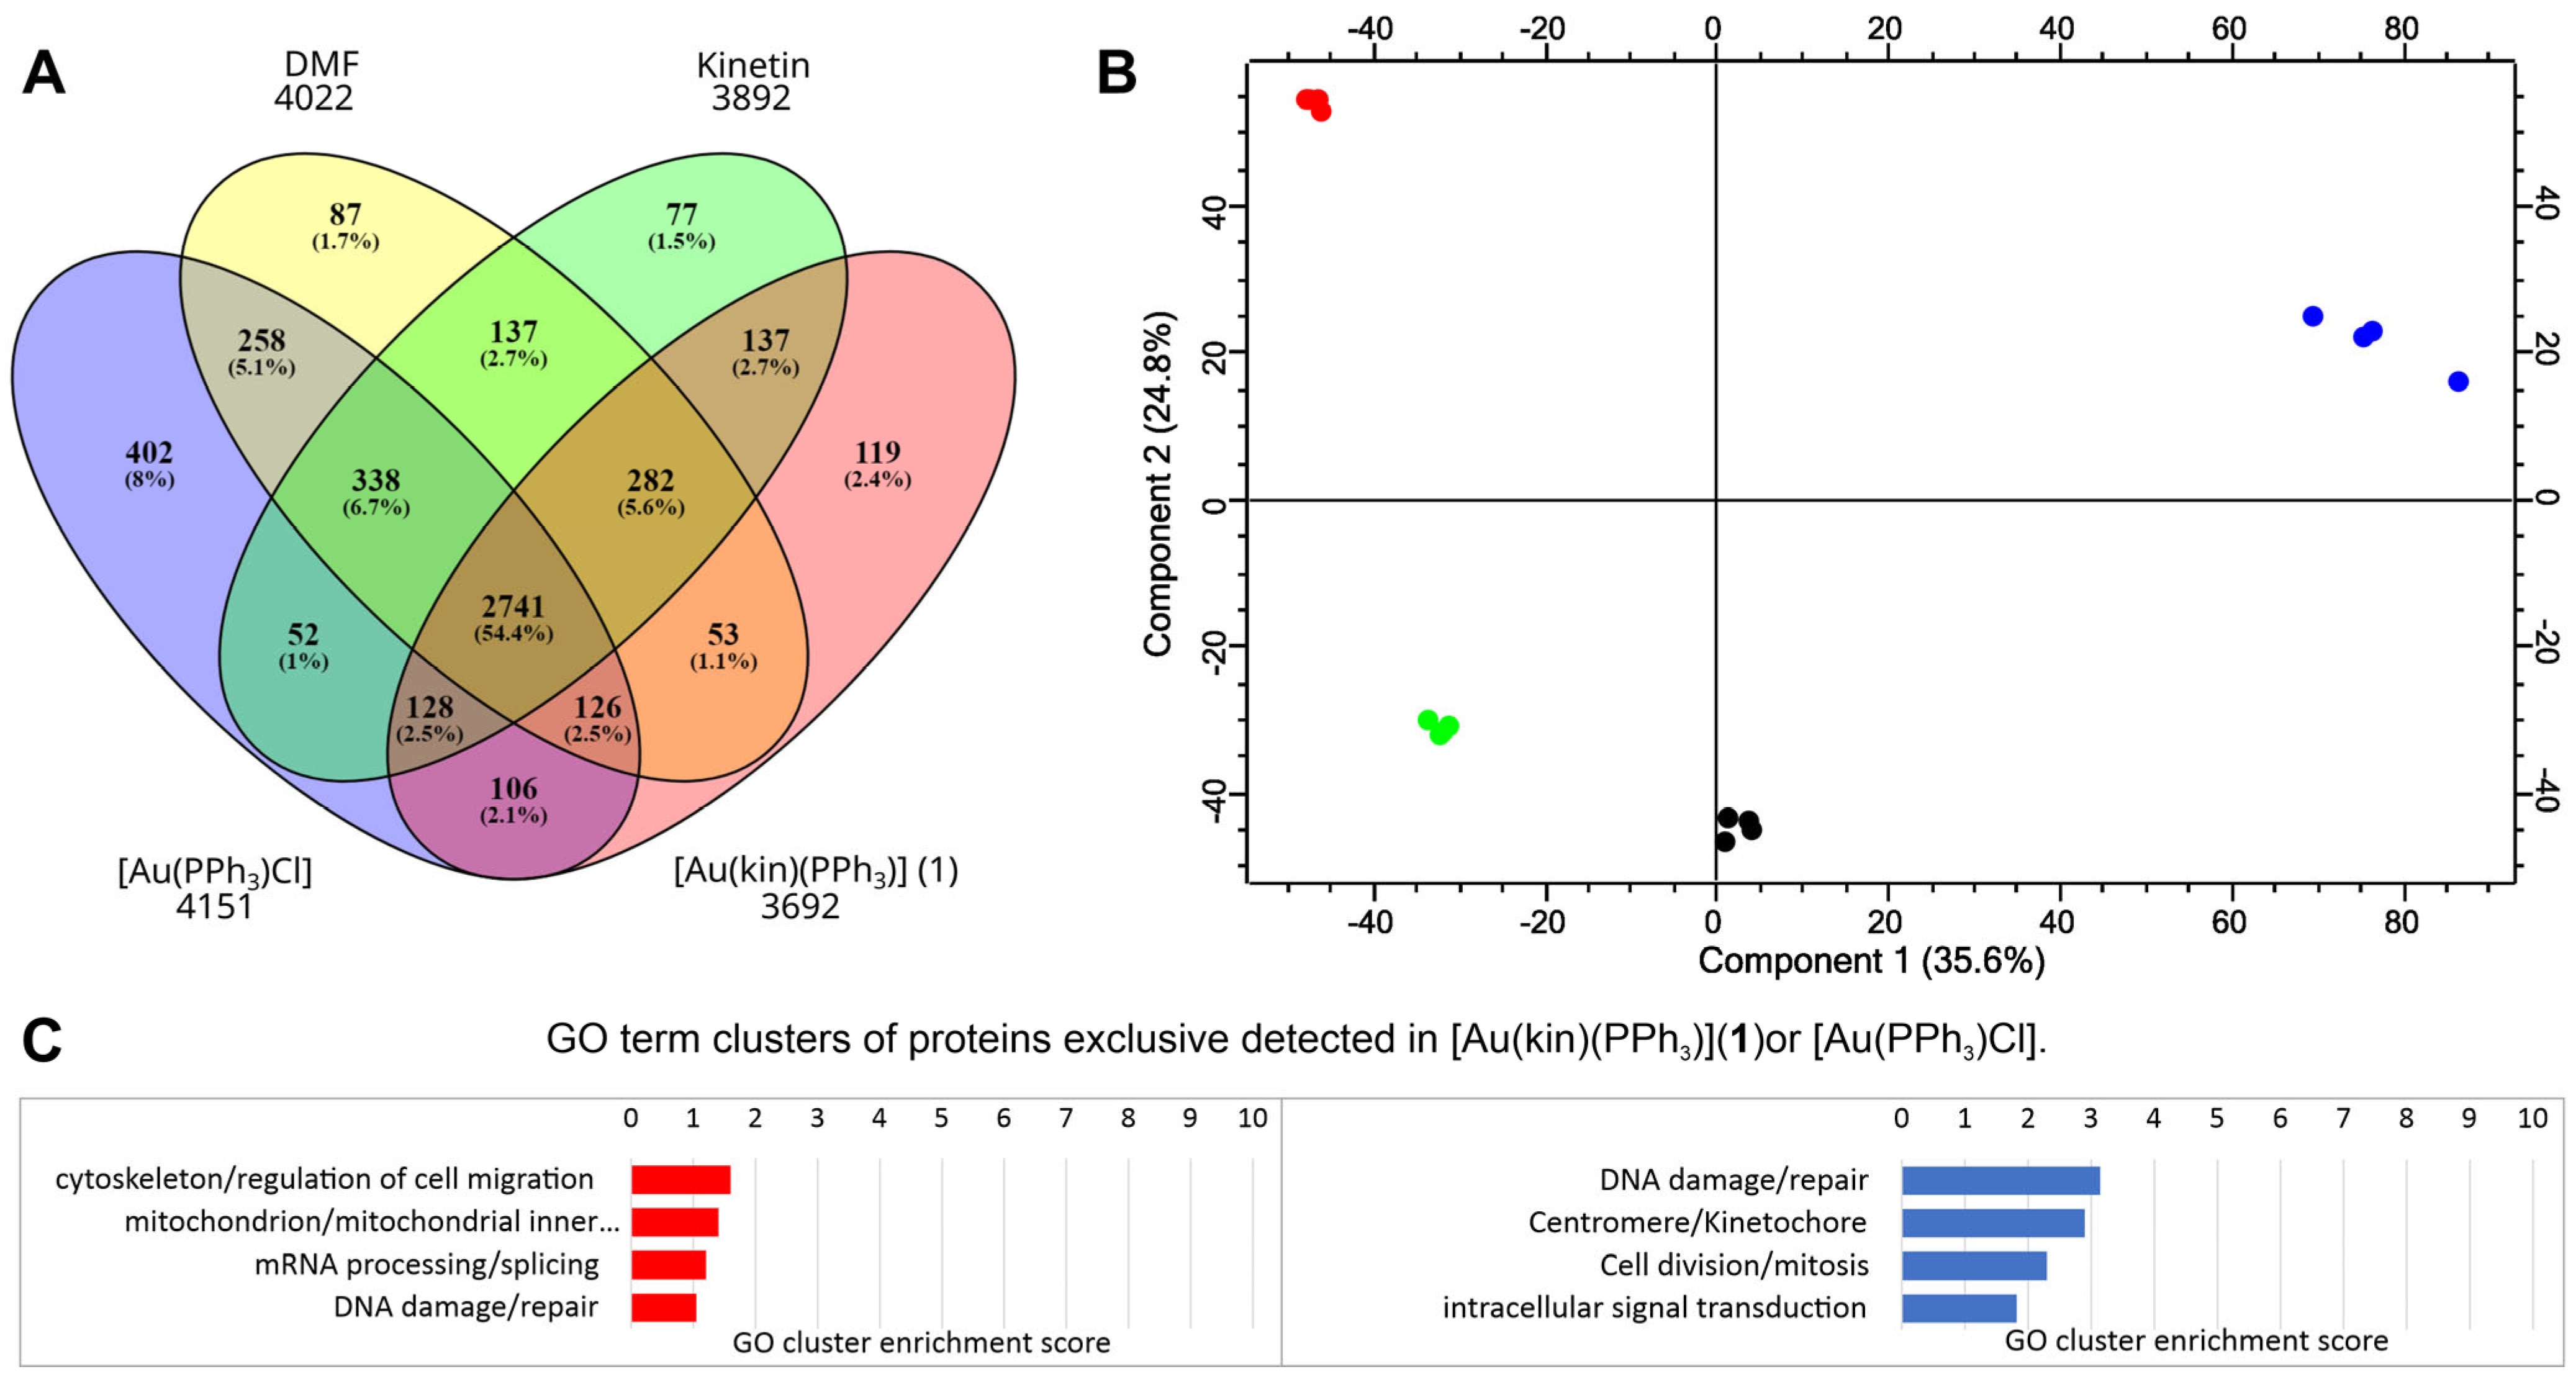
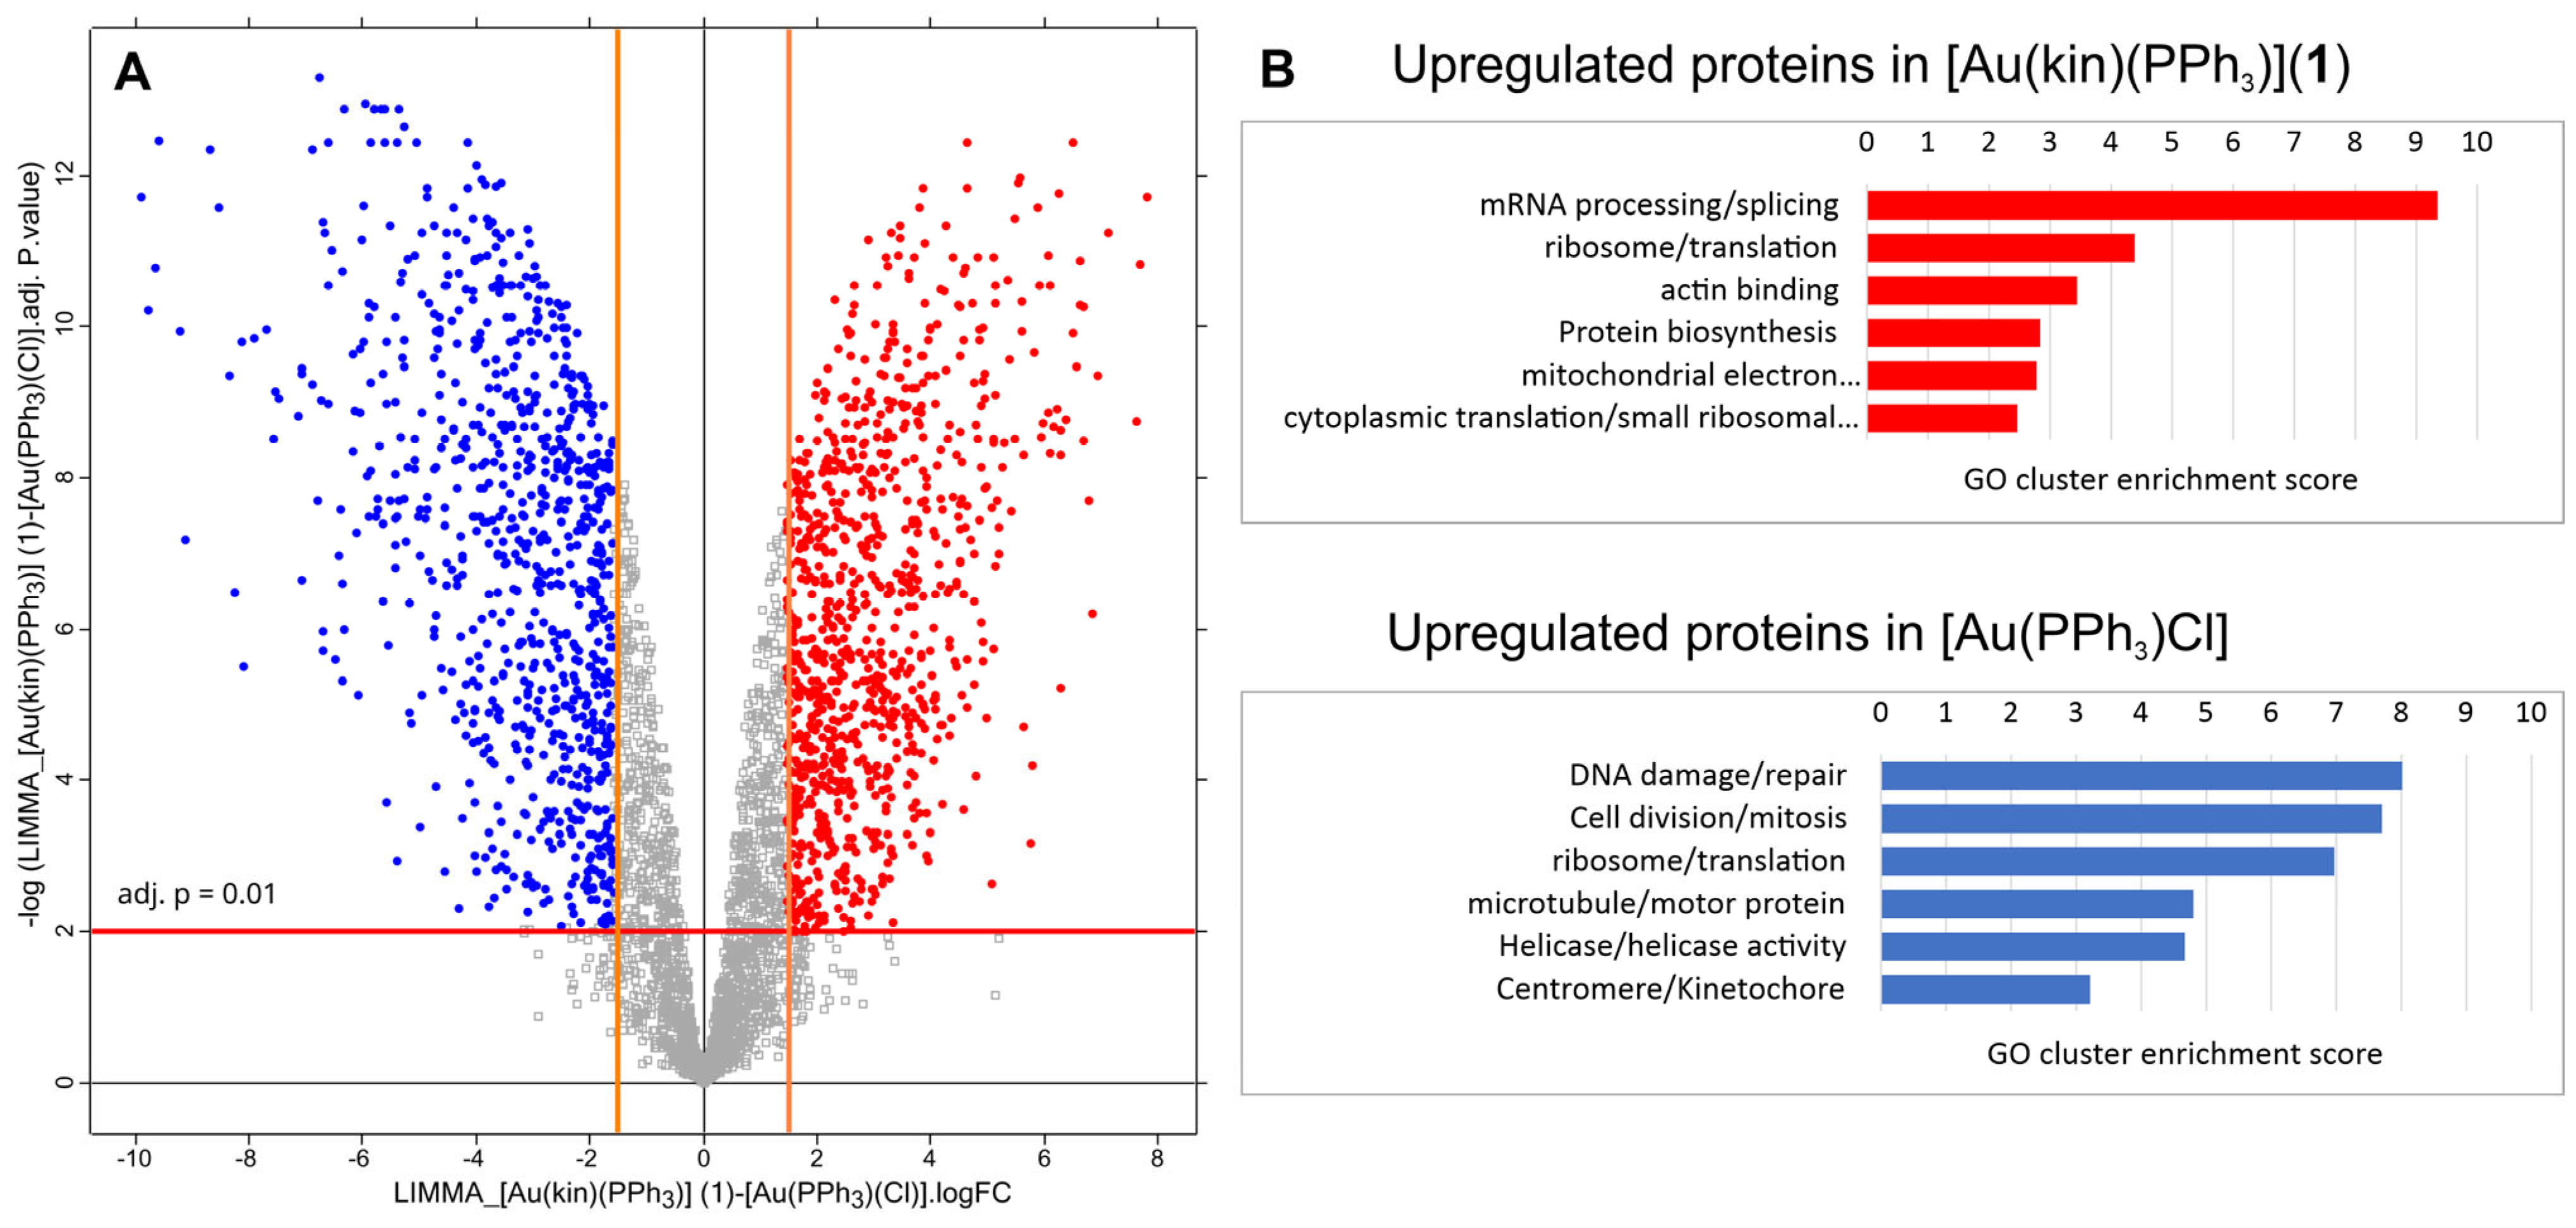
2.9. Proteomic Analysis of Gold(I) Complexes [Au(kin)(PPh3)] (1) and [Au(PPh3)Cl] on Changes in the Proteome of R2780 Cells
3. Materials and Methods
3.1. General Methods Used for Characterization
3.2. Materials
3.3. Preparation and Characterization of the Complex (1)
3.4. Single-Crystal X-ray Diffraction Analysis
3.5. In Vitro Cytotoxicity against Human Cancerous and Normal Cell Lines
3.6. Cell Cycle Analysis
3.7. Induction of Cell Death and Related Processes
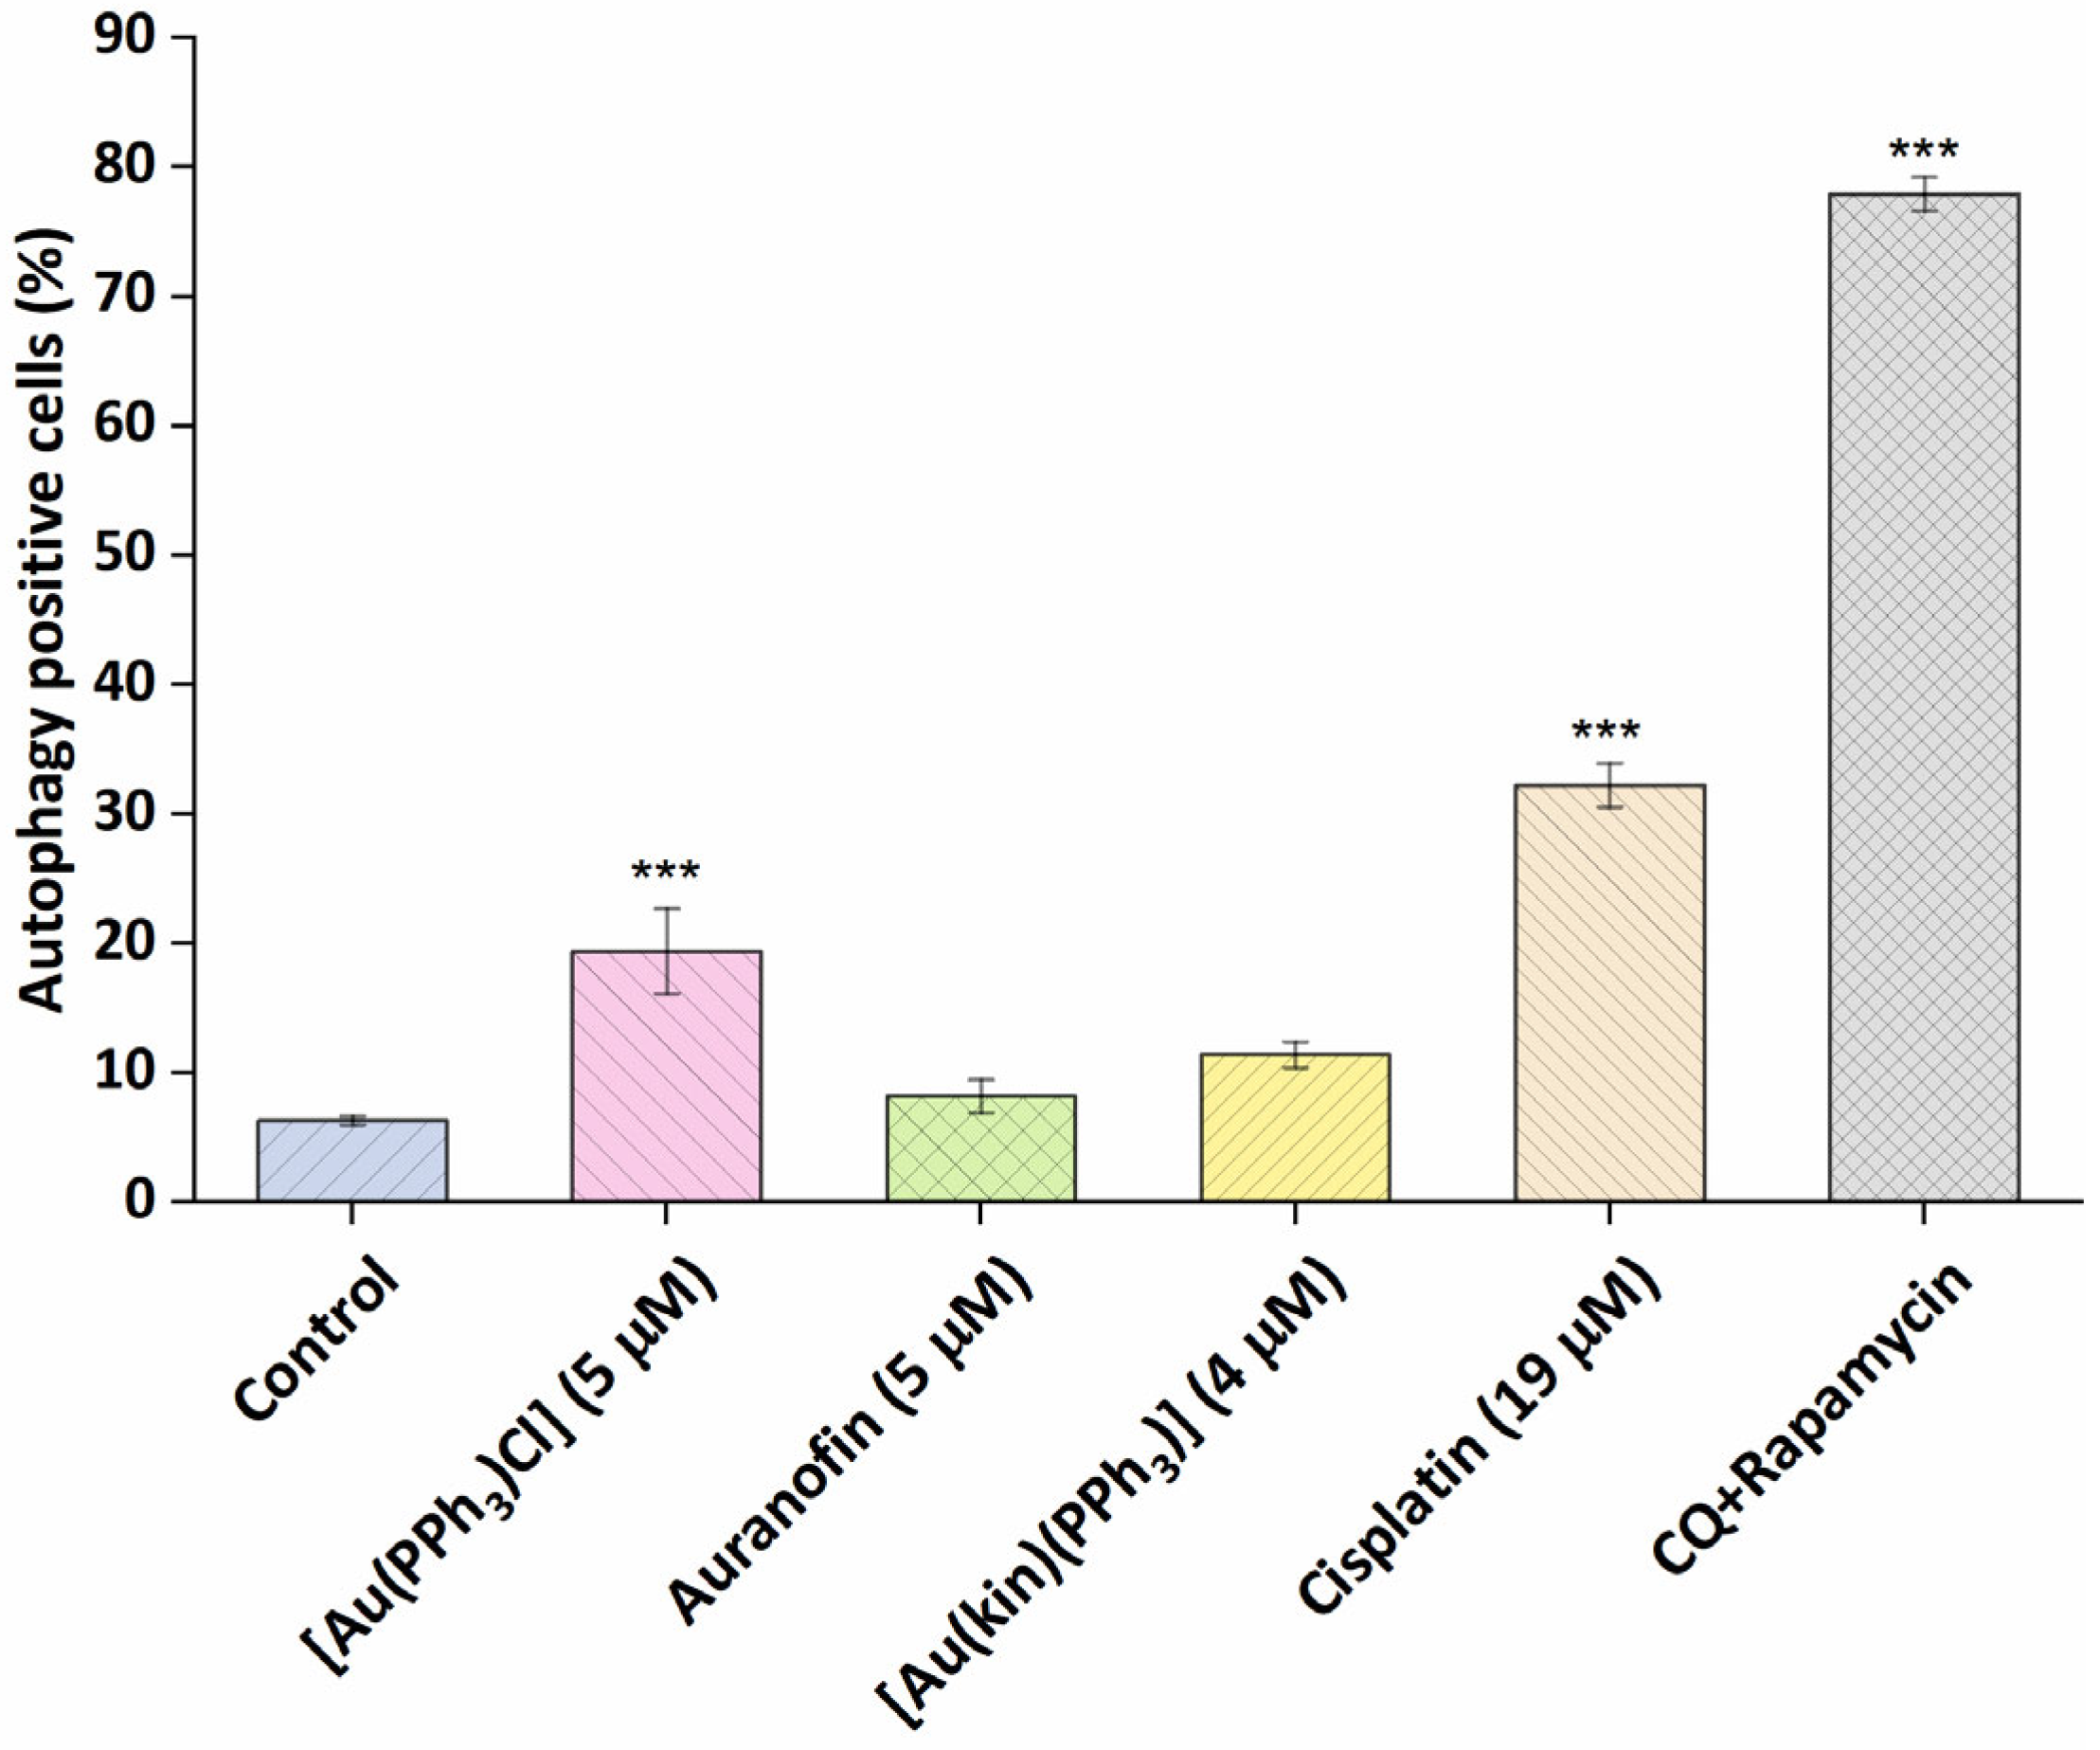
3.8. Induction of Autophagy
3.9. Induction of Intracellular ROS/Superoxide Production
3.10. Mitochondrial Membrane Potential Analysis
3.11. Cell Maintenance and Viability Determination
3.12. NF-κB Activity Determination
3.13. Immunocytochemical Analysis of PPARγ Expression and Localisation
3.14. Proteomic Analysis
4. Conclusions
Supplementary Materials
Author Contributions
Funding
Institutional Review Board Statement
Informed Consent Statement
Data Availability Statement
Acknowledgments
Conflicts of Interest
References
- Chaffman, M.; Brogden, R.N.; Heel, R.C.; Speight, T.M.; Avery, G.S. Auranofin: A preliminary review of its pharmacological properties and therapeutic use in rheumatoid arthritis. Drugs 1984, 27, 378–424. [Google Scholar] [CrossRef] [PubMed]
- Gamberi, T.; Chiappetta, G.; Fiaschi, T.; Modesti, A.; Sorbi, F.; Magheriniet, F. Upgrade of an old drug: Auranofin in innovative cancer therapies to overcome drug resistance and to increase drug effectiveness. Med. Chem. Rev. 2020, 42, 1111–1146. [Google Scholar] [CrossRef] [PubMed]
- Marzo, T.; Cirri, D.; Gabbiani, C.; Gamberi, T.; Magherini, F.; Pratesi, A.; Guerri, A.; Biver, T.; Binacchi, F.; Stefanini, M.; et al. Auranofin, Et3PAuCl, and Et3PAuI Are Highly Cytotoxic on Colorectal Cancer Cells: A Chemical and Biological Study. ACS Med. Chem. Lett. 2017, 8, 997–1001. [Google Scholar] [CrossRef] [PubMed]
- Abdalbari, F.H.; Telleria, C.M. The gold complex auranofin: New perspectives for cancer therapy. Discov. Oncol. 2021, 12, 42. [Google Scholar] [CrossRef] [PubMed]
- Marzo, T.; Cirri, D.; Pollini, S.; Prato, M.; Fallani, S.; Cassetta, M.I.; Novelli, A.; Rossolini, G.M.; Messori, L. Auranofin and its Analogues Show Potent Antimicrobial Activity against Multidrug-Resistant Pathogens: Structure–Activity Relationships. ChemMedChem 2018, 13, 2448–2454. [Google Scholar] [CrossRef]
- Liu, Y.; Lu, Y.; Xu, Z.; Ma, X.; Chen, X.; Liu, W. Repurposing of the gold drug auranofin and a review of its derivatives as antibacterial therapeutics. Drug Discov. Today 2022, 27, 1961–1973. [Google Scholar] [CrossRef]
- Harbut, M.B.; Vilchèze, C.; Luo, X.; Hensler, M.E.; Guo, H.; Yang, B.; Chatterjee, A.K.; Nizet, V.; Jacobs, W.R., Jr.; Schultz, P.G.; et al. Auranofin exerts broad-spectrum bactericidal activities by targeting thiol-redox homeostasis. PNAS 2015, 112, 4453–4458. [Google Scholar] [CrossRef] [Green Version]
- Capparelli, E.V.; Bricker-Ford, R.; Rogers, M.J.; McKerrow, J.H.; Reed, S.L. Phase I clinical trial results of auranofin, a novel antiparasitic agent. Antimicrob. Agents Chemother. 2016, 61, e01947-16. [Google Scholar] [CrossRef] [Green Version]
- Schmidt, C.; Karge, B.; Misgeld, R.; Prokop, A.; Franke, R.; Brönstrup, M.; Ott, I. Gold(I) NHC Complexes: Antiproliferative Activity, Cellular Uptake, Inhibition of Mammalian and Bacterial Thioredoxin Reductases, and Gram-Positive Directed Antibacterial Effects. Chem. Eur. J. 2017, 23, 1869–1880. [Google Scholar] [CrossRef]
- Büssing, R.; Karge, B.; Lippmann, P.; Jones, P.G.; Brönstrup, M.; Ott, I. Gold(I) and Gold(III) N-Heterocyclic Carbene Complexes as Antibacterial Agents and Inhibitors of Bacterial Thioredoxin Reductase. ChemMedChem 2021, 16, 3402–3409. [Google Scholar] [CrossRef]
- Wang, J.; Sun, X.; Xie, Y.; Long, Y.; Chen, H.; He, X.; Zou, T.; Mao, Z.W.; Xia, W. Identification of an Au(I) N-Heterocyclic Carbene Compound as a Bactericidal Agent Against Pseudomonas aeruginosa. Front. Chem. 2022, 10, 895159. [Google Scholar] [CrossRef] [PubMed]
- Mora, M.; Gimeno, M.C.; Visbal, R. Recent advances in gold–NHC complexes with biological properties. Chem. Soc. Rev. 2019, 48, 447–462. [Google Scholar] [CrossRef] [PubMed]
- Lu, Y.; Ma, X.; Chang, X.; Liang, Z.; Lv, L.; Shan, M.; Lu, Q.; Wen, Z.; Gust, R.; Liu, W. Recent development of gold(i) and gold(iii) complexes as therapeutic agents for cancer diseases. Chem. Soc. Rev. 2022, 51, 5518–5556. [Google Scholar] [CrossRef]
- Zhang, J.; Li, Y.; Fang, R.; Wei, W.; Wang, Y.; Jin, J.; Yang, F.; Chen, J. Organometallic gold(I) and gold(III) complexes for lung cancer treatment. Front. Pharmacol. 2022, 13, 979951. [Google Scholar] [CrossRef] [PubMed]
- Yang, Z.; Jiang, G.; Xu, Z.; Zhao, S.; Liu, W. Advances in alkynyl gold complexes for use as potential anticancer agents. Coord. Chem. Rev. 2020, 423, 213492. [Google Scholar] [CrossRef]
- Mirzadeh, N.; Reddy, T.S.; Bhargava, S.K. Advances in diphosphine ligand-containing gold complexes as anticancer agents. Coord. Chem. Rev. 2019, 388, 343–359. [Google Scholar] [CrossRef]
- Trávníček, Z.; Štarha, P.; Vančo, J.; Šilha, T.; Hošek, J.; Suchý, P.; Pražanová, G. Anti-inflammatory active gold(I) complexes involving 6-substituted-purine derivatives. J. Med. Chem. 2012, 55, 4568–4579. [Google Scholar] [CrossRef]
- Hošek, J.; Vančo, J.; Štarha, P.; Paráková, L.; Trávníček, Z. Effect of 2-Chloro-Substitution of Adenine Moiety in Mixed-Ligand Gold(I) Triphenylphosphine Complexes on Anti-Inflammatory Activity: The Discrepancy between the In Vivo and In Vitro Models. PLoS ONE 2013, 8, e82441. [Google Scholar] [CrossRef] [Green Version]
- Křikavová, R.; Hošek, J.; Vančo, J.; Hutyra, J.; Dvořák, J.; Trávníček, Z. Gold(I)-Triphenylphosphine Complexes with Hypoxanthine-Derived Ligands: In Vitro Evaluations of Anticancer and Anti-Inflammatory Activities. PLoS ONE 2014, 9, e107373. [Google Scholar] [CrossRef]
- Vančo, J.; Gáliková, J.; Hošek, J.; Dvořák, Z.; Paráková, L.; Trávníček, Z. Gold(I) Complexes of 9-Deazahypoxanthine as Selective Antitumor and Anti-Inflammatory Agents. PLoS ONE 2014, 9, e109901. [Google Scholar] [CrossRef]
- Pouchert, C.J. The Aldrich Library of Infrared Spectra, 3rd ed.; Aldrich Chemical Company Press: Milwaukee, WI, USA, 1981; pp. 1–1850. [Google Scholar]
- Mehrzad, J.; Rajabi, M. Kinetin (N6-furfuryladenine): Cytotoxicity against MCF-7 breast cancer cell line and interaction with bovine serum albumin. Afr. J. Biotechnol. 2011, 10, 6304–6309. [Google Scholar] [CrossRef]
- Abás, E.; Bellés, A.; Rodríguez-Diéguez, A.; Laguna, M.; Grasa, L. Selective cytotoxicity of cyclometalated gold(III) complexes on Caco-2 cells is mediated by G2/M cell cycle arrest. Metallomics 2021, 13, mfab034. [Google Scholar] [CrossRef] [PubMed]
- Kim, J.H.; Reeder, E.; Parkin, S.; Awuah, S.G. Gold(I/III)-Phosphine Complexes as Potent Antiproliferative Agents. Sci. Rep. 2019, 9, 12335. [Google Scholar] [CrossRef] [PubMed] [Green Version]
- Le, H.V.; Babak, M.V.; Ehsan, M.A.; Altaf, M.; Reichert, L.; Gushchin, A.L.; Ang, W.H.; Isab, A.A. Highly cytotoxic gold(i)-phosphane dithiocarbamate complexes trigger an ER stress-dependent immune response in ovarian cancer cells. Dalton Trans. 2020, 49, 7355–7363. [Google Scholar] [CrossRef] [PubMed]
- Wagner, J.M.; Karnitz, L.M. Cisplatin-Induced DNA Damage Activates Replication Checkpoint Signaling Components that Differentially Affect Tumor Cell Survival. Mol. Pharmacol. 2009, 76, 208–214. [Google Scholar] [CrossRef] [PubMed] [Green Version]
- Basu, A.; Krishnamurthy, S. Cellular Responses to Cisplatin-Induced DNA Damage. J. Nucleic Acids 2010, 201367. [Google Scholar] [CrossRef] [Green Version]
- Lin, J.F.; Lin, Y.C.; Tsai, T.F.; Chen, H.E.; Chou, K.Y.; Hwang, T.I.S. Cisplatin induces protective autophagy through activation of BECN1 in human bladder cancer cells. Drug Des. Dev. Ther. 2017, 11, 1517–1533. [Google Scholar] [CrossRef] [Green Version]
- Glanz, A.; Chakravarty, S.; Fan, S.; Chawla, K.; Subramanian, G.; Rahman, T.; Walters, D.; Chakravarti, R.; Chattopadhyay, S. Autophagic degradation of IRF3 induced by the small-molecule auranofin inhibits its transcriptional and proapoptotic activities. J. Biol. Chem. 2021, 297, 101274. [Google Scholar] [CrossRef]
- Barnard, P.J.; Berners-Price, S.J. Targeting the mitochondrial cell death pathway with gold compounds. Coord. Chem. Rev. 2007, 251, 1889–1902. [Google Scholar] [CrossRef]
- de Maria, M.B.; Lamarche, J.; Ronga, L.; Messori, L.; Szpunara, J.; Lobinski, R. Selenol (-SeH) as a target for mercury and gold in biological systems: Contributions of mass spectrometry and atomic spectroscopy. Coord. Chem. Rev. 2023, 474, 214836. [Google Scholar] [CrossRef]
- Karsa, M.; Kosciolek, A.; Bongers, A.; Mariana, A.; Failes, T.; Gifford, A.J.; Kees, U.R.; Cheung, L.C.; Kotecha, R.S.; Arndt, G.M.; et al. Exploiting the reactive oxygen species imbalance in high-risk paediatric acute lymphoblastic leukaemia through auranofin. Br. J. Cancer 2021, 125, 55–64. [Google Scholar] [CrossRef] [PubMed]
- Berners-Price, S.J.; Filipovska, A. Gold compounds as therapeutic agents for human diseases. Metallomics 2011, 3, 863–873. [Google Scholar] [CrossRef] [PubMed]
- Khan, H.A.; Al-Hoshani, A.; Isab, A.A.; Alhomida, A.S. A Gold(III) Complex with Potential Anticancer Properties. ChemistrySelect 2022, 7, e202202956. [Google Scholar] [CrossRef]
- Kuhnle, J.A.; Fuller, G.; Corse, J.; Mackey, B.E. Antisenescent activity of natural cytokinins. Physiol. Plant. 1977, 41, 14–21. [Google Scholar] [CrossRef]
- Mann, F.G.; Wells, A.F.; Purdie, D. The constitution of complex metallic salts. Part VI. The constitution of the phosphine and arsine derivatives of silver and aurous halides. The configuration of the coordinated argentous and aurous complex. J. Chem. Soc. 1937, 1828–1836. [Google Scholar] [CrossRef]
- Bruce, M.I.; Nicholson, B.K.; Shawkataly, B.O.; Shapley, J.R.; Henly, T. Synthesis of gold-containing mixed-metal cluster complexes. Inorg. Syn. 1989, 26, 324–328. [Google Scholar]
- APEX3 Software Suite; Bruker AXS Inc.: Madison, WI, USA, 2016.
- Sheldrick, G. SHELXT—Integrated space-group and crystal-structure determination. Acta Crystallogr. A 2015, 71, 3–8. [Google Scholar] [CrossRef] [Green Version]
- Diamond—Crystal and Molecular Structure Visualization, Crystal Impact; Dr. H. Putz & Dr. K. Brandenburg GbR: Bonn, Germany; Available online: https://www.crystalimpact.de/diamond (accessed on 28 April 2022).
- Macrae, C.F.; Bruno, I.J.; Chisholm, J.A.; Edgington, P.R.; McCabe, P.; Pidcock, E.; Rodriguez-Monge, L.; Taylor, R.; van de Streek, J.; Wood, P.A. Mercury CSD 2.0—New features for the visualization and investigation of crystal structures. J. Appl. Crystallogr. 2008, 41, 466–470. [Google Scholar] [CrossRef]
- Spek, A.L. PLATON SQUEEZE: A tool for the calculation of the disordered solvent contribution to the calculated structure factors. Acta Cryst. 2015, C71, 9–18. [Google Scholar] [CrossRef] [Green Version]
- Spek, A.L. Single-crystal structure validation with the program PLATON. J. Appl. Crystallogr. 2003, 36, 7–13. [Google Scholar] [CrossRef] [Green Version]
- Pisárčik, M.; Lukáč, M.; Jampílek, J.; Pašková, Ľ.; Bilka, F.; Bilková, A.; Devínsky, F.; Vaľko, J.; Horáková, R.; Hošek, J.; et al. Controlled synthesis of gemini surfactant-capped gold nanoparticles. Gemini structure-nanoparticle properties relationship study. J. Mol. Liq. 2022, 365, 120210. [Google Scholar] [CrossRef]
- Leon, I.R.; Schwammle, V.; Jensen, O.N.; Sprenger, R.R. Quantitative Assessment of In-solution Digestion Efficiency Identifies Optimal Protocols for Unbiased Protein Analysis. Mol. Cell. Proteom. 2013, 12, 2992–3005. [Google Scholar] [CrossRef] [PubMed] [Green Version]
- Masuda, T.; Tomita, T.; Ishihama, Y. Phase Transfer Surfactant-Aided Trypsin Digestion for Membrane Proteome Analysis. J Proteome Res. 2008, 7, 731–740. [Google Scholar] [CrossRef] [PubMed]
- Chamrád, I.; Simerský, R.; Bérešová, L.; Strnad, M.; Šebela, M.; Lenobel, R. Proteomic Identification of a Candidate Sequence of Wheat Cytokinin-Binding Protein 1. J. Plant Growth Regul. 2014, 33, 896–902. [Google Scholar] [CrossRef]
- Tyanova, S.; Temu, T.; Cox, J. The MaxQuant computational platform for mass spectrometry-based shotgun proteomics. Nat. Protoc. 2016, 11, 2301–2319. [Google Scholar] [CrossRef] [PubMed]
- Meier, F.; Brunner, A.D.; Koch, S.; Koch, H.; Lubeck, M.; Krause, M.; Goedecke, N.; Decker, J.; Kosinski, T.; Park, M.A.; et al. Online Parallel Accumulation–Serial Fragmentation (PASEF) with a Novel Trapped Ion Mobility Mass Spectrometer. Mol. Cell. Proteom. 2018, 17, 2534–2545. [Google Scholar] [CrossRef] [PubMed] [Green Version]
- Cox, J.; Neuhauser, N.; Michalski, A.; Scheltema, R.A.; Olsen, J.V.; Mann, M. Andromeda: A Peptide Search Engine Integrated into the MaxQuant Environment. J. Proteome Res. 2011, 10, 1794–1805. [Google Scholar] [CrossRef]
- Tyanova, S.; Temu, T.; Sinitcyn, P.; Carlson, A.; Hein, M.Y.; Geiger, T.; Mann, M.; Cox, J. The Perseus computational platform for comprehensive analysis of (prote)omics data. Nat. Methods 2016, 13, 731–740. [Google Scholar] [CrossRef] [PubMed]
- Sherman, B.T.; Hao, M.; Qiu, J.; Jiao, X.; Baseler, M.W.; Lane, H.C.; Imamichi, T.; Chang, W. DAVID: A web server for functional enrichment analysis and functional annotation of gene lists (2021 update). Nucleic Acids Res. 2022, 50, W216–W221. [Google Scholar] [CrossRef] [PubMed]


| Compound | [Au(kin)(PPh3)] | [Au(L1)(PPh3)] a | [Au(L2)(PPh3)] b | |
|---|---|---|---|---|
| Selected bond lengths (Å) | Au-N(9) | 2.046(3) | 2.046(3) | 2.042(3) |
| Au-P | 2.2379(10) | 2.2344(9) | 2.2356(8) | |
| Selected angle (°) | N(9)-Au-P | 178.64(9) | 173.73(10) | 175.65(8) |
| Compound | Human Cell Lines | ||||||
|---|---|---|---|---|---|---|---|
| A2780 | A2780R | PC-3 | 22Rv1 | THP-1 | LS180 | MRC5 | |
| [Au(kin)(PPh3)] (1) | 2.9 ± 0.7 | 5.0 ± 1.5 | 4.8 ± 1.3 | 3.7 ± 0.5 | 1.1 ± 0.2 | >10 | >10 |
| Kinetin | >25 | >25 | >25 | n.d. | n.d. | n.d. | >25 |
| [Au(PPh3)Cl] | 3.5 ± 0.5 | 5.2 ± 0.2 | 9.9 ± 0.4 | n.d. | n.d. | n.d. | 17.0 ± 0.5 |
| Auranofin | 3.4 ± 0.9 | 3.4 ± 0.6 | 3.7 ± 0.7 | n.d. | n.d. | n.d. | 3.78 ± 0.01 |
| Cisplatin | 17.2 ± 0.9 | >50 | >50 | 28.2 ± 4.2 | n.d. | >50 | >50 |
| Compound | 24 h | 48 h | 72 h |
|---|---|---|---|
| [Au(kin)(PPh3)] (1) | 2.9 ± 0.7 | 3.0 ± 0.3 | 3.0 ± 0.6 |
| [Au(PPh3)Cl] | 3.5 ± 0.5 | 3.2 ± 0.2 | 3.1 ± 0.3 |
| Auranofin | 3.4 ± 0.9 | 2.1 ± 0.4 | 2.0 ± 0.1 |
| Cisplatin | 17.2 ± 0.9 | 12.4 ± 1.8 | 5.8 ± 1.8 |
| Empirical formula Formula weight Temperature Wavelength Crystal system Space group Unit cell dimensions Volume Z Density (calculated) Absorption coefficient F(000) Crystal size θ range for data collection Index ranges Reflections collected Independent reflections Completeness to θ = 25.242° Absorption correction Refinement method Data/restraints/parameters Goodness-of-fit on F2 Final R indices [I > 2σ(I)] R indices (all data) Extinction coefficient | C28 H23 Au N5 O P 673.45 293(2) K 0.71073 Å Triclinic P-1 a = 10.050(4) Å, α = 88.980(12)° b = 11.779(5) Å, β = 79.919(15)° c = 13.847(5) Å, γ = 70.122(19)° 1516.2(10) Å3 2 1.475 g/cm3 4.930 mm−1 656 0.08 × 0.08 × 0.06 mm 1.84 to 27.59°. −13 ≤ h ≤ 13, −15≤ ≤ k ≤ 15, −17 ≤ l ≤17 41,317 6986 [R(int) = 0.0744] 100.0% Semi-empirical from equivalents Full-matrix least-squares on F2 6986/0/325 1.044 R1 = 0.0313, wR2 = 0.0546 R1 = 0.0539, wR2 = 0.0602 n/a |
Disclaimer/Publisher’s Note: The statements, opinions and data contained in all publications are solely those of the individual author(s) and contributor(s) and not of MDPI and/or the editor(s). MDPI and/or the editor(s) disclaim responsibility for any injury to people or property resulting from any ideas, methods, instructions or products referred to in the content. |
© 2023 by the authors. Licensee MDPI, Basel, Switzerland. This article is an open access article distributed under the terms and conditions of the Creative Commons Attribution (CC BY) license (https://creativecommons.org/licenses/by/4.0/).
Share and Cite
Trávníček, Z.; Vančo, J.; Belza, J.; Hošek, J.; Dvořák, Z.; Lenobel, R.; Popa, I.; Šmejkal, K.; Uhrin, P. The Gold(I) Complex with Plant Hormone Kinetin Shows Promising In Vitro Anticancer and PPARγ Properties. Int. J. Mol. Sci. 2023, 24, 2293. https://doi.org/10.3390/ijms24032293
Trávníček Z, Vančo J, Belza J, Hošek J, Dvořák Z, Lenobel R, Popa I, Šmejkal K, Uhrin P. The Gold(I) Complex with Plant Hormone Kinetin Shows Promising In Vitro Anticancer and PPARγ Properties. International Journal of Molecular Sciences. 2023; 24(3):2293. https://doi.org/10.3390/ijms24032293
Chicago/Turabian StyleTrávníček, Zdeněk, Ján Vančo, Jan Belza, Jan Hošek, Zdeněk Dvořák, René Lenobel, Igor Popa, Karel Šmejkal, and Pavel Uhrin. 2023. "The Gold(I) Complex with Plant Hormone Kinetin Shows Promising In Vitro Anticancer and PPARγ Properties" International Journal of Molecular Sciences 24, no. 3: 2293. https://doi.org/10.3390/ijms24032293