Optimization of the Mechanical Performance of Titanium for Biomedical Applications by Advanced, High-Gain SPD Technology

 , , , , and
Abstract
:1. Introduction
2. Materials and Methods
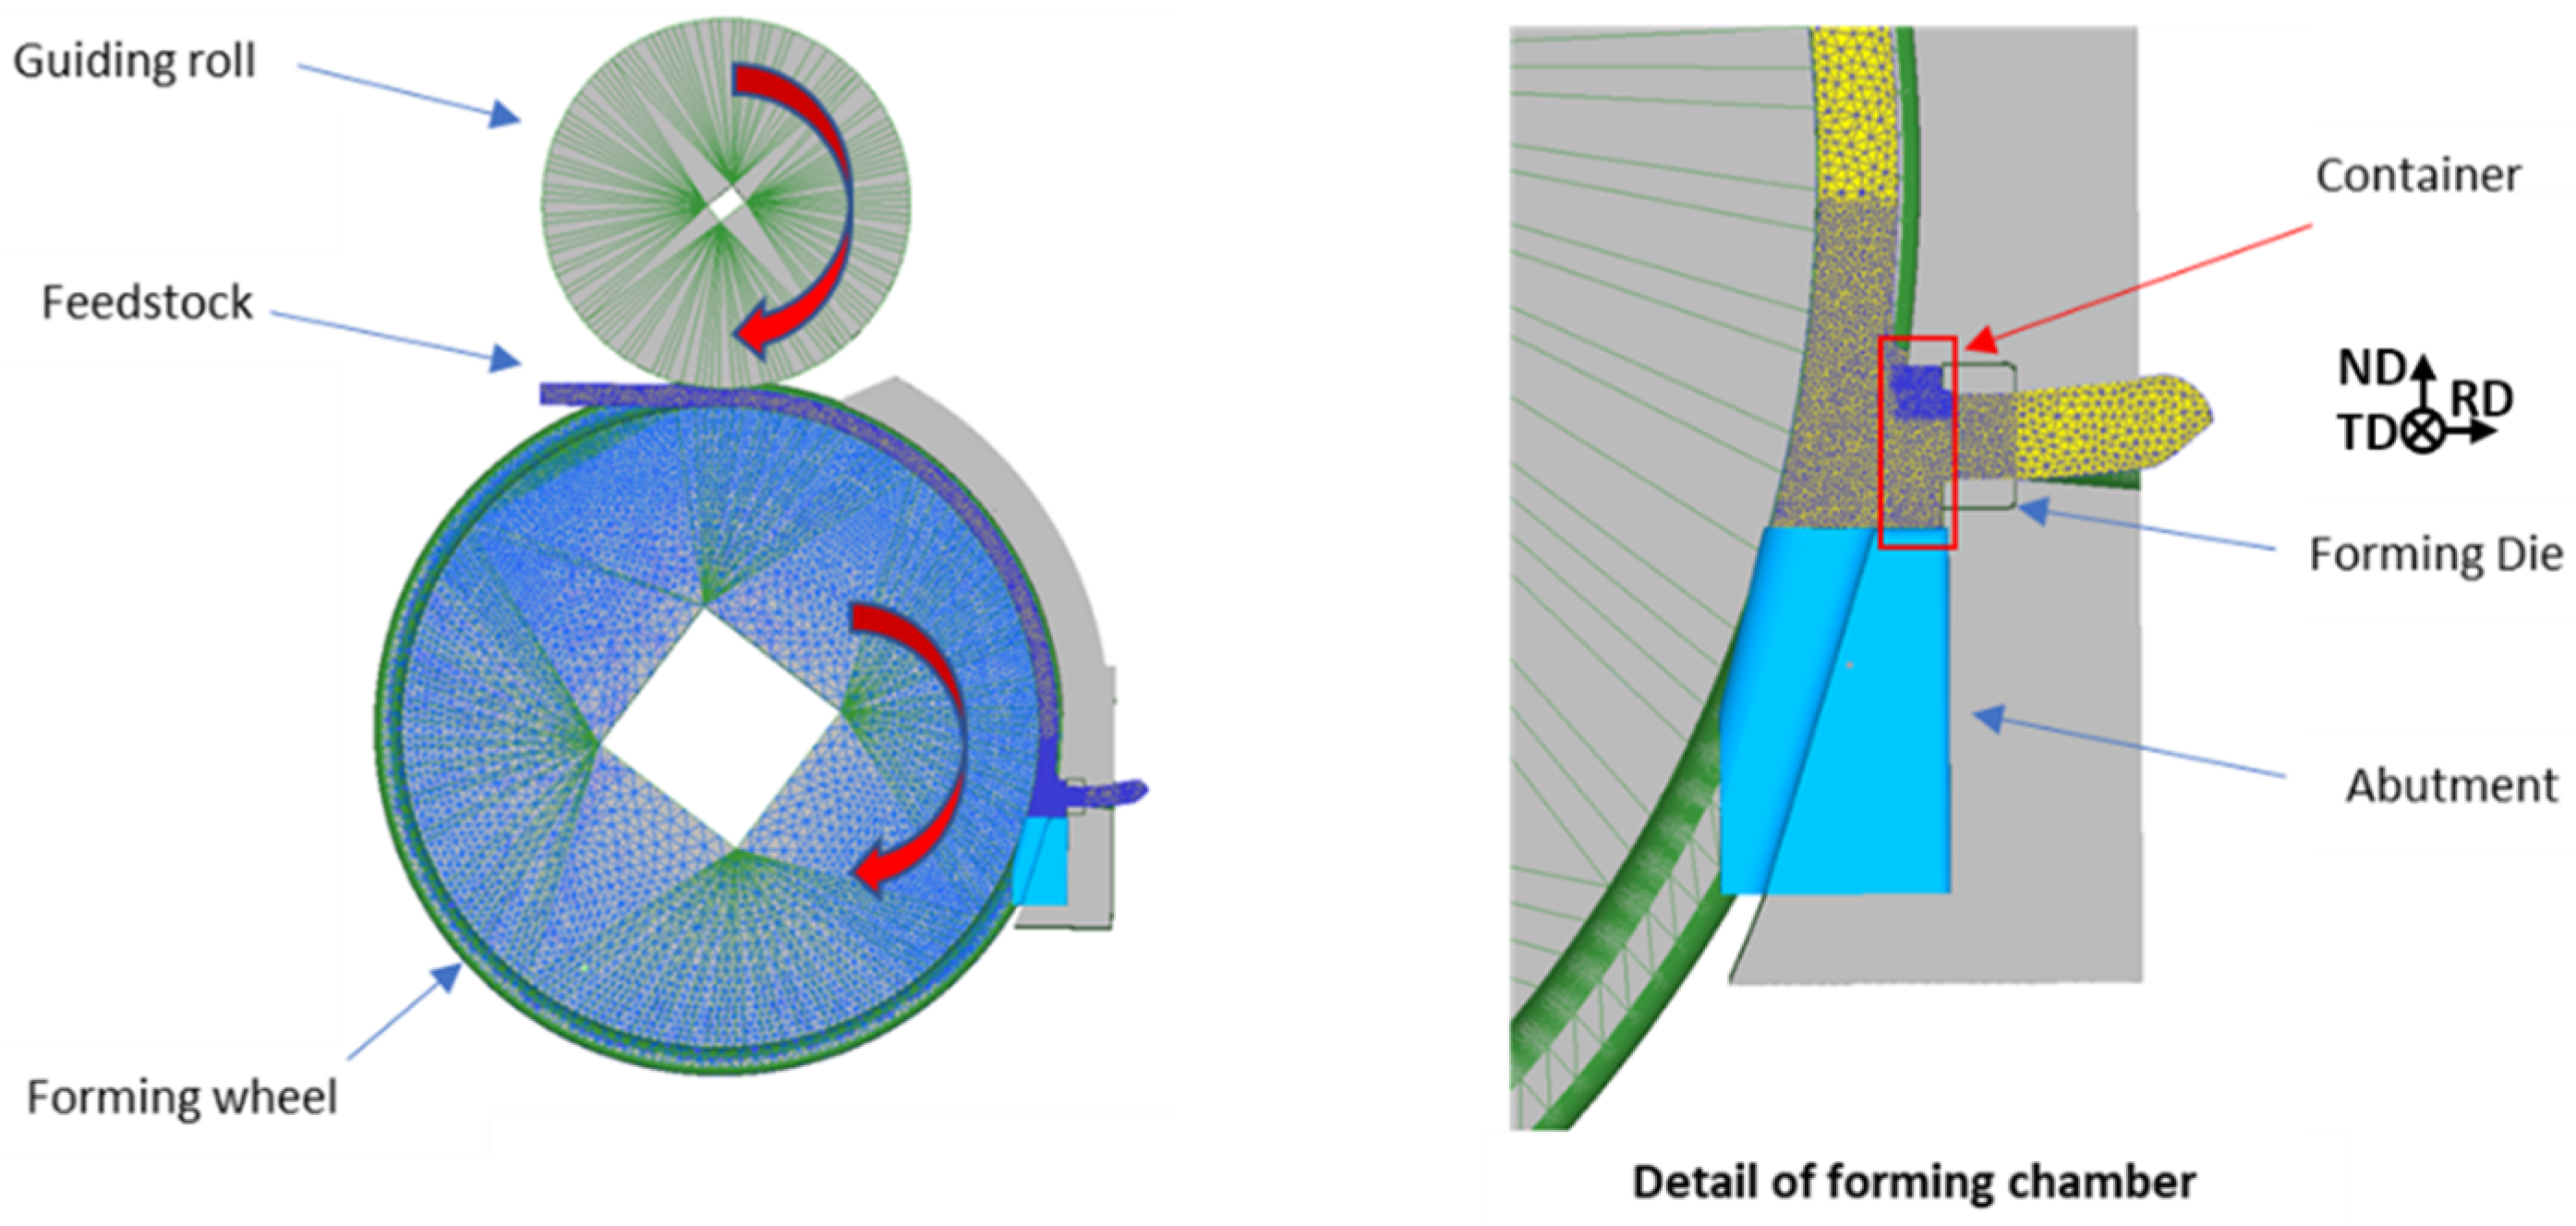
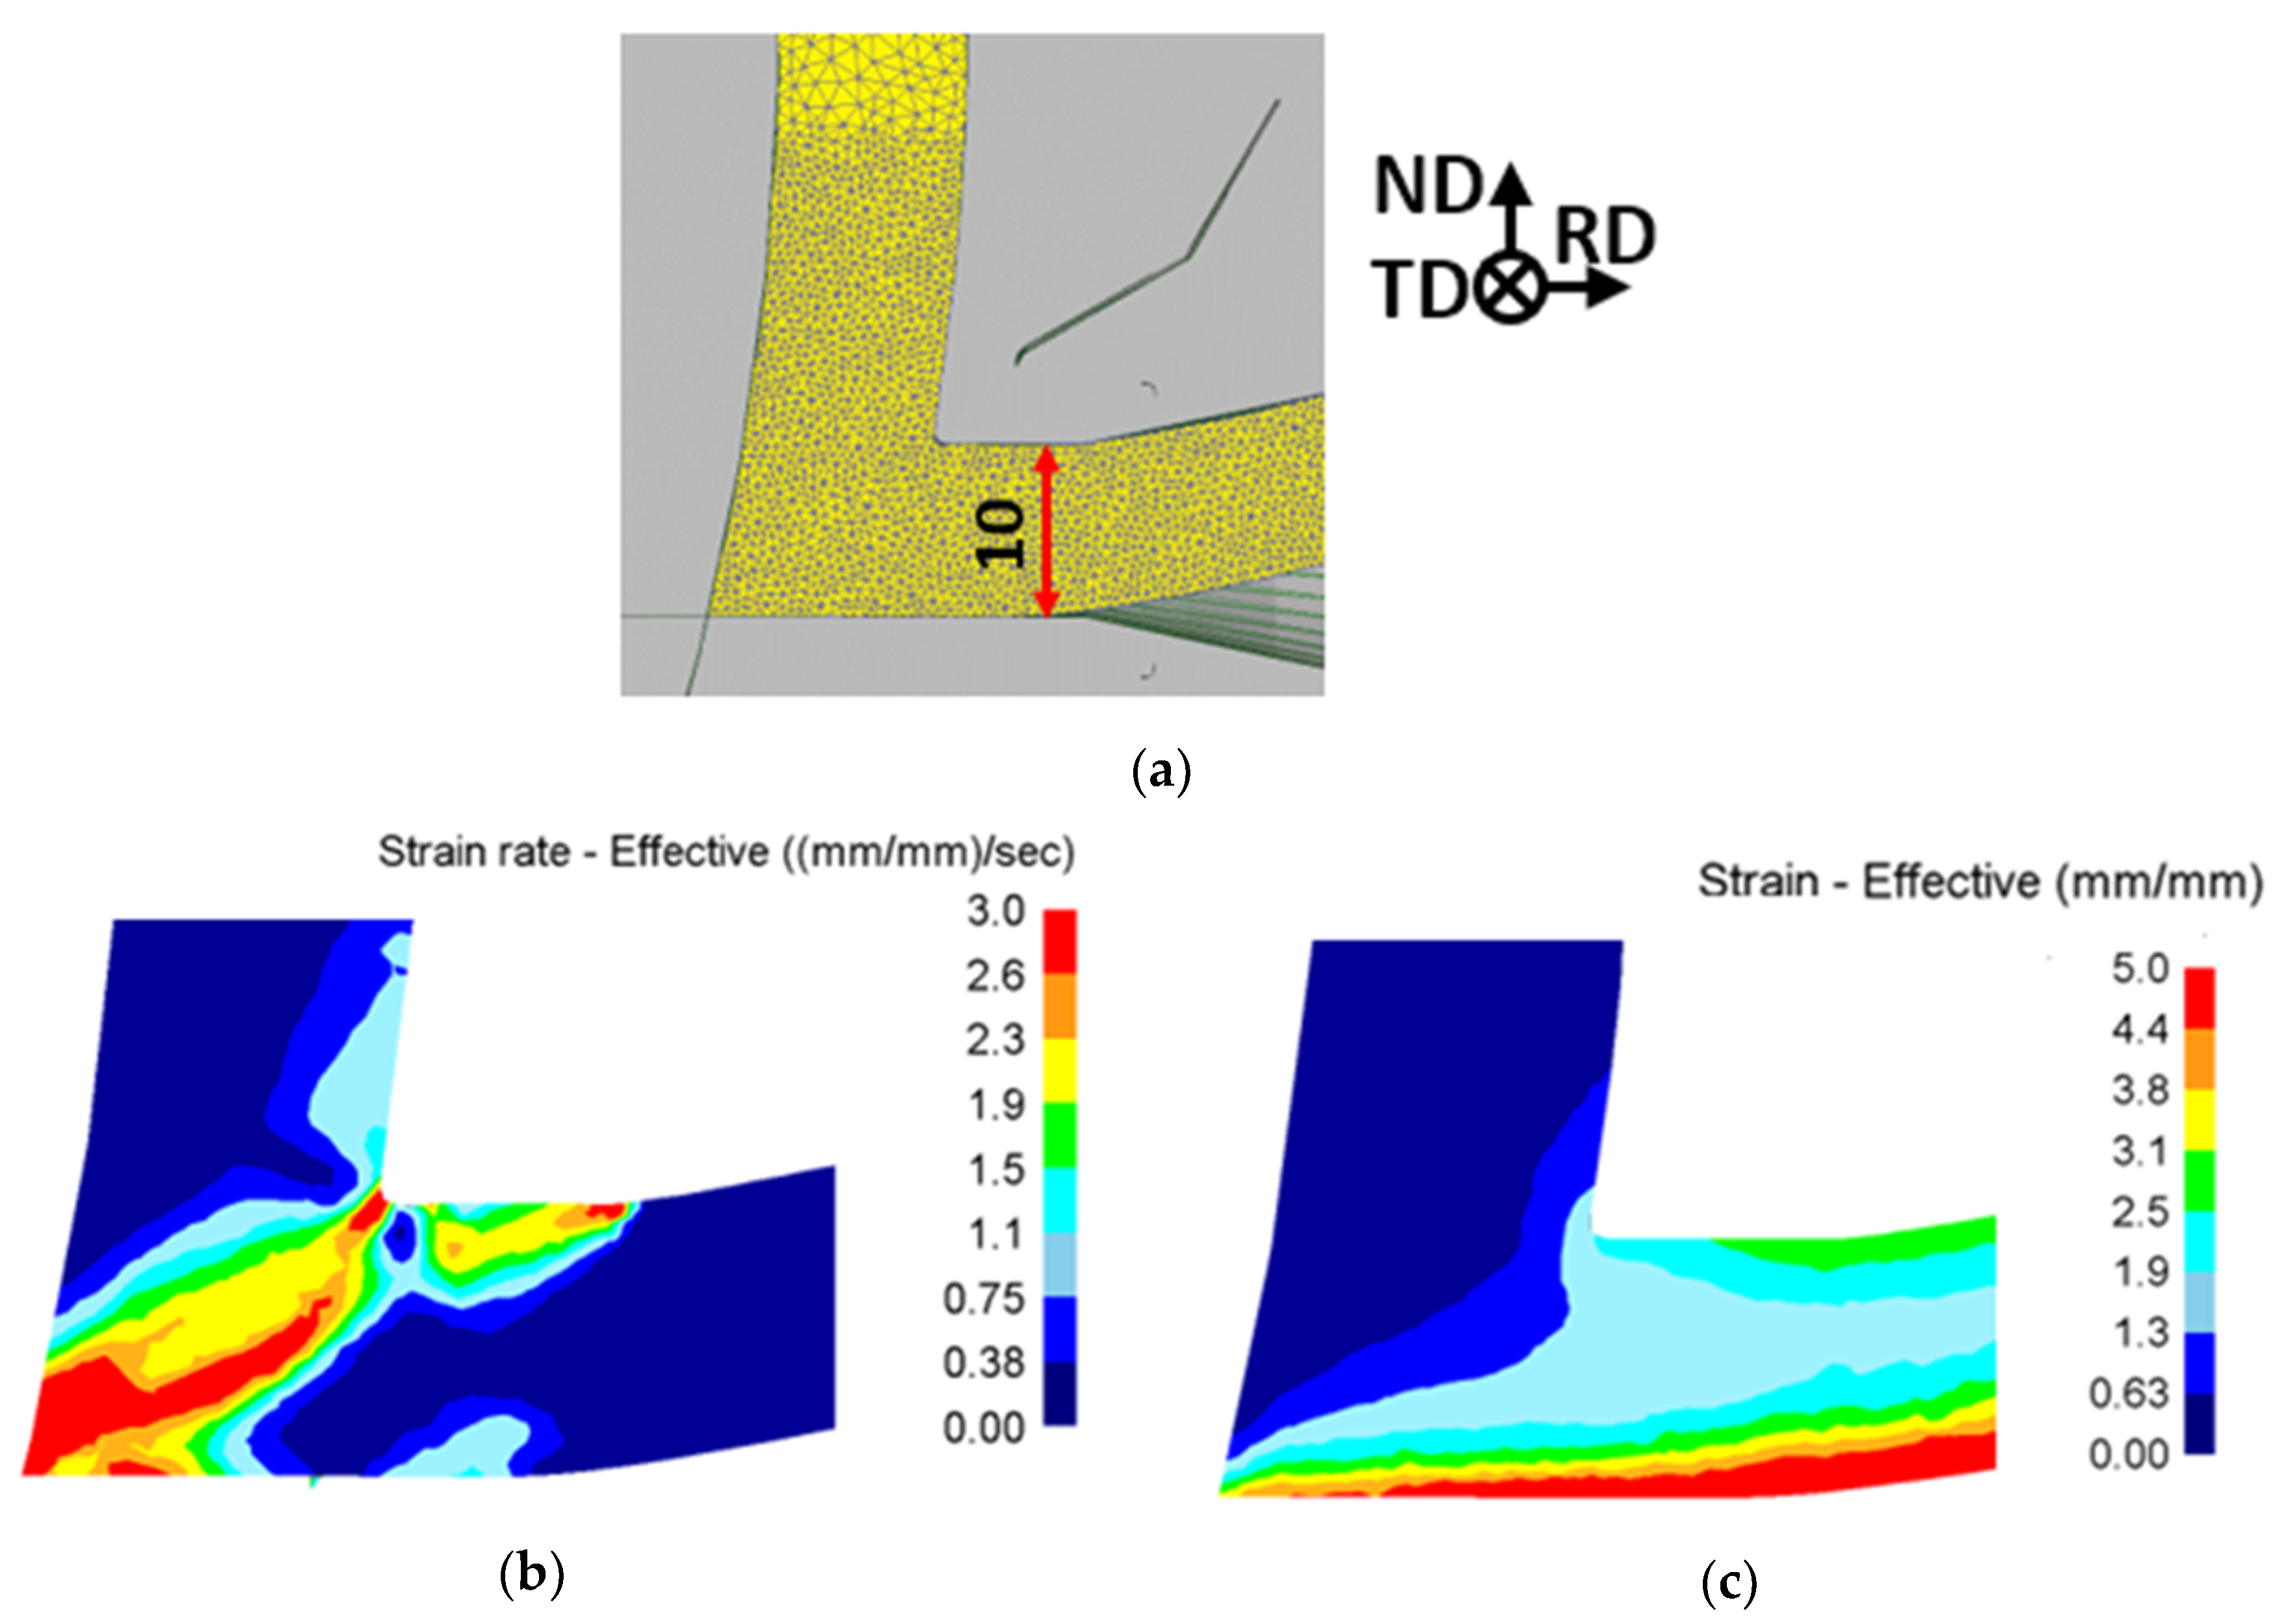
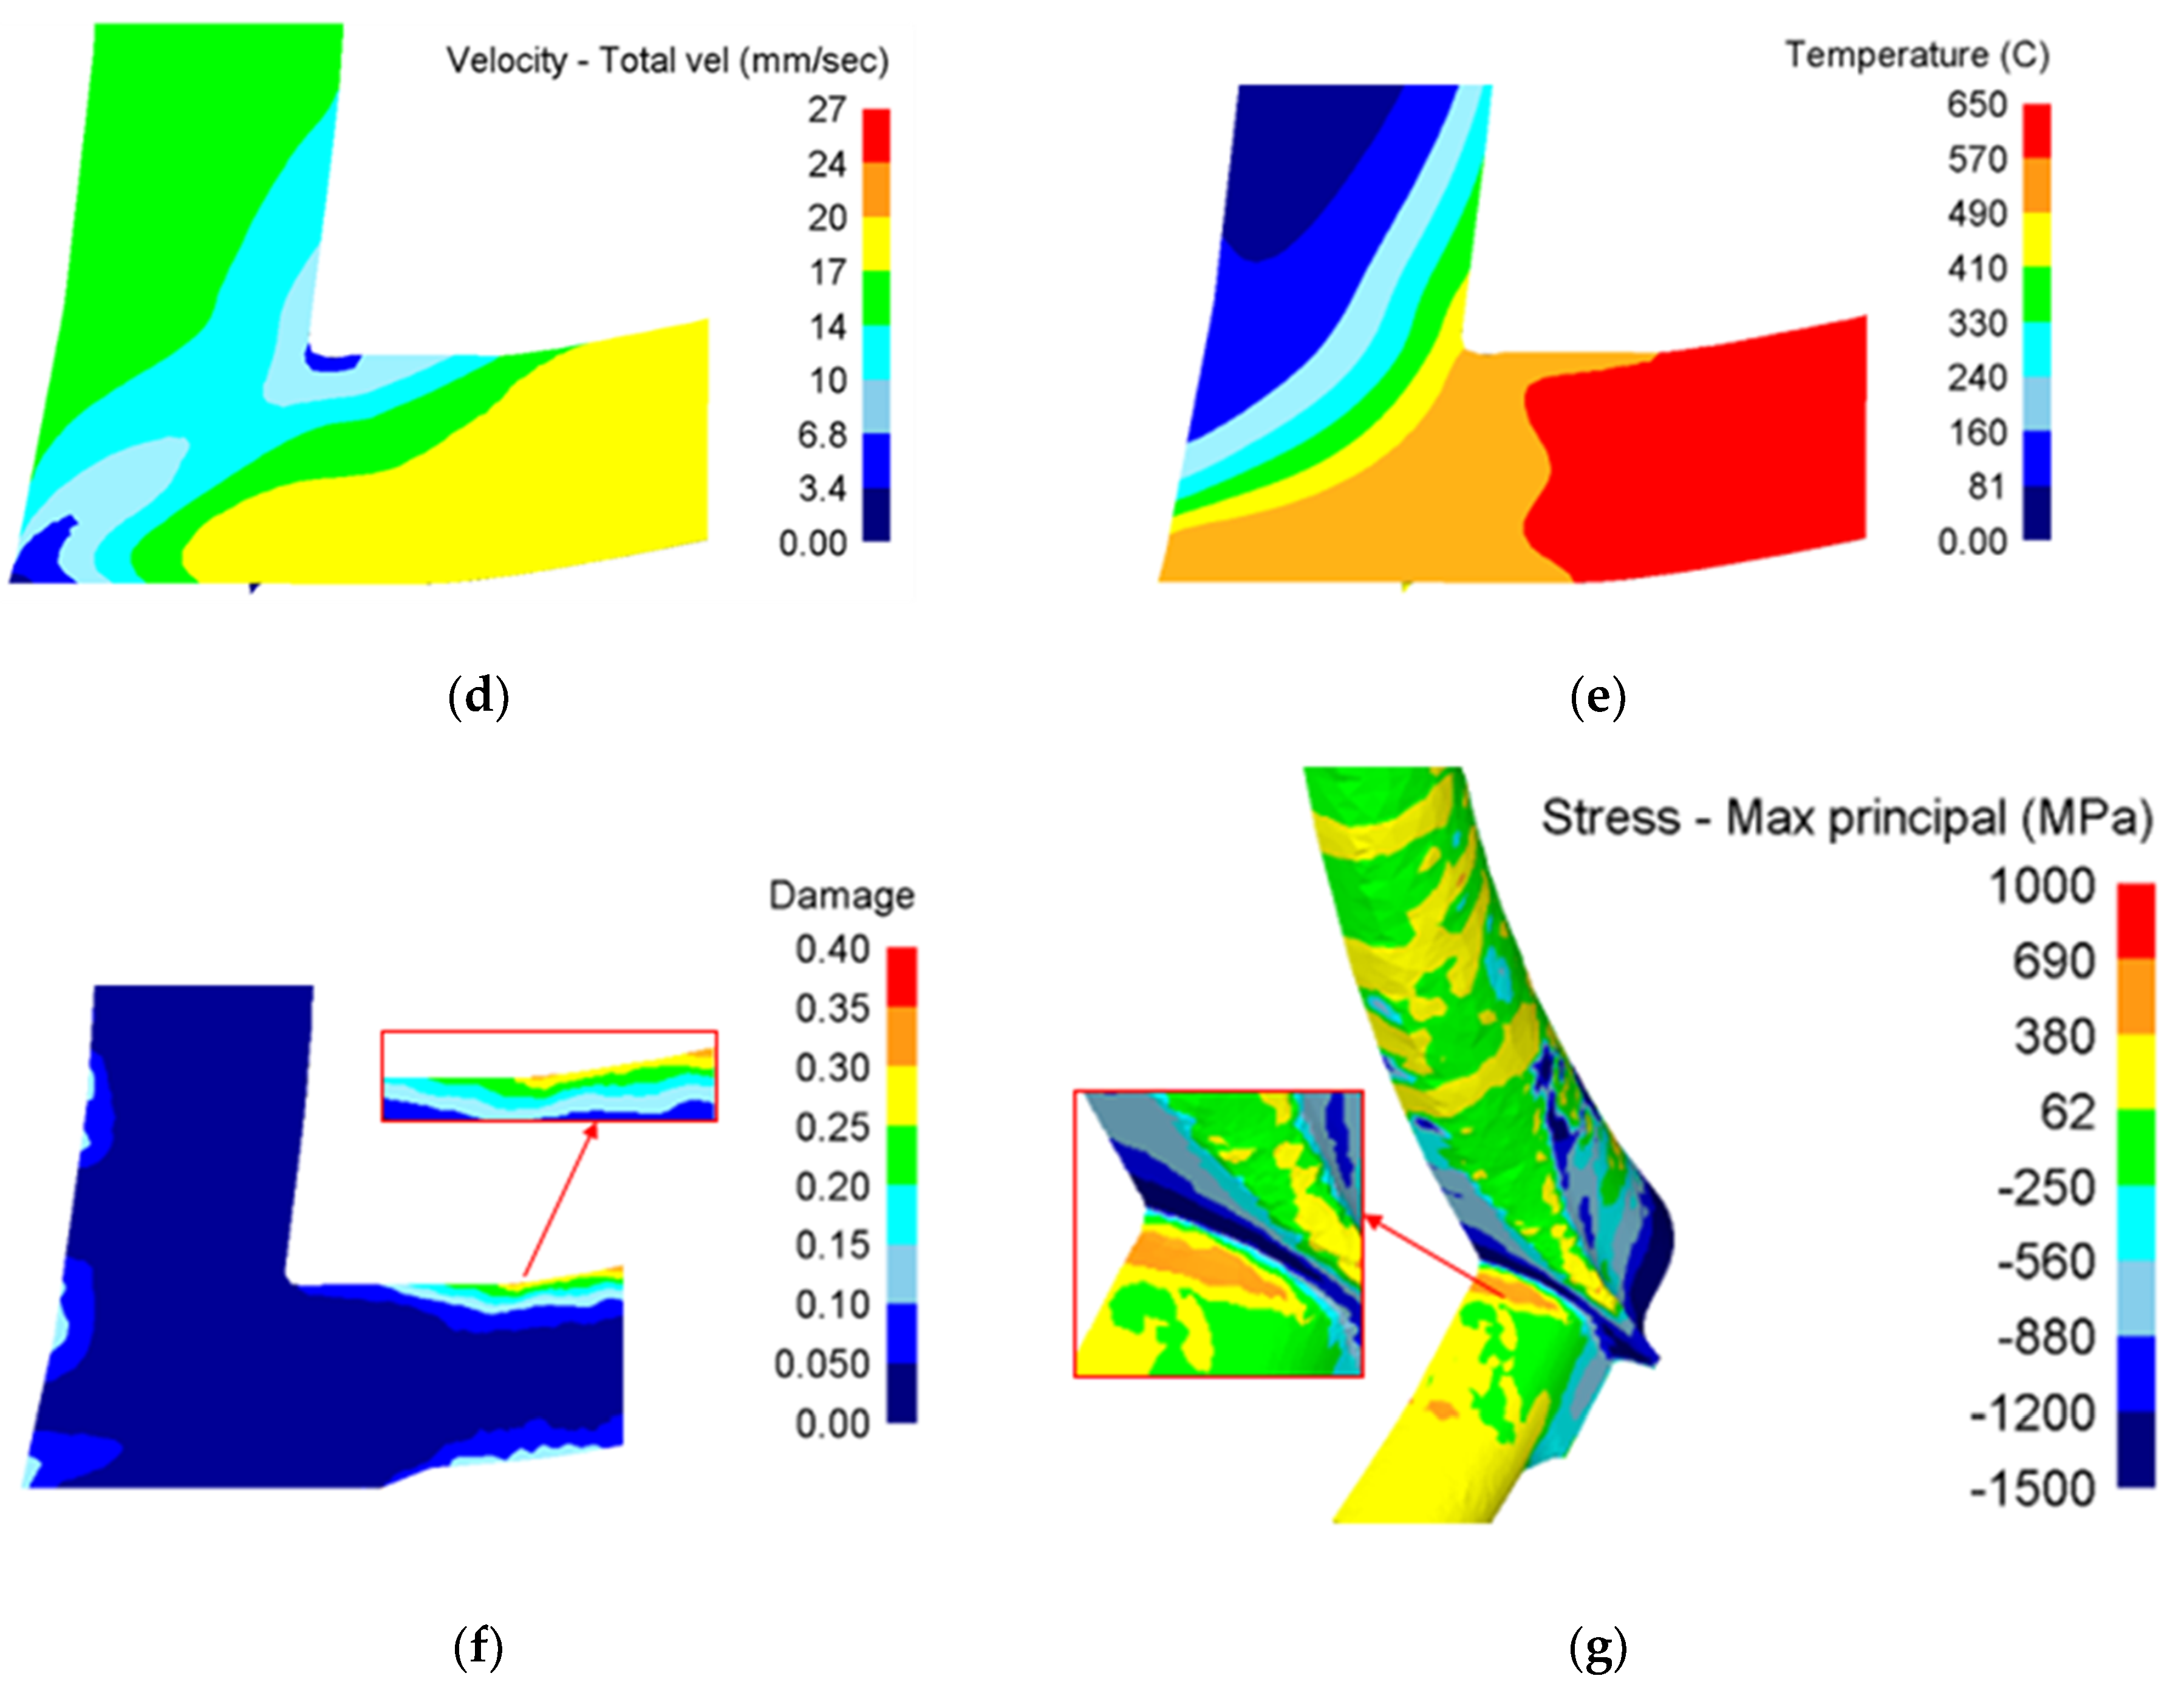
2.1. Numerical Simulations
2.2. Materials Processing
2.3. Tensile and Fatigue Tests
2.4. Microscopy
3. Results
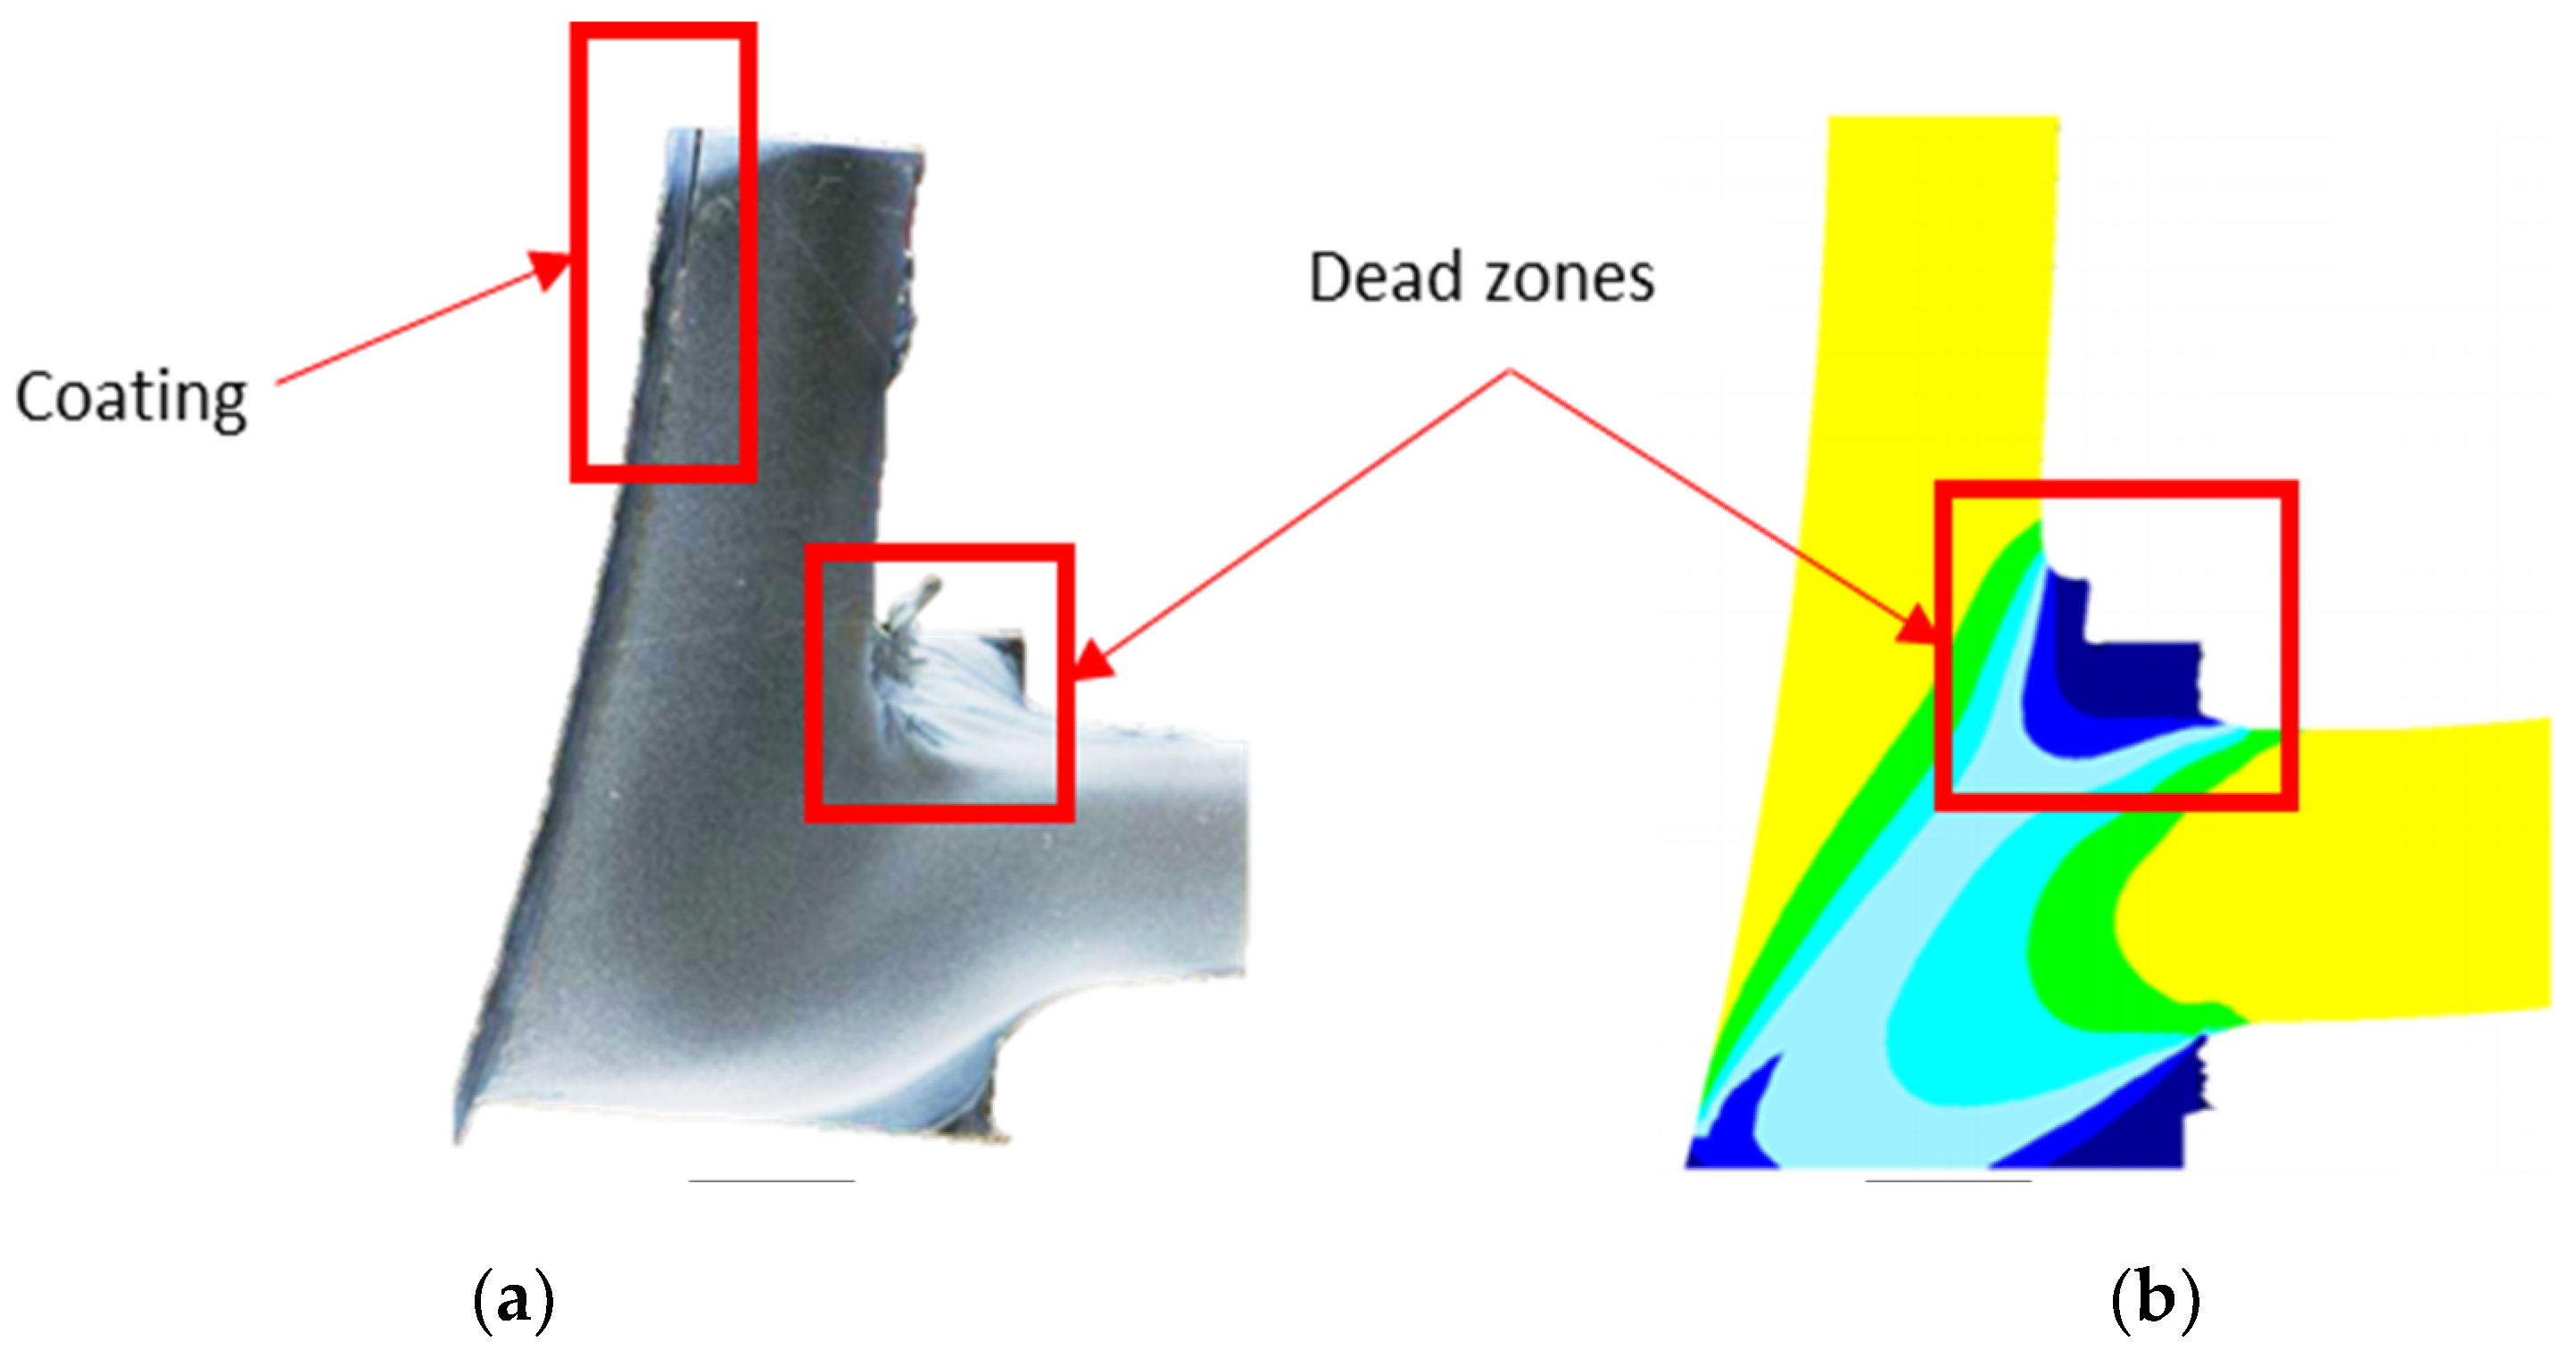
3.1. Numerical Simulation
3.2. Point Tracking Analysis
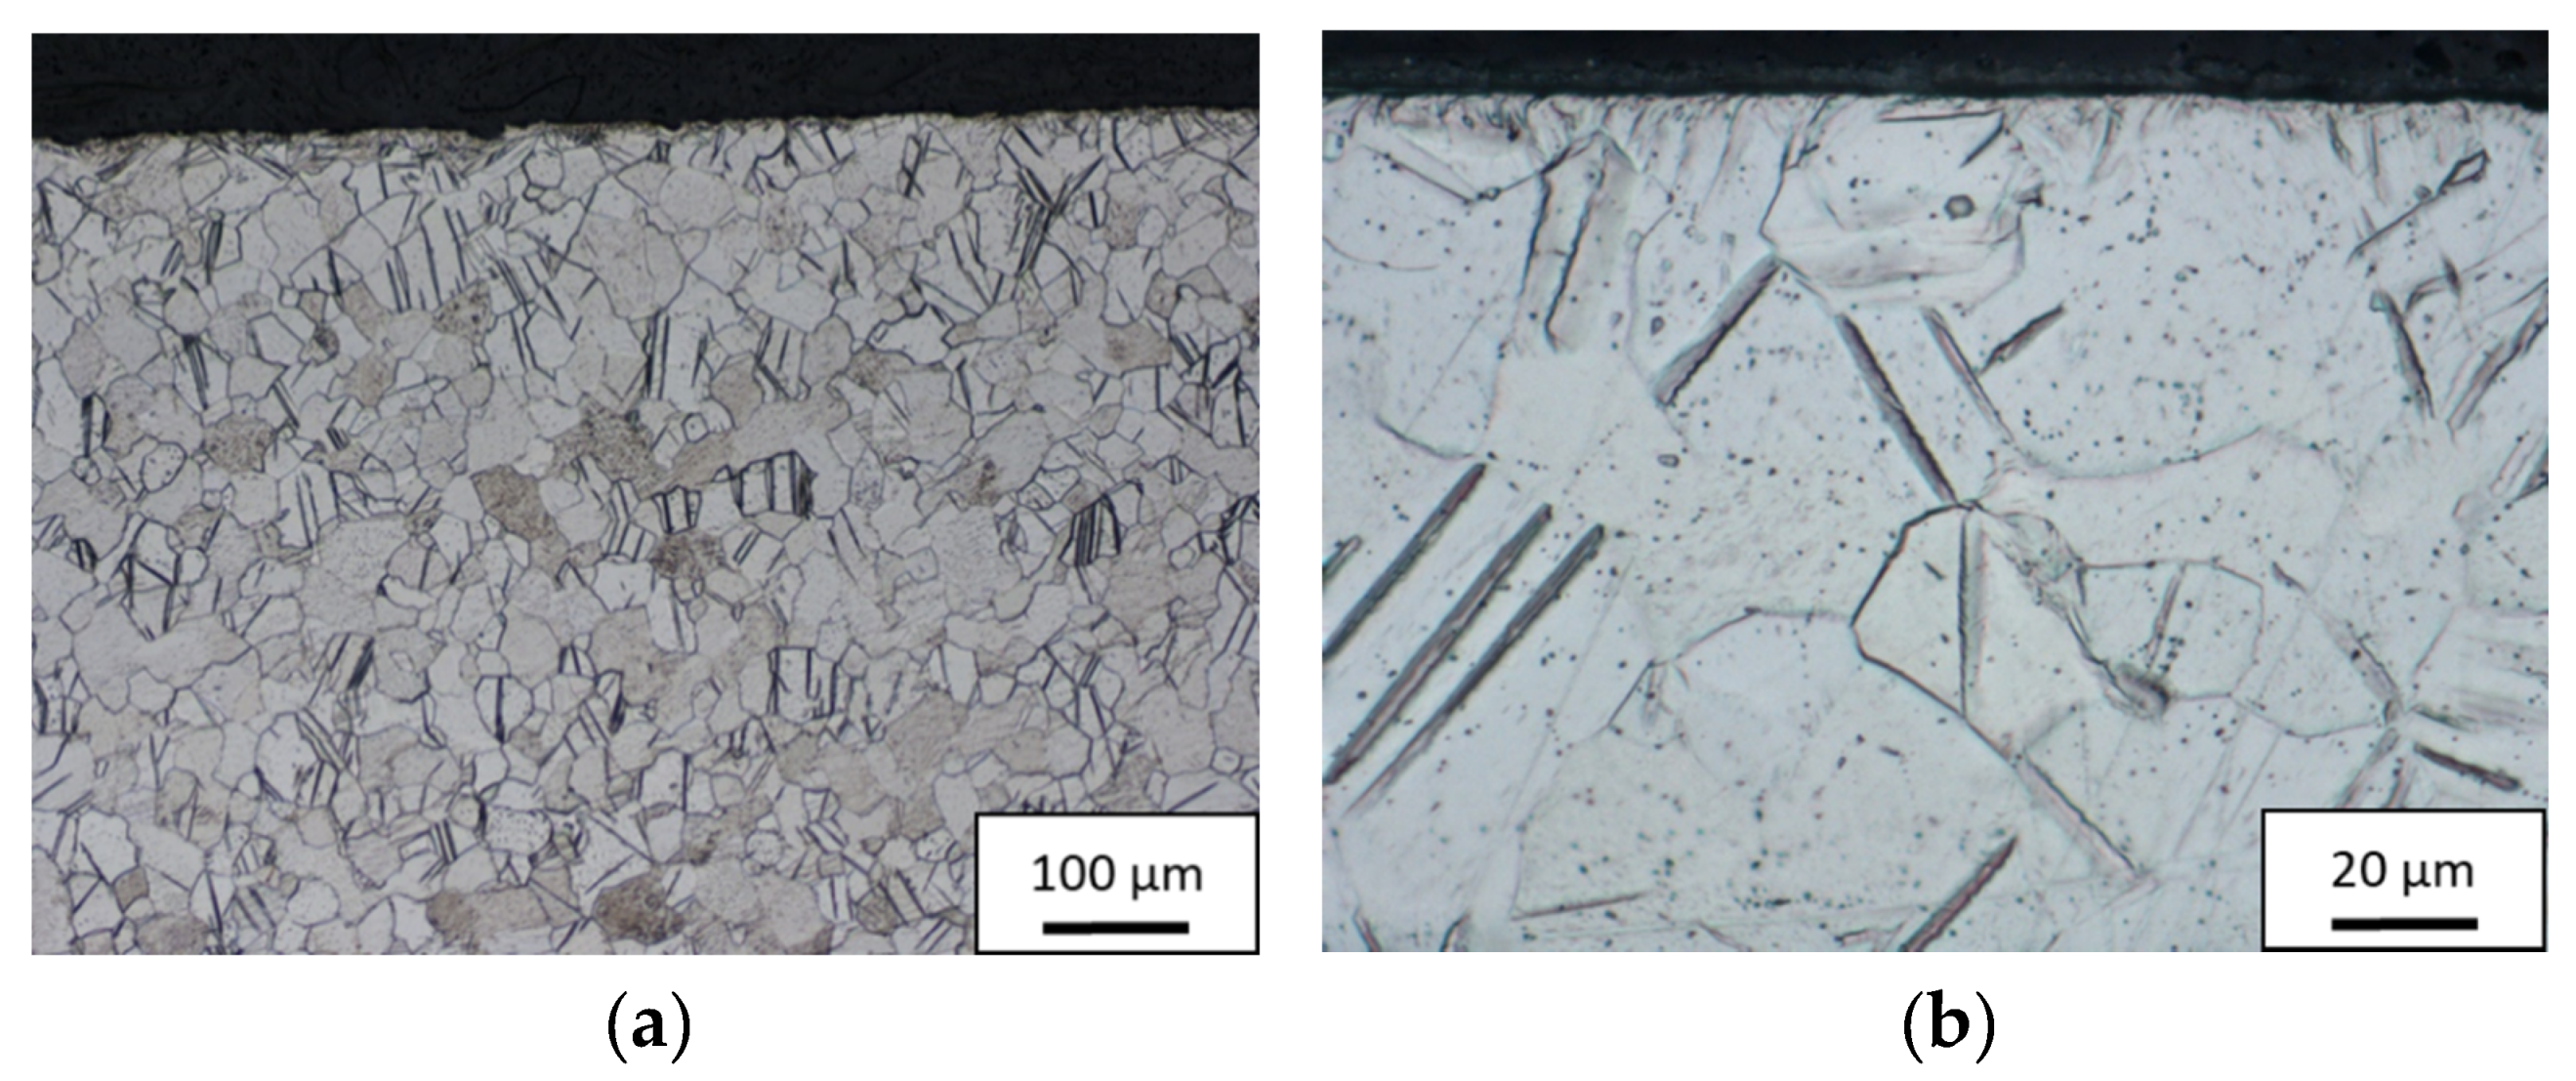
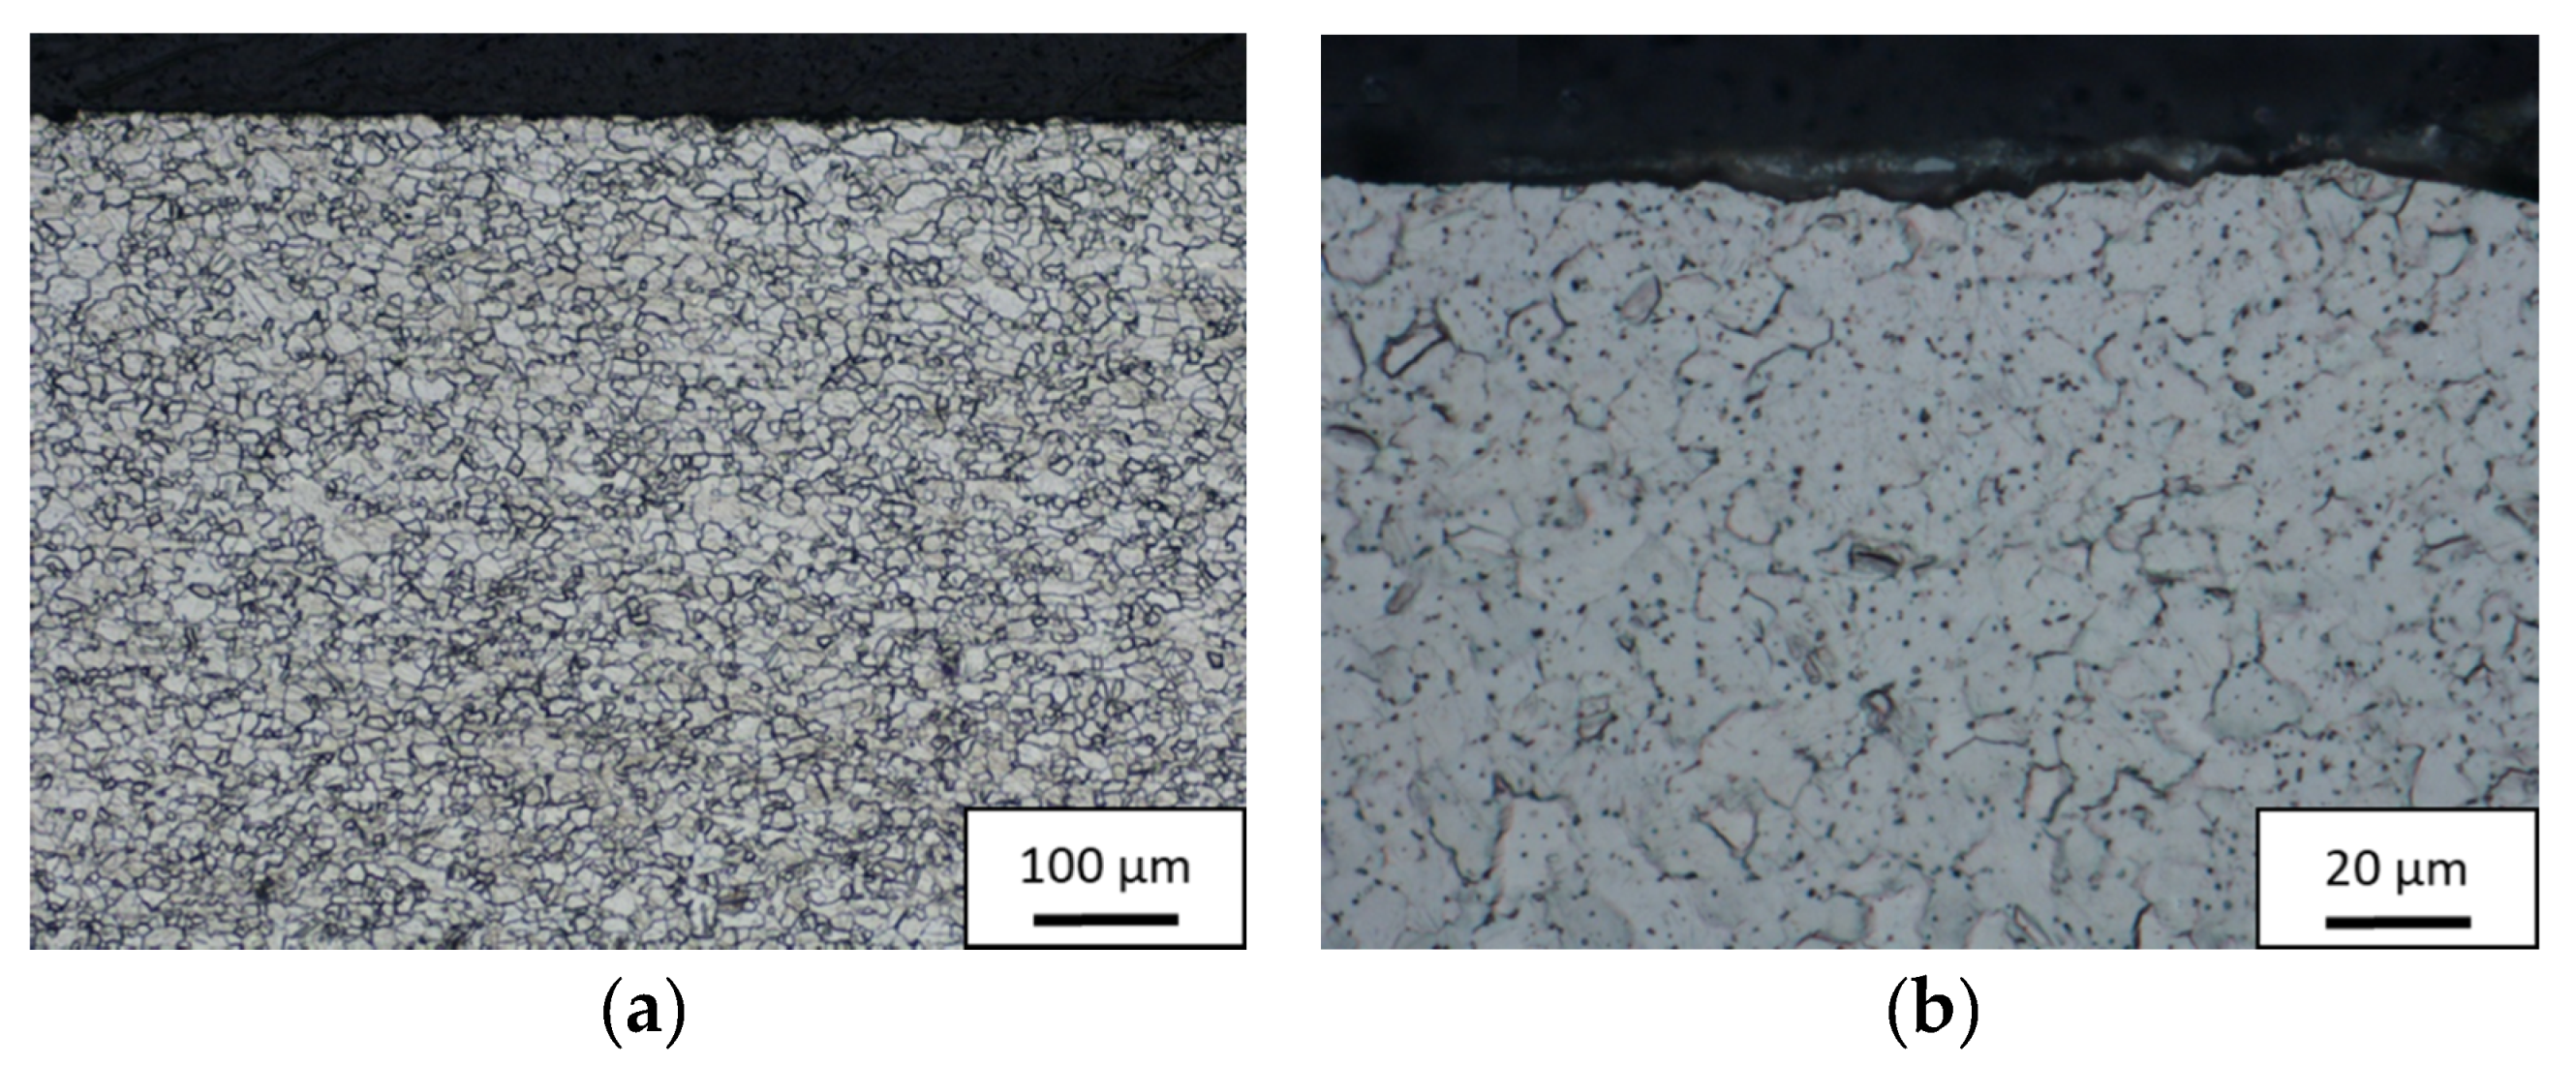
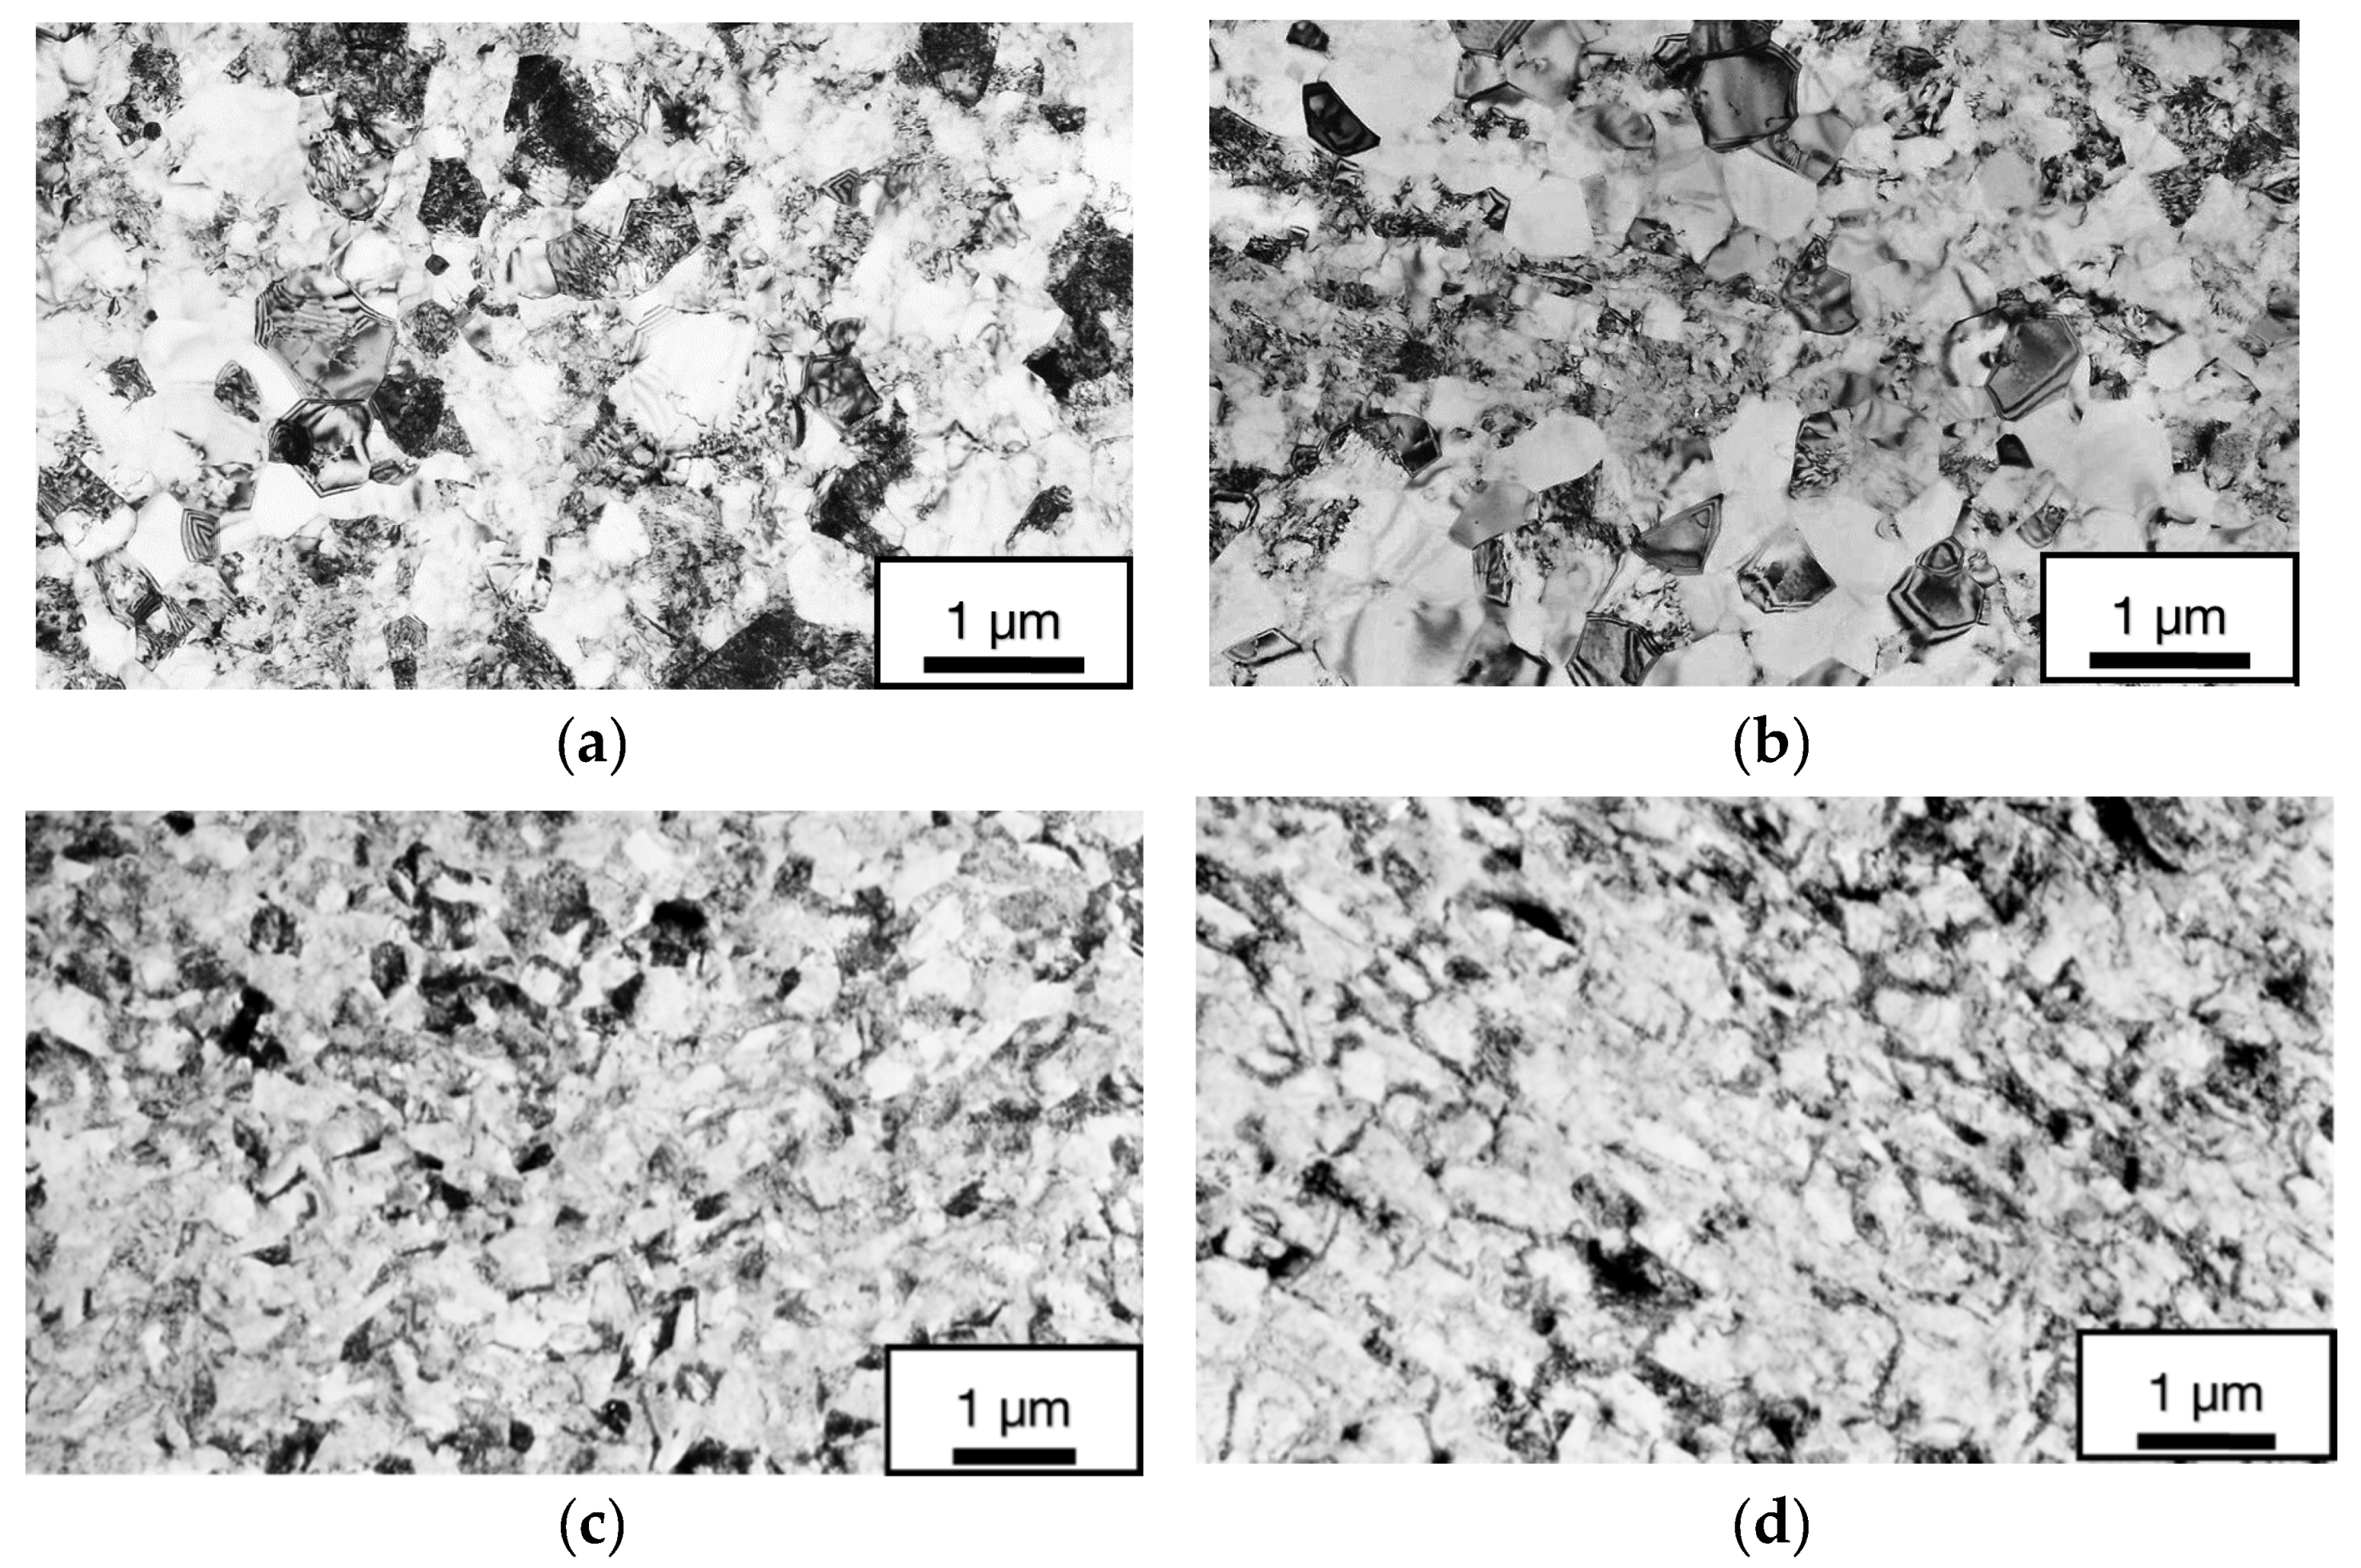
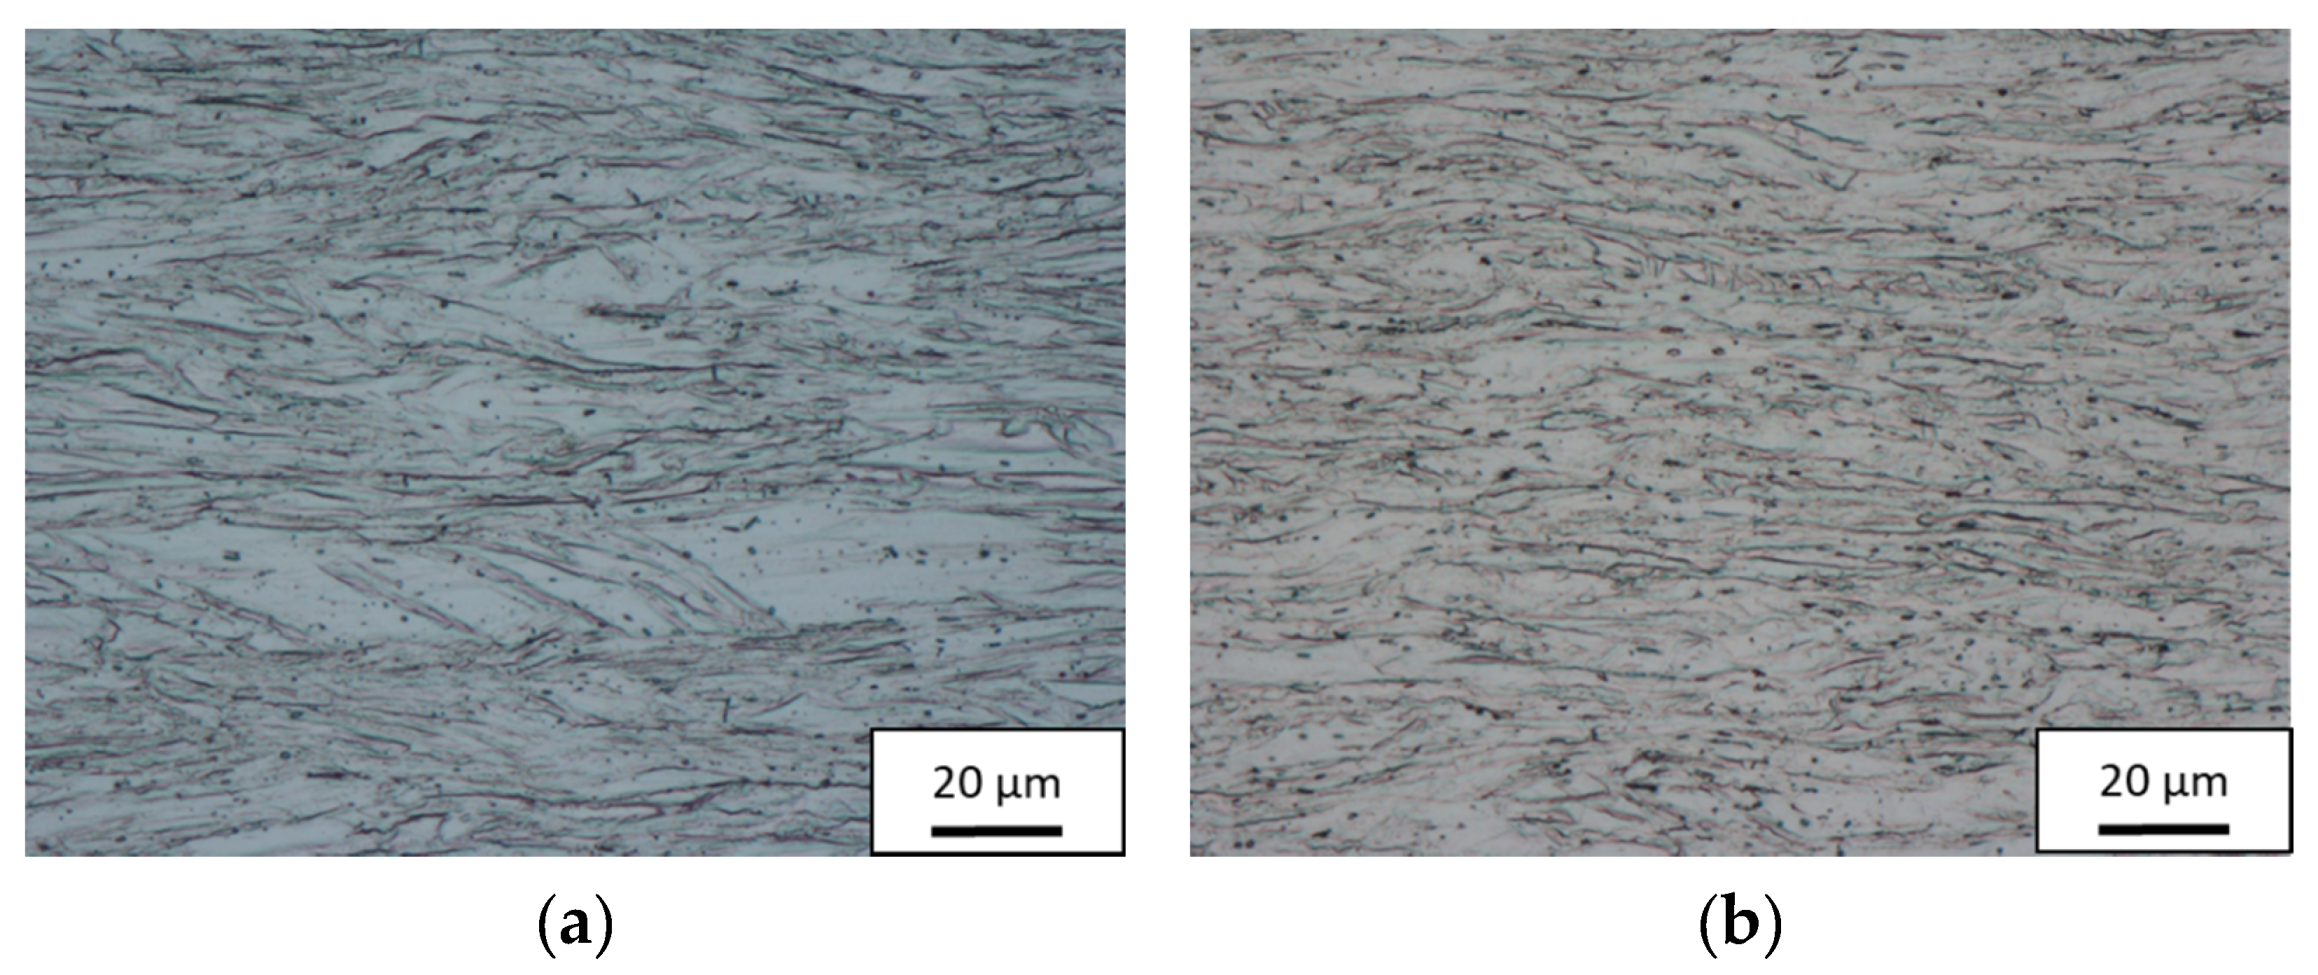
3.3. Microstructure
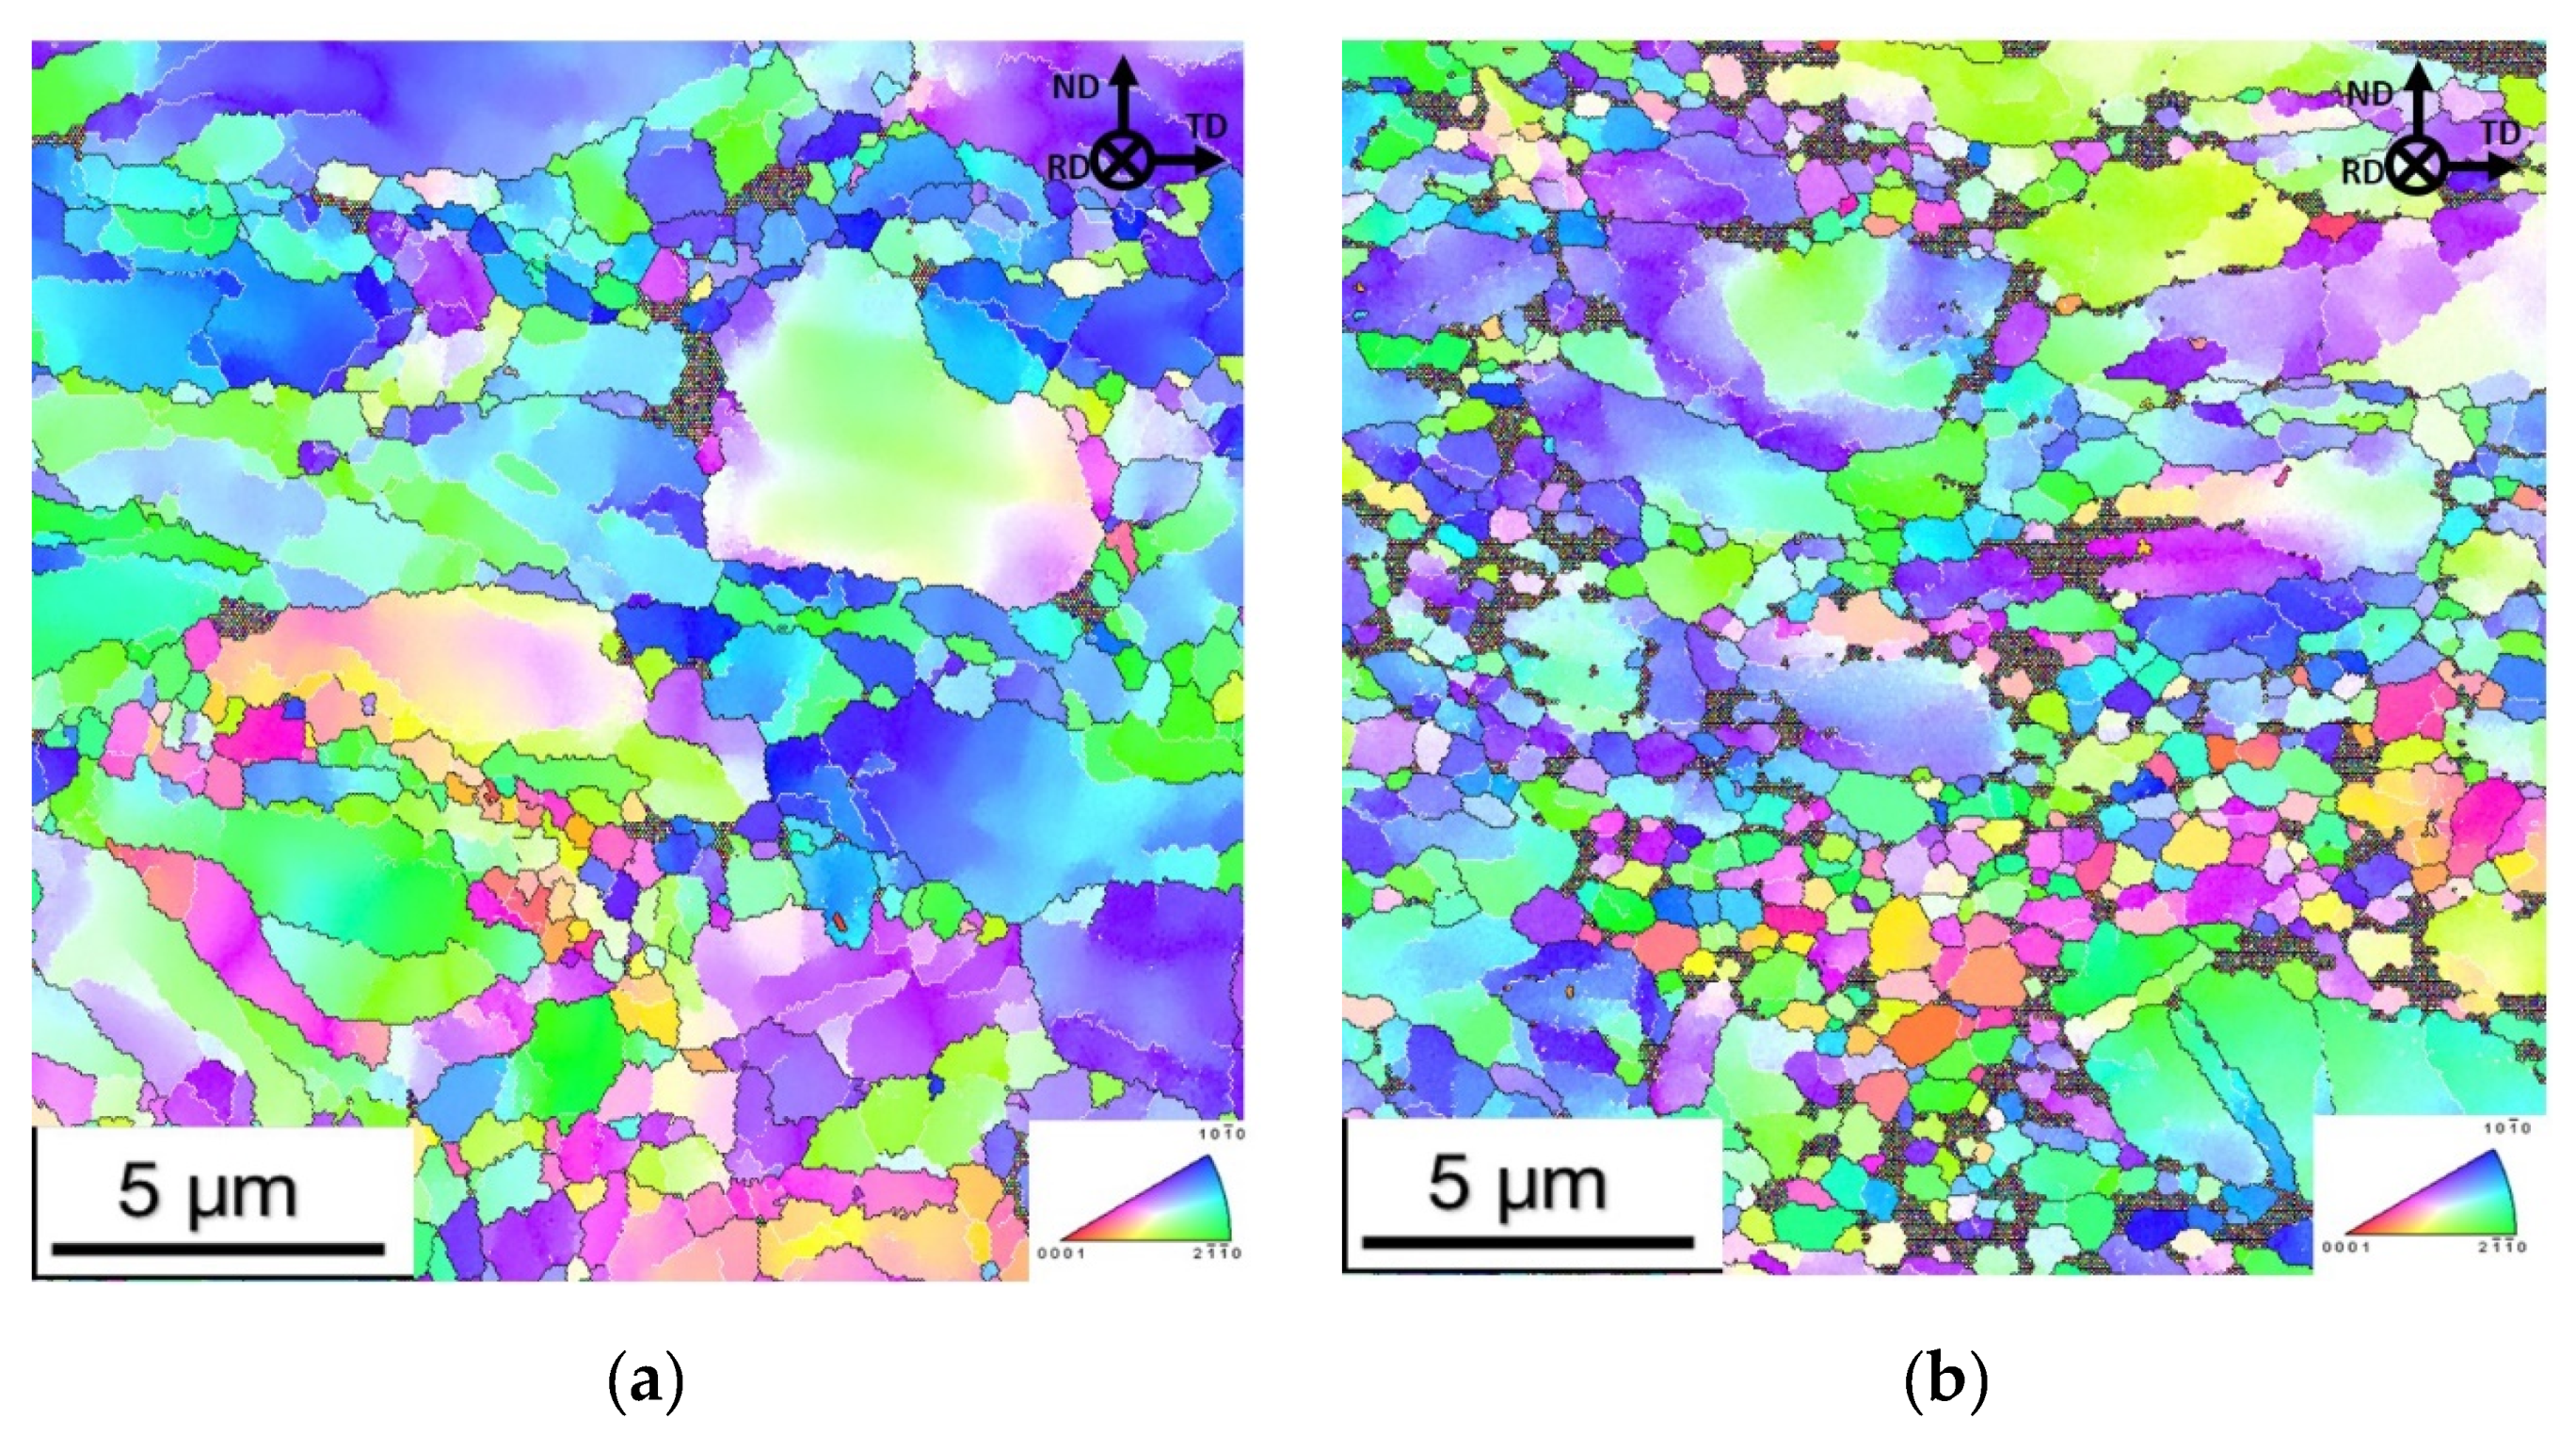
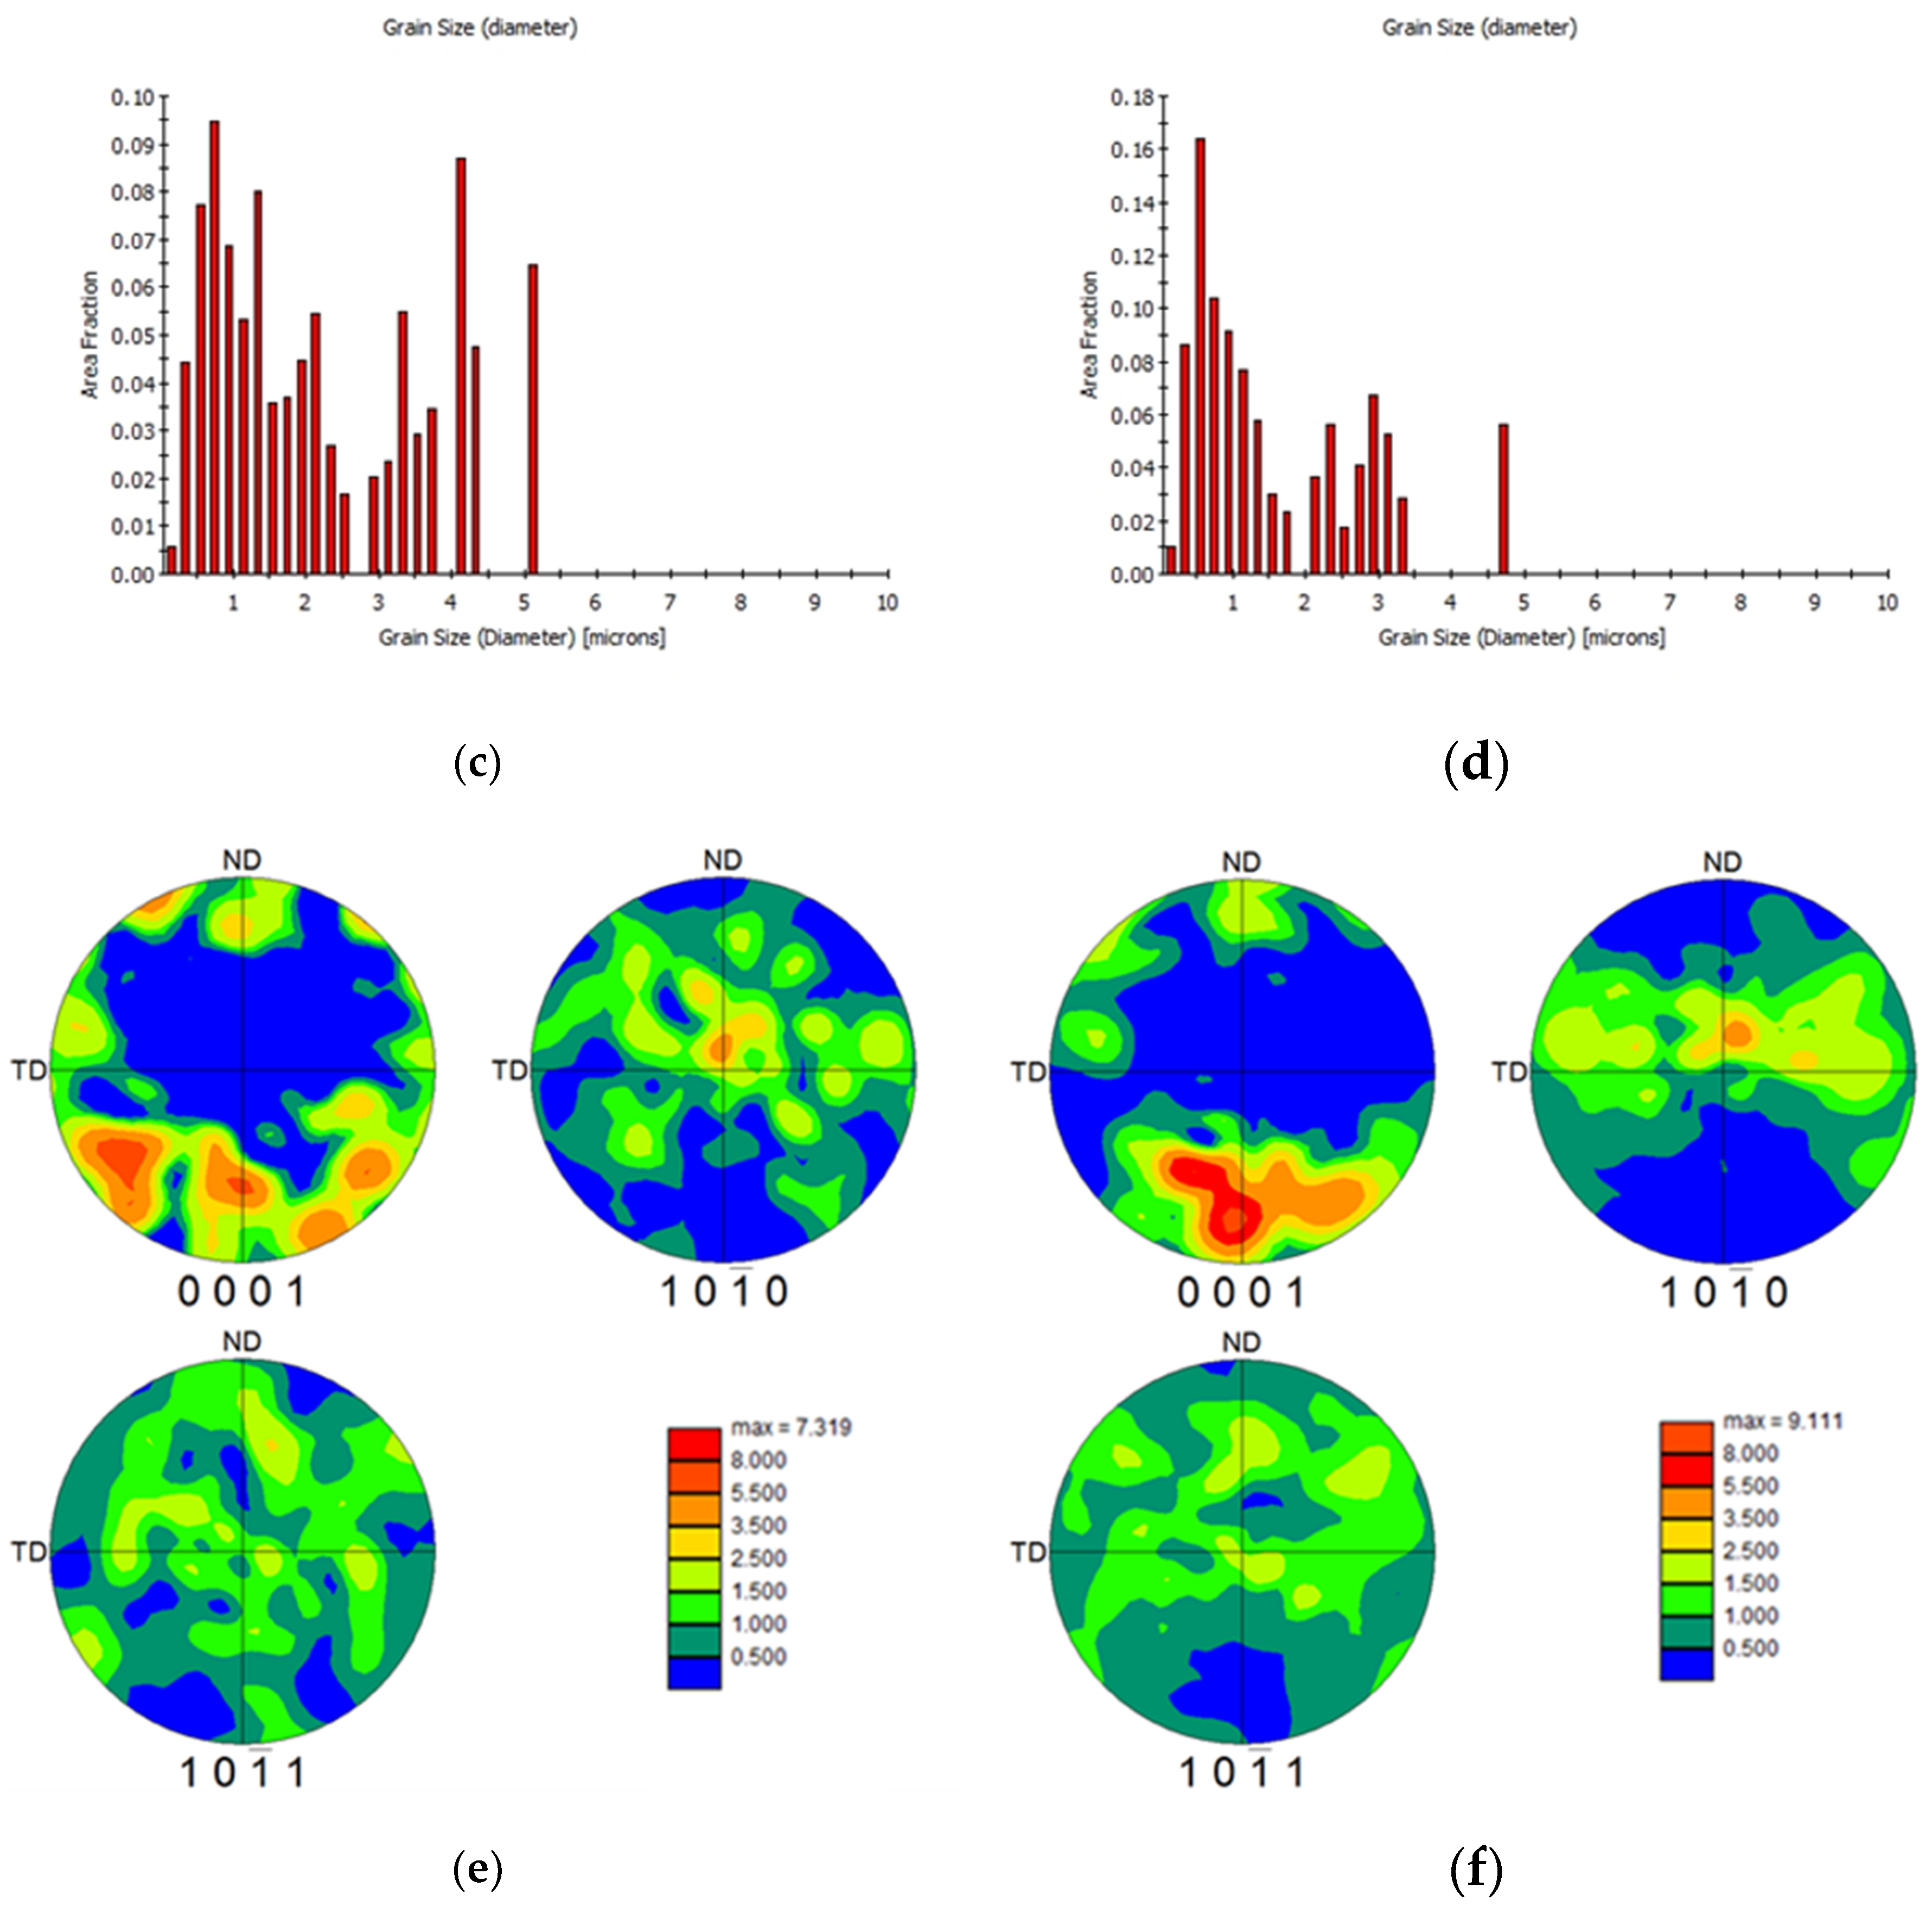
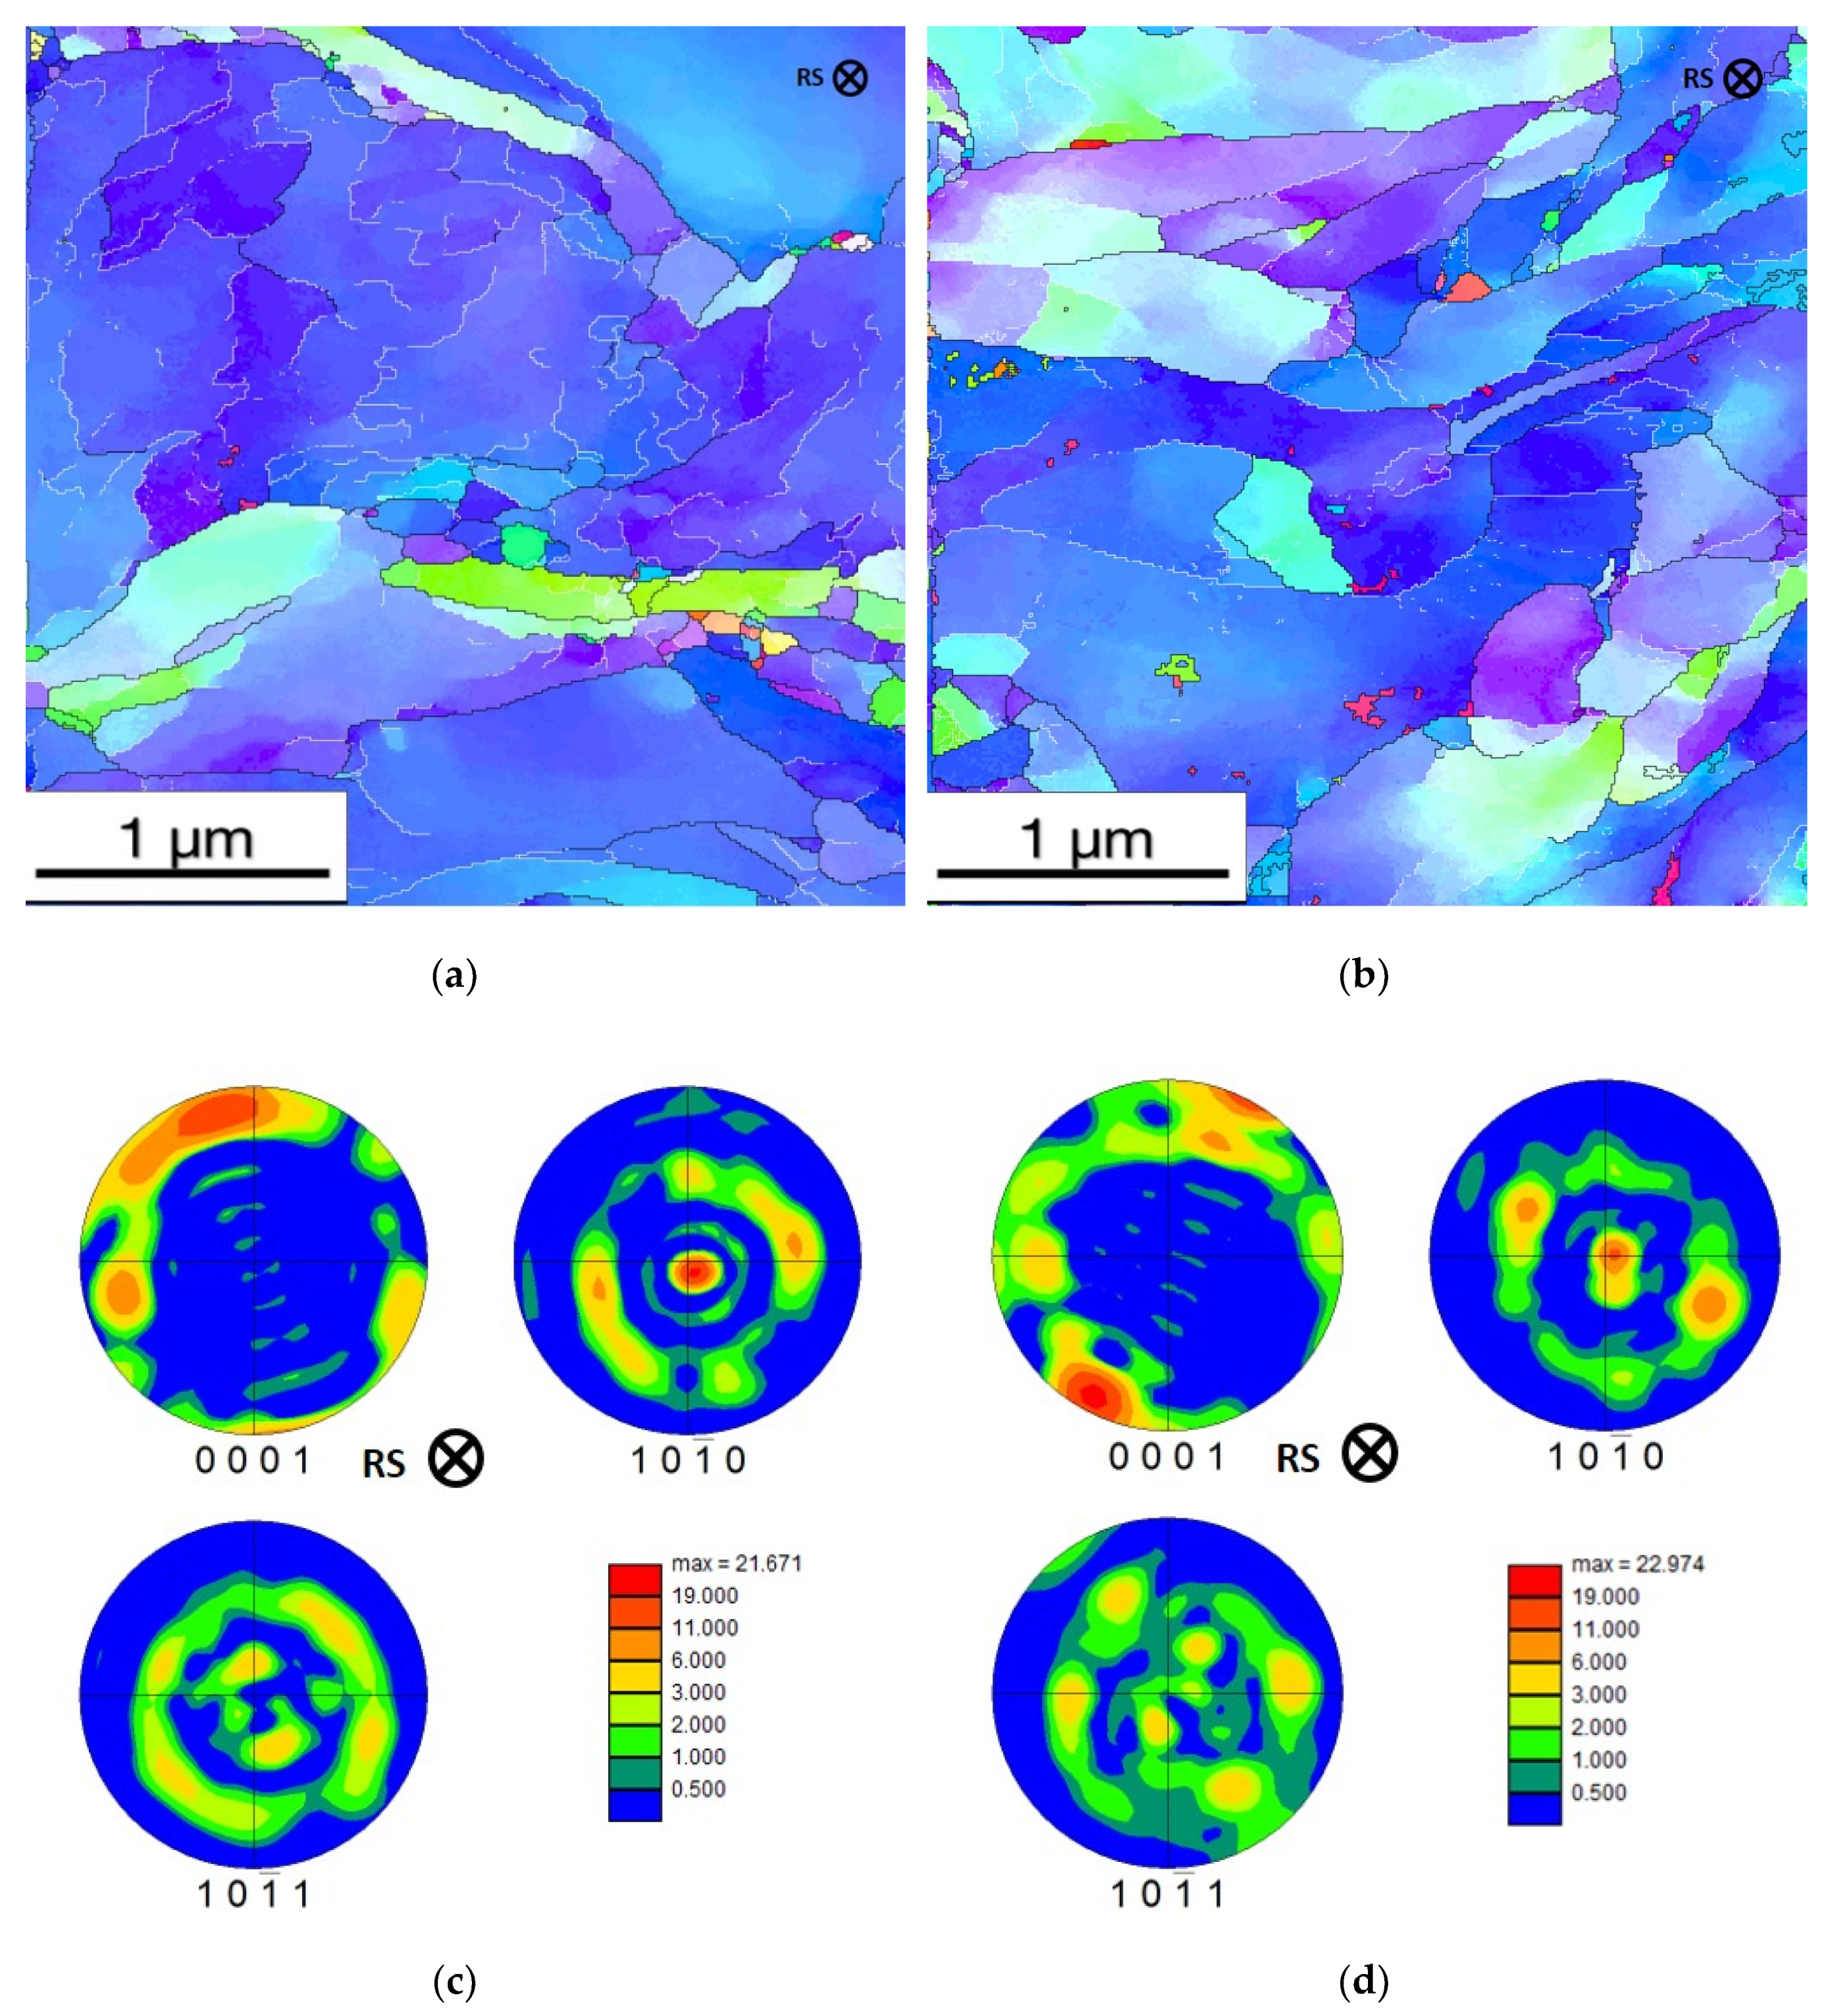
3.4. EBSD Analysis
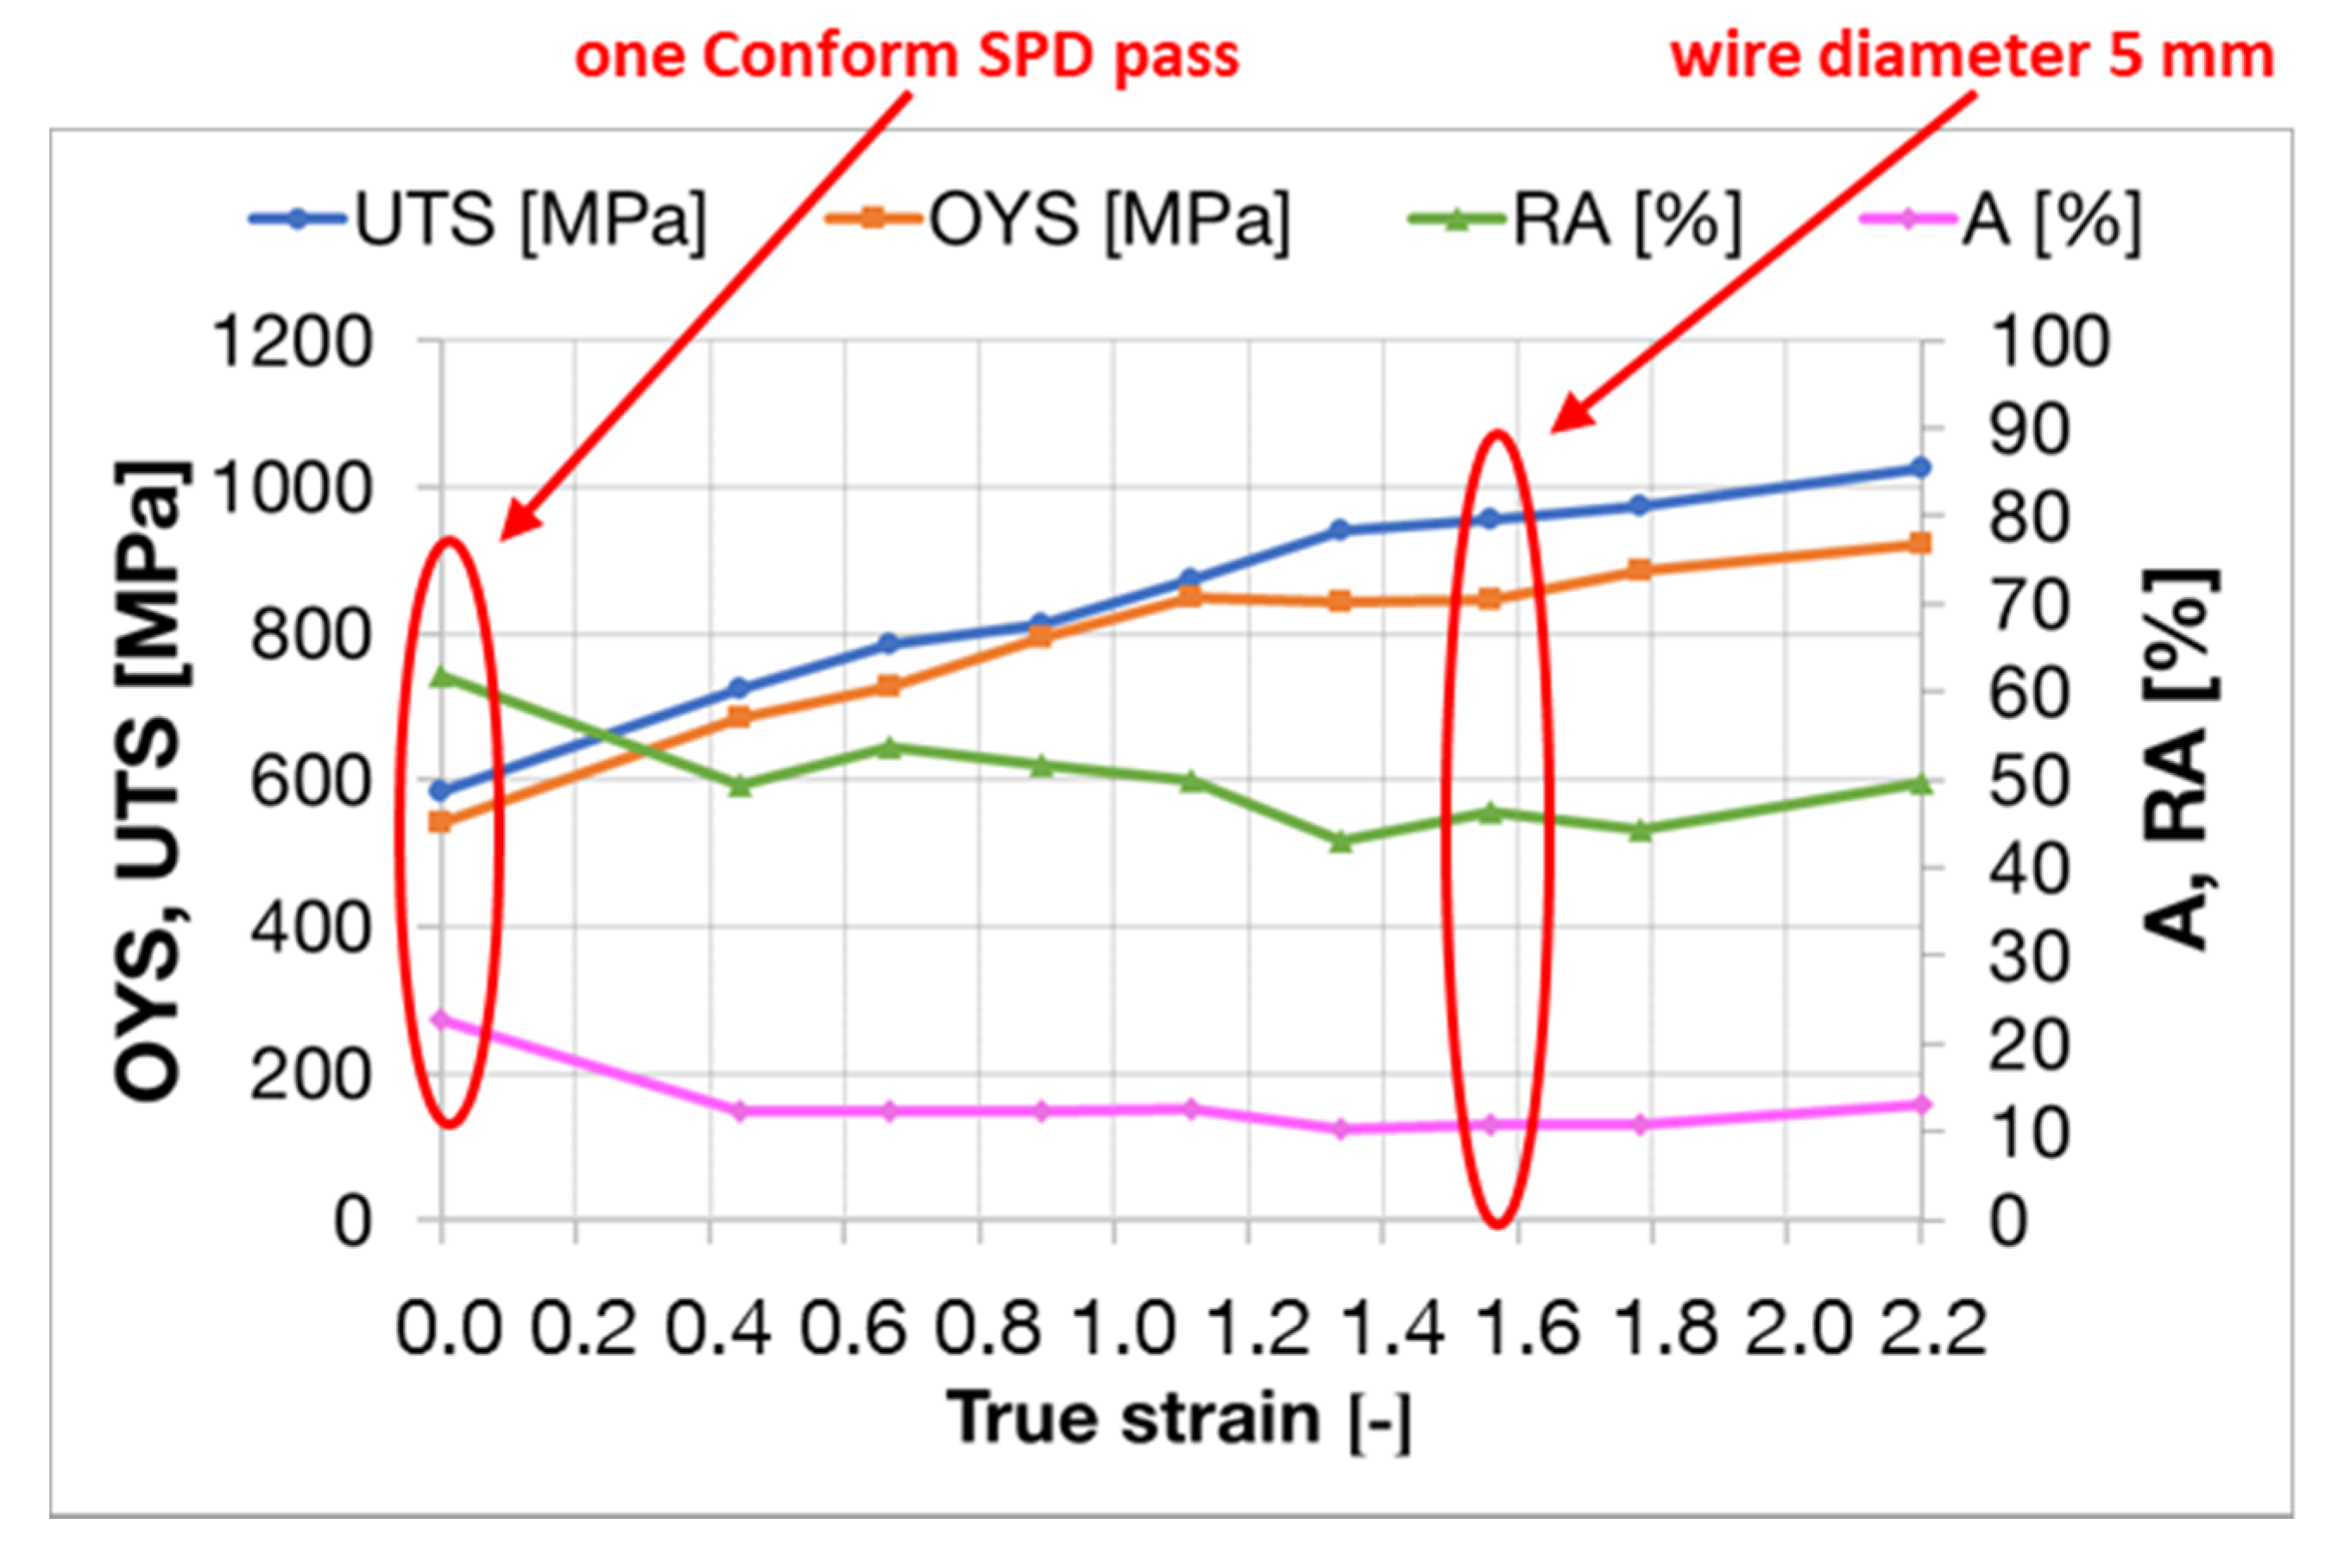
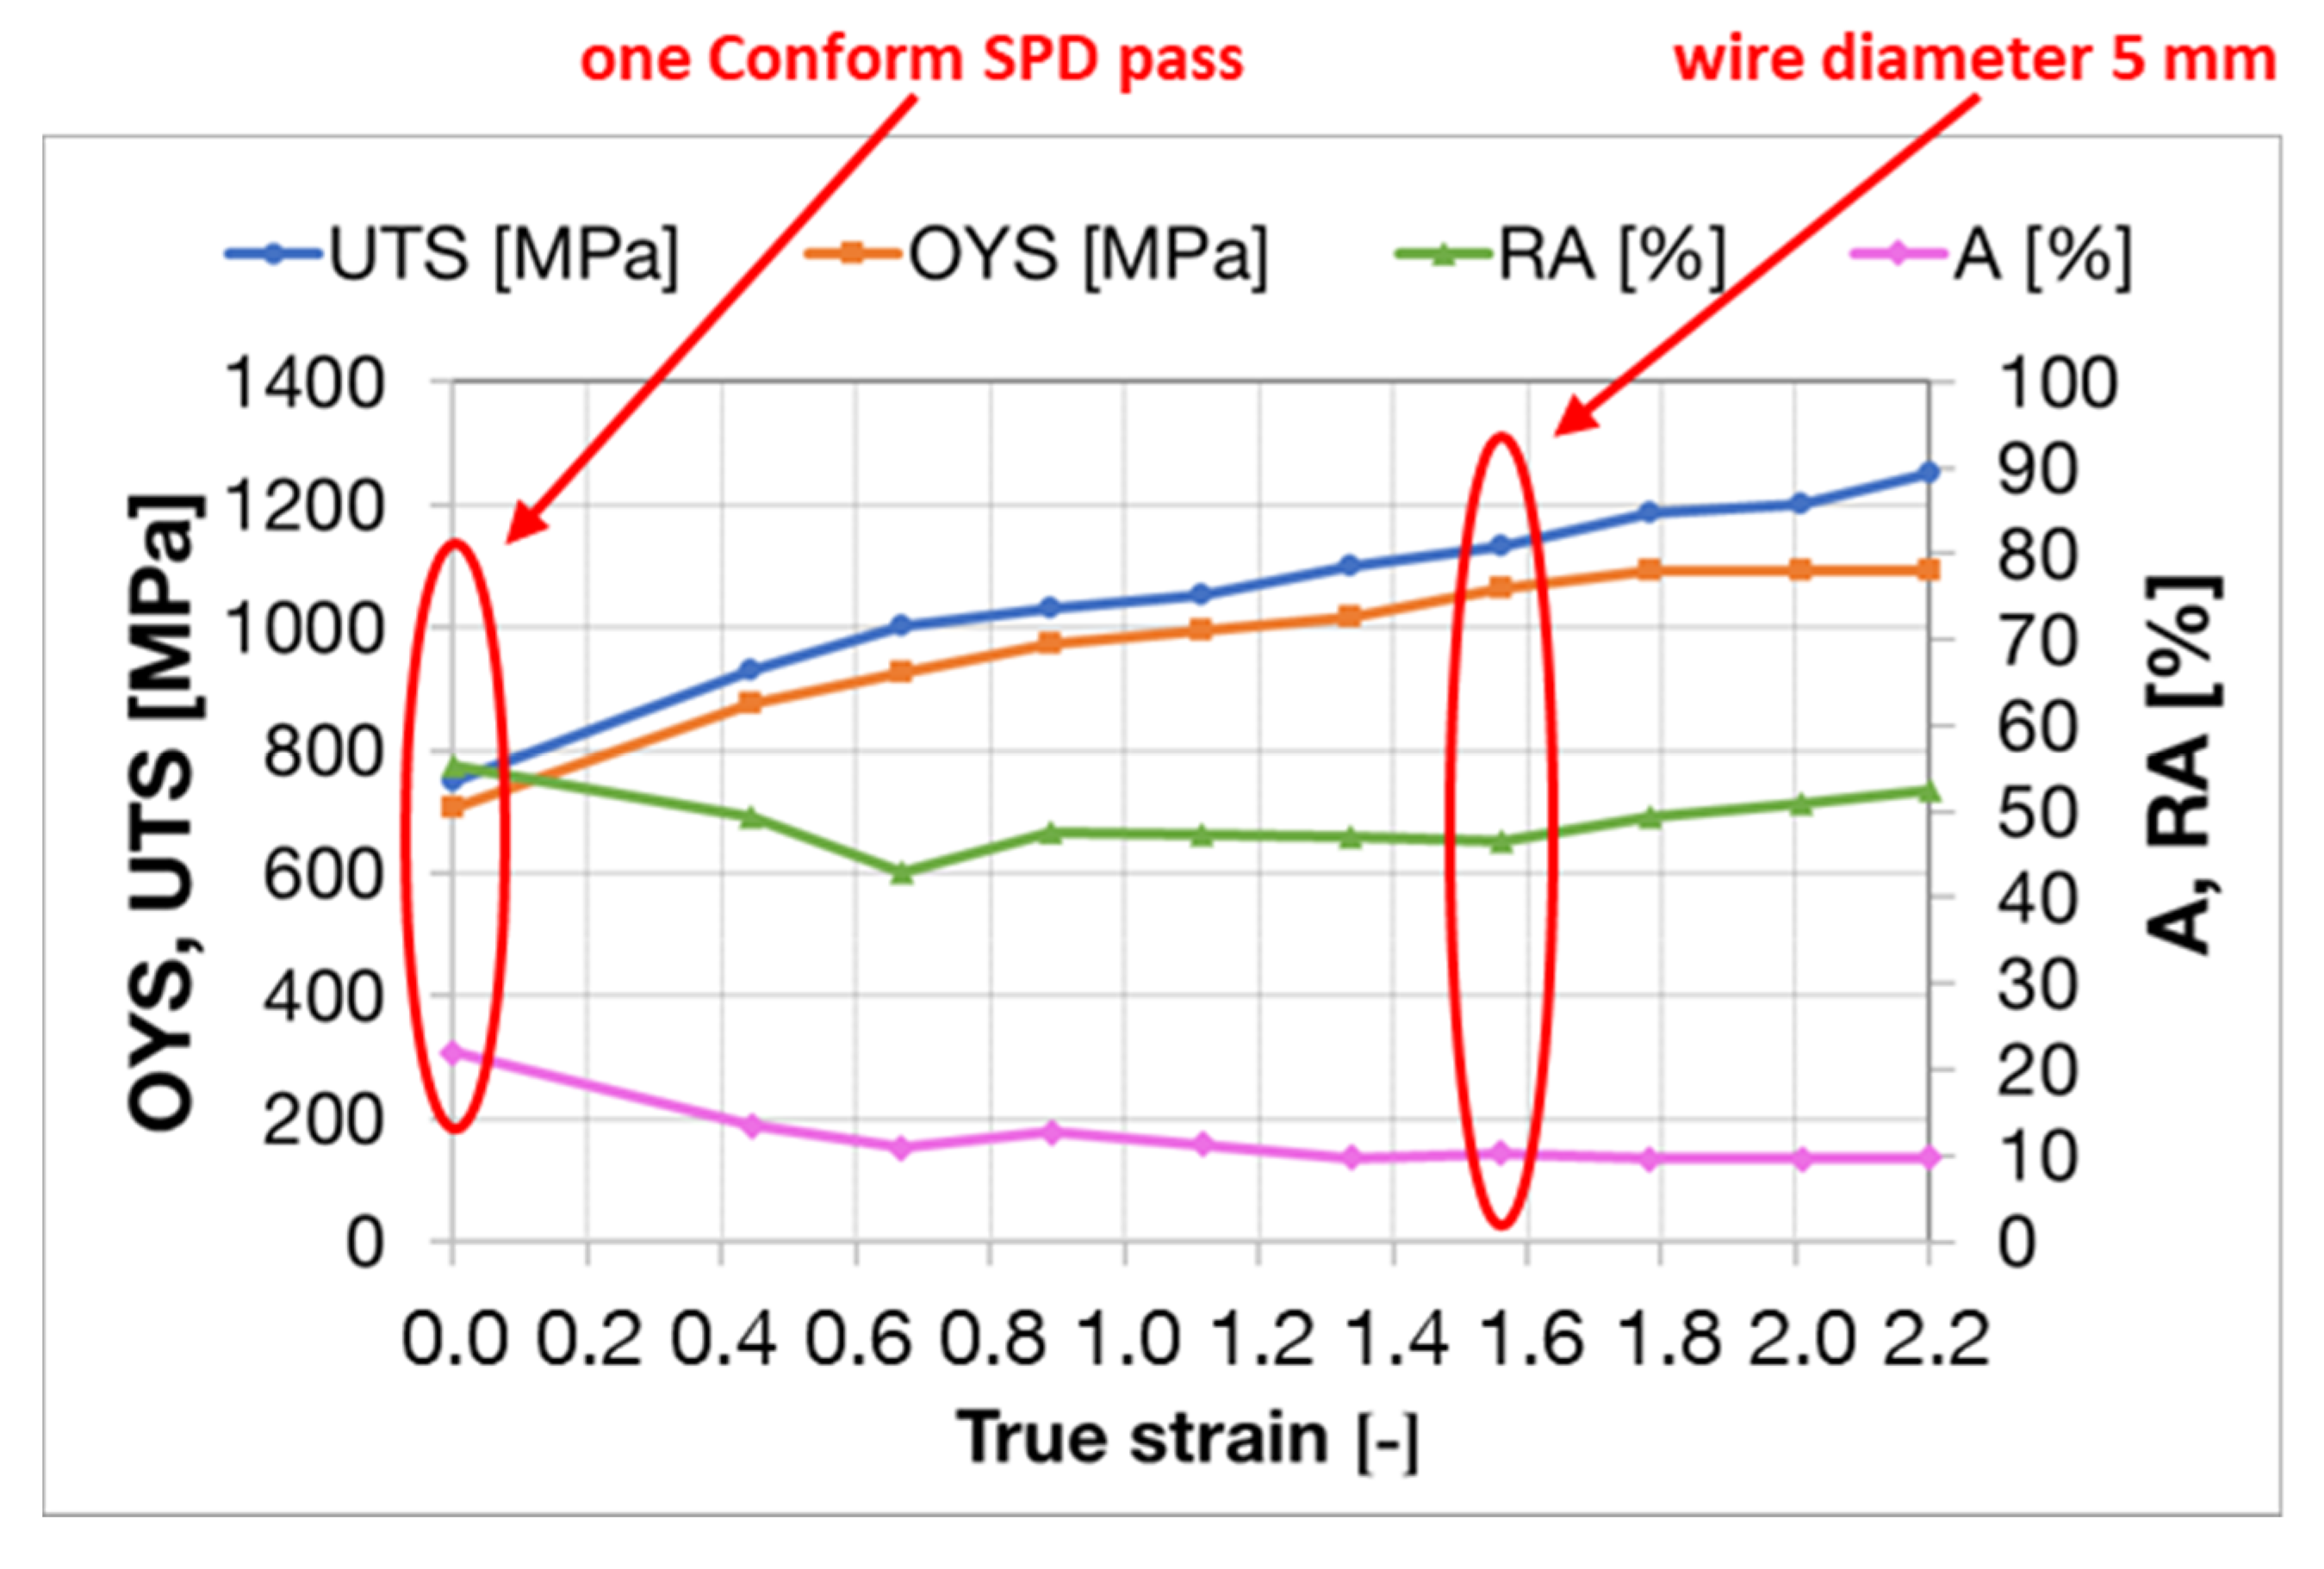
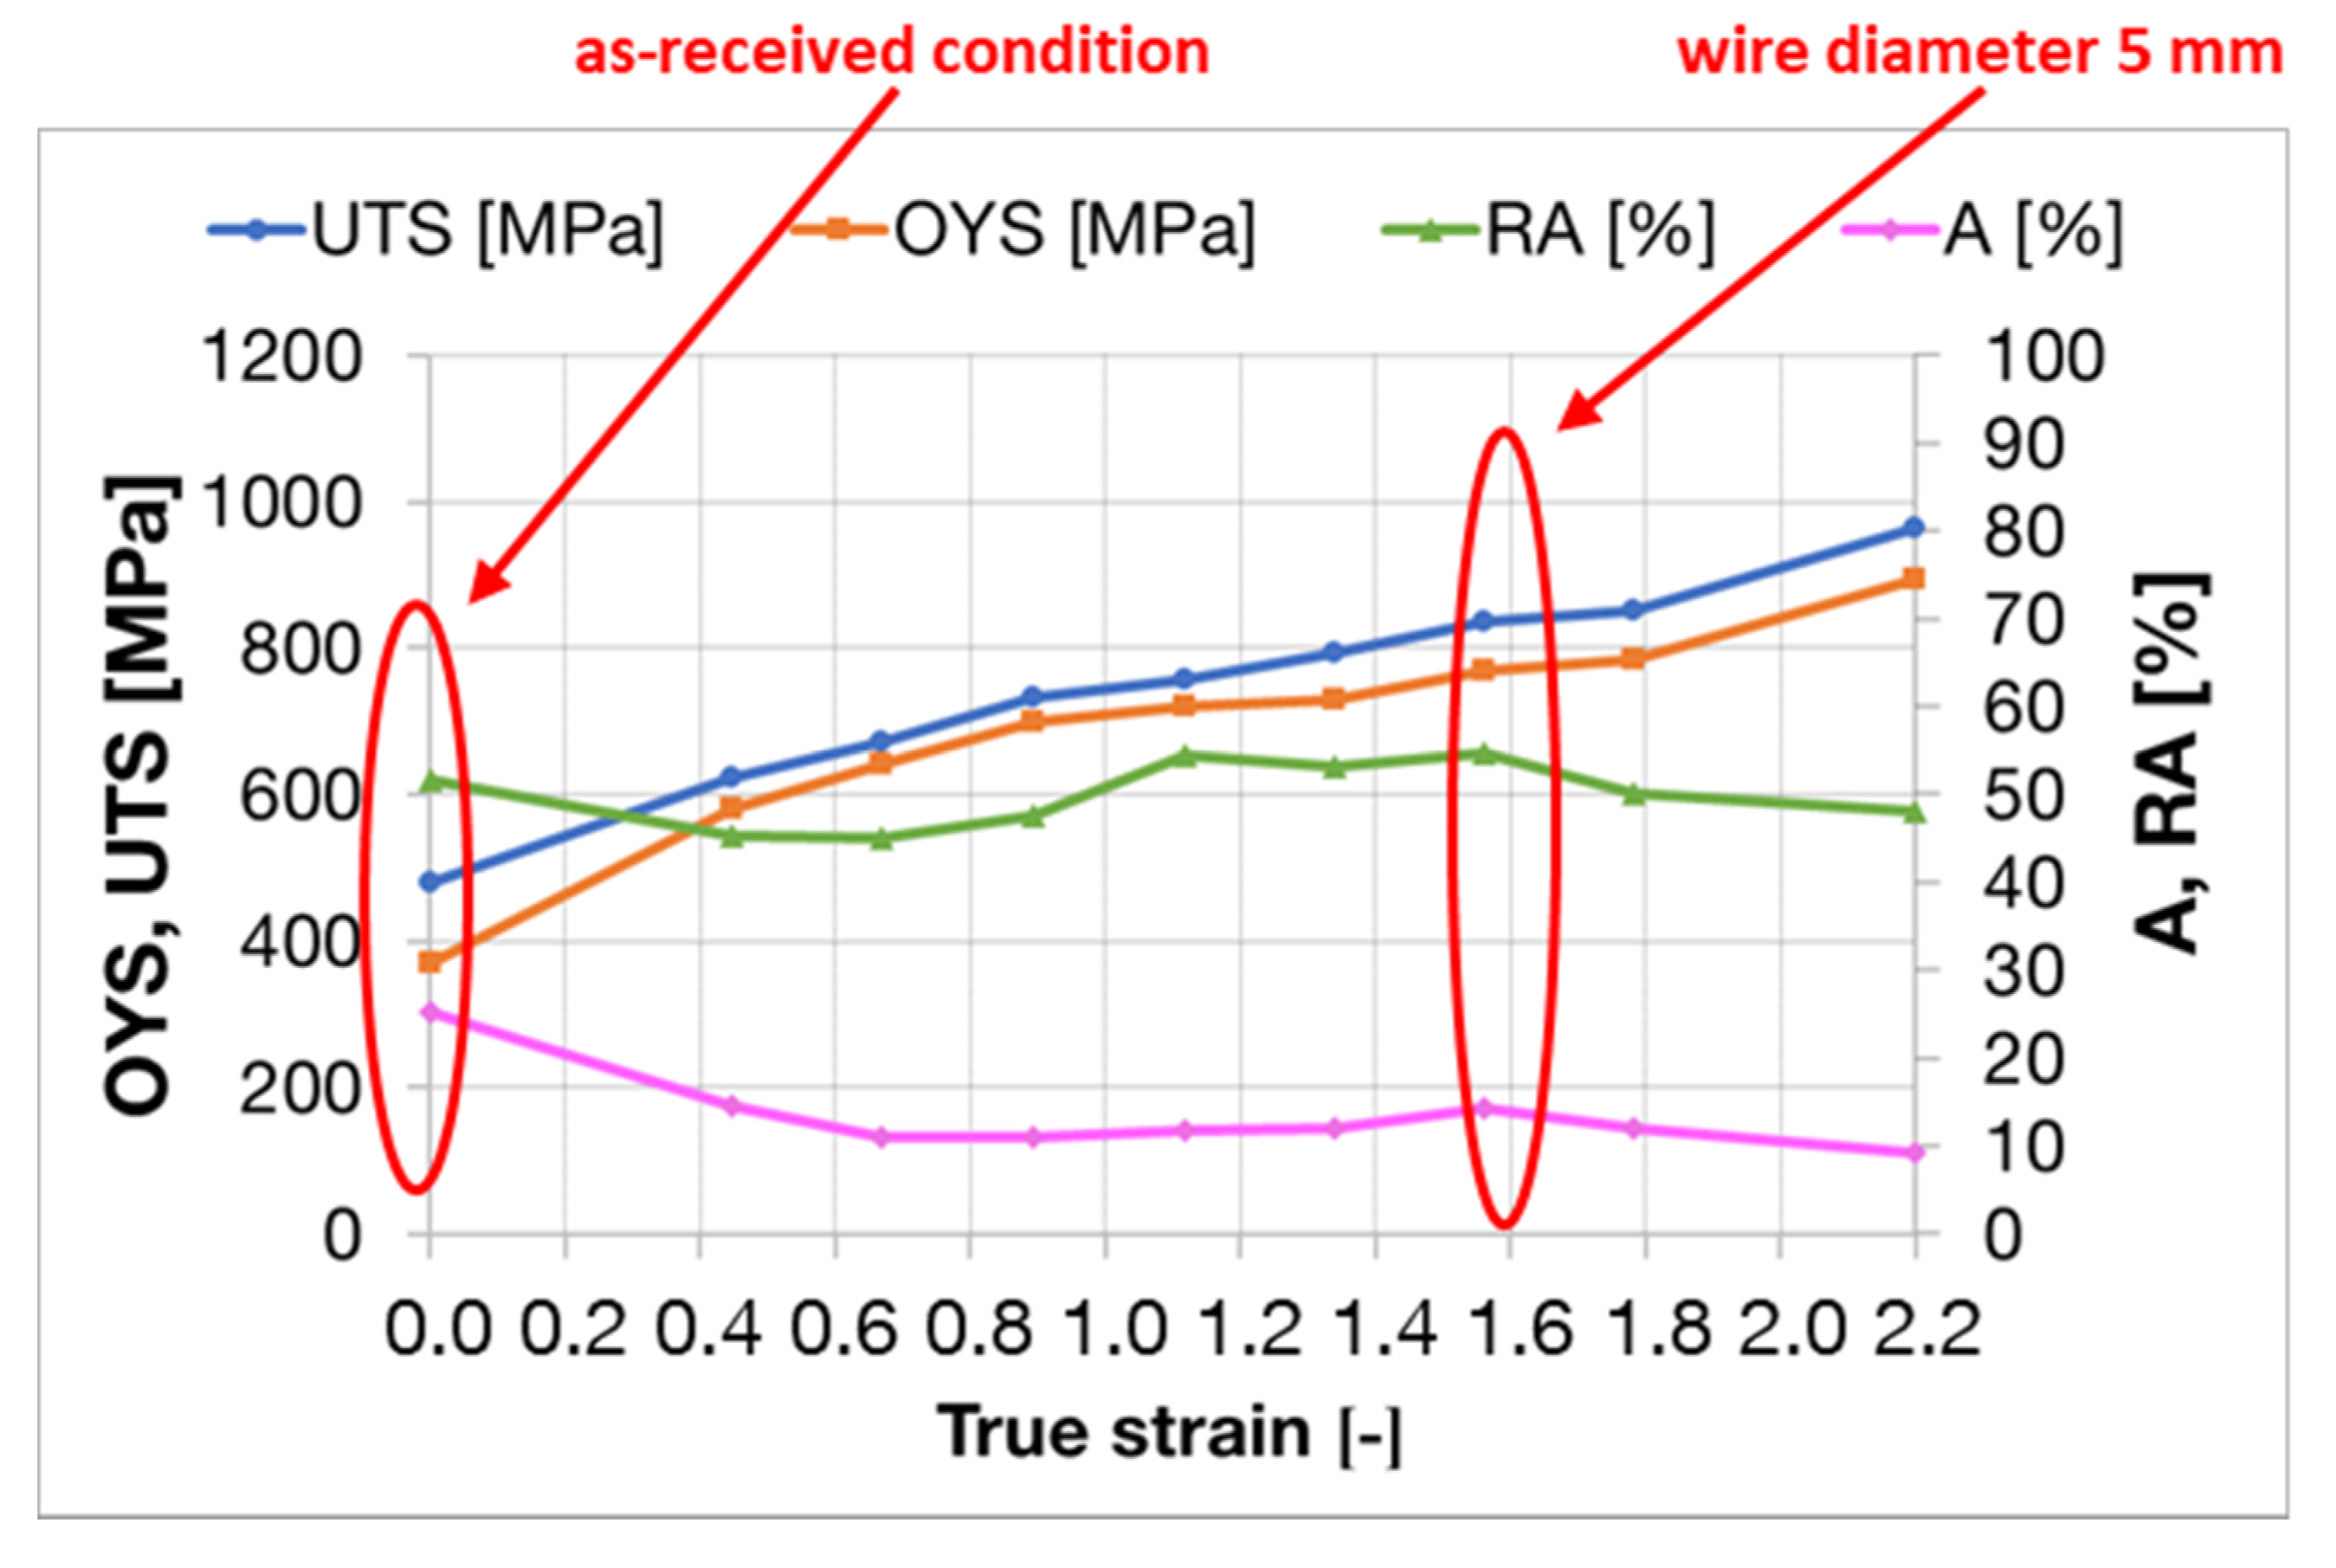
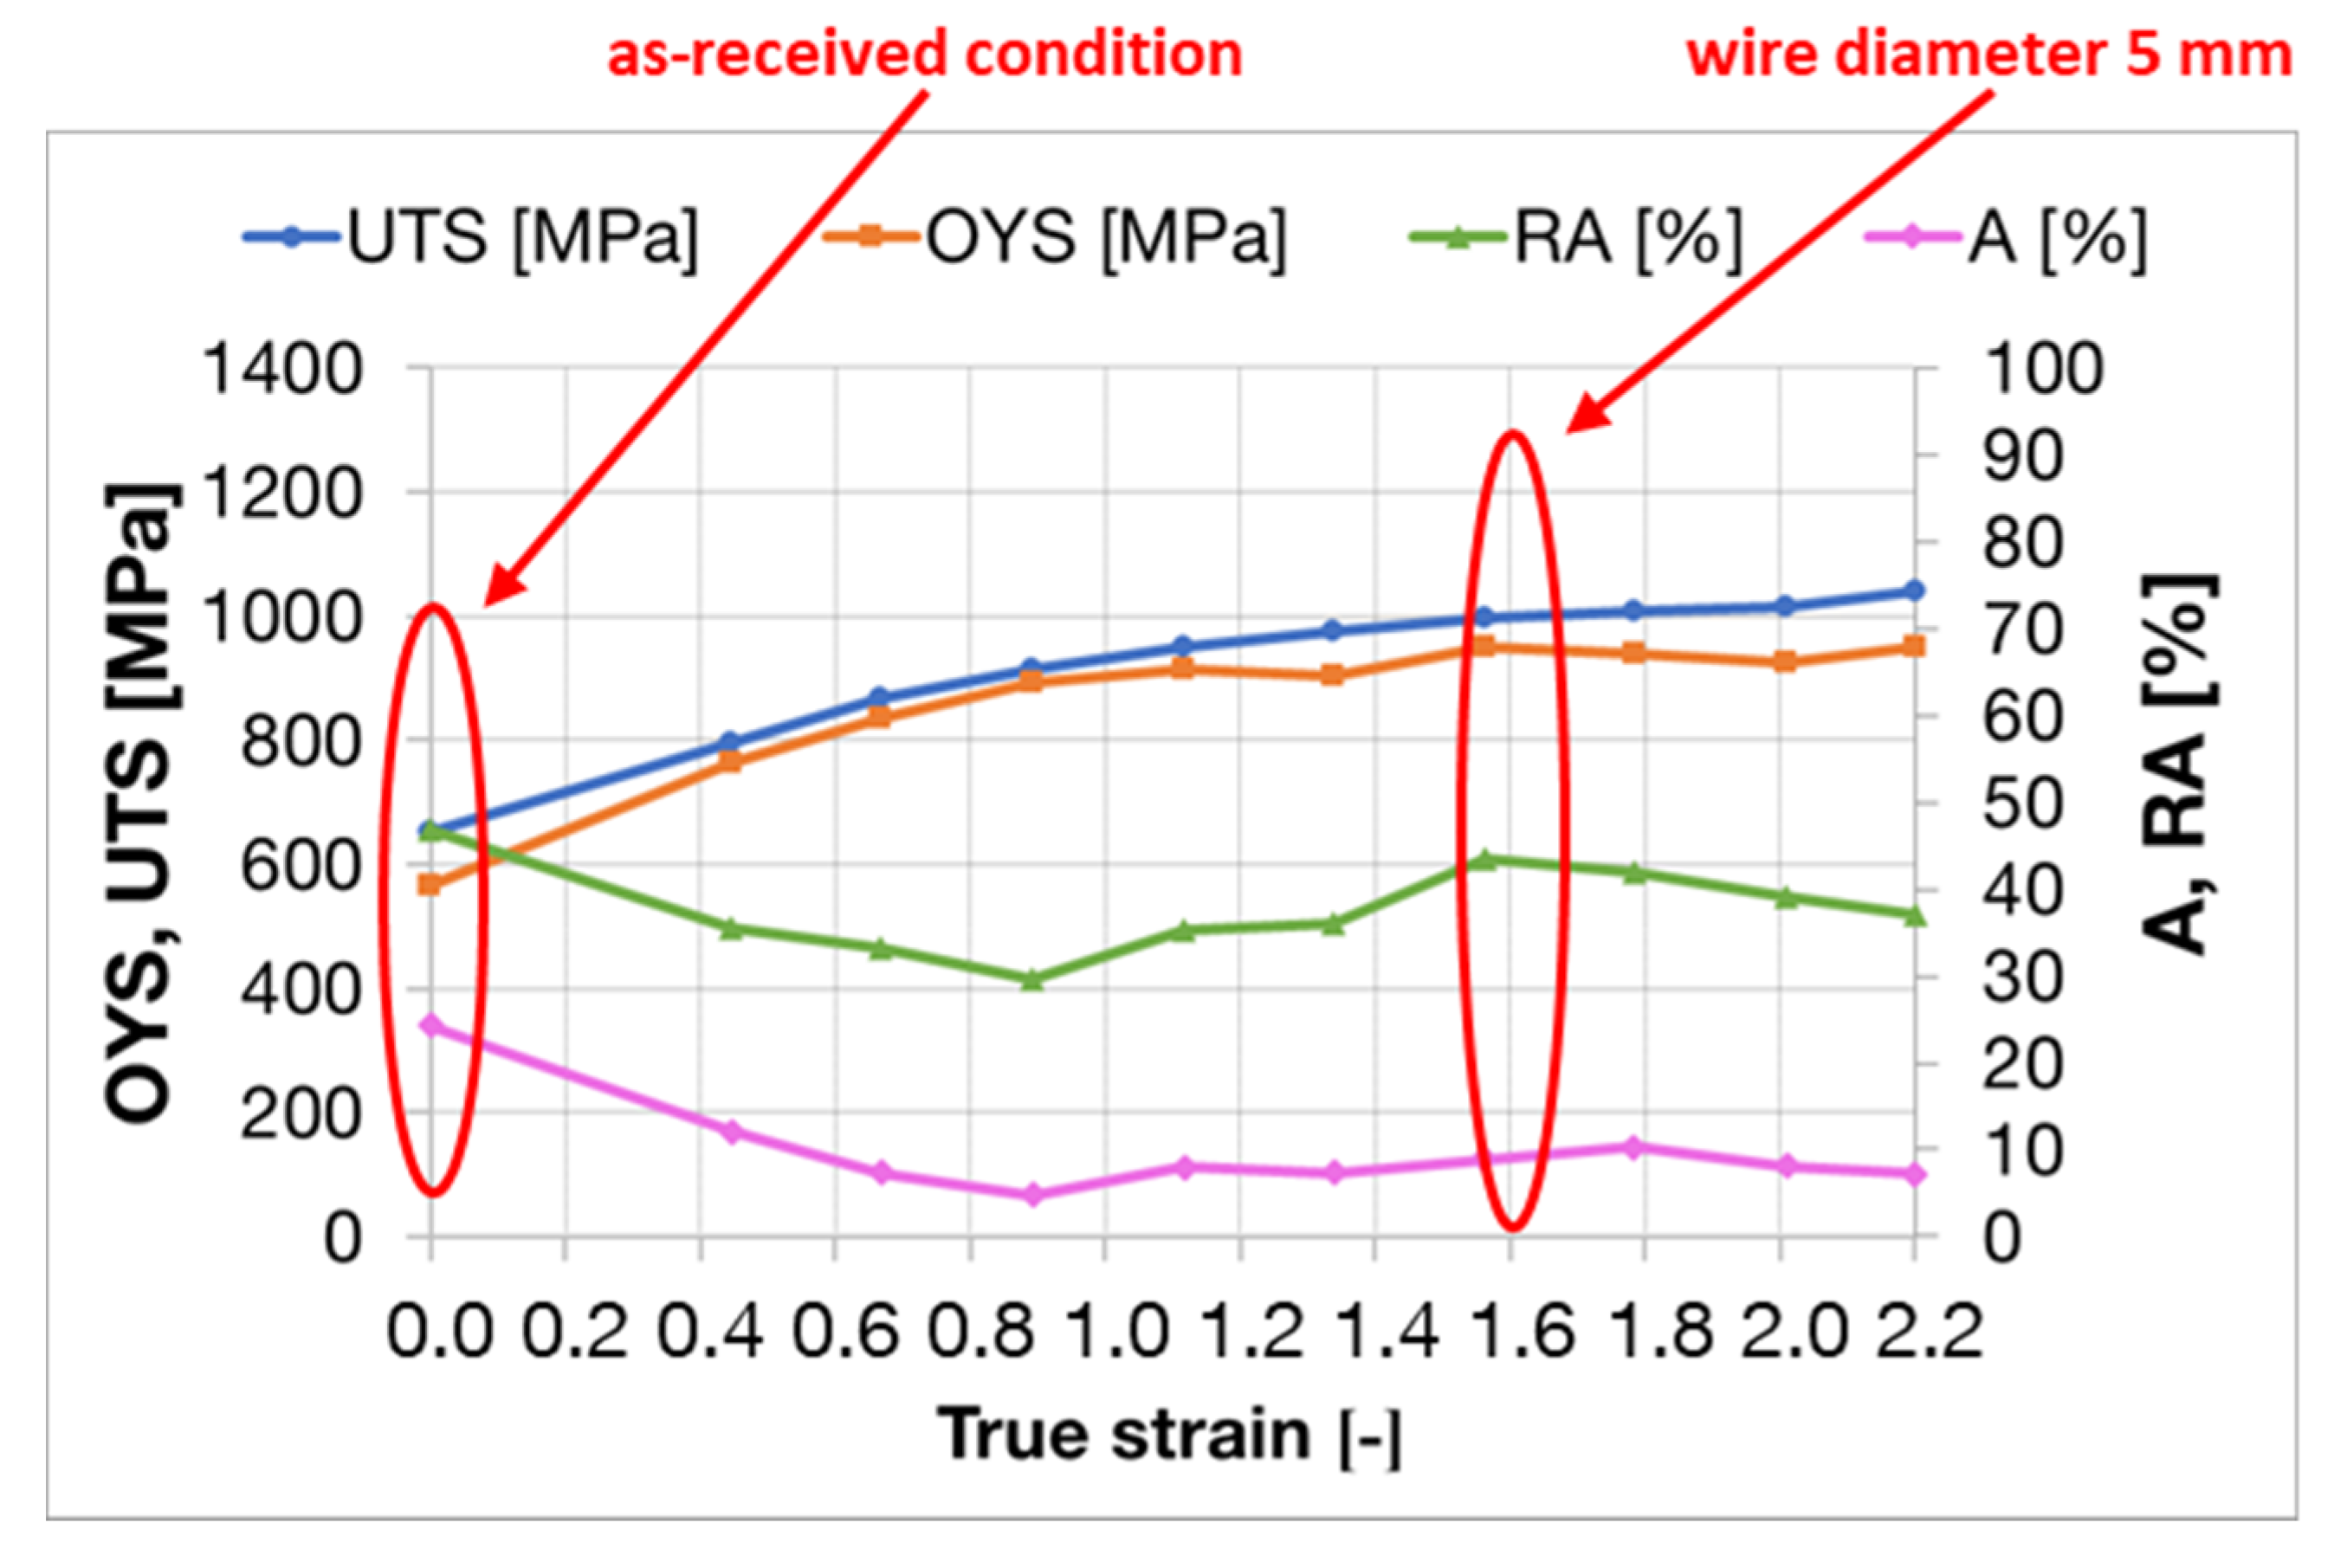
3.5. Mechanical Properties
3.6. Fatigue Performance
4. Discussion
5. Conclusions
Author Contributions
Funding
Conflicts of Interest
References
- Froes, F.H. Titanium: Physical Metallurgy Processing and Applications; SM International: Novelty, OH, USA, 1989; Volume 53, ISBN 9788578110796. [Google Scholar]
- Palán, J.; Maleček, L.; Hodek, J.; Zemko, M.; Dzugan, J. Possibilities of biocompatible material production using conform SPD technology. Arch. Mater. Sci. Eng. 2017, 88, 5–11. [Google Scholar] [CrossRef]
- Palán, J.; Zemko, M. The high strength biocompatible wires of commercially pure titanium. Int. J. Mater. Metall. Eng. 2017, 11, 477–481. [Google Scholar]
- Mertová, K.; Salvetr, P.; Duchek, M. Comparison of cryogenic and cold deformation of commercially pure titanium. Mater. Today Proc. 2020, 10–13. [Google Scholar] [CrossRef]
- Mishnaevsky, L.; Levashov, E.; Valiev, R.Z.; Segurado, J.; Sabirov, I.; Enikeev, N.; Prokoshkin, S.; Solov’Yov, A.V.; Korotitskiy, A.; Gutmanas, E.; et al. Nanostructured titanium-based materials for medical implants: Modeling and development. Mater. Sci. Eng. R Rep. 2014, 81, 1–19. [Google Scholar] [CrossRef]
- Semenova, I.P.; Valiev, R.Z.; Yakushina, E.B.; Salimgareeva, G.H.; Lowe, T.C. Strength and fatigue properties enhancement in ultrafine-grained Ti produced by severe plastic deformation. J. Mater. Sci. 2008, 43, 7354–7359. [Google Scholar] [CrossRef]
- Palán, J. The effect of annealing on mechanical and structural properties of UFG titanium grade 2. IOP Conf. Ser. Mater. Sci. Eng. 2017, 179, 3–10. [Google Scholar] [CrossRef] [Green Version]
- Zemko, M.; Kubina, T.; Dlouhý, J.; Kover, M.; Hodek, J. Technological aspects of preparation of nanostructured titanium wire using a CONFORM machine. IOP Conf. Ser. Mater. Sci. Eng. 2014, 63, 012049. [Google Scholar] [CrossRef]
- Palán, J.; Šutta, P.; Kubina, T.; Dománková, M. Effect of severe plastic and heavy cold deformation on the structural and mechanical properties of commercially pure titanium. Mater. Technol. 2017, 51, 849–853. [Google Scholar]
- Valiev, R.Z.; Estrin, Y.; Horita, Z.; Langdon, T.G.; Zehetbauer, M.J. Producing Bulk Ultrafine-Grained Materials by Severe Plastic Deformation: Ten Years Later. Jom 2016, 68, 1216–1226. [Google Scholar] [CrossRef] [Green Version]
- Ostrovska, L.; Vistejnova, L.; Dzugan, J.; Slama, P.; Kubina, T.; Ukraintsev, E.; Kubies, D.; Kralickova, M.; Hubalek Kalbacova, M. Biological evaluation of ultra-fine titanium with improved mechanical strength for dental implant engineering. J. Mater. Sci. 2016, 51, 3097–3110. [Google Scholar] [CrossRef]
- Gomes, C.C.; Moreira, L.M.; Santos, V.J.S.V.; Ramos, A.S.; Lyon, J.P.; Soares, C.P.; Santos, F.V. Assessment of the genetic risks of a metallic alloy used in medical implants. Genet. Mol. Biol. 2011, 34, 116–121. [Google Scholar] [CrossRef] [PubMed] [Green Version]
- Okazaki, Y.; Gotoh, E.; Manabe, T.; Kobayashi, K. Comparison of metal concentrations in rat tibia tissues with various metallic implants. Biomaterials 2004, 25, 5913–5920. [Google Scholar] [CrossRef] [PubMed]
- Lin, C.W.; Ju, C.P.; Chern Lin, J.H. A comparison of the fatigue behavior of cast Ti-7.5Mo with c.p. titanium, Ti-6Al-4V and Ti-13Nb-13Zr alloys. Biomaterials 2005, 26, 2899–2907. [Google Scholar] [CrossRef] [PubMed]
- Zreiqat, H.; Valenzuela, S.M.; Ben-Nissan, B.; Roest, R.; Knabe, C.; Radlanski, R.J.; Renz, H.; Evans, P.J. The effect of surface chemistry modification of titanium alloy on signalling pathways in human osteoblasts. Biomaterials 2005, 26, 7579–7586. [Google Scholar] [CrossRef] [PubMed]
- Palán, J.; Procházka, R.; Džugan, J.; Nacházel, J.; Duchek, M.; Németh, G.; Minárik, P.; Horvát, K. Comprehensive Evaluation of the Properties of Ultrafine to Nanocrystalline Grade 2 Titanium Wires. Materials 2018, 11, 2522. [Google Scholar] [CrossRef] [PubMed] [Green Version]
- Palán, J.; Duchek, M.; Mertová, K.; Zemko, M.; Poláková, I. Continues rotary extrusion of pure nanocrystalline titanium. Mater. Today Proc. 2020. [Google Scholar] [CrossRef]
- Wu, H.; Jiang, J.; Liu, H.; Sun, J.; Gu, Y.; Tang, R.; Zhao, X.; Ma, A. Fabrication of an Ultra-Fine Grained Pure Titanium with High Strength and Good Ductility via ECAP plus Cold Rolling. Metals 2017, 7, 563. [Google Scholar] [CrossRef] [Green Version]
- Valiev, R.Z.; Langdon, T.G. Principles of equal-channel angular pressing as a processing tool for grain refinement. Prog. Mater. Sci. 2006, 51, 881–981. [Google Scholar] [CrossRef]
- Segal, V.M. Engineering and commercialization of equal channel angular extrusion (ECAE). Mater. Sci. Eng. A 2004, 386, 269–276. [Google Scholar] [CrossRef]
- Raab, G.I.; Valiev, R.; Gunderov, D.; Lowe, T.C.; Misra, A.; Zhu, Y.T. Long-Length Ultrafine-Grained Titanium Rods Produced by ECAP-Conform. Mater. Sci. Forum 2009, 584–586, 80–85. [Google Scholar] [CrossRef]
- Valiev, R.Z.; Alexandrov, I.V. Nanostructured materials from severe plastic deformation. Nanostructured Mater. 2002, 12, 35–40. [Google Scholar] [CrossRef]
- Palán, J.; Procházka, R.; Zemko, M. The microstructure and mechanical properties evaluation of UFG Titanium Grade 4 in relation to the technological aspects of the CONFORM SPD process. Procedia Eng. 2017, 207, 1439–1444. [Google Scholar] [CrossRef]
- Thomas, B.M.; Derguti, F.; Jackson, M. Continuous extrusion of a commercially pure titanium powder via the Conform process. Mater. Sci. Technol. 2017, 33, 899–903. [Google Scholar] [CrossRef]
- Elias, C.N. Factors Affecting the Success of Dental Implants. In Implant Dentistry: A Rapidly Evolving Practice; IntechOpen: London, UK, 2011; ISBN 978-953-307-658-4. [Google Scholar]
- Wally, Z.J.; van Grunsven, W.; Claeyssens, F.; Goodall, R.; Reilly, G.C. Porous Titanium for Dental Implant Applications. Metals 2015, 5, 1902–1920. [Google Scholar] [CrossRef]
- Mertová, K.; Palán, J.; Duchek, M.; Studecký, T.; Džugan, J.; Poláková, I. Continuous Production of Pure Titanium with Ultrafine to Nanocrystalline Microstructure. Materials 2020, 13, 336. [Google Scholar] [CrossRef] [Green Version]
- Hodek, J.; Zemko, M. FEM Model of Continuous Extrusion of Titanium in Deform Software; Tanger Ltd.: Plzeň, Czech Republic, 2013; pp. 347–351. [Google Scholar]
- Schwarzer, R.A.; Zaefferer, S. An Inexpensive CCD Camera System for the Recording and On-Line Interpretation of TEM Kikuchi Patterns. Mater. Sci. Forum 1994, 162, 189–194. [Google Scholar] [CrossRef]
- Rauch, E.F.; Véron, M. Coupled microstructural observations and local texture measurements with an automated crystallographic orientation mapping tool attached to a tem. Materwiss. Werksttech. 2005, 36, 552–556. [Google Scholar] [CrossRef]
- Rauch, E.F.; Véron, M. Automated crystal orientation and phase mapping in TEM. Mater. Charact. 2014, 98, 1–9. [Google Scholar] [CrossRef]
- Leyens, C.; Peters, M. Titanium and Titanium Alloys: Fundamentals and Applications; John Wiley & Sons: Weinheim, Germany, 2003; ISBN 3527305343. [Google Scholar]
- Taylor, G.I.; Quinney, H. The Latent Energy Remaining in a Metal after Cold Working. Proc. R. Soc. Lond. Ser. A 1934, 143, 307–326. [Google Scholar]
- Chun, Y.B.; Yu, S.H.; Semiatin, S.L.; Hwang, S.K. Effect of deformation twinning on microstructure and texture evolution during cold rolling of CP-titanium. Mater. Sci. Eng. A 2005, 398, 209–219. [Google Scholar] [CrossRef]
- Gunderov, D.V.; Polyakov, A.V.; Semenova, I.P.; Raab, G.I.; Churakova, A.A.; Gimaltdinova, E.I.; Sabirov, I.; Segurado, J.; Sitdikov, V.D.; Alexandrov, I.V.; et al. Evolution of microstructure, macrotexture and mechanical properties of commercially pure Ti during ECAP-conform processing and drawing. Mater. Sci. Eng. A 2013, 562, 128–136. [Google Scholar] [CrossRef] [Green Version]
- Paton, N.E.; Baggerly, R.G.; Williams, J.C. Rockwell Report SC 526.7FR; Springer: Berlin, Germany, 1976. [Google Scholar]
- Németh, G.; Horvát, K.; Hervoches, C.; Cejpek, P.; Palán, J. Characterization of the Microstructure, Local Macro-Texture and Residual Stress Field of Commercially Pure Titanium Grade 2 Prepared by CONFORM ECAP. Metals 2018, 8, 1000. [Google Scholar] [CrossRef] [Green Version]
- Semenova, I.P.; Polyakov, A.V.; Raab, G.I.; Lowe, T.C.; Valiev, R.Z. Enhanced fatigue properties of ultrafine-grained Ti rods processed by ECAP-Conform. J. Mater. Sci. 2012, 47, 7777–7781. [Google Scholar] [CrossRef]
- Estrin, Y.; Vinogradov, A. Fatigue behaviour of light alloys with ultrafine grain structure produced by severe plastic deformation: An overview. Int. J. Fatigue 2010, 32, 898–907. [Google Scholar] [CrossRef]


| Material/Element | Fe | O | C | H | N | Ti |
|---|---|---|---|---|---|---|
| Titanium Grade 2 | 0.046 | 0.12 | 0.023 | 0.0026 | 0.0076 | Balance |
| Titanium Grade 4 | 0.5 | 0.4 | 0.1 | 0.0125 | 0.05 | Balance |
| Material/Subgrain Size (nm) | Transverse Cross-Section | Longitudinal Cross-Section |
|---|---|---|
| Titanium Grade 2—as-received condition | 2895 ± 1448 | |
| Titanium Grade 2—after one Conform SPD pass | 320 ± 160 | 340 ± 170 |
| Titanium Grade 2—after one Conform SPD pass + rotary swaging (true strain of 1.6) | 370 ± 185 | 120–250* |
| Titanium Grade 4—as-received condition | 2200 ± 1100 | |
| Titanium Grade 4—after one Conform SPD pass | 364 ± 182 | 374 ± 187 |
| Titanium Grade 4—after one Conform SPD pass + rotary swaging (true strain of 1.6) | 405 ± 203 | 200–310* |
| Material | σc (MPa) |
|---|---|
| Titanium Grade 2—as-received condition | 245 |
| Titanium Grade 2—after one pass + rotary swaging (true strain of 1.6) | 396 |
| Titanium Grade 4—as-received condition | 523 |
| Titanium Grade 4—after one pass + rotary swaging (true strain of 1.6) | 698 |
© 2020 by the authors. Licensee MDPI, Basel, Switzerland. This article is an open access article distributed under the terms and conditions of the Creative Commons Attribution (CC BY) license (http://creativecommons.org/licenses/by/4.0/).
Share and Cite
Mertová, K.; Palán, J.; Németh, G.; Fintová, S.; Duchek, M.; Studecký, T.; Veselý, J.; Máthis, K.; Džugan, J.; Trojanová, Z. Optimization of the Mechanical Performance of Titanium for Biomedical Applications by Advanced, High-Gain SPD Technology. Crystals 2020, 10, 422. https://doi.org/10.3390/cryst10060422
Mertová K, Palán J, Németh G, Fintová S, Duchek M, Studecký T, Veselý J, Máthis K, Džugan J, Trojanová Z. Optimization of the Mechanical Performance of Titanium for Biomedical Applications by Advanced, High-Gain SPD Technology. Crystals. 2020; 10(6):422. https://doi.org/10.3390/cryst10060422
Chicago/Turabian StyleMertová, Kateřina, Jan Palán, Gergely Németh, Stanislava Fintová, Michal Duchek, Tomáš Studecký, Josef Veselý, Kristián Máthis, Jan Džugan, and Zuzanka Trojanová. 2020. "Optimization of the Mechanical Performance of Titanium for Biomedical Applications by Advanced, High-Gain SPD Technology" Crystals 10, no. 6: 422. https://doi.org/10.3390/cryst10060422