 Francesca Corti1
 Margherita Festa1
 Frank Stein2
 Piergiorgio Stevanato3
 Jitka Siroka4
 Lorella Navazio1
 Ute C. Vothknecht5
 Alessandro Alboresi1
 Ondřej Novák4
 Elide Formentin1
 Ildikò Szabò1*
- 1Department of Biology, University of Padua, Padua, Italy
- 2European Molecular Biology Laboratory, Heidelberg, Germany
- 3Department of Agronomy, Food, Natural Resources, Animals and Environment, University of Padua, Padua, Italy
- 4Laboratory of Growth Regulators, Institute of Experimental Botany of the Czech Academy of Sciences & Palacký University, Olomouc, Czechia
- 5Plant Cell Biology, Institute of Cellular and Molecular Botany, University of Bonn, Bonn, Germany
Introduction: Chloroplast calcium homeostasis plays an important role in modulating the response of plants to abiotic and biotic stresses. One of the greatest challenges is to understand how chloroplast calcium-permeable pathways and sensors are regulated in a concerted manner to translate specific information into a calcium signature and to elucidate the downstream effects of specific chloroplast calcium dynamics. One of the six homologs of the mitochondrial calcium uniporter (MCU) was found to be located in chloroplasts in the leaves and to crucially contribute to drought- and oxidative stress-triggered uptake of calcium into this organelle.
Methods: In the present study we integrated comparative proteomic analysis with biochemical, genetic, cellular, ionomic and hormone analysis in order to gain an insight into how chloroplast calcium channels are integrated into signaling circuits under watered condition and under drought stress.
Results: Altogether, our results indicate for the first time a link between chloroplast calcium channels and hormone levels, showing an enhanced ABA level in the cmcu mutant already in well-watered condition. Furthermore, we show that the lack of cMCU results in an upregulation of the calcium sensor CAS and of enzymes of chlorophyll synthesis, which are also involved in retrograde signaling upon drought stress, in two independent KO lines generated in Col-0 and Col-4 ecotypes.
Conclusions: These observations point to chloroplasts as important signaling hubs linked to their calcium dynamics. Our results obtained in the model plant Arabidopsis thaliana are discussed also in light of our limited knowledge regarding organellar calcium signaling in crops and raise the possibility of an involvement of such signaling in response to drought stress also in crops.
1 Introduction
Plant bioenergetic organelles, namely mitochondria and chloroplasts, display specific calcium (Ca2+) signals upon abiotic and biotic stresses (McAinsh and Pittman, 2009; Rizzuto et al., 2012; Rocha and Vothknecht, 2012; Nomura and Shiina, 2014; Kmiecik et al., 2016; Wagner et al., 2016). Cytosolic free Ca2+ concentration transiently raises under osmotic stress, high salt, cold as well as oxidative stress, triggering Ca2+ uptake into chloroplasts. In turn, cytosolic Ca2+ signatures (Nomura et al., 2012; Loro et al., 2016; Sello et al., 2016) can be fine-tuned by sequestration of Ca2+ in intracellular organelles (Costa et al., 2018), as proven by measuring cytoplasmic and chloroplast Ca2+ dynamics using genetically encoded Ca2+ indicators (GECIs) (Loro et al., 2016; Sello et al., 2016; Sello et al., 2018). This approach revealed stimulus-specific, regulated changes in Ca2+ level (Sai and Johnson, 2002; Loro et al., 2016; Teardo et al., 2019) in the chloroplast (for review see e.g. Costa et al., 2018; Navazio et al., 2020).
Until recently, the molecular identity of most chloroplast channels has remained unclear (Carraretto et al., 2016; Navazio et al., 2020). During the last few years, different channels/transporters able to transport Ca2+ or modulate Ca2+ entry into chloroplasts have been described, including the bivalent cation transporter BICAT2, able to transport Mn2+ as well and import cytosolic Ca2+ during the light phase of photosynthesis (Schneider et al., 2016; Frank et al., 2019), plastid-located cationic glutamate receptors GLR3.4 (Teardo et al., 2011) and GLR3.5 (Teardo et al., 2015) as well as two channels (PEC1/2) with undefined selectivity whose deletion largely decreases chloroplast Ca2+ release (Völkner et al., 2021).
We have recently shown in Arabidopsis thaliana that one of the six homologs of the Ca2+-selective mammalian mitochondrial uniporter (MCU) (De Stefani et al., 2011; Stael et al., 2012), named cMCU (for chloroplast MCU, At5g66650) mediates Ca2+ uptake into mature chloroplasts in the leaves upon osmotic and oxidative stress. These differences translated to a different activation level of MAPK3/6 by a still unknown mechanism, leading to altered activation of ERF6 and of guard-cell specific MYB60 transcription factors, impinging on short-term signaling that links chloroplast Ca2+ dynamics to stomatal closure. Interestingly, we also provided evidence that Arabidopsis plants lacking cMCU (cmcu) have constitutively partially closed stomata and are more resistant to long-term drought with respect to wild type (WT) plants. At the same time, these mutant plants maintained photosynthetic activity even after 18 days of water deprivation, in contrast to WT plants (Teardo et al., 2019). The molecular mechanisms underlying this relevant phenotype are unknown.
In order to address this question, we performed comparative transcript analysis as well as proteomic, ionomic and hormonal analysis of WT and cmcu leaves of plants grown under watered and drought conditions. We aimed to clarify the mechanism of drought tolerance and which proteins may play a role in cMCU-mediated pathways. Such understanding might increase our ability to improve stress resistance in crops to achieve agricultural sustainability and food security for an ever-growing world population (Zhu, 2016) in a scenario of climate changes.
2 Materials and methods
2.1 Plant materials and growth conditions
Arabidopsis thaliana plants were grown in short day photoperiod, with 12 h light (red and blue led light, about 200 μmol photons m-2 s-1) and 12 h dark, a 65-70% relative humidity and a temperature of 22°C in the light, 20°C in the darkness. Seeds were sown on autoclaved soil and grown with regular watering. For drought stress treatment, 4 weeks old plants were subjected to water withdrawal for 7 to 15 days, then sampled for subsequent experiments. Leaf samples were used for RNA or protein extraction, and adult leaves of similar dimension and positions in the rosette were taken from each plant. Two independent T-DNA insertion lines for AtMCU6 named also cMCU (At5g66650 locus), namely cmcu-1 (SK16605, from Saskatoon Arabidopsis T-DNA mutant collection) and cmcu-2 (SALK_031408 from the SALK collection), were used as cMCU knockouts, with their corresponding wild-type ecotypes Columbia 4 (Col-4, genetic background for cmcu-1) and Columbia 0 (Col-0, for cmcu-2). All seeds were originally obtained from NASC (Nottingham Arabidopsis Stock Centre). Lack of cMCU in both cmcu-1 and cmcu-2 was confirmed as in (Teardo et al., 2019) (not shown), while the expression level of all other MCU isoforms (AtMCU1 [At1g09575], AtMCU2 [At1g57610], (AtMCU3 [At2g23790], AtMCU4 [At4g36820], AtMCU5 [At5g42610]) was comparable between the mutant lines used in this work and their respective WT lines, as assessed by RT-qPCR (Supplementary Figure 1). Although cmcu-1 contains a 4x 35S activation tag at the right border, our proteomic analysis revealed that the expression level for example of the related MCU5 (Ruberti et al., 2022) was not different for the cmcu-1 versus Col-4 (logFC value of -0.0243 was detected, not shown), suggesting that eventual post-transcriptional silencing of related MCUs did not take place in cmcu-1.
2.2 Proteomics and bioinformatic analysis
Total lysates were prepared from leaf samples by crushing the leaves with a sterile pestle in liquid nitrogen, and subsequently solubilizing proteins with a fresh 50 mM TRIS-HCl, 10% sucrose, 2% SDS, 1 mM EDTA buffer with the addition of Protease Inhibitor Cocktail (P9599, Sigma-Aldrich). The total lysates were centrifuged to remove cellular debris, then treated with Benzonase nuclease (Millipore). Samples were quantified with the Pierce BCA Protein Assay kit (Thermo Scientific) and diluted to 1 µg/µL total proteins. Proteomics experiments on the total protein samples were carried out at the European Molecular Biology Laboratory (EMBL) - Proteomics Core Facility, using mass spectrometry (MS) coupled to isotope labeling of peptides using tandem mass tags (TMTs). Protein extracts isolated from cells or tissues were reduced, alkylated, and then digested. Samples were then labeled with the TMT reagents before sample mixing, fractionation, and cleanup. Labeled samples were analyzed on a high-resolution Orbitrap LC-MS/MS mass spectrometer before data analysis to identify peptides and quantify relative abundance of reporter ions. The samples from the different lines and plants were processed in the same moment and analyzed in the same TMT experiment. The raw output files of IsobarQuant (protein.txt – files) were processed using the R programming language (ISBN 3-900051-07-0). Contaminants were filtered out and only proteins that were quantified with at least two unique peptides were considered for the analysis. 5215 proteins passed the quality control filters. Log2 transformed raw TMT reporter ion intensities (‘signal_sum’ columns) were first cleaned for batch effects using the ‘removeBatchEffects’ function of the limma package (PMID: 25605792) Ritchie et al, (2015) and further normalized using vsn (variance stabilization normalization - PMID: 12169536) Huber et al, (2022). Proteins were tested for differential expression using the limma package. The replicate information was added as a factor in the design matrix given as an argument to the ‘lmFit’ function of limma. A protein was annotated as a hit with a false discovery rate (FDR) smaller than 5% and a fold-change of at least 50%, and as a candidate with a FDR below 20% and a fold-change of at least 20%. Proteins found to be differentially expressed in proteomics were analyzed for Gene Ontology class enrichment using Panther tool, version 17.0 (pantherdb.org) and ShinyGO tool, version 0.76 (http://bioinformatics.sdstate.edu/go/), and also represented in networks using STRING multiple protein search (https://string-db.org).
2.3 RNA extraction and RT-qPCR analysis
RNA was extracted from Arabidopsis adult leaves using PrimeZOL reagent (Canvax), according to the protocol described in the data sheet. Residual DNA was digested by incubating the RNA solution with Ambion DNase I (RNase-free) (Invitrogen) at 37°C for 30 min, and the enzyme was then inactivated by 10 min incubation at 75°C in the presence of 5 mM EDTA. Subsequently, RNA was precipitated and resuspended in nuclease-free water. DNA degradation and RNA integrity were verified by loading the RNA in an agarose gel electrophoresis, then 2.5 µg of RNA were retrotranscribed with the SuperScript IV Reverse Transcriptase (Invitrogen). Quantitative real time PCR (RT-qPCR) was performed using a CFX384 Touch Real-Time PCR System (BioRad), with standard cycling parameters, preparing the reaction mix with Power SYBR Green Master Mix (ThermoFisher Scientific) and 20 ng cDNA (n=3 biological samples, 3 technical replicates for each sample). Threshold cycle (Ct) values were extrapolated from amplification curves, and melting curves were checked to ensure single-peaked amplification of the target gene. Ct values were averaged across technical replicates, then the ΔCt was calculated for each gene/condition as average Ct (gene) – average Ct (actin). Gene expression was normalized on WT watered samples, by calculating ΔΔCt as ΔCt (gene, condition) - ΔCt (gene, WT W), from which the fold change can be obtained as 2-ΔΔCt. Primer sequences used for genotyping and transcript amplification of the cMCU gene and for RT-qPCR analyses used in this study are provided in Supplementary Table 1.
2.4 Leaf photoinhibition assay
Arabidopsis plants were grown on soil in control conditions (see above) until about 30 days of age, then adult leaves of similar dimension and positions in the rosette were cut from each plant and positioned on a tray with multiple layers of wet filter paper, in order to prevent leaf desiccation. The tray was positioned under a high light intensity lamp (white led light, 1500 μmol photons m-2 s-1) and kept wet for the whole duration of the experiment. For the first 8 hours, the leaves were removed from under the lamp every hour and kept in the dark for 20 minutes, then leaf PSII quantum efficiency was assessed through chlorophyll fluorescence measurements using a Closed FluorCam FC 800-C setup (Photon System Instrument), using an 800 ms saturating light pulse of about 2700 μmol photons m-2 s-1. PSII quantum efficiency was calculated as Fv/Fm, where Fm is the maximal leaf fluorescence value in the presence of the saturating pulse, and Fv=(Fm-F0) is the difference between the maximal and baseline fluorescence values.
2.5 Pigment quantification
Chlorophylls and carotenoids were quantified in fresh adult leaves of Arabidopsis WT and cmcu plants (n=8). The pigments were extracted from leaves using dimethylformamide (DMF) as solvent, and subsequently quantified by measuring light absorption at 647 and 664 nm for chlorophylls, with the spectrophotometer zeroed at 750 nm, according to (Porra et al., 1989) and at 480 nm for carotenoids, according to (Wellburn, 1994). The equations indicated in the references were used to calculate pigment concentration in µg/mL from absorbance values. Pigment content was then reported as a ratio to the leaves’ fresh weight.
2.6 Ionomics
Element content was assessed from pooled Arabidopsis rosettes of both regularly watered (n=3 biological samples, 3 technical replicates for each sample) and drought-stressed (n=2, 3 technical replicates for each sample) Col-0 and cmcu-2 plants. The analysis was performed as described previously (Stevanato et al., 2018). Briefly, leaf samples were treated with concentrated HNO3 in a microwave system. The elements concentration was determined by inductively coupled plasma inductively coupled plasma optical emission spectroscopy (ICP-OES) (Ciros Vision EOP, Spectro A. I. GmbH, Germany). Elements were quantified using certified multi-element standards. The element content was normalized on the samples’ dry weight.
2.7 Phytohormone quantification
Adult, fully expanded leaves were sampled from Arabidopsis plants. To partially compensate for response and biological variability, the phytohormone analysis was based on pooled leaf material: 5 different samples each containing 3 leaves from 3 different plants were tested in 6 technical replicates. The plant hormones were quantified using liquid chromatography tandem mass spectrometry methods as described in (Antoniadi et al., 2015; Široká et al., 2022). For auxin, abscisic acid (ABA) and jasmonate families the samples were prepared using acidic extraction in 1 mol/L formic acid in 10% aqueous methanol and further processed as in (Floková et al., 2014). For the cytokinin family the samples were prepared following protocol in (Antoniadi et al., 2015).
2.8 Statistical analysis and graphs
Final data obtained from the several biological replicates in the RT-qPCR, high light, photoinhibition, pigment quantification, ionomics and phytohormone quantification experiments were analyzed to identify statistically significant differences across genotypes and/or conditions, and plotted in suitable graphs for visualization. Graphs and statistical analyses were prepared using GraphPad Prism software, and differences were assessed with t-tests, when dealing with 2 genotypes only (e.g. Col-0 versus cmcu-2 in ionomics and hormone quantification), or with one-way ANOVA coupled with multiple comparisons-corrected tests, when dealing with more genotypes or conditions, as in the case of RT-qPCR analysis, high light experiments and pigment quantification. For the photoinhibition experiment, a two-way ANOVA was used to analyze time-course measurements, in order to study variability derived from different genotypes and different timepoints. Moreover, a one-way ANOVA coupled with multiple comparisons across genotypes was used when focusing on the 24 hours timepoint.
3 Results
3.1 Comparative proteomics reveal differentially expressed proteins in cMCU knock-out plants under control conditions
In order to reveal constitutive differences in the expression of proteins under control, non-stressed conditions between the Col-0 ecotype and the AtMCU6 (from this point on named cMCU) knock-out (KO) line cmcu-2 in the same background (Teardo et al., 2019), we performed a comparative proteomics analysis, sampling adult leaves from 3 independent 4 weeks-old plants for each genotype. We performed quantitative mass spectrometry experiments using tandem mass tag (TMT) labeling. Normalized reporter ion intensities were tested for differential expression using the limma package (moderate t-test). Proteins were considered “hits” for a specific comparison if the fold change was over 1.5 (logFC > 0.58 or logFC < -0.58). Proteins were moreover considered “candidates” when the proteins had a fold change over 1.2 (logFC > 0.26 or logFC < -0.26). The false discovery rate (FDR) was ≤ 0.05 for proteins of both categories. For global proteome comparison among WT and genetically modified organisms/cells, a value of 1.2-fold change with p value ≤0.05 is routinely used [see e.g (Chakraborty et al., 2018; Liu et al., 2020)]. Setting these threshold values, we identified 63 differentially expressed proteins (DEPs, intended as changes in protein content), 9 of which were considered as upregulated hits, 6 as downregulated hits, 24 as upregulated candidates and 24 as downregulated candidates (Supplementary Table 2). Principal component analysis showed that samples from the same genotype grouped together and were clearly distinguishable (Figure 1A).
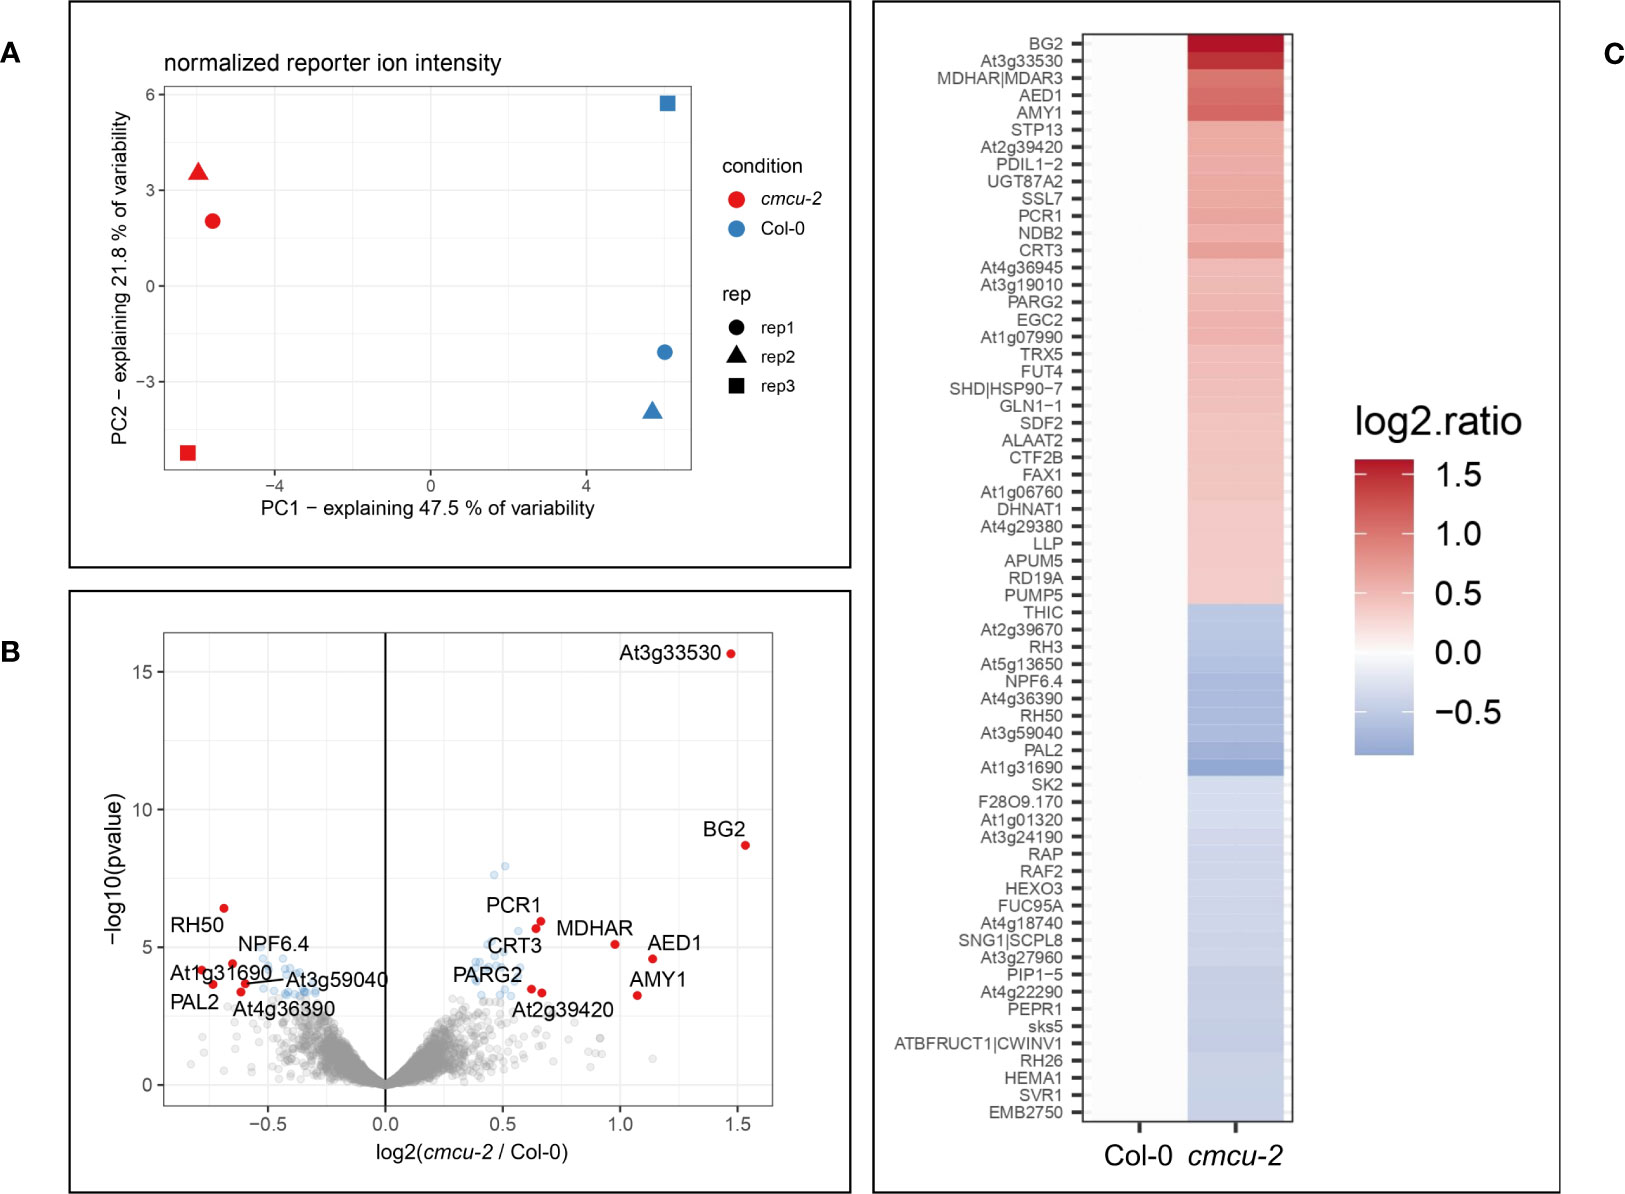
Figure 1 Comparative proteomic analysis of cmcu-2 plants in non-stressed conditions. (A) Principal component analysis of cmcu-2 and Col-0 WT leaf proteomic samples (n=3). (B) Volcano plot showing proteins detected in proteomic analysis, log2(FC) values and -log10(pvalue) for each protein in cmcu-2 compared to Col-0 WT. Hit proteins are highlighted in red, while candidates are shown in blue. (C) Heatmap of hit and candidate proteins detected by proteomics in cmcu-2 leaves, showing their log2(FC) compared to Col-0 WT.
Proteins found to be differentially expressed in cmcu-2 are represented in a Volcano plot (Figure 1B), a heatmap (Figure 1C) and a network using STRING (annotations were updated using Panther and the Gene Ontology database) (Figure 2). We used the Panther tool to query Gene Ontology (GO) database, considering the Biological Process ontology: proteins belonging to classes found to be enriched among DEPs in cmcu-2 are highlighted in different colors in Figure 2A. The degree of up- (red) or downregulation (blue) is represented for each DEP in Figure 2B. The full list of DEPs found in cmcu-2 compared to WT Col-0 plants, together with the GO annotation obtained by querying the GO database through the Panther tool and selecting enriched GO classes of particular interest, is reported in Supplementary Table 2. The DEPs we identified fall, among others, into the following enriched GO categories, with a FDR value <0.05: response to stress (34 out of 63 proteins), response to water deprivation (11/63), systemic acquired resistance (5/63), defense response to other organism (19/63) and response to biotic stimulus (22/63). In addition, 21 DEPs fall into the category of “response to abiotic stimulus” with and FDR <0.1. The enrichment of Gene Ontology Cellular Component classes found among DEPs (obtained using Panther) is represented in Table 1. An enrichment is found for proteins located in the chloroplast and in secretory vesicles and extracellular compartments. Conversely, no enrichment was found for mitochondrial or vacuolar proteins, in support of the chloroplast localization of cMCU in fully expanded leaves (Teardo et al., 2019).
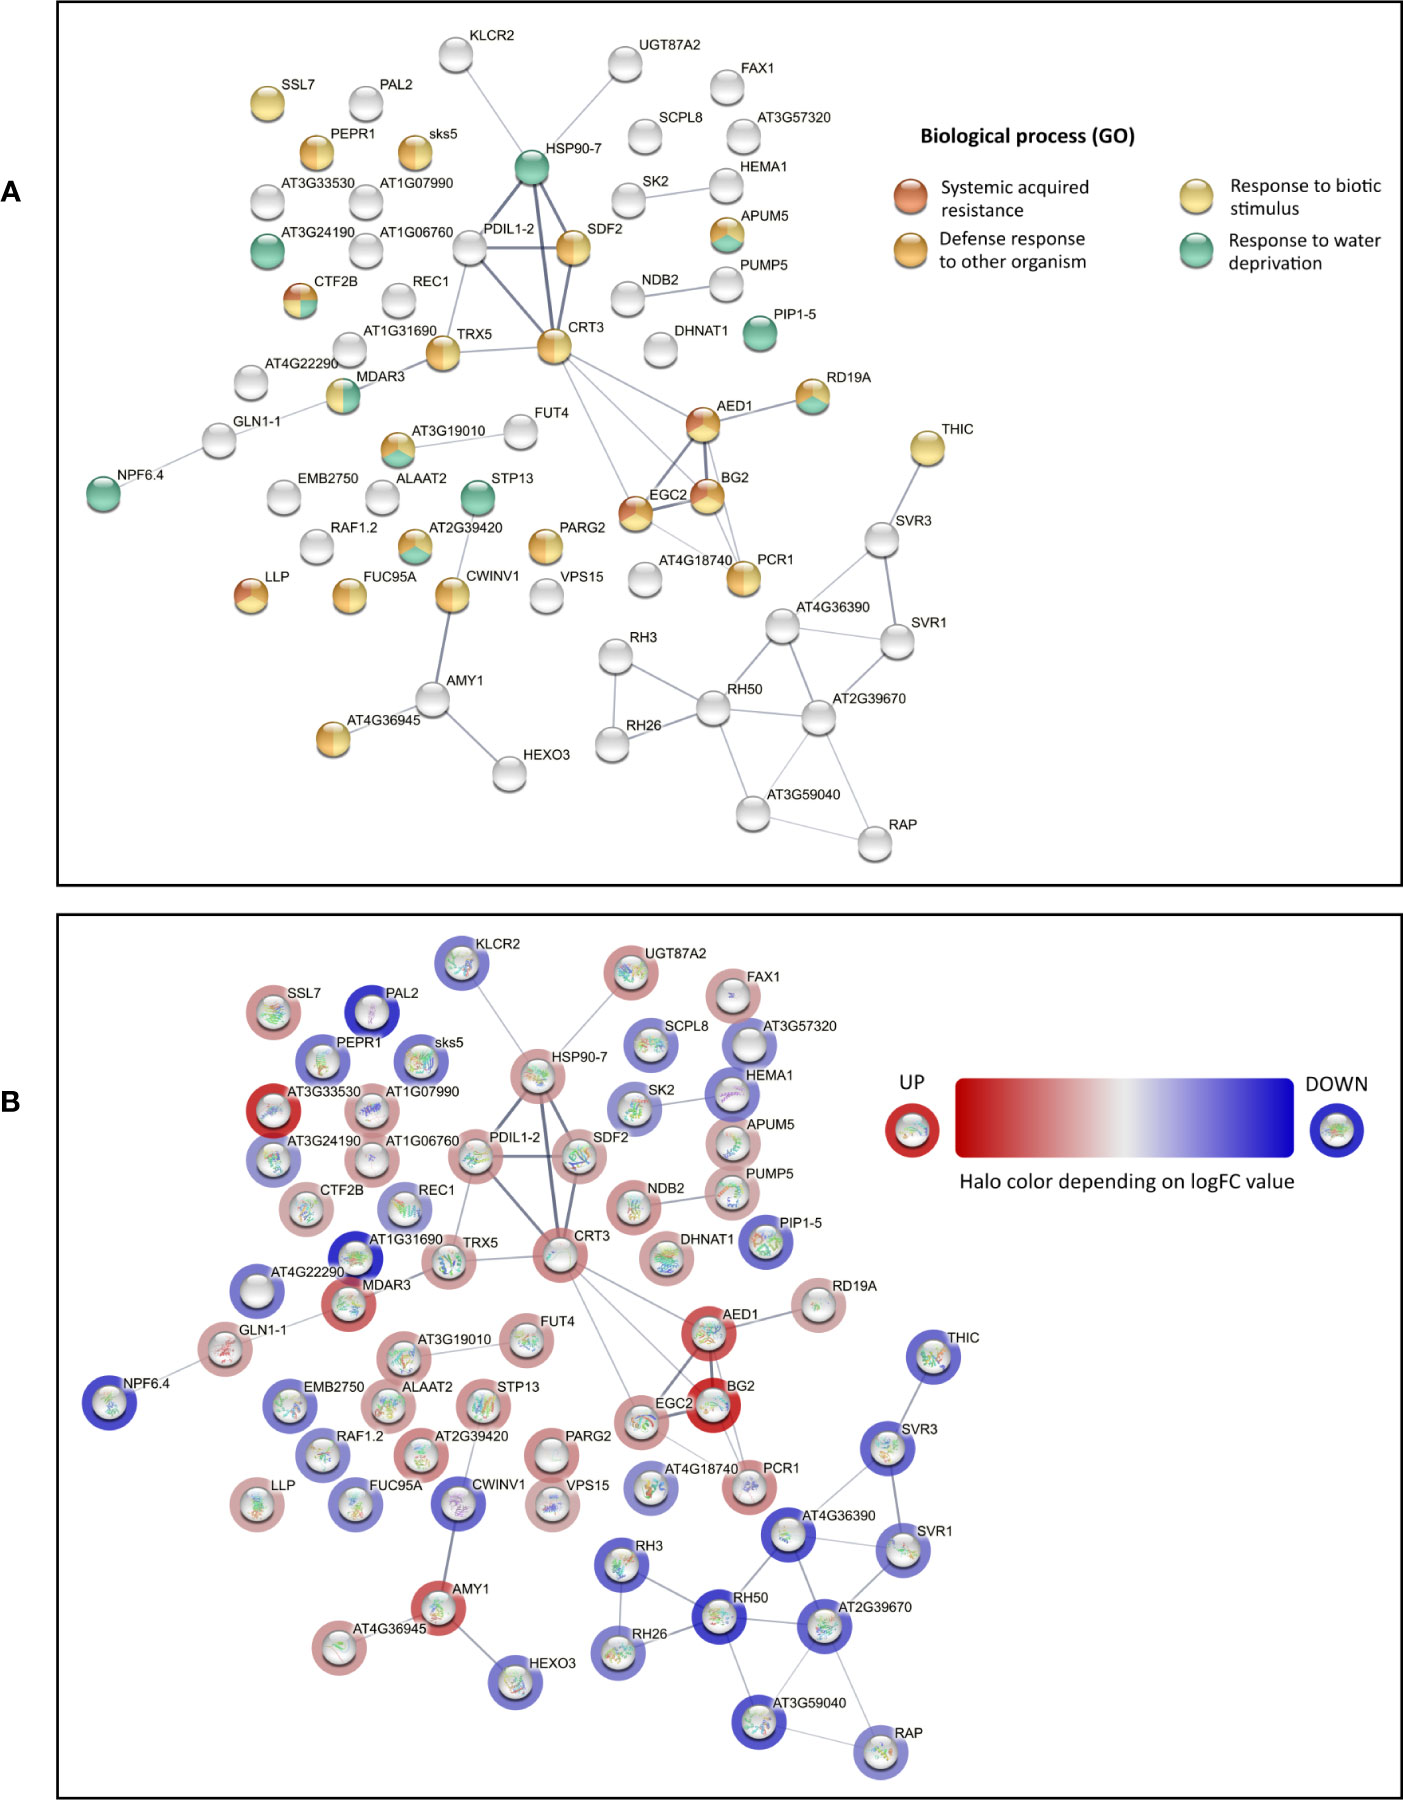
Figure 2 STRING network of differentially expressed proteins (DEPs) in the proteomics analysis of non-stressed cmcu-2 and Col-0 plants. (A) STRING network of DEPs found in proteomics analysis for non-stressed cmcu-2 leaves. Enrichment analysis was performed with Panther and relevant enriched classes in the Biological Process Ontology were highlighted on the network. (B) STRING network for the same DEPs, with halo color indicating the logFC values of DEPs in cmcu-2 samples.
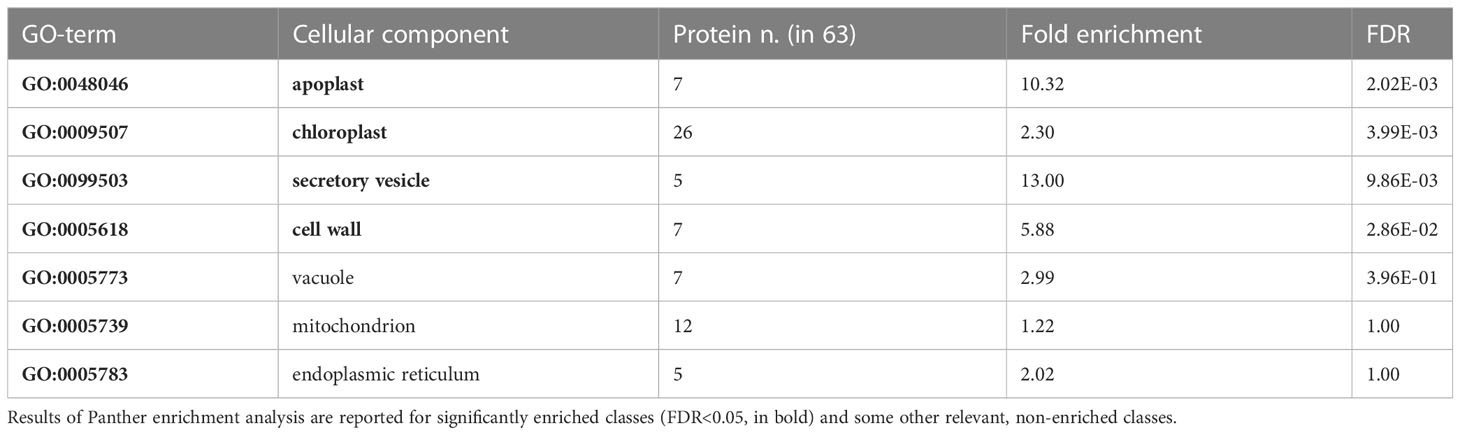
Table 1 Enriched GO Cellular Component classes found among differentially expressed proteins (DEPs) in cmcu-2 non-stressed samples.
Interestingly, the most highly upregulated protein in the cmcu-2 plants compared to WT ones was BG2 (2.9-fold increase), a β-glucosidase that, along with its ER-located homolog BG1, can catalyze one-step hydrolysis of Glucose-conjugated ABA (Xu et al., 2012). The BG2 enzyme is thus able to increase abscisic acid (ABA) levels, independently of the de novo synthesis of this plant hormone (Xu et al., 2012).
3.2 Characterization of hormone content and ionome in plants lacking cMCU
Given the marked increase in BG2 protein level in the cmcu-2 plants, we performed a hormone quantification in control conditions (n=30 measurements from leaves of 3 different plants for each genotype, see Supplementary Figure 2A) in watered, unstimulated plants. From this analysis, a difference in auxin and ABA content emerged (Figure 3A), with the latter being consistent with the difference in protein content observed for BG2 (Figure 3B), suggesting a possible mechanism for the approximately 50% increase of ABA accumulation. To gain further insight into the possible mechanism of ABA increase in the mutants, we performed a quantitative real-time PCR (RT-qPCR) analysis for key, rate limiting proteins involved in ABA homeostasis (Figure 3C). 9-cisepoxycarotenoid dioxygenase (NCED) catalyses in the plastids the oxidative cleavage of 9-cis-violaxanthin and/or 9- cis-neoxanthin to produce xanthoxin, the rate rate-limiting step in ABA biosynthesis (Seiler et al., 2011). AtNCED3 is thought to play a major role in ABA biosynthesis in response to stress, while the transcript levels of cytochrome P450 CYP707As have been shown to be induced by dehydration (Kushiro et al., 2004). AtNCED3, AtCYP707A1 and AtCYP707A4 (abscisic acid 8′-hydroxylase 1 and 4) were all shown to be induced by osmotic stress (Chen et al., 2020) and involved in de-novo biosynthesis and degradation, respectively. In our case, the CYP707A1 and CYP707A4 transcripts were significantly downregulated in cmcu-2 leaves compared to the WT, indicating that a lower ABA turnover rate may also contribute to higher hormone accumulation in cmcu-2 plants. No significant differences were instead observed for NCED3 (Figure 3C). A graphical summary of the processes involved in altered ABA accumulation in the cmcu-2 KO line is represented in Figure 3D.
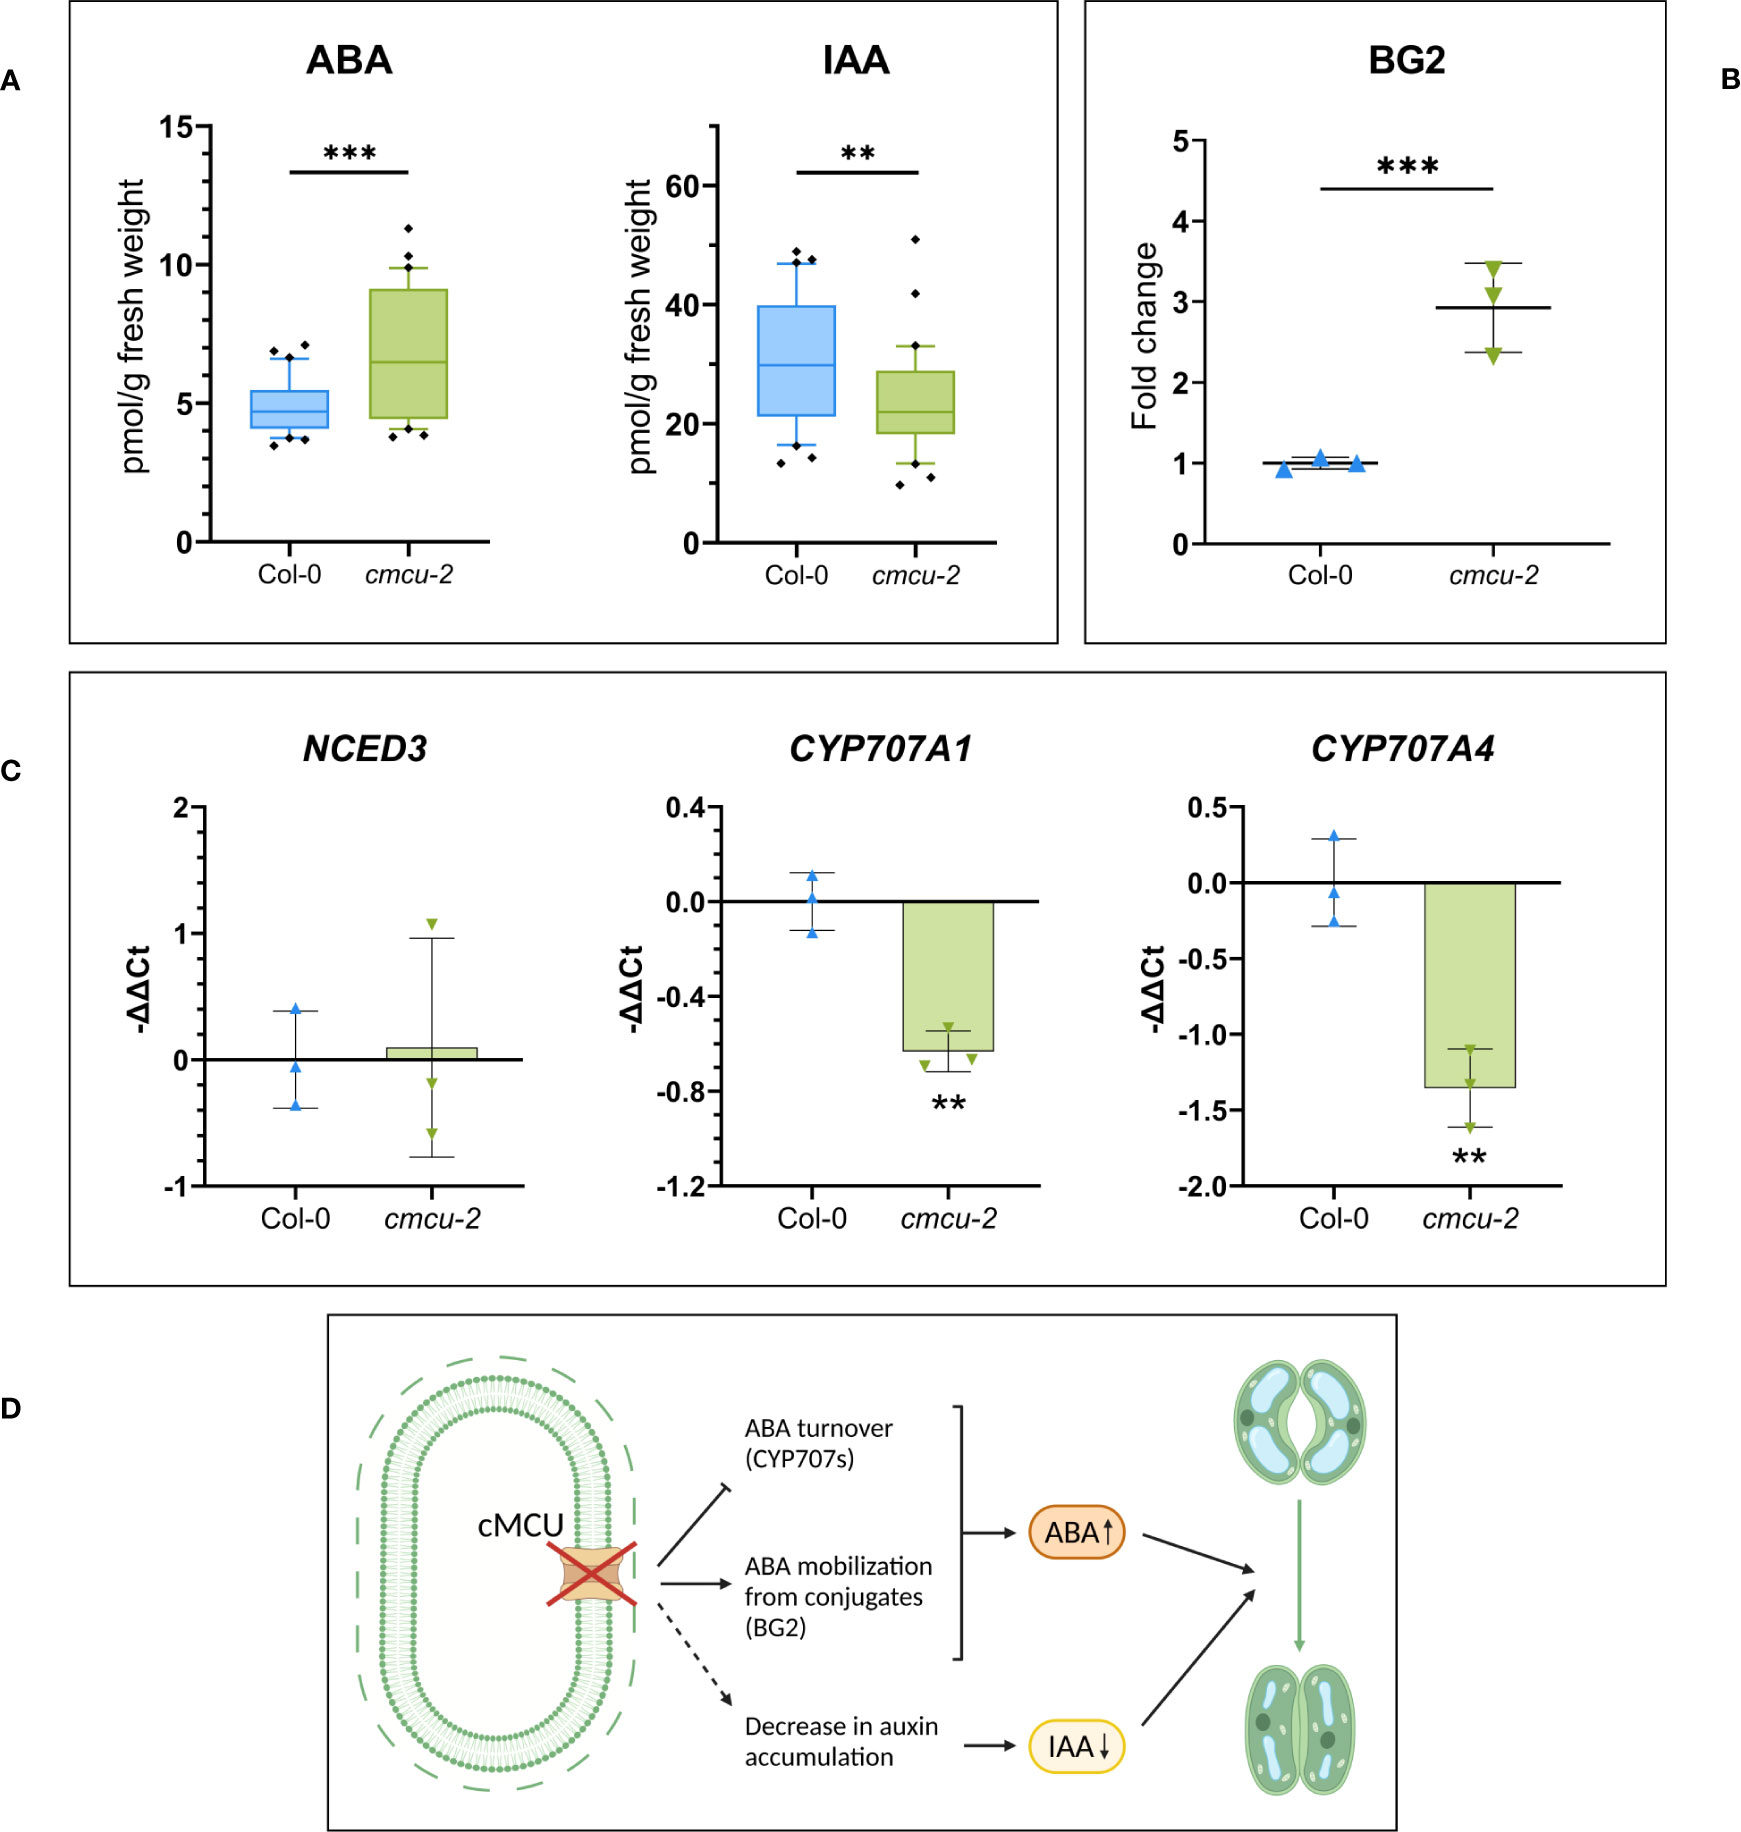
Figure 3 ABA and auxin level quantification in cmcu-2 non-stressed plants. (A) Box plots of hormone quantification of ABA and IAA content in cmcu-2 vs. Col-0 WT leaves (n=30), showing an increased content in ABA and a decreased content in IAA in non-stressed cmcu-2 samples. (B) BG2 protein level increase in proteomics analysis, represented as fold-change in cmcu-2 compared to Col-0 WT (mean ± SD, n=3), which may impact ABA mobilization from inactive conjugates in non-stressed cmcu-2 samples. (C) Transcript level in RT-qPCR of NCED3 gene, rate-limiting in ABA de novo biosynthesis, and CYP707A1 and CYP707A4, involved in ABA degradation. Expression levels are reported as -ΔΔCt for Col-0 WT and cmcu-2 (mean ± SD, n=3), and are normalized on average expression of the gene in Col-0 WT. (D) Summary of alterations of ABA and auxin accumulation emerging in cmcu plants and consequent altered regulation of stomatal closure. ** p<0.05; +*** p<0.01.
Interestingly, in addition to ABA level, there was a significant, more than 50% increase also in the level of phaseic acid (PA) (Supplementary Figure 2B), a terpenoid catabolite of ABA whose level generally correlates with changes in ABA level [e.g (Kanno et al., 2010)]. We also measured the levels of auxin (indole-3-acetic acid (IAA)) in the cmcu-2 plants compared to WT and found a significant decrease by approximately 25% of both IAA and oxindole-3-acetic acid (oxIAA), a degradation product of IAA (Figure 3A; Supplementary Figure 2B). These results are in agreement with the role of auxin in the guard cells, namely that of antagonizing ABA-induced stomatal closure [see e.g (Tanaka et al., 2006)]. Differences were not detected at the level of jasmonates (Supplementary Figure 2B) and of active forms of cytokinins, that can promote the stomatal opening, while a small but significant increase in the inactive N-and O-glucoside form of cytokinin was observed (Supplementary Figure 2C).
Since altered hormone levels might affect ion homeostasis [e.g (D'Oria et al., 2022; Keshishian et al., 2022)] and since cMCU-regulated Ca2+ signaling might alter ion transport, we performed a global ionome analysis by inductively coupled plasma optical emission spectrometry (ICP-OES). Total ion content was determined instead of performing ionomics on isolated chloroplasts, as ions would quickly move across the chloroplast envelope down their electrochemical gradient during isolation. Mineral nutrient, trace elements and the inorganic component of the plants constitutes the so-called “ionome”, which is an important determinant of the plant physiological state. Thus, we assayed Col-0 and cmcu-2 plants for macronutrients (Ca, K, P, and S) and micronutrients (B, Cu) and other metal ions (Ba, Co, Fe, Mg, Mn, Zn) in order to observe possible differences in the total element content of leaves, compared to the WT. The only significant difference we observed was a higher sodium content in the plants lacking cMCU (Supplementary Figure 3). However, the Na+/K+ ratio, which could be important for salt tolerance [e.g (Chen et al., 2007)], was 0.0082 ± 9,9E-04 (mean ± SEM, n=3) in cmcu-2 watered plants versus 0.00679 ± 5,6E-04 (mean ± SEM, n=3) in the Col-0, yielding a non-significant difference.
3.3 Photosynthetic activity in plants lacking cMCU
We have previously shown that Arabidopsis plants lacking cMCU are able to maintain their photosynthetic activity during long-term drought stress, and that short-term cMCU signaling is linked to photosynthetic activity and ROS release in two independent cmcu mutants, compared to their respective WT plants (on Col-0 and Col-4 backgrounds). In fact, a difference in the activation of MAPK3/6 upon mannitol addition to leaves, mimicking drought stress, was observed in cmcu plants compared to WT, but this occurred only when plants were illuminated. Moreover, treatment with N-acetyl cysteine, a cell permeable agent able to boost anti-oxidant activity, abolished the difference in cmcu plants. In addition, a differential regulation of MAPK3/6 downstream transcription factors occurred in cmcu, but the difference was abolished when photosynthesis was blocked by treatment with DCMU (Teardo et al., 2019). Taking into account these observations, we investigated more in depth the impact that chloroplast Ca2+ dynamics has on photosynthesis. In particular, we focused on the response to high light intensity and photoinhibition in both cmcu-1 and cmcu-2 lines under watered conditions.
First, we assessed whether expression of cMCU affected resistance to short-term photoinhibition in WT and KO plants, which show comparable levels of chlorophyll and carotenoid content (Figure 4A). Illumination of leaves from the four different genotypes (Col-0 versus cmcu-2 and Col-4 versus cmcu-1) with 1500 µmol photons m-2 s-1 light intensity caused a similar decrease in function of time of the Fv/Fm value, which is indicative of photosynthetic activity, Figure 4B). After 24 hours of illumination, no significant differences could be observed (Figures 4C, D; Supplementary Figure 4).
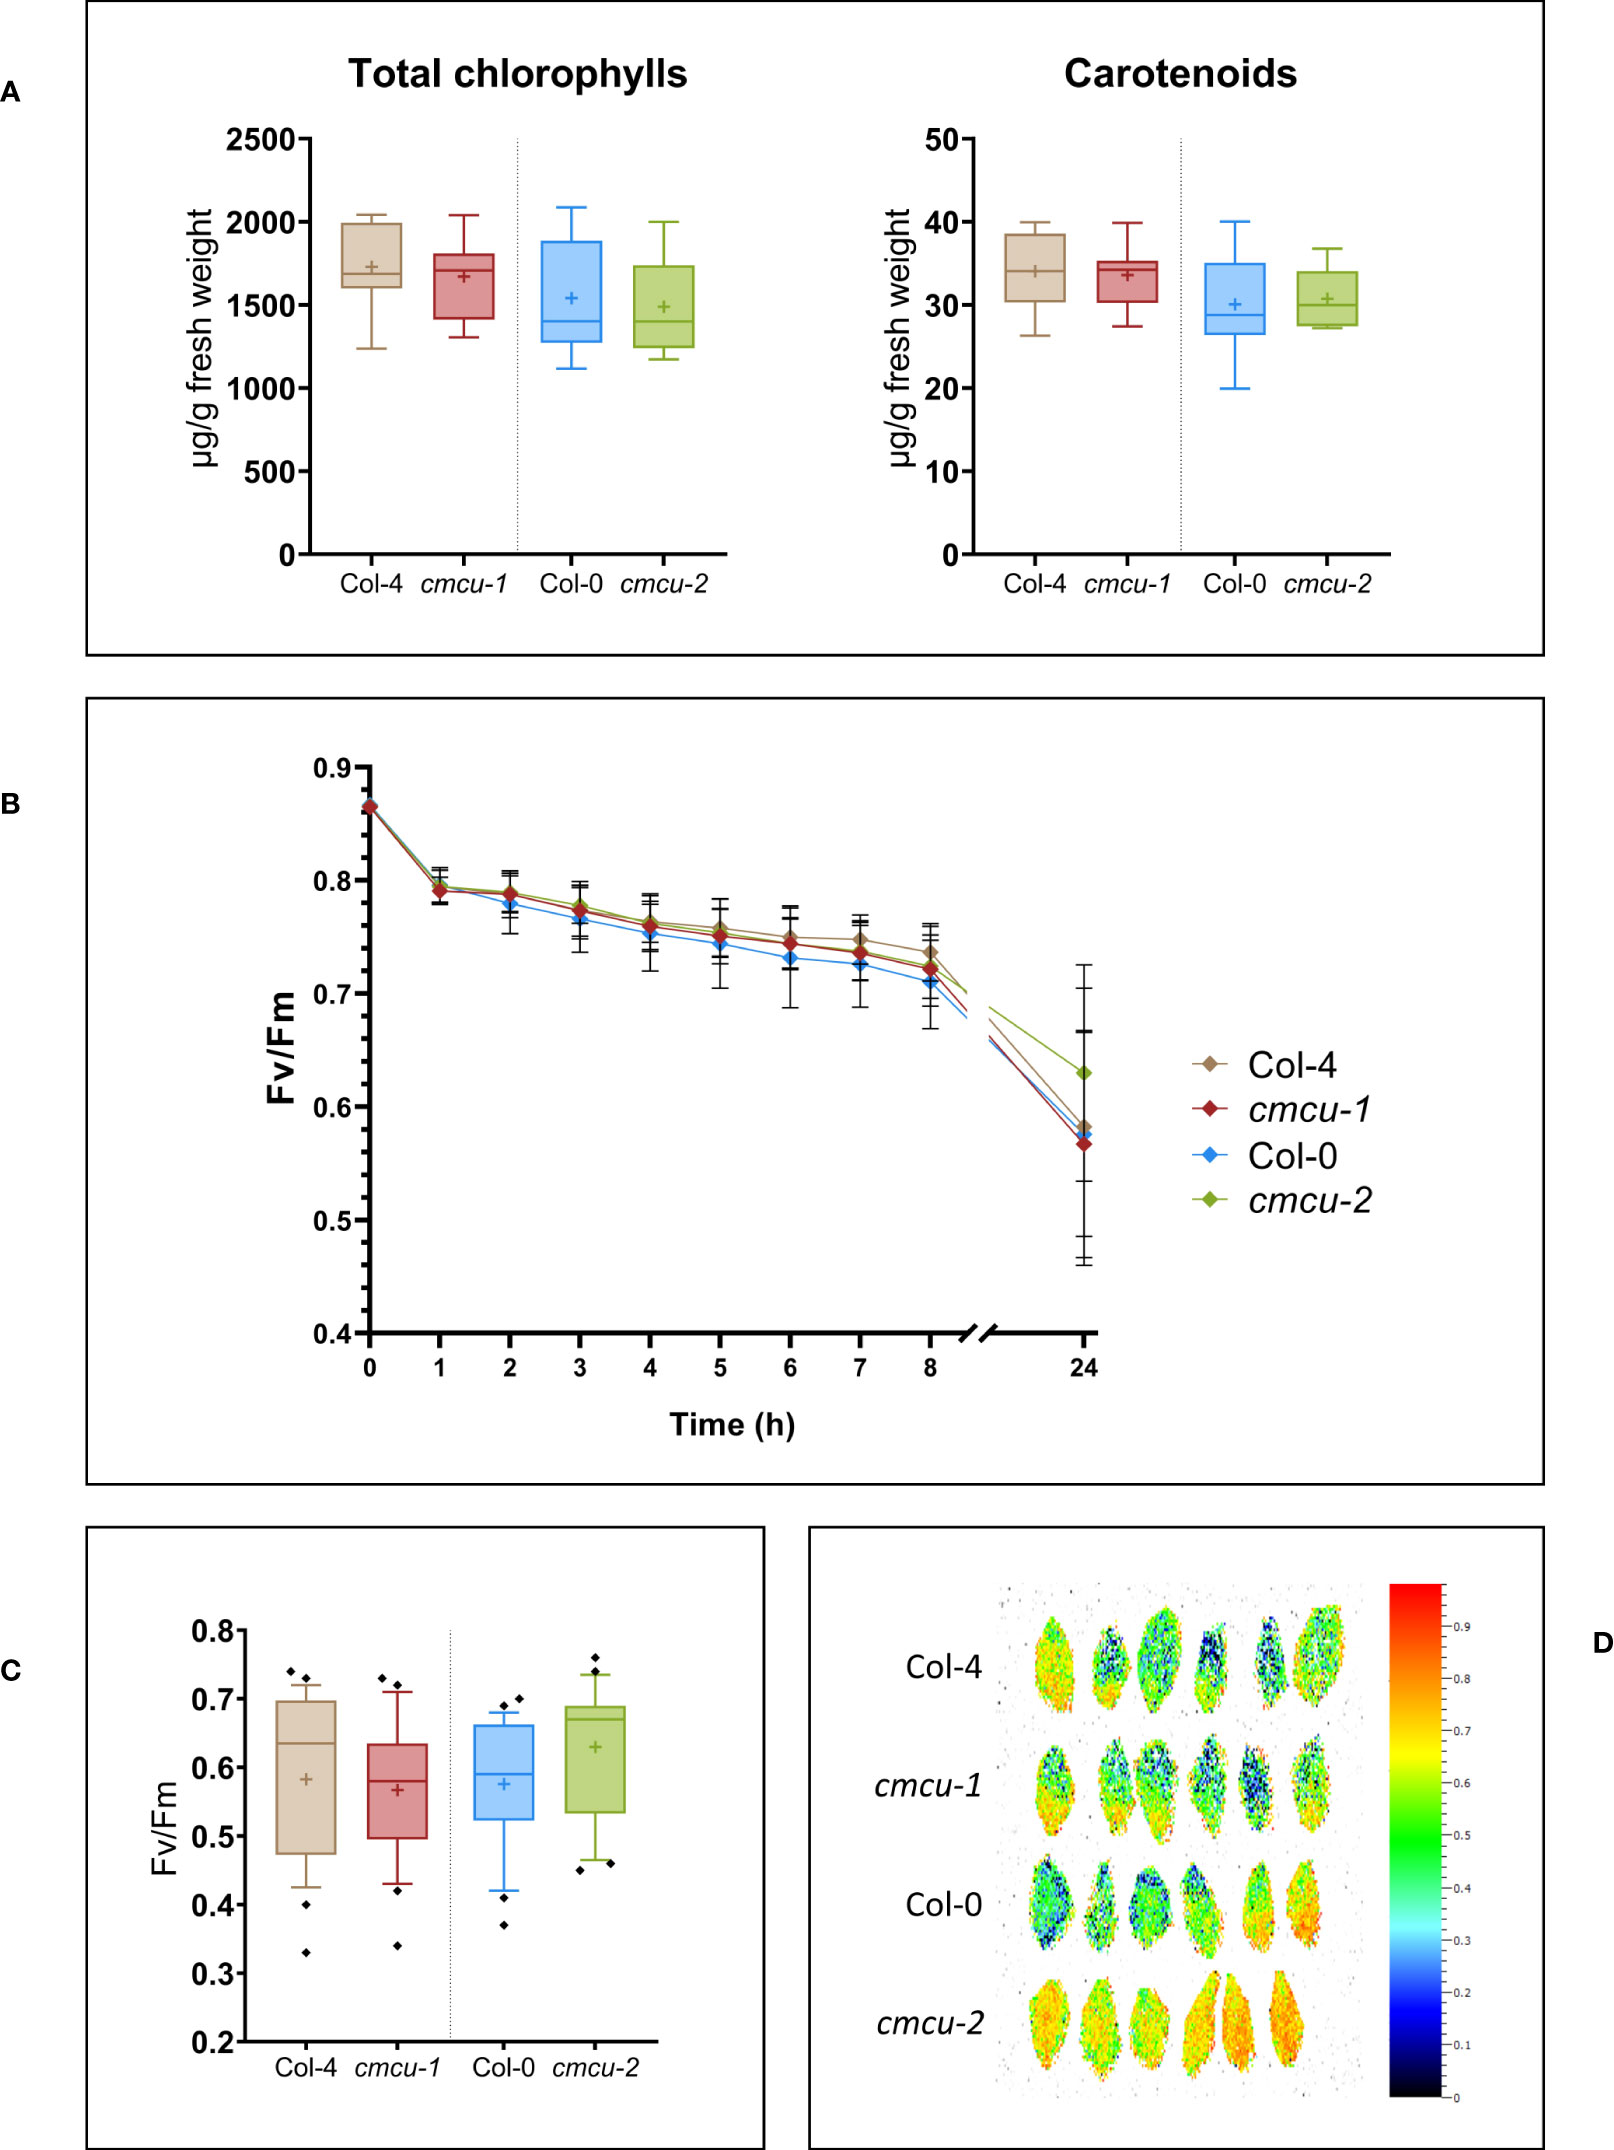
Figure 4 Characterization of pigment content and photosynthetic activity in cmcu plants. (A) Box plots of total chlorophylls and carotenoids quantification in cmcu-1 and -2 leaf samples, compared to Col-4 and Col-0 WT (n=8, “+” shows the mean value). (B) Time-course of Fv/Fm measurement in fresh detached leaves, at time 0 and at different timepoints during exposure to high light at 1500 µmol photons m-2 s-1. Focusing on the last timepoint, (C) box plots of the Fv/Fm values (n=24) and (D) leaf images of Fv/Fm for 6 replicates representative for the total (n=24), after 24 hours of high light treatment at 1500 µmol photons m-2 s-1.
Next, we checked whether growth and photosynthetic activity of WT and KO plants at different light intensities were affected by the absence of the channel (Figure 5A). Plants were grown for 4 weeks at low (50 µmol photons m-2 s-1), normal (110 µmol photons m-2 s-1) and high light (300 µmol photons m-2 s-1) intensities starting from 2 weeks of age (Figure 5B), and rosette size as well as photosynthetic activity expressed as Fv/Fm were investigated (Figure 5C). As observable in Figure 5, no differences could be revealed.
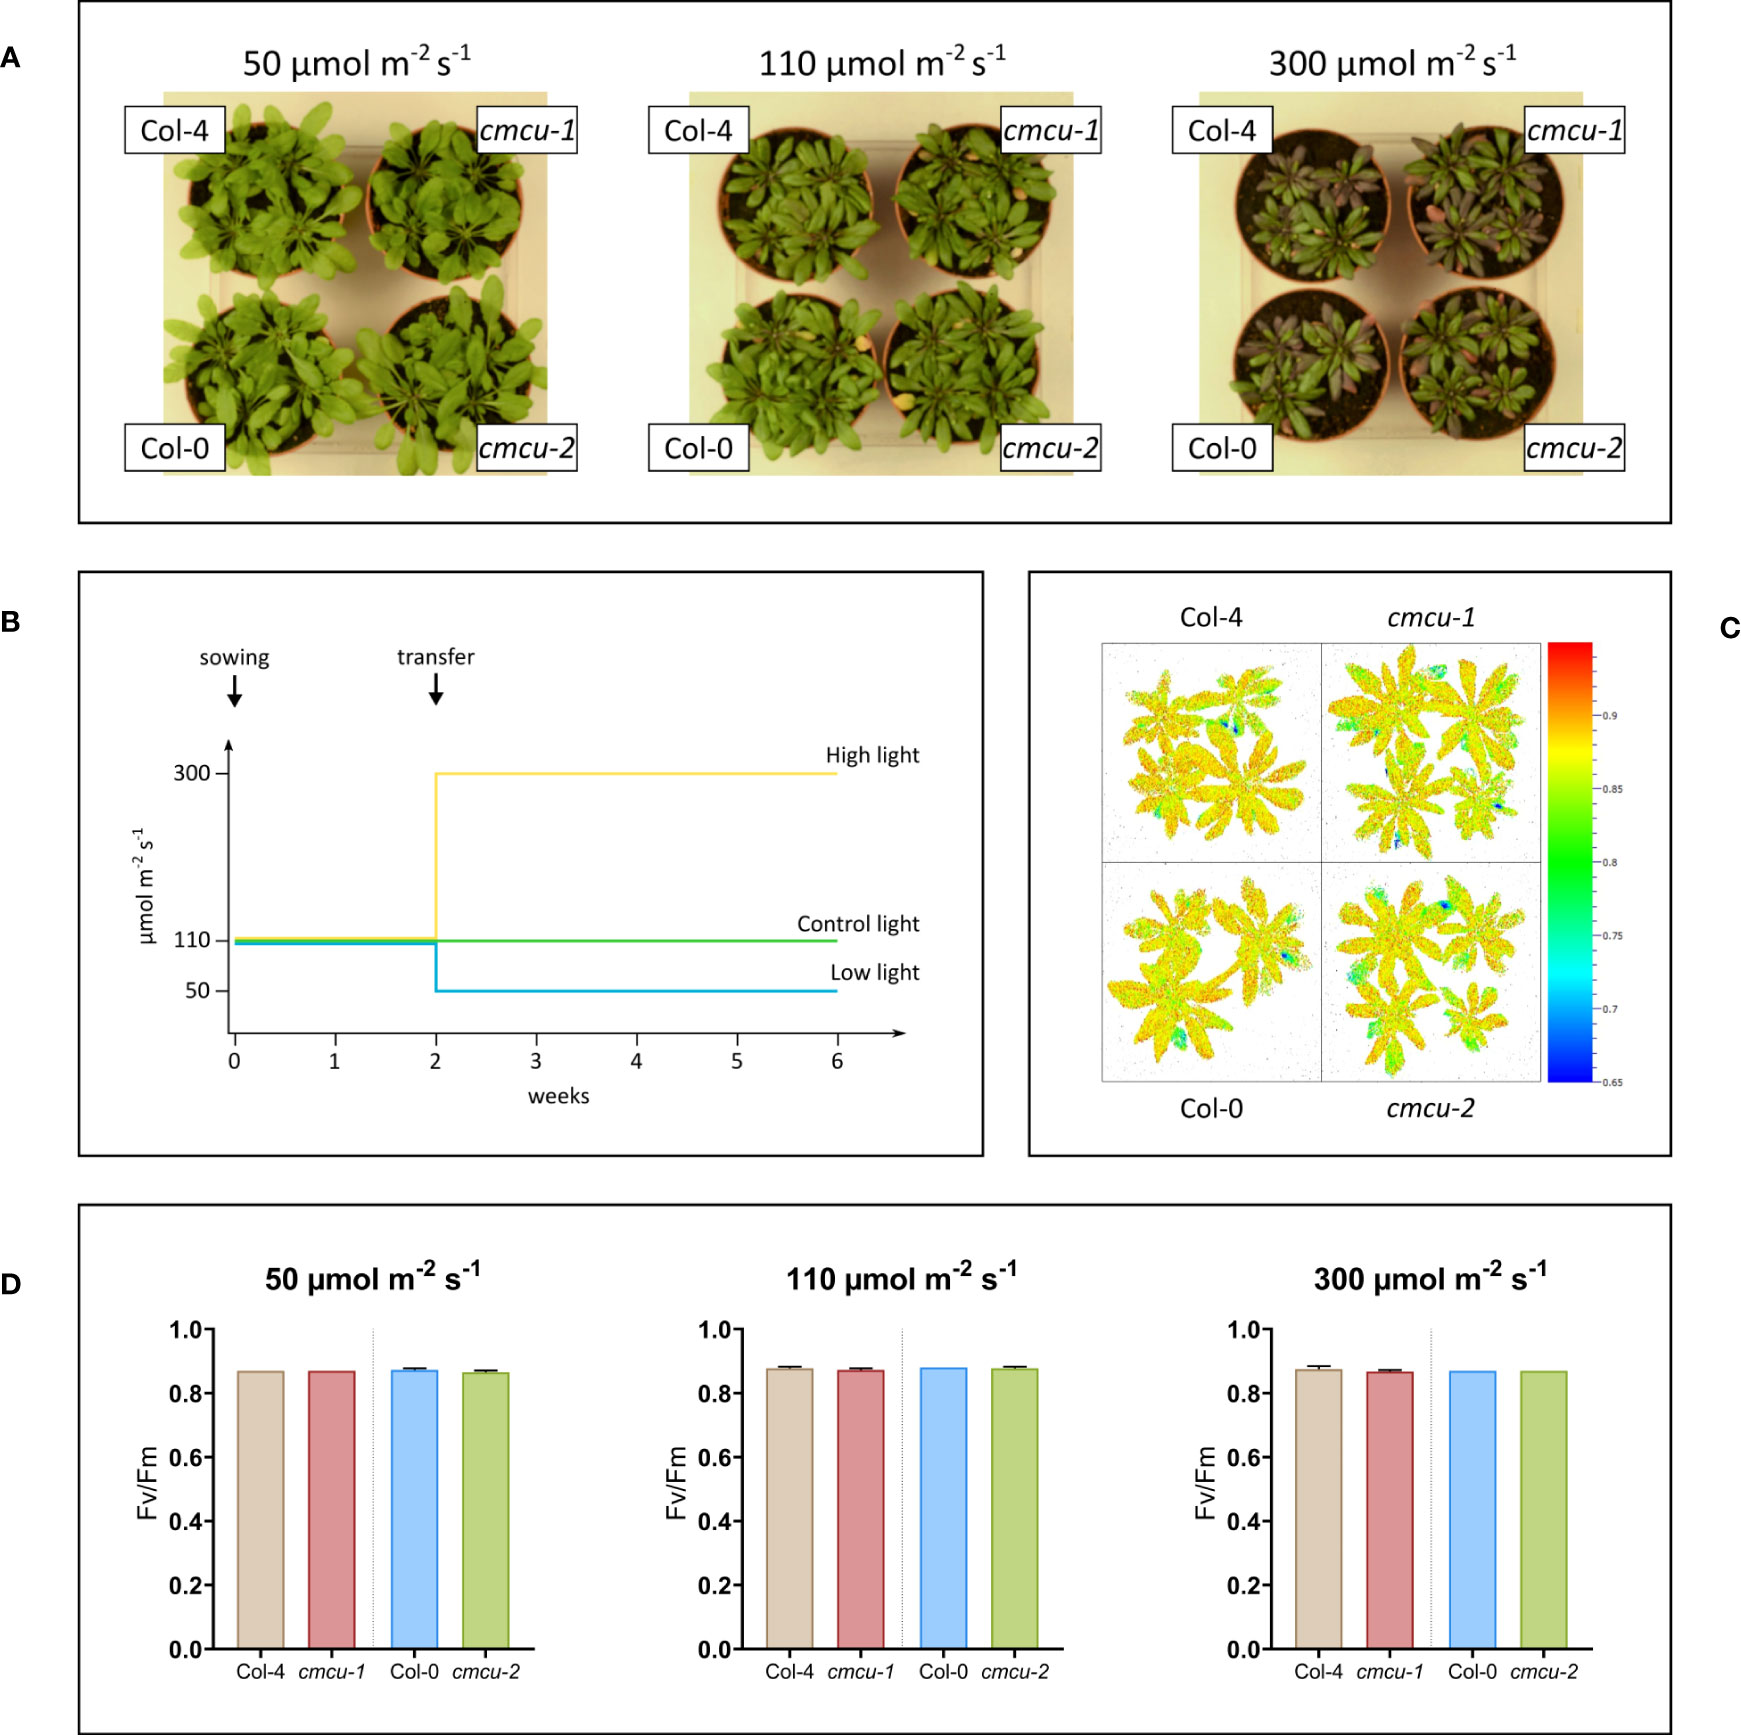
Figure 5 Growth phenotype investigation of cmcu plants under different light intensities. (A) WT and cmcu plants of 6 weeks of age, after 4 weeks of exposure to low (50 µmol photons m-2 s-1), control (110 µmol photons m-2 s-1) and high (300 µmol photons m-2 s-1) light intensity. (B) Diagram summarizing the light exposure of plants during growth. (C) Fv/Fm graphic representation for plants of 6 weeks of age, grown for 4 weeks at 300 µmol m-2 s-1 high light intensity. (D) Fv/Fm values (n=4, mean + SD) of Col-4, cmcu-1, Col-0 and cmcu-2 for plants grown at different light intensities.
3.4 Proteomic characterization of Col-0 and Col-4 WT ecotypes in watered condition
Given the lack of constitutive difference in photosynthetic performance of plants either expressing or lacking cMCU, while significant differences are present in hormone levels, we performed another set of proteomic analysis. We studied the whole proteome from leaf samples of both cmcu-1 and cmcu-2, compared with their corresponding WT ecotypes Col-4 and Col-0, using samples obtained both in control and drought stress conditions. In order to analyze data in a more stringent way, proteins were considered “hits” for a specific comparison if the fold change was over 2 (logFC > 1 or logFC < -1) and were considered “candidates” when the proteins had a fold change over 1.5 (logFC > 0.58 or logFC < -0.58). To begin with, we noticed that strong differences emerged between the Col-0 and Col-4 ecotypes, a topic not addressed so far to our knowledge (Mergner et al., 2020). Therefore, we first compared Col-0 and Col-4 proteome in watered conditions. We found a group of DEPs, represented in an interaction network using STRING in Figure 6A. The degree of up- (red) or downregulation (blue) in Col-4 versus Col-0 is represented for each DEP, while a green color marks proteins annotated by STRING as belonging to the GO class for chlorophyll biosynthetic process (GO:0015995). An enrichment in proteins involved in chlorophyll/pigment biosynthesis was detected among the upregulated proteins in Col-0 compared to Col-4 using the Panther tool (Table 2). The same result was also found using the ShinyGO tool, the results of which are presented in Figure 6B.
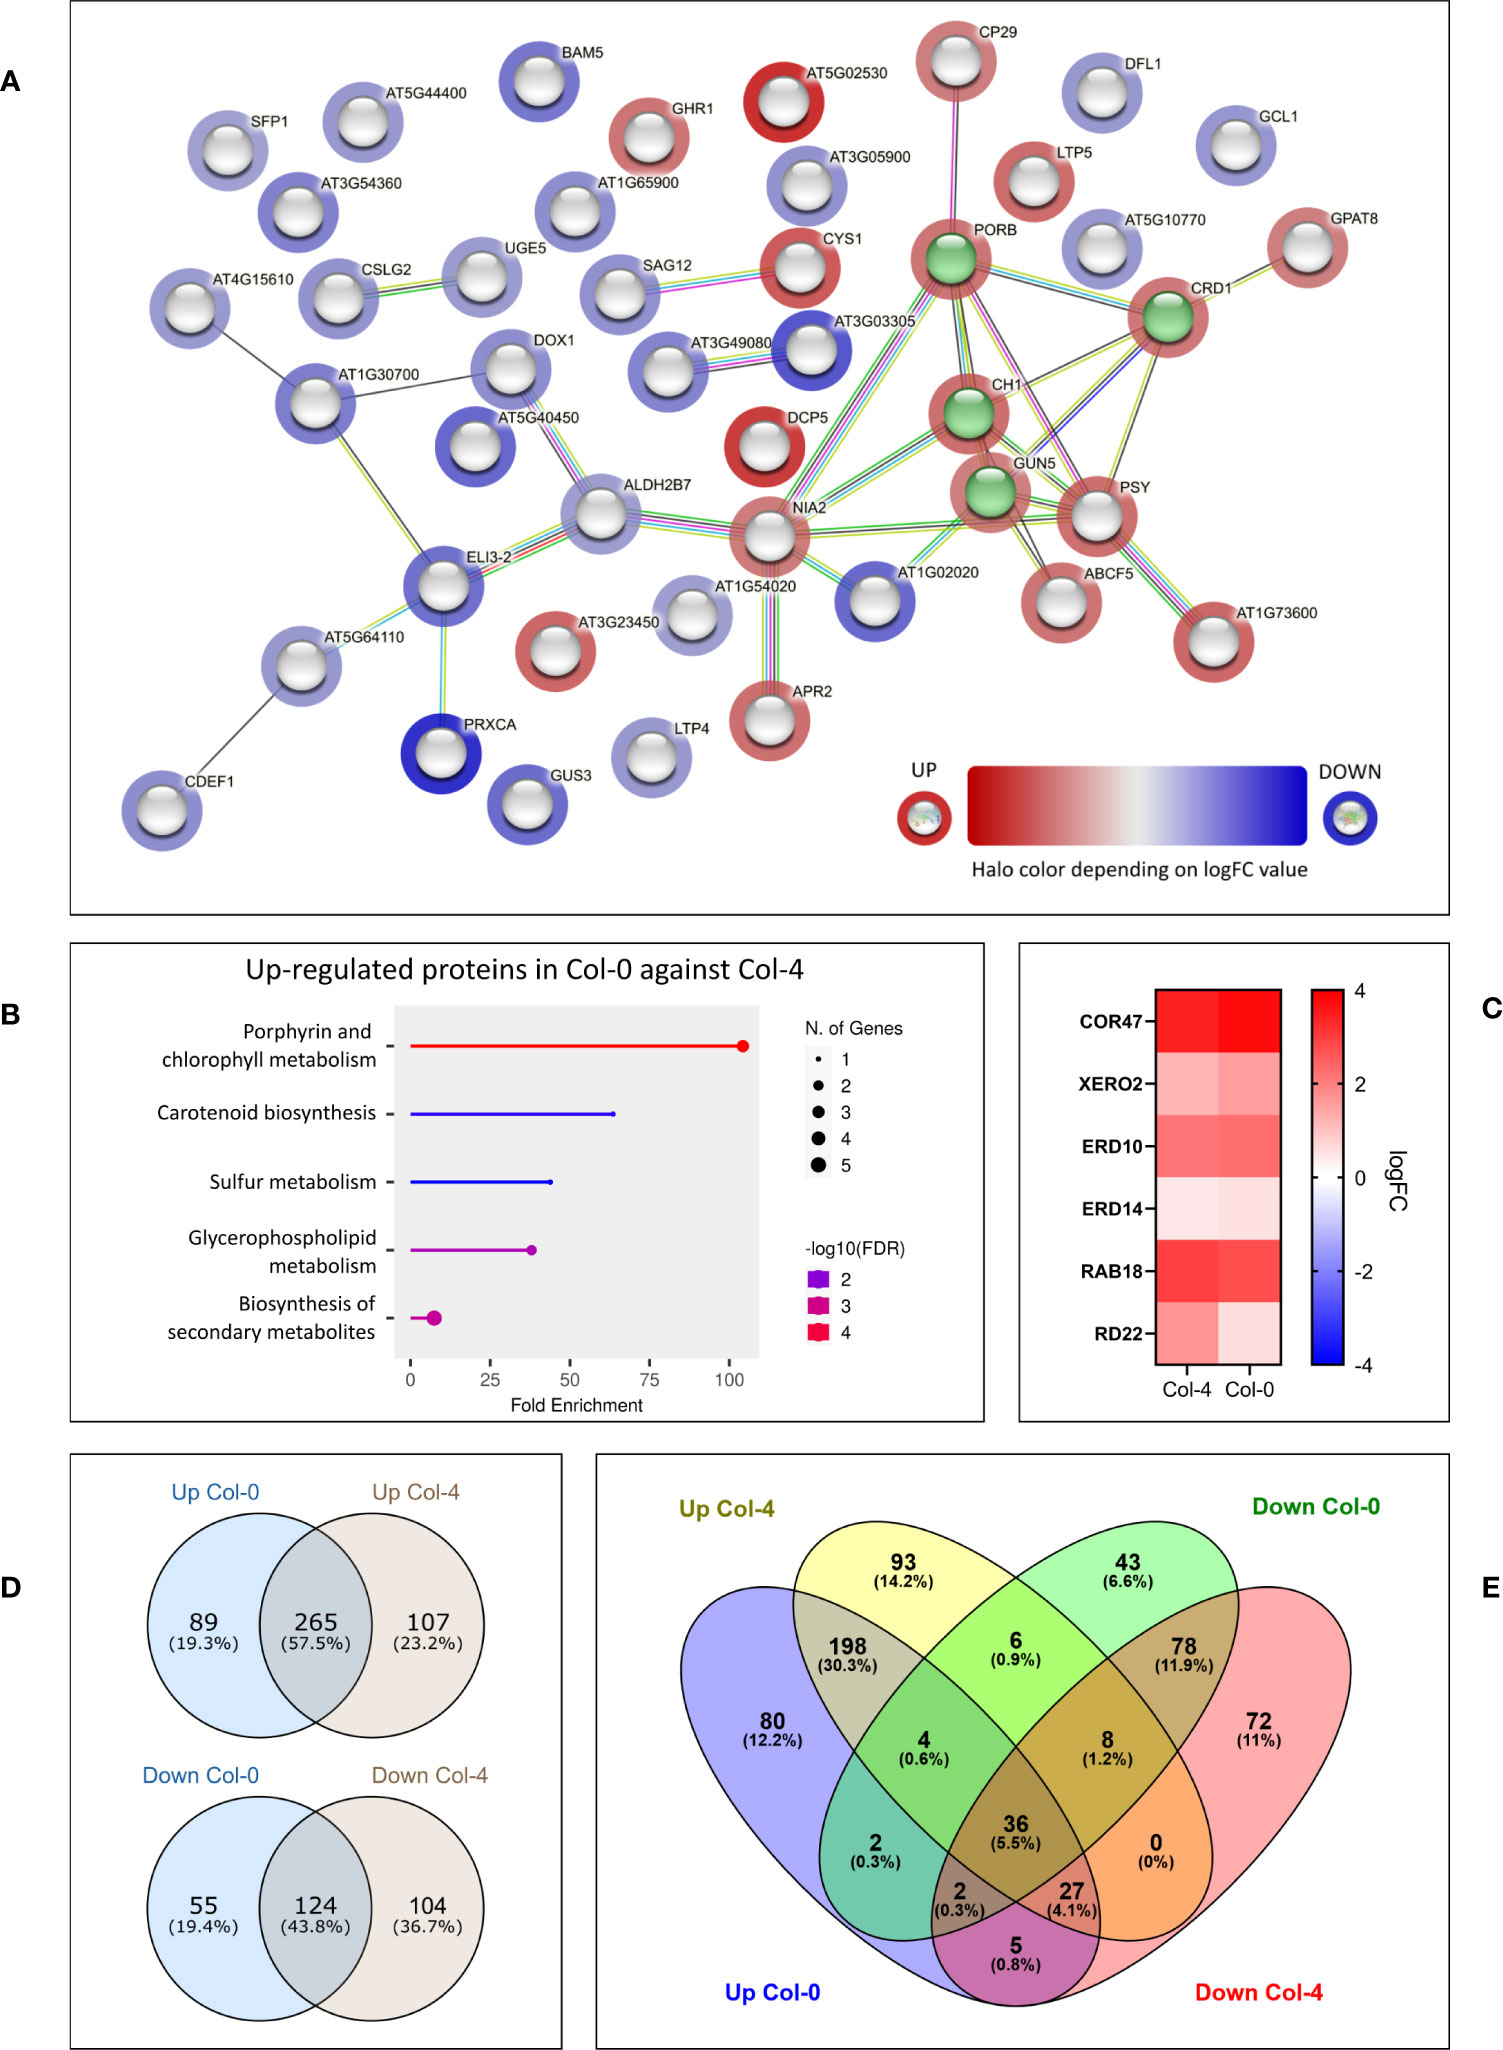
Figure 6 Differences emerging from proteomics between the Col-0 and the Col-4 ecotypes, both in non-stressed and in drought conditions. (A) STRING network of DEPs in Col-4 vs. Col-0 in non-stressed conditions. The logFC value for each protein is represented through the halo color. Proteins annotated by STRING as belonging to “chlorophyll biosynthetic process” class are highlighted in green. (B) ShinyGO chart representation of top enriched GO categories among up-regulated DEPs in non-stressed Col-0 vs. Col-4, showing fold enrichment, protein number and FDR values for each class. (C) Heatmap representing dehydrin upregulation pattern in Col-4 and Col-0 WT drought samples, compared to non-stressed ones. For each protein, the logFC values are shown in color scale. (D, E) Venn diagrams illustrating the overlap and differences in enriched GO classes found among either up- or down-regulated DEPs in Col-0 and Col-4, regarding drought vs. watered comparison. Enrichment analysis in the GO Biological Process ontology was performed with Panther and enriched GO classes were compared across Col-0 and Col-4 ecotypes. When comparing the list of proteins who were significantly upregulated in Col-4 drought vs. watered sample with the list of the proteins that were significantly downregulated in the Col-0 drought vs. watered samples and viceversa, we found 29 proteins that changed in the opposite direction (not shown).
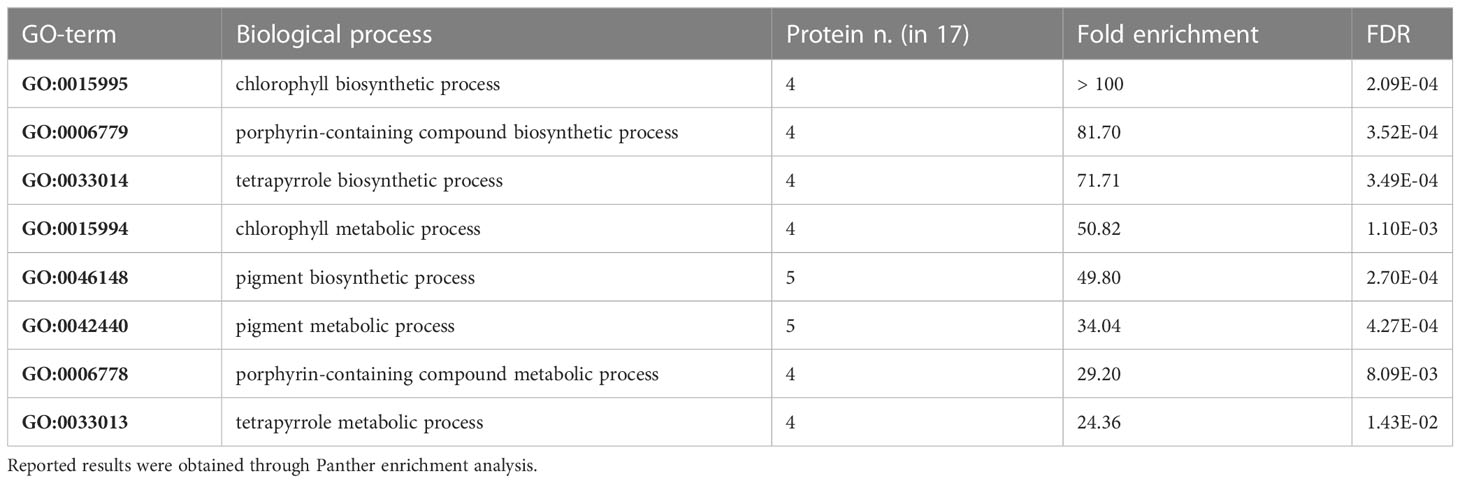
Table 2 Enriched GO Biological Process classes regarding chlorophyll/pigment biosynthesis found among DEPs in Col-0 vs Col-4 comparison.
3.5 Comparison of drought-stressed plant proteome reveals differential expression of proteins belonging to common pathways
Next, we compared the drought response of Col-0 and Col-4 ecotypes and of their respective mutants. First, we used Panther to detect DEPs in the Col-0 proteome in drought-stressed versus control condition, and likewise for Col-4. In both Col-0 and Col-4 plants there was a strong, up to 13-fold upregulation of known drought stress markers and dehydrins, and a similar pattern of upregulation for these markers was observed in both plant lines (Figure 6C), indicating that water deprivation indeed induced drought stress.
Also in this case, many differences among the enriched categories in Col-0 and in Col-4 were detected. Following the Panther analysis, which highlighted the enriched GO Biological Process classes in Col-0 and Col-4 in drought response, Venn diagrams were used to represent the common and distinct enriched categories in the two ecotypes (Figures 6D, E), revealing substantial differences in response to water deprivation in the two ecotypes. A complete list of the GO Biological Process classes found to be enriched in drought response in Col-0 and Col-4 can be found in Supplementary Table 3. Interestingly, abscisic acid biosynthetic process, several metabolic processes including parts of nucleotide and amino acid metabolism, ROS-related processes, translation and ribosome biogenesis, RNA processing and photoprotection processes had different enrichment patterns between the two ecotypes.
Given the different response to drought of the two ecotypes, we considered to perform comparative analysis of the global proteome taking into account the drought response of the cmcu-1 and cmcu-2 lines, compared to their corresponding WT ecotypes. Thus, we focused on the comparisons between cmcu-2 and Col-0 drought samples, and between cmcu-1 and Col-4 drought samples. Also in this case, dehydration markers were upregulated to a similar extent across cmcu-1 and cmcu-2, showing that similarly to WT, cmcu lines were also subjected to drought stress (Supplementary Table 4). For this analysis, as illustrated as an example for the dehydrin COR47 (Figure 7A), on one hand we assessed the set of proteins that were significantly up- or down-regulated between drought samples of WT and cmcu plants (numbered as comparison 1), in order to highlight the proteins that are differentially expressed in drought when cMCU is lacking. On the other hand, we compared the set of proteins that were up- or down-regulated as a consequence of drought stress in WT (comparison 2) and in cmcu plants (comparison 3), in order to identify proteins that are specifically modulated in cmcu lines but not in the WT lines (cmcu-specifically altered proteins).
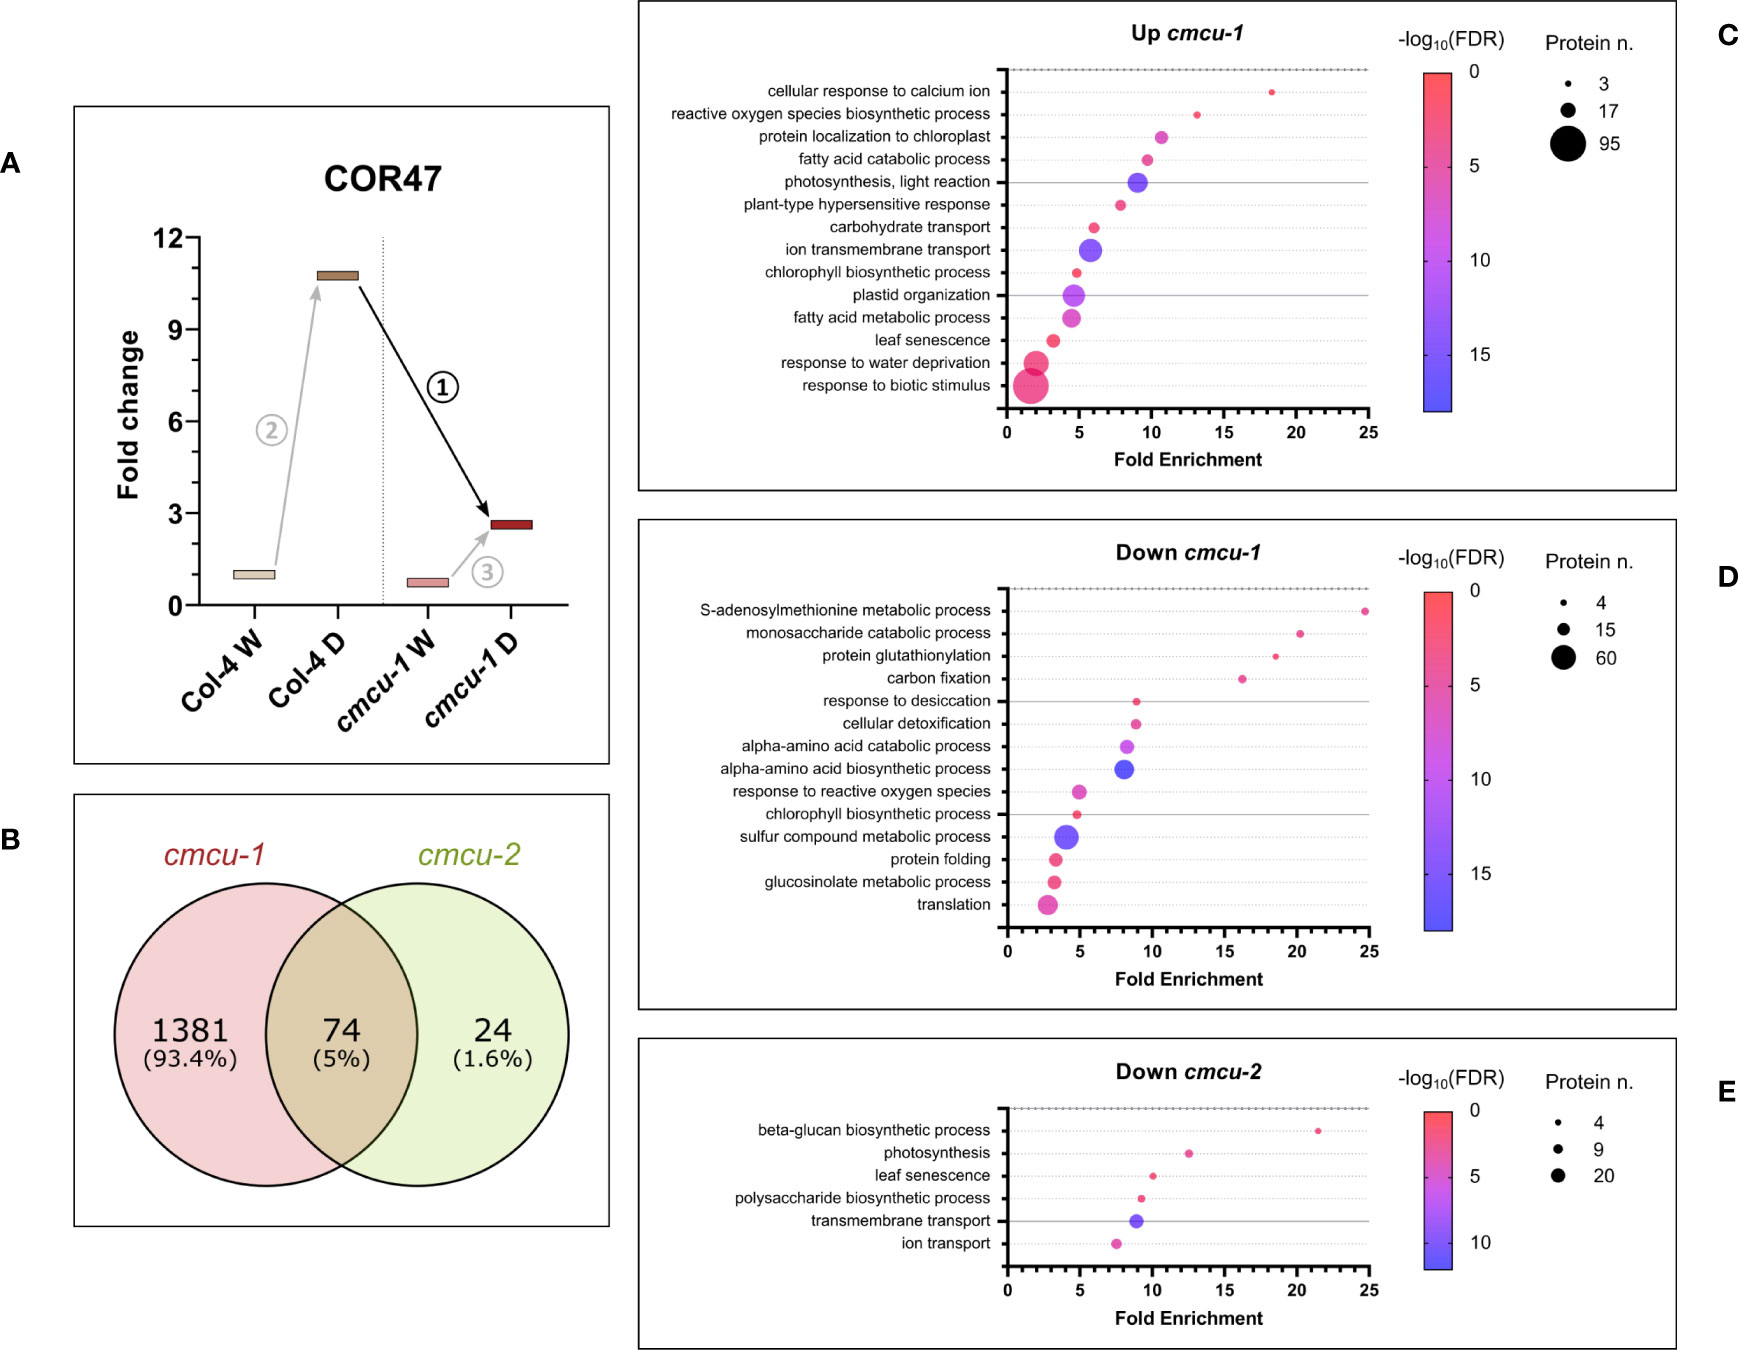
Figure 7 Proteomic analysis regarding the comparison of cmcu samples (n=3 for each line/condition) to their corresponding WT in drought response (A) Diagram illustrating the comparisons across samples that were taken into account for the analyses (see text for details). (B) Venn diagrams illustrating the overlap and differences in DEPs found in cmcu-1 and cmcu-2 in drought vs. watered comparison. Bubble plots showing representative enriched GO classes among up- (C) and down-regulated proteins (D) in cmcu-1, and among down-regulated proteins in cmcu-2 (E). Enriched GO classes in Biological Process ontology were obtained by Panther analysis, and their corresponding fold enrichment, protein number and FDR values are reported in the bubble plots. Please note that only few proteins belonging to the same GO categories that are regulated in an opposite way in the two cmcu lines coincide (see Supplementary Tables 8, 10).
Regarding the first type of analysis (comparison 1), in which differential expressed proteins were identified by comparing each mutant with the respective WT in drought conditions, we found 1455 significantly up- or downregulated proteins (logFC ≥0.58 or ≤-0.58) in cmcu-1 (Supplementary Table 5), while 98 DEPs were detected in cmcu-2 (Supplementary Table 6). The DEPs in cmcu-1 were compared to those found in cmcu-2 (Figure 7B). Among the consistently downregulated chloroplastic proteins upon drought stress, ferritin-1, a key iron storage protein, was present in both cmcu lines. We also noticed that among the proteins related to Ca2+ handling, the plastidial Ca2+ sensing receptor CAS (Li et al., 2022) was consistently less downregulated in both cmcu-1 and cmcu-2 lines upon drought stress compared to their respective WT lines (1.1 and 1.67 fold changes for cmcu-2 vs Col-0 and cmcu-1 vs Col-4 in drought conditions, respectively). Up- and downregulated proteins in cmcu-1 and cmcu-2 were analyzed to find enriched GO classes in the Biological Process Ontology. Full enrichment results obtained using Panther are shown in Supplementary Table 7: many enriched GO classes were found in cmcu-1 DEPs, while no enrichment was detected by Panther among cmcu-2 up-regulated proteins, likely because of the reduced number of DEPs we could detect. Representative GO classes were selected among the enriched ones in the Biological Process ontology, and enrichment results for up- and down-regulated proteins in cmcu-1 and for down-regulated proteins in cmcu-2 in drought were represented in bubble plots, shown respectively in Figures 7C–E. Moreover, proteins included in the most interesting GO classes for cmcu-1, according to Panther, are shown in Supplementary Table 8 (up-regulated in cmcu-1) and Supplementary Table 9 (down-regulated in cmcu-1), while those included in the most interesting GO classes for cmcu-2 downregulated proteins are shown in Supplementary Table 10.
The above analyses highlighted the differential expression of proteins that are up- or down-regulated upon drought stress in the cmcu lines with respect to their corresponding WT lines. In order to better understand which drought response-related proteins and pathways are specifically up- or down-regulated in the KO lines versus WT, we compared the set of DEPs found between drought-stressed and watered samples of Col-0 (comparison 2) with those identified between drought-stressed and watered samples of cmcu-2 (comparison 3). The same analysis was performed for DEPs found in Col-4 in drought response compared with those present in cmcu-1. The Venn diagrams shown in Figure 8A reveal that 112 proteins are only up-regulated upon drought in the cmcu-1 plants, and that 151 proteins are specifically down-regulated in this KO line, while in cmcu-2 plants 343 proteins are specifically up-regulated and 342 are instead down-regulated. We assessed by Panther analysis the enriched GO Biological Process classes representing these cmcu-1 and cmcu-2-specifically altered proteins under drought. Starting from full enrichment results reported in Supplementary Table 11, we selected representative GO enriched classes for either cmcu-1 or cmcu-2 specifically altered proteins and reported them in Figure 8B. Specific upregulated DEPs were linked to many biological processes, such as lipid metabolism, response to ABA and to water deprivation, response to biotic stress in cmcu-1, and to chlorophyll biosynthesis and many other metabolic pathways in cmcu-2. Among cmcu-2-specific DEPs, for example, LIN2, the chloroplastic coproporphyrinogen-III oxidase 1 (also known as CPX1), a key enzyme in the tetrapyrrole biosynthetic pathway for chlorophyll and heme, was significantly upregulated (logFC>0.7) in cmcu-2 plants in contrast to WT upon drought stress. The same is true in cmcu-2 for the 3’-phosphoadenosine 5’-phosphate (PAP) phosphatase SAL1 (Estavillo et al., 2011) that is importantly involved in drought stress response (Estavillo et al., 2011) and retrograde signaling (Pornsiriwong et al., 2017; Phua et al., 2018).
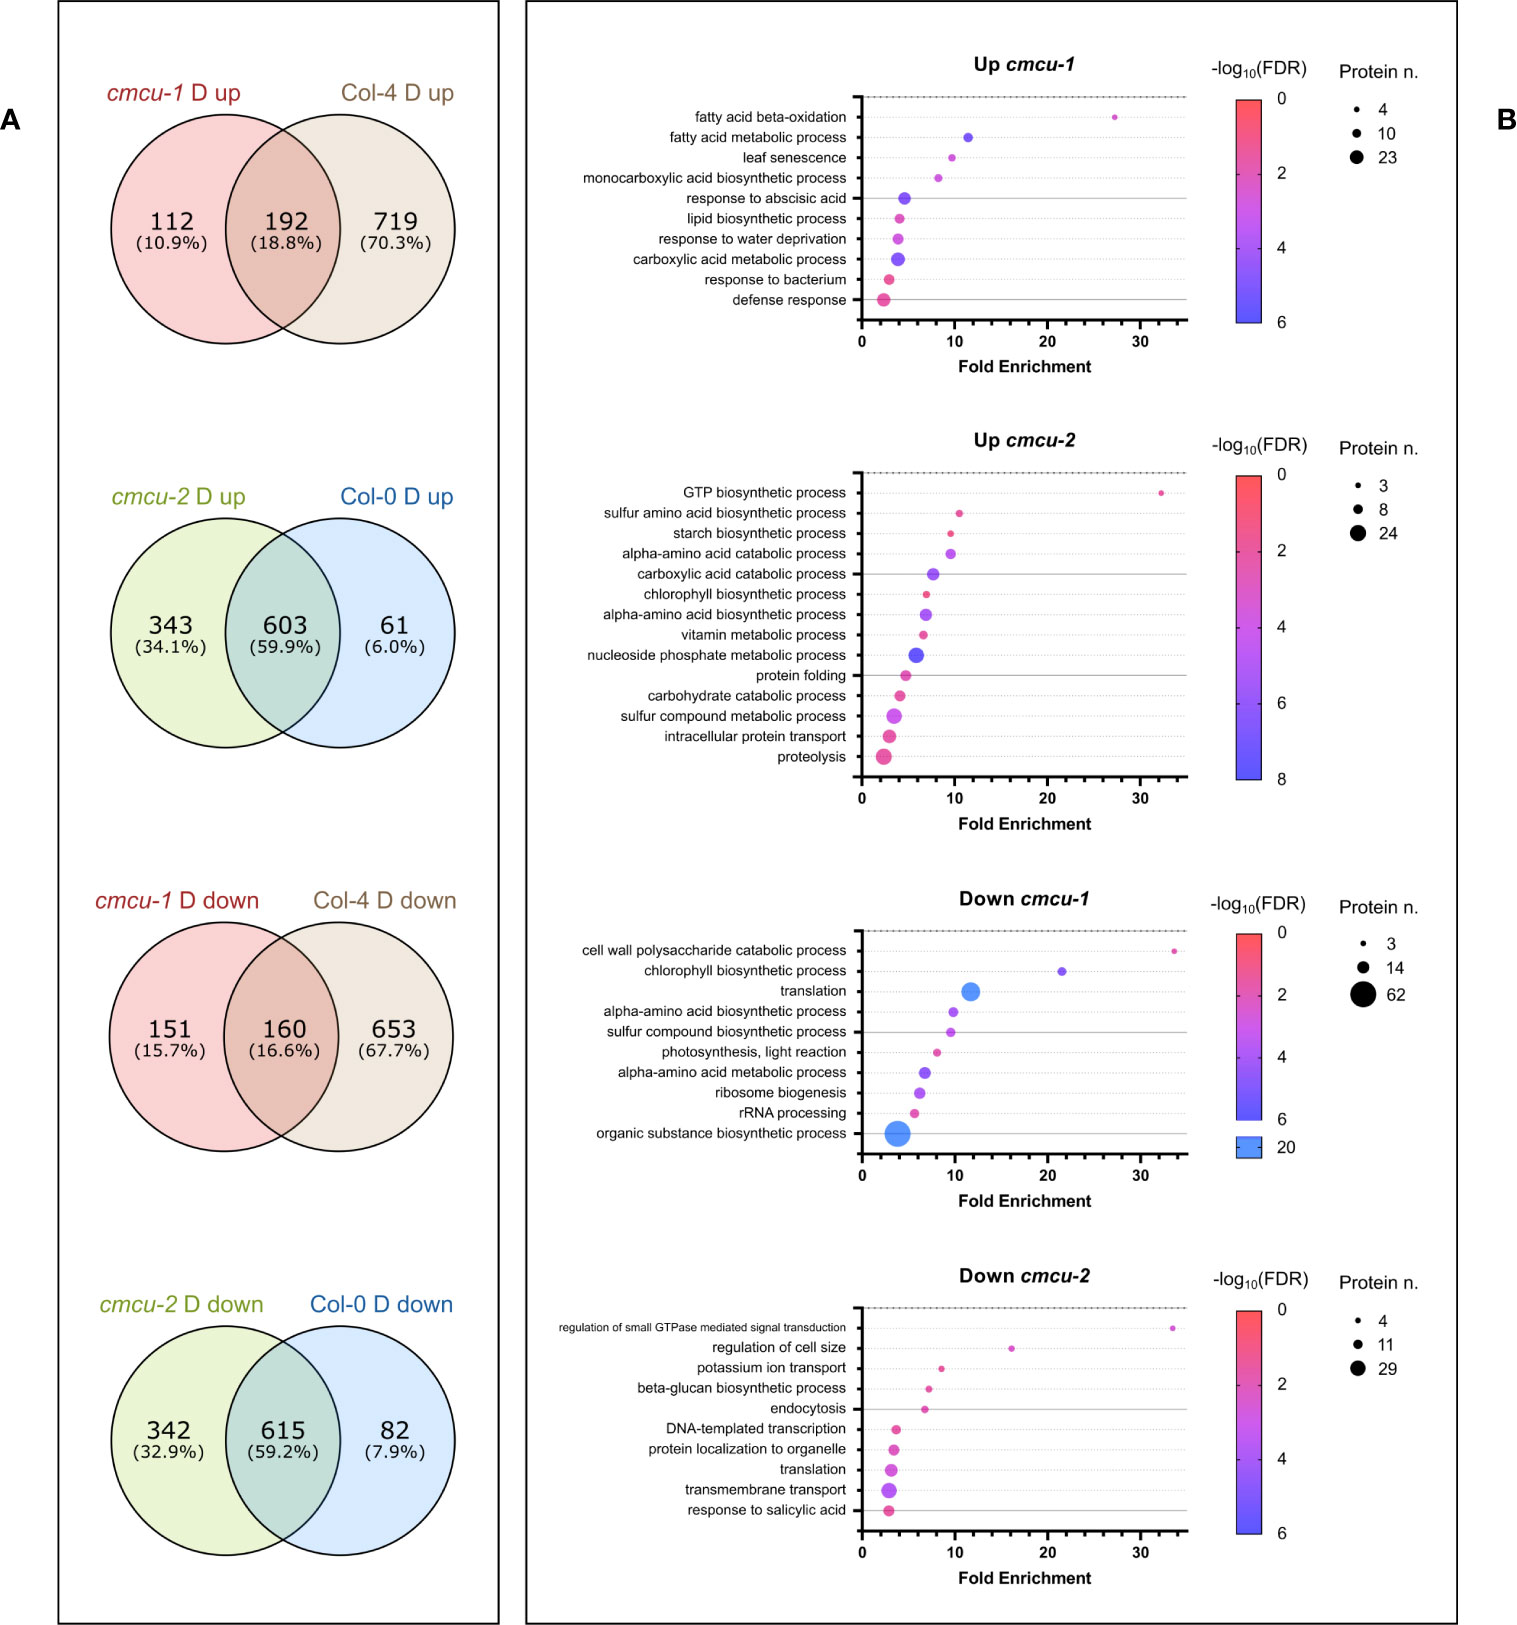
Figure 8 Further analyses of proteomics data for cmcu samples in drought response. (A) Venn diagrams illustrating the overlap and differences in DEPs found either in cmcu-1 and Col-4, or in cmcu-2 and Col-0 in drought vs. watered comparisons. Proteins exclusively found among cmcu-1 (or cmcu-2) up- or down-regulated proteins in drought vs. watered comparison, and not in the corresponding WT in drought vs. watered comparison, were analyzed for enrichment in the GO Biological Process ontology with Panther. Representative enriched GO classes were represented with bubble plots (B) showing their corresponding fold enrichment, protein number and FDR values in either up- or down- regulated proteins in cmcu-1 or cmcu-2.
Moreover, an enrichment in chloroplast-localized proteins was found for these cmcu-specifically altered proteins by Panther analysis in the GO Cellular Component database. In particular, 65 out of 151 downregulated proteins in cmcu-1, 146 out of 343 upregulated proteins in cmcu-2, and 122 out of 342 downregulated proteins in cmcu-2, were annotated as chloroplast (GO:0009507) localized (Table 3). Additionally, since an enrichment for transcription- and translation-related processes was found in Panther Biological Process analysis both for cmcu-1 and cmcu-2 specifically downregulated proteins, we looked at the Molecular Function GO enrichment and found that downregulated proteins in cmcu-1 and -2 are also enriched for RNA/mRNA binding functions (Table 4).
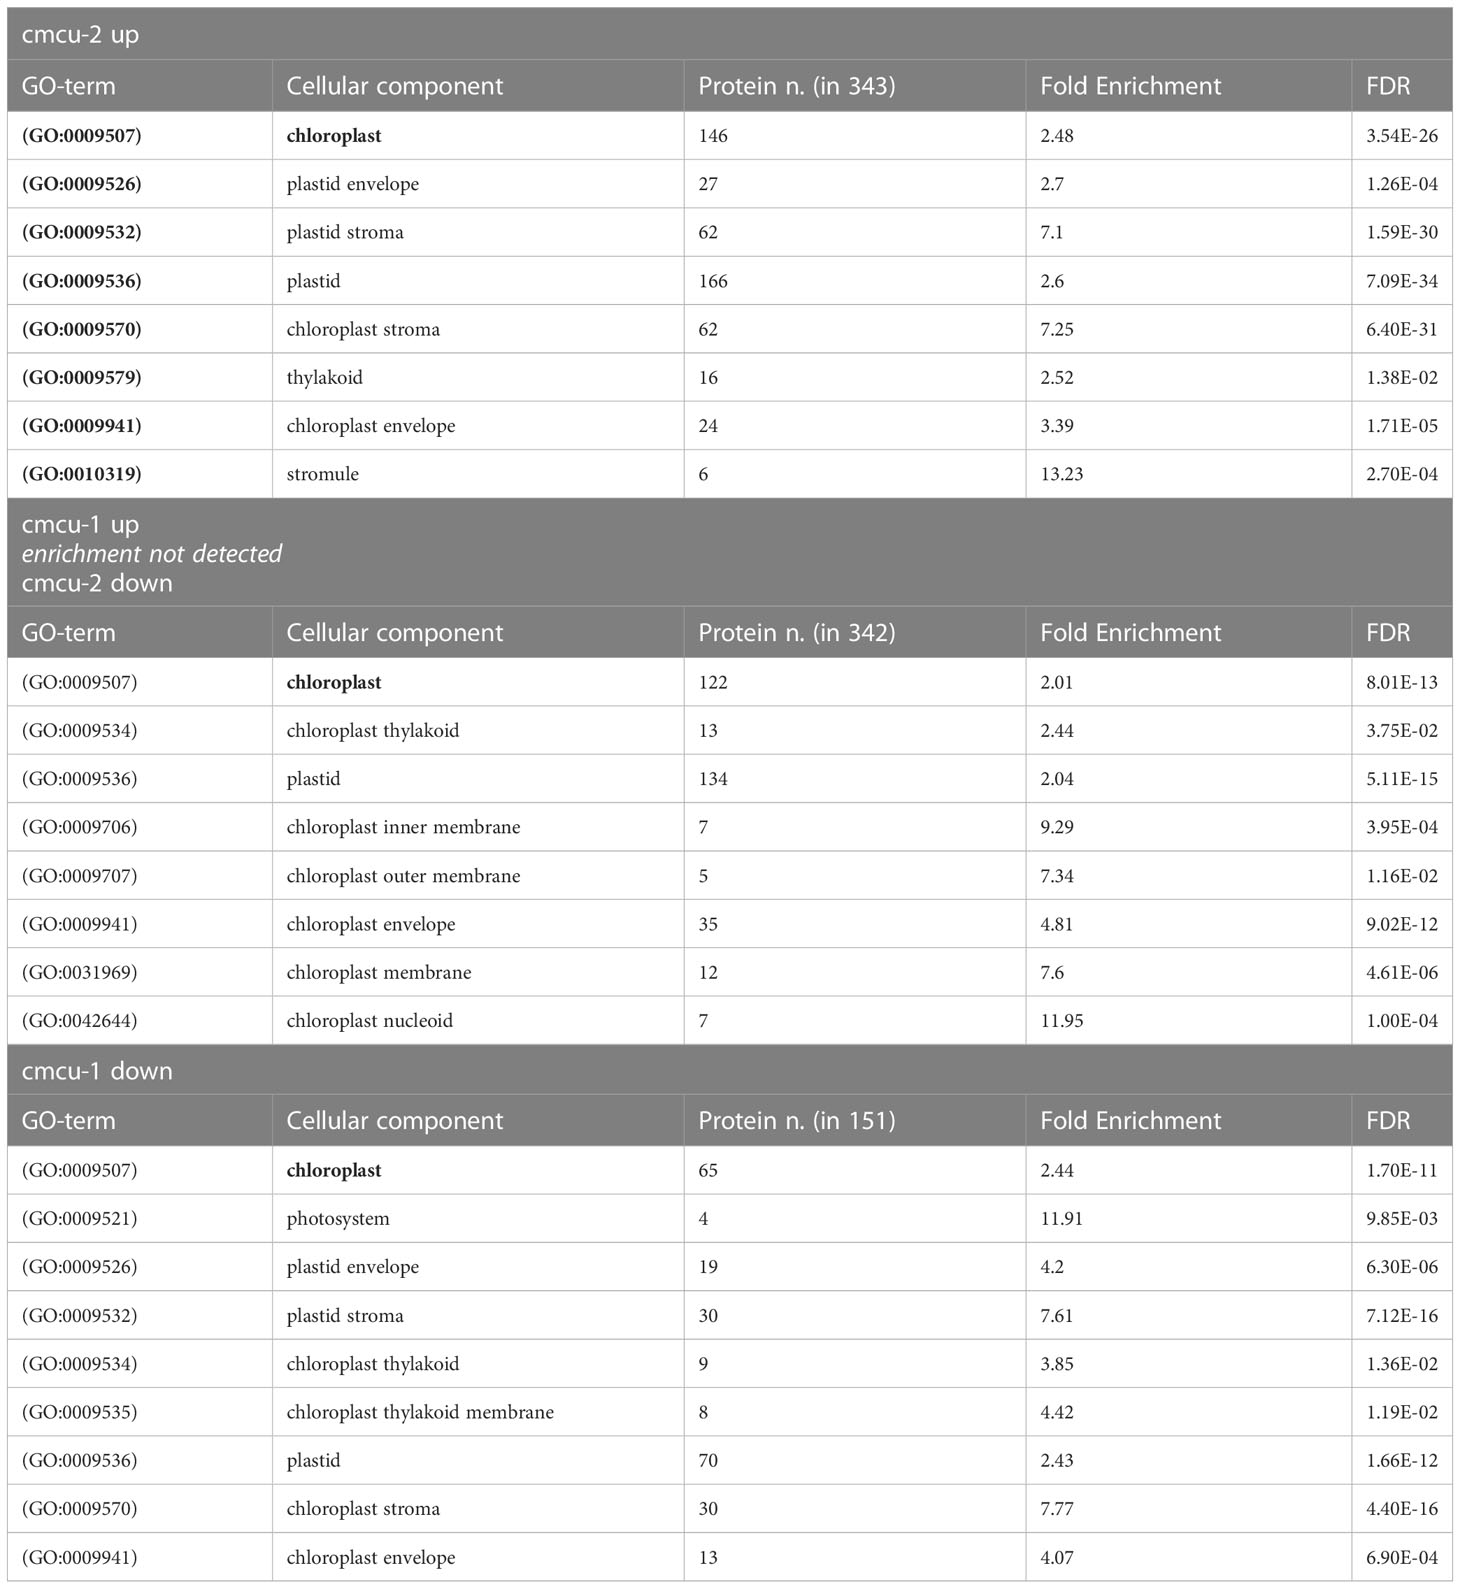
Table 3 Selection of enriched chloroplast-related terms in GO Cellular component among cmcu-1 and cmcu-2 exclusively up- and down-regulated proteins.
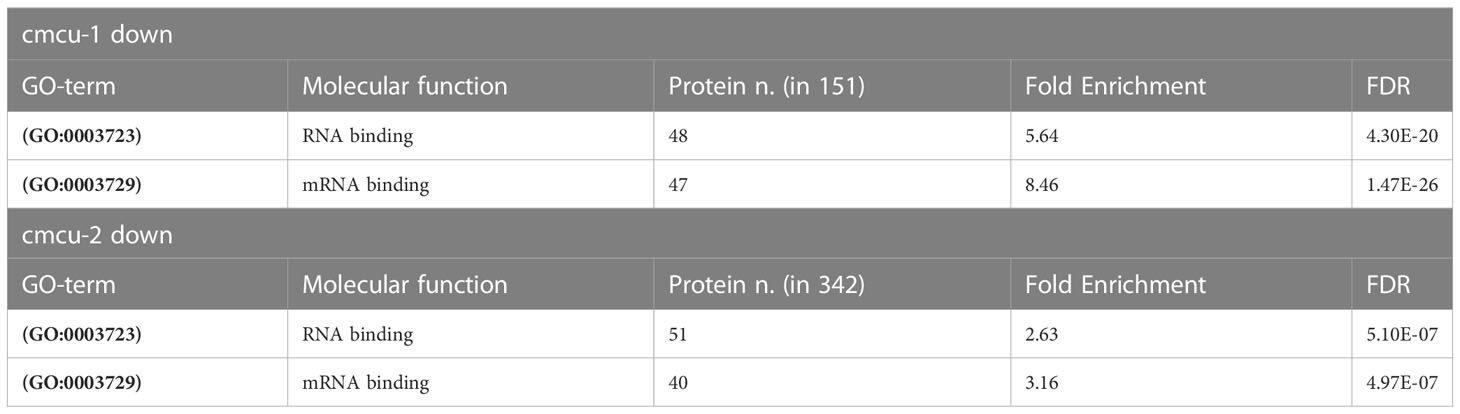
Table 4 Enriched GO Molecular Function terms regarding RNA and mRNA binding among cmcu-1 and cmcu-2 exclusively down-regulated proteins.
3.6 Drought-stressed cmcu plants display a change in time-dependent gene expression
In our exploratory proteome analysis upon drought stress we found proteins belonging to photosynthesis and chlorophyll biosynthesis pathway, retrograde signaling, dehydrins or to other types of drought-responsive proteins. We decided to further investigate the time-dependent expression of some of the genes encoding for these proteins by RT-qPCR both in control and drought stressed samples. In this independent set of plants (Figure 9A), the samples were taken from the WT plants after 10 days of water deprivation and after both 10 and 14 days for the cmcu plants (WT plant samples were not suitable for analysis on day 14 of water deprivation). First, we assessed the expression of typical drought markers in the plants subjected to water deprivation. Graphs in Figure 9 refer to Col-0 versus cmcu-2, but similar results were obtained also in Col-4 versus cmcu-1 (Supplementary Figure 5). Interestingly, the mRNA levels of XERO2 and COR47 dehydrins increased more slowly in the cmcu than in WT plants (Figure 9B). The expression of another drought marker, RD22, mirrored the situation observed with dehydrins but showed a maximal expression at day 10 in the KO.
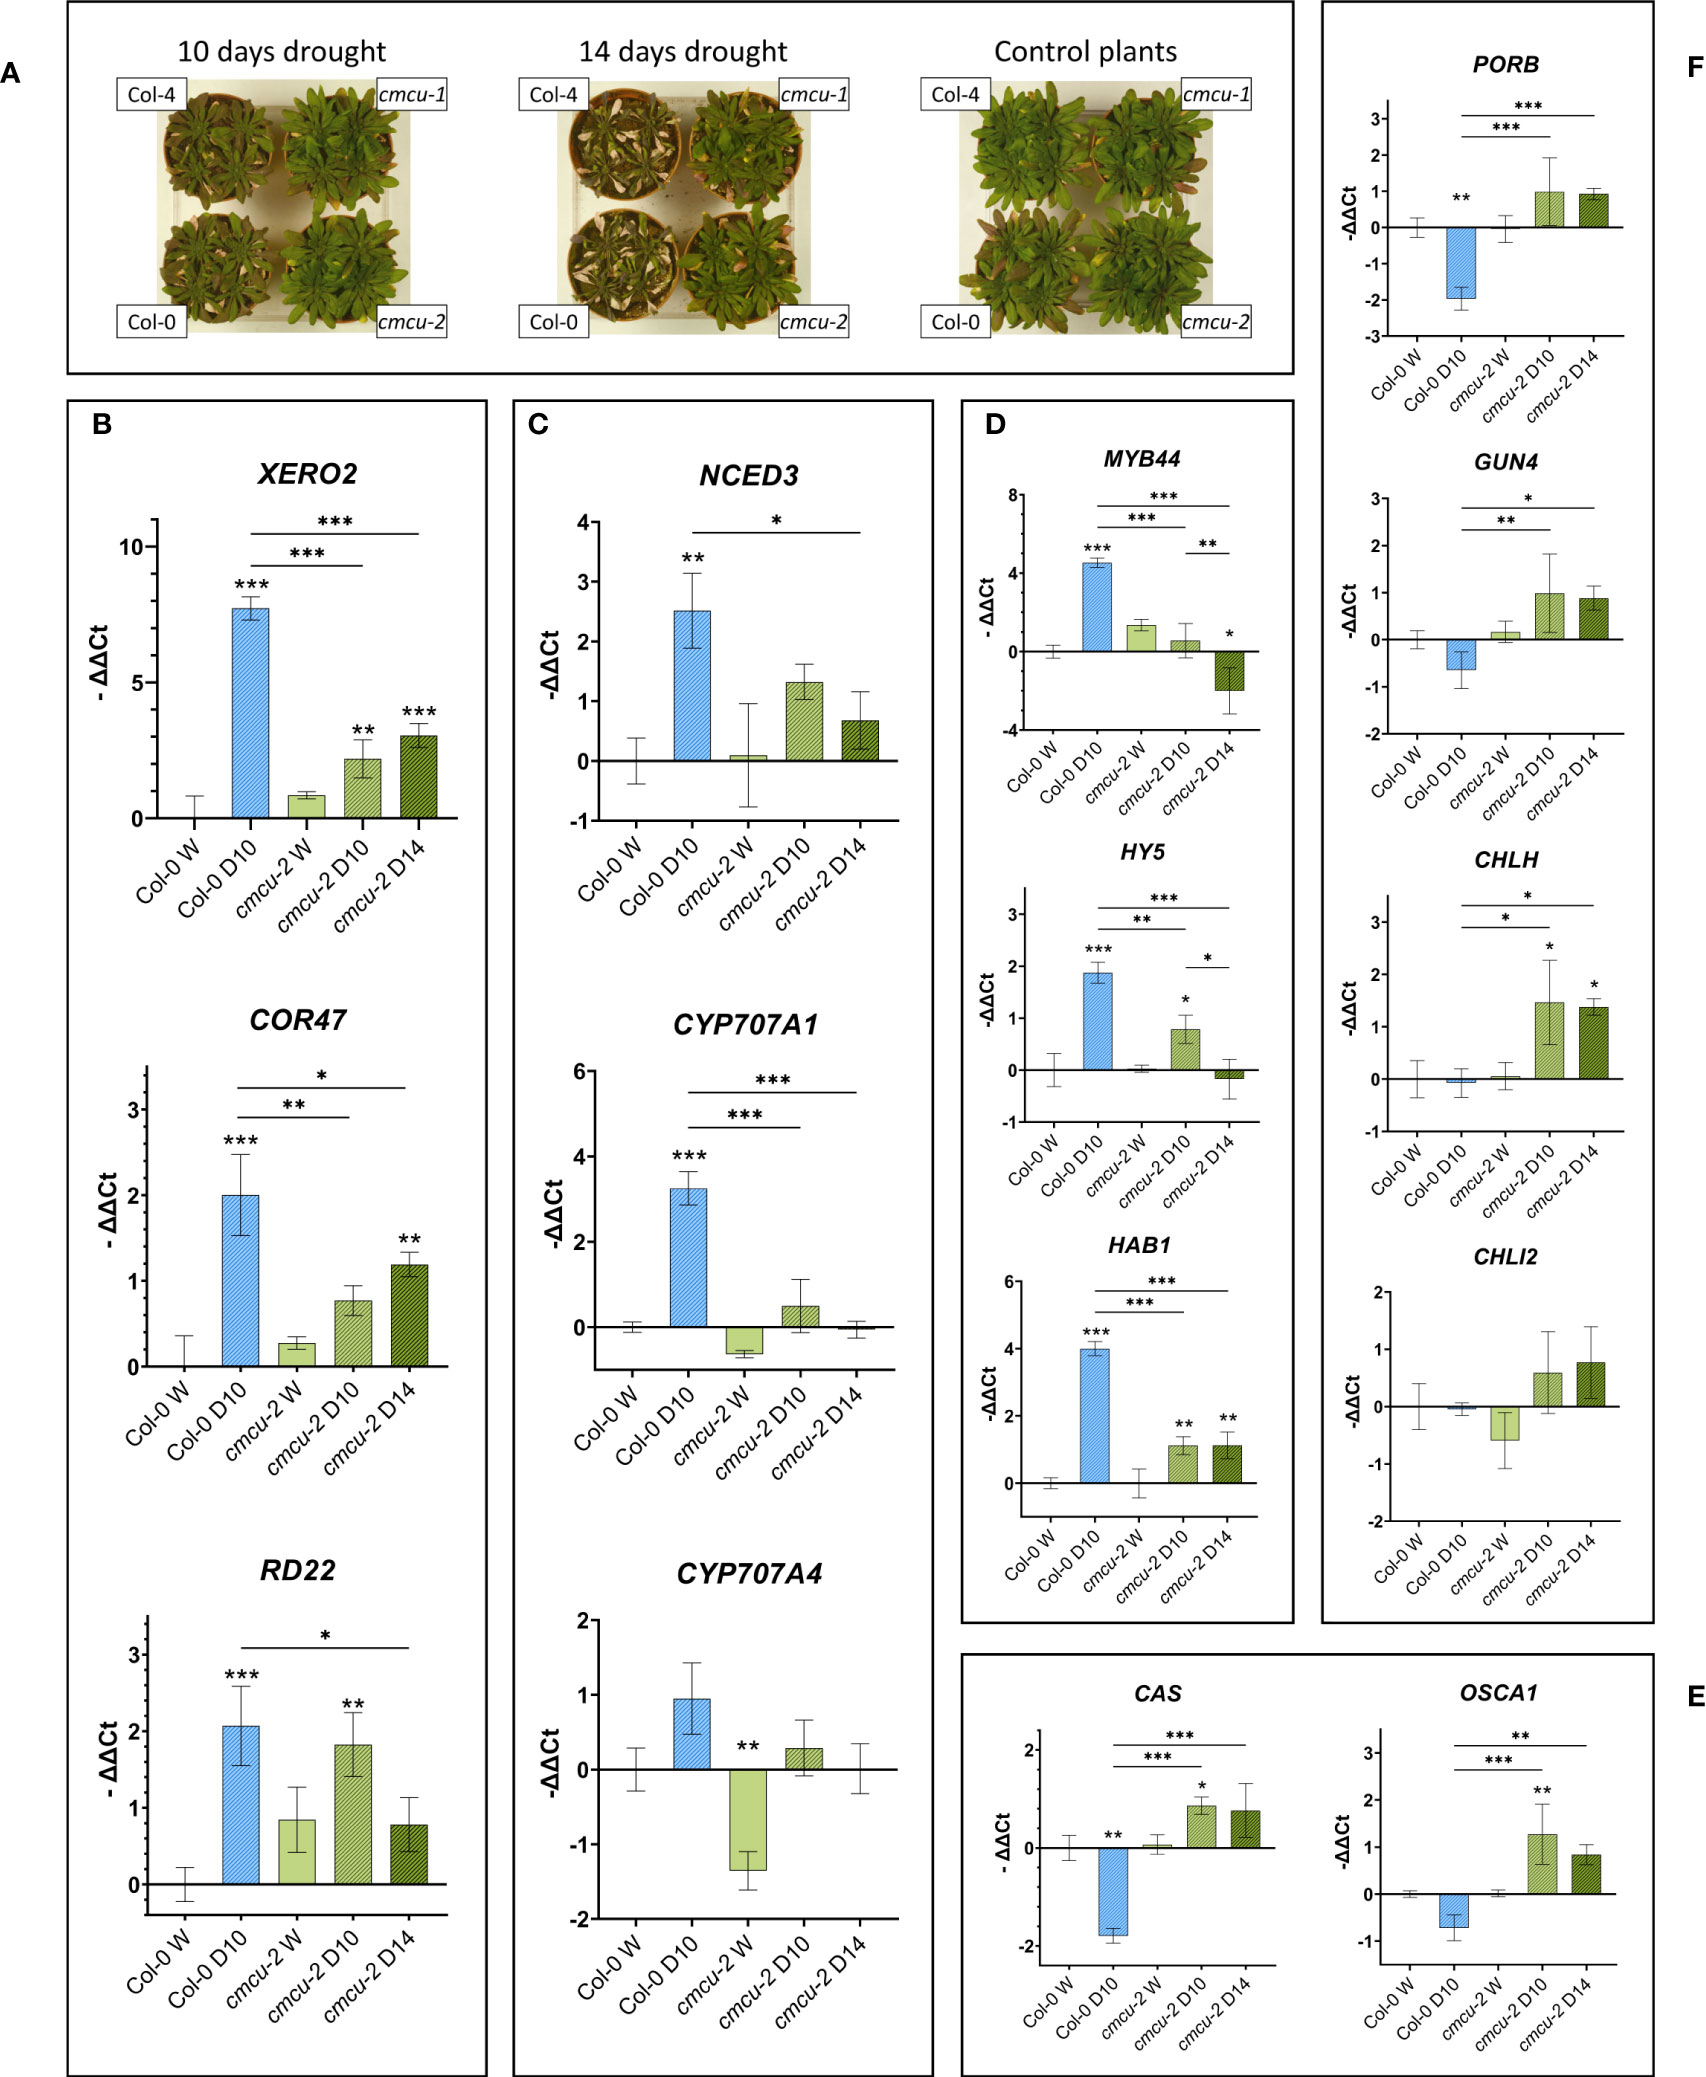
Figure 9 RT-qPCR expression results for genes of interest in cmcu-2 and Col-0 watered and drought-stressed samples (A) WT and cmcu plants after 10 or 14 days of drought, together with non-stressed, control plants. (B-F) Transcript level in RT-qPCR of drought marker genes (B), genes involved in ABA de novo biosynthesis and degradation (C), other genes of interest involved in stress response (D and E) and genes encoding chlorophyll biosynthesis pathway proteins (F). Expression levels are reported as -ΔΔCt (mean ± SD, n=3) for Col-0 WT and cmcu-2 leaves in watered (marked as W) and drought stress conditions, lasting either 10 or 14 days (marked as D10 and D14). Asterisks on bars are used to highlight significant differences of the sample with respect to the control (Col-0 watered sample), while asterisks on horizontal lines highlight significant differences in other comparisons.
Next, we studied the expression of several genes whose protein products were found as DEPs in the proteome analysis. First, we explored the expression level of genes linked to ABA homeostasis (NCED3, CYP707A1 and CYP707A4), observing that i) the gene expression of the rate-limiting ABA de-novo biosynthesis enzyme NCED3 is not as upregulated in drought in cmcu plants as it is in the WT; and ii) the gene expression of CYP707A1 and CYP707A4, enzymes involved in ABA degradation, is not upregulated in drought in cmcu mutants while it is in the WT (Figure 9C; Supplementary Figure 5). These results are in agreement with the enhanced ABA level in cmcu plants and with data presented in Figure 3C for cmcu-2 under watered condition. Expression of the dehydration-activated MYB44 transcription factor, which is transcriptionally activated by ABA and confers drought tolerance through stomatal closure (Jung et al., 2008), was surprisingly lower in the KO plants compared to WT (Figure 9D). The same tendency was observed for the transcription factor ELONGATED HYPOCOTYL 5 (HY5), that connects light and stress signals (Kovács et al., 2019) and seems to interact with ABI5 ensuring ABA signaling integration (Bhagat et al., 2021) (Figure 9D). The protein phosphatase type 2C HAB1, one of the key negative regulators of ABA signaling (Saez et al., 2004), was also much less upregulated in the mutant plants compared to WT plants (Figure 9D).
We also assessed the expression level of two genes whose protein products are crucial for stress responses, the plastidial Ca2+ sensor CAS (Li et al., 2022) and OSCA1, an osmosensing calcium-permeable channel that controls stomatal closure (Yuan et al., 2014; Thor et al., 2020) (Figure 9E), revealing in both cases an up-regulation of gene expression in cmcu-2 samples, but not in WT, upon drought, highlighting an apparent de-repression in cmcu plants. Finally, we found significant differences in some of the chlorophyll biosynthesis genes such as PORB, GUN4, CHLH and CHLI2 (Figure 9F). GUN4 and CHLH (also known as GUN5) are additionally known to take part in retrograde signaling (de Souza et al., 2017). Strikingly, GUN4, CHLH and CHLI2 were not upregulated upon water deprivation in the WT plants, while a significant increase occurred both in the cmcu-2 line (Figure 9F) and in cmcu-1 line (Supplementary Figure 5).
3.7 Bioinformatic analysis of putative interactor network of cMCU
Last, we explored the possibility that the putative interaction partners of cMCU identified by STRING network analysis may contribute to the altered signaling events we observed in the cmcu plants. The predicted interaction network for Arabidopsis cMCU is shown in Figures 10A, B, where, among the 10 predicted best direct interactors, we could find HMA1, a chloroplastic probable Cd2+/Zn2+-transporting ATPase, CRSH, a Ca2+-activated plastidial RelA/spot-like protein that possesses Ca2+-dependent ppGpp (guanosine 3’-diphosphate 5’-diphosphate) synthetase activity and has been linked to drought stress (Ono et al., 2021), the putative Ca2+/Mn2+ transporter BICAT1 (also named PAM71) (Schneider et al., 2016; Frank et al., 2019), the endomembrane localized cation/calcium exchanger CCX3, other MCU isoforms, and a putative peroxisomal Ca2+-dependent solute carrier protein and cation/calcium exchanger CCX4 and LETM1, a putative K+/H+ exchanger involved in Ca2+ signaling modulation (Austin et al., 2017). Among the putative partners, we identified in our proteome LETM1 and HMA1, which however did not show significant changes in expression level among WT and mutants and among watered and drought samples (not shown). However, by extending the list of predicted interactors to indirect ones (Figure 10C), we could interestingly find nucleoside diphosphate kinases 1, 2 and 3 (NDPK1, -2, -3). While NDPK3 shows chloroplastic/mitochondrial localization, NDPK2 is plastidial only (Bölter et al., 2007) and has been proposed to activate MAPK3 and MAPK6 (Moon et al., 2003).
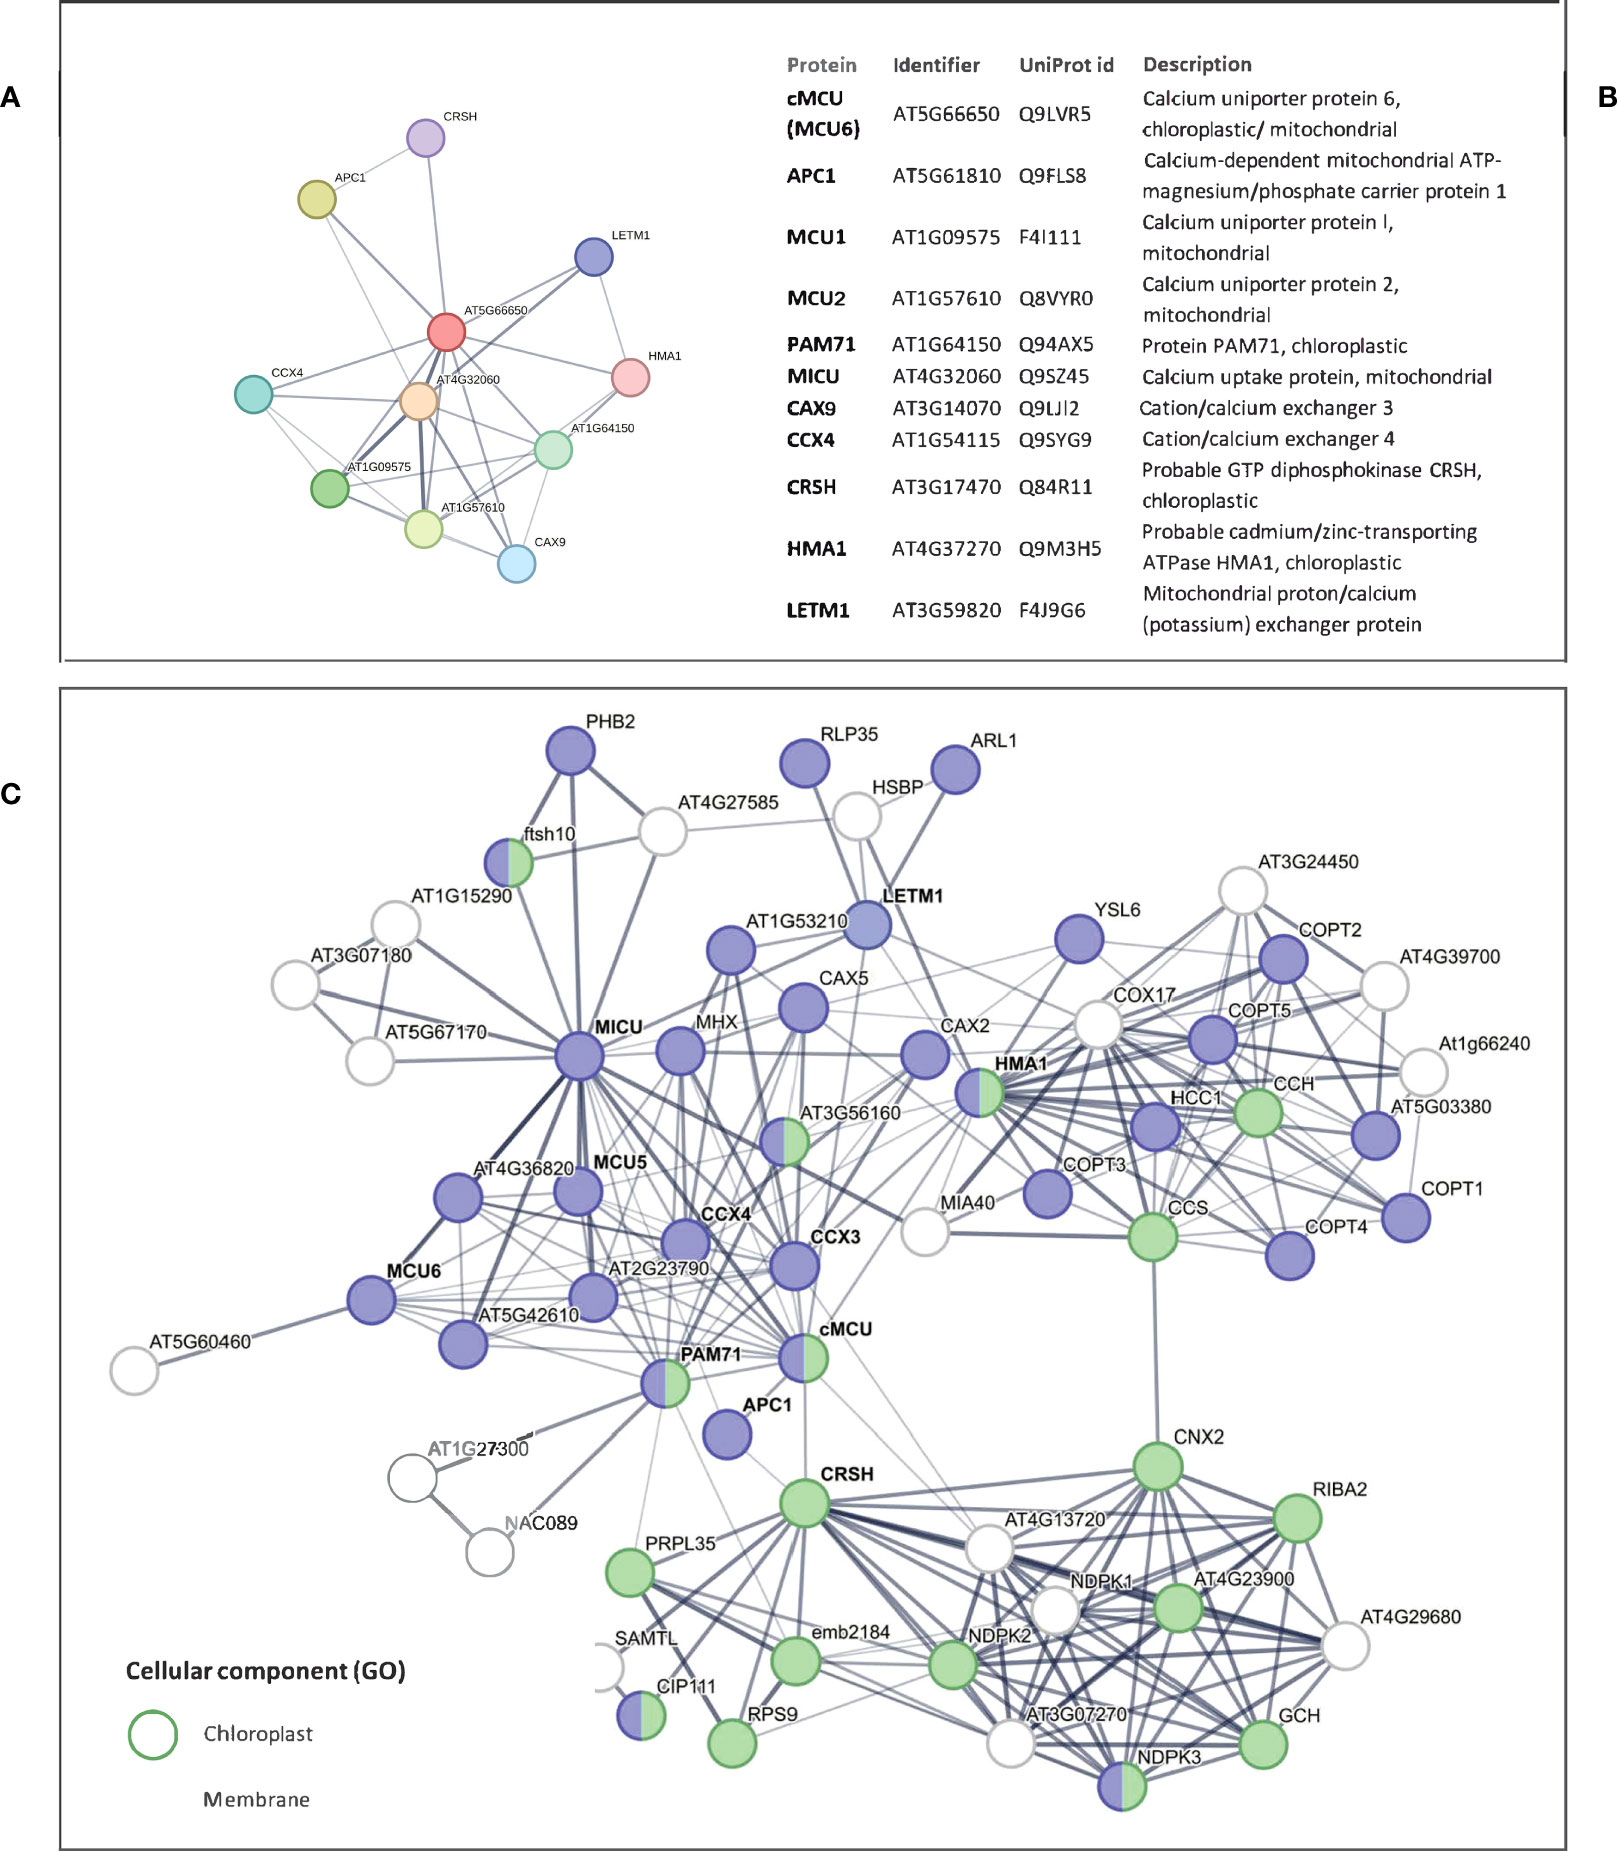
Figure 10 Putative interactor network of cMCU according to interaction databases. (A) STRING network including Arabidopsis cMCU and its 10 best putative interactors, with corresponding protein identifier and description reported in (B). (C) STRING network including Arabidopsis cMCU, its 10 best putative direct interactors (names in bold) and 50 additional indirect interactors. STRING annotations for proteins belonging to “chloroplast” and “membrane” GO Cellular Component classes are highlighted in green and blue, respectively.
4 Discussion
In the present study we followed up on our previous findings showing an enhanced drought resistance in Arabidopsis plants lacking cMCU compared to WT plants (Teardo et al., 2019). The purpose of this paper was to understand whether i) differences in protein expression, hormone levels and ionome under basal, non-stressed conditions could be detected in the mutant plants compared to WT lines; ii) the mutant plants responded in a different way regarding regulation of protein expression upon drought stress compared to the WT plants. The results of these analyses are discussed taking into account information available in the literature regarding drought-stress response in Arabidopsis and crop species.
As described above, significant differences in protein expression were found between cmcu and WT plants at constitutive level in plants grown in the same growth chamber under the same conditions. One of the most striking differences we observed was the upregulation of BG2 (At3g57260). ABA can be inactivated by conjugation with ABA-Glc ester (ABA-GE), one of the predominant ABA conjugates representing the releasable form of ABA, is hydrolyzed in response to dehydration by β-glucosidases (AtBG1/AtBG2), leading to an increase in the active ABA pool (Lee et al., 2006). It has been reported that an increase in BG1/2 expression and/or activity is linked to enhanced ABA levels upon dehydration stress through a mechanism called polymerization-mediated activation (Xu et al., 2012). Both bg1 and bg2 plants showed and increased water loss and were proposed to contribute independently to the dehydration stress response (Xu et al., 2012). In Arabidopsis BG1 and BG2 have been located to the ER and vacuoles, respectively (Xu et al., 2012), although in a more recent paper also AtBG2 was found to be located in the ER (Zavaliev et al., 2013), raising the possibility of a control of its expression level by chloroplast Ca2+ dynamics, given that a communication among ER and chloroplasts is of relevance in various contexts (see e.g. Costa et al., 2018; Liu and Li, 2019). Interestingly, a recent study identified a chloroplastic β-glucosidase isoenzyme in rice, Os3Bglu6, that functions in ABA recycling (Wang et al., 2020). The authors showed that the lack of this enzyme in rice resulted in lower ABA content and photosynthesis rate in leaves, in impaired stomatal movement and in higher drought-sensitivity. The mechanism by which photosynthesis was lowered, however, has not been clarified. Similar to Arabidopsis BG2, overexpression of Os3Bglu6 decreased stomatal aperture under both normal and drought conditions and increased the drought tolerance, ABA concentrations and expressions of ABA- and drought-responsive genes. Furthermore, transcriptomics revealed that disruption of Os3Bglu6 resulted in chloroplastic oxidative stress. Among the 32 predicted genes encoding β-glucosidase enzymes in Arabidopsis, only At3g07320 shows a predicted localization to chloroplasts (see Aramemnon database, http://aramemnon.uni-koeln.de/) (Schwacke et al., 2003). However, no experimental evidence on the function and localization of this protein is available, and this protein was not detected in our proteomic analysis. In summary, our findings of an upregulated BG2 protein level (Figure 3B), as well as of a downregulation of the transcript of ABA-degradation enzymes (Figure 3C) match well the observed constitutively higher ABA level (see Figure 3A) and partially closed stomata (Teardo et al., 2019) in cmcu plants. Interestingly, in a previous study that was investigating the genes of unknown function with abiotic stress responses by high-throughput phenotype screening, one SALK t-DNA insertion line for At5g66650 (defined as gene with unknown function) showed an enhanced tolerance to ABA, however the mechanism has not been investigated (Luhua et al., 2013).
In addition to BG2, the highly upregulated proteins include a so-far poorly characterized transducing/WD-40 repeat family protein, Aspartyl protease AED1 (Apoplastic EDS1-dependent protein 1), as well as calreticulin-3 (CRT3) and plant cadmium resistance 1 protein (PC1). WD40 proteins are involved in various stress responses also through positive regulation of ABA response and by stabilizing accumulation of the transcription factor ABA Insensitive 5 (ABI5) (Xu et al., 2019), while AED1 has been proposed to be part of a homeostatic feedback mechanism regulating systemic immunity (Breitenbach et al., 2014), a process linked to plastidial Ca2+ dynamics (Nomura et al., 2012). CRT3, an ER-located Ca2+-binding chaperone, is encoded by a gene that is co-expressed with genes involved in plant defense, was proposed to be responsible for retaining misfolded glycoproteins in the ER under various stress conditions (Jin et al., 2009) and seems to exert a similar function in rice (Thelin et al., 2011). Crt3 plants are more sensitive to low Ca2+ and salt stress compared to WT plants (Zhigang et al., 2008) and expression of the C-domain of calreticulin, which shows low-affinity, high capacity Ca2+ binding in the ER, conferred better resistance to drought (Tsou et al., 2012). Interestingly, CRT3 also appears to mediate folding of the elf18 responsive EF-Tu receptor (EFR) associated with Pathogen-Associated Molecular Patterns (PAMPs) (Thelin et al., 2011), which is intimately linked to chloroplast Ca2+ dynamics (Nomura et al., 2012; Littlejohn et al., 2021). Altogether, the upregulation of CRT3 in the cmcu mutant suggests that beside the plastid calcium sensor CAS, cMCU might also be involved in plant immunity, a hypothesis that remains to be tested.
Among the constitutively downregulated proteins, we found RH3, RH26 and RH50, three plastid-located DEAD-box RNA helicases (RHs), which are enzymes that can alter RNA structures and thereby modulate interaction with their target proteins, affect RNA metabolism and are linked to abiotic stress response (Nawaz and Kang, 2017). The chloroplast-localized RH3 was reported to be essential for chloroplast ribosome biogenesis, carbon fixation and the maintenance of ABA level in Arabidopsis under environmental stresses, such as dehydration (Lee et al., 2013). Moreover, this factor functions in the splicing of group II introns and possibly also contributes to the assembly of the 50S ribosomal particle both in Arabidopsis and Zea mays (Asakura et al., 2012). AtRH26 was one of the RH factors whose mutations caused a decreased virus accumulation in the Turnip mosaic virus (TuMV)-Arabidopsis pathosystem (Li et al., 2016), while AtRH50 was shown to be a plastidial rRNA maturation factor required for efficient translation of plastid proteins (Paieri et al., 2018). Interestingly, in this latter work the authors demonstrated that RH50 and GUN1, which is involved in retrograde signaling, are functionally related and that this function is associated with plastid gene expression through modulation of ribosome functioning. How Ca2+ affects the expression level of these RNA helicases is unknown, but, interestingly, potassium ion homeostasis alteration within the chloroplasts has recently been shown to affect maturation of the plastid ribosomal RNAs, likely by modulating binding of RNA-processing proteins (DeTar et al., 2021). The resulting disturbance of plastid gene expression was shown in the same study to trigger GUN1-mediated retrograde signaling and to delay chloroplast biogenesis. In addition, a mutant downregulated for all six MCU homologs displayed differentially expressed genes in comparison to WT plants related to ribosome biogenesis and translation (Zhang et al., 2022).
As mentioned, cmcu plants were shown to be more resistant to drought stress than WT plants, a result that we confirmed in the present study. Altered plastidial Ca2+ dynamics either in cas (Guo et al., 2016) or cmcu plants (Teardo et al., 2019) was shown to affect retrograde signaling, in particular MAPK3/6 signaling in the cytosol. Guo et al. proposed that a Ca2+ exit from the chloroplast may activate MAPK via modulation by 14-3-3 proteins that would act as Ca2+-dependent scaffolds for MAPK activation (Guo et al., 2016). In the case of cmcu plants, the Ca2+ uptake into the plastids was reduced. Among the putative partners of cMCU we can find the Ca2+-dependent plastid-located CRSH, a Ca2+-dependent enzyme that catalyzes the synthesis of the signaling nucleotides guanosine penta- and tetraphosphate (ppGpp), a class of molecules involved in stress response and acting as a potent regulator of chloroplast gene expression that reduce steady state transcript levels in the chloroplast (Sugliani et al., 2016). CRSH is an interactor of NDPK2 that was shown to activate MAPK3/6 (Moon et al., 2003). Thus, it is tempting to speculate that cMCU affects CRSH function and/or expression, which in turn activates (plastidial) NDPK2 that transmits the signal to (cytosolic) MAPK3/6. Future experiments are required however to prove this hypothetical chain of events.
Beside an impact of cMCU on the short-term osmotic stress response involving MAPK3/6, we observed that on the longer term, cmcu plants showed resistance to water deprivation and maintained high photosynthetic activity. Our proteomic analysis combined with targeted transcript measurement revealed a de-repression of players of chlorophyll biosynthesis, including those involved in retrograde signaling. Importantly, the changes in transcript levels for these proteins have been confirmed in both cmcu lines, independently of the genetic background, even though, as reported in the present study, there are significant differences in the drought stress response between Col-0 and Col-4 WT plants. This result is not surprising, as for example a proteomic study involving Ws and Col-0 (Leschevin et al., 2021) revealed differences in proteins related to photosynthesis, cell wall-related proteins, plant defense and stress, ROS scavenging and redox homeostasis, DNA/RNA binding, transcription, translation and protein folding, likely accounting for the differential plant development and responses to environmental changes in the two ecotypes. The observation that we identified CAS and proteins involved in chlorophyll biosynthesis as DEPs and DEGs in both cmcu lines, with Col-0 and Col-4 backgrounds, and that the lines showed a highly similar drought resistance, strongly indicates that these players might be strictly linked to drought resistance in both cmcu lines.
Regarding the chloroplast-located Ca2+-sensing receptor CAS, its steady upregulation was shown to enhance stomata closure and drought tolerance (Nomura et al., 2008; Weinl et al., 2008; Zhao et al., 2015). Our finding, i.e. an increase in the CAS transcript and protein levels in both cmcu lines compared to WT lines upon drought stress, is in good agreement with the observed drought tolerance of the plants lacking cMCU. CAS was shown to be involved in the generation of cytosolic Ca2+ signals upon extracellular Ca2+ increase, in both Arabidopsis (Nomura et al., 2008; Weinl et al., 2008) and rice (Zhao et al., 2015), but its overexpression alone was sufficient to promote stomatal closure even in the absence of external calcium. Interestingly, the C-terminal part of CAS can be phosphorylated by STN7/STN8 (Cutolo et al., 2019). It has been proposed that, as a consequence, Ca2+ sequestered by CAS could be released into the chloroplast stroma (Li et al., 2022). In our proteomic analysis we revealed a differential regulation of STN7/8 upon drought stress between cmcu and WT samples, suggesting a possible link between cMCU, STN7/8 and CAS function. However, future work is required to understand the interplay, if any, between CAS and cMCU. In the work of Guo and colleagues, it was shown that CAS-mediated activation of MAPK3/MAPK6 induced activation of ABI4, which in turn repressed LHCB expression (Guo et al., 2016). CAS level is maintained high in the cmcu lines upon drought stress and we found for both CP26 and CP29 internal antenna LCHB proteins of photosystem II an enhanced downregulation upon drought stress in the cmcu-2 line compared to Col-0 (logFC values of -1.6 and -1.8 in Col-0 drought versus watered, while values of -2.3 and -2.5 in cmcu-2), suggesting that similarly to CAS, cMCU might also regulate LHCB repression through MAPK3/6 activation. OSCA1, a hyperosmolarity-gated Ca2+-permeable channel was found to be de-repressed beside CAS in our study in both cmcu lines upon water deprivation. Sorbitol-induced stomatal closure was much reduced in osca1 plants (Yuan et al., 2014). Interestingly however, ABA-induced stomatal closure was unaffected in osca1, suggesting an action of OSCA1 upstream of ABA (Yuan et al., 2014) and also independently of ABA in the context of PAMPs (Thor et al., 2020). Overexpression of Oryza sativa OsOSCA1.4 in Arabidopsis osca1 mutant was shown to complement osmotic Ca2+ signaling and stomatal movement in response to hyperosmolality (Zhai et al., 2020). In addition, soybean OSCA isoforms also rescued the drought-hypersensitive phenotype of osca1 (Liu et al., 2022). Altogether, the de-repression of OSCA1 expression in our study in the cmcu lines might also in part account for the drought-tolerance of cmcu plants.
Regarding other players of retrograde signaling in addition to CAS, we found an increased, de-repressed transcript level in both cmcu lines upon drought stress for genes whose protein products are involved in chlorophyll synthesis, i.e. PorB, GUN4, CHLH (GUN5), CHLI2. A de-repressed chlorophyll biosynthesis pathway is consistent with the ability of cmcu plants to maintain high photosynthetic activity even after prolonged water deprivation (Teardo et al., 2019). We focused our attention in particular on these enzymes because they have been linked not only to chlorophyll synthesis but also retrograde signaling and ABA cross-talk during drought stress response (Du et al., 2012). Both the H and the I subunits of Mg-chelatase (CHLH and CHLHI, respectively) were shown to regulate ABA signaling in guard cells. ABA was shown to bind to CHLH at least in vitro and downregulation of CHLI conferred ABA insensitivity in stomatal response in Arabidopsis and in tobacco (Du et al., 2012). Interestingly, overexpression of CHLH in Arabidopsis guard cells resulted in drought tolerance by induction of stomatal pore closure (Tsuzuki et al., 2013). Although further experiments are required to prove a possible connection between cMCU and retrograde signaling through GUN4 and GUN5 and possibly SAL1 (see above), our result is consistent with the drought-tolerant phenotype of cmcu plants.
Altogether, our data suggests that the lack of cMCU triggers a profound re-programming in the expression of several genes/proteins that might explain the drought tolerance of these Arabidopsis KO plants. This result is in agreement with the well-known ability of plants to remodel the transcriptional network and physiological processes as long-term response to water deficiency, beside the osmotic stress signaling cascade, which induces short-term cellular responses to reduce water loss. Several studies addressed the role of MCU isoforms in other plants as well. For example, promoter analysis also uncovered the existence of two canonical cold-related cis-acting elements in MCU and interestingly in the promoter region of soybean MCU isoforms stress-related phytohormone-responsive elements were found (Li et al., 2022). MCU homolog was also identified in pollen tubes of tobacco, where its role remains unclear (Flores-Herrera et al., 2019), and in pear (Wang et al., 2018). To our knowledge, no studies have addressed so far the role of MCU homologs in response to water deprivation in plants other than Arabidopsis. AtMCU1/2/3 were reported to set mitochondrial calcium uptake in the roots and be linked to regulation of jasmonic acid-related signaling and thigmomorphogenesis (Ruberti et al., 2022). AtMCU2 function was also linked to pollen tube germination (Selles et al., 2018), but in none of these works an potential role of MCU homologs in drought response was studied. Chloroplastic cMCU has different orthologs according to TAIR (Supplementary Table 12). However, we could not find a correspondence between Arabidopsis thaliana and the available Oryza sativa predicted networks (Supplementary Figure 6). Thus, future work is required to reveal the relevance of chloroplast-located calcium channels and related signaling networks in crops.
Data availability statement
The original contributions presented in the study are included in the article/Supplementary Material. Further inquiries can be directed to the corresponding author.
Author contributions
IS, LN, EF FS, ON and FC designed experiments. FC, FS, MF, PS, JS performed experiments. IS, FC, FS, UCV analysed data. IS and FC wrote the manuscript. UCV, EF and AA edited the manuscript. IS, LN, EF, UCV acquired funding. All authors contributed to the article and approved the submitted version.
Funding
We thank Human Frontiers Science Program (HFSP RG0052 to IS), the University of Padova (PRID 2018 prot. BIRD180317 to LN and the MIUR (FFABR 2017 to EF), the EU within the Marie-Curie ITN CALIPSO (FP7, Project no. 607607 to UCV) and the DFG (INST 217/939-1 FUGG to UCV) for financial support.
Acknowledgments
The authors thank Dr Mandy Rettel for help with MS analysis and Dr. Luca Carraretto for help with the preparation of material for the proteomic analysis.
Conflict of interest
The authors declare that the research was conducted in the absence of any commercial or financial relationships that could be construed as a potential conflict of interest.
Publisher’s note
All claims expressed in this article are solely those of the authors and do not necessarily represent those of their affiliated organizations, or those of the publisher, the editors and the reviewers. Any product that may be evaluated in this article, or claim that may be made by its manufacturer, is not guaranteed or endorsed by the publisher.
Supplementary material
The Supplementary Material for this article can be found online at: https://www.frontiersin.org/articles/10.3389/fpls.2023.1228060/full#supplementary-material
Supplementary Figure 1 | RT-qPCR expression results for genes belonging to the MCU family as measured in cmcu-1, cmcu-2 and Col-0 as well as Col-4 samples. Samples obtained from regularly watered, 5 weeks-old plant leaves have been used for transcript analysis. Expression levels are reported as - ΔCt (mean ± SD, n=3), normalized on ACT2 expression in each biological sample and reported relatively to the lowest Ct found. There are no statistically significant differences between the expression level of the shown MCUs in the 4 lines. The primers used for the different genes were those employed in the study of Ruberti et al. (2022), see also Supplementary Table 1.
Supplementary Figure 2 | Additional results of hormone quantifications (n=30). (A) Col-0 and cmcu-2 plants sampled for hormone quantifications. (B) Box plots of hormone abundance for molecules in the jasmonate (JA, cis-OPDA and Ja-Ile), ABA (ABA, PA) and auxin (IAA, oxIAA) families, together with total cytokinins abundance (n=30). (C) Box plots of hormone abundance for molecules in the cytokinin family.
Supplementary Figure 3 | Ionomic analysis of Col-0 and cmcu-2 non-stressed (watered, W, n=3) and drought-stressed (D, n=2) plants. Element concentration in plants rosettes was normalized on plant tissue dry weight, and reported as mean + SD.
Supplementary Figure 4 | Leaf images of Fv/Fm for all replicates (n=24) shown in the photoinhibition experiment shown in , after 24 hours of high light treatment at 1500 photons µmol m-2 s-1. Leaf genotype is indicated in the table below images.
Supplementary Figure 5 | RT-qPCR expression results for genes of interest in cmcu-1 and Col-4 watered and drought-stressed samples. Transcript level of drought marker genes (A), genes involved in ABA de novo biosynthesis and degradation (B), other genes of interest involved in stress response (C, D) and genes encoding chlorophyll biosynthesis pathway proteins (E). Expression levels are reported as -ΔΔCt (mean ± SD, n=3) for Col-4 WT and cmcu-1 leaves in watered (marked as W) and drought stress conditions, lasting either 10 or 14 days (marked as D10 and D14). Asterisks on bars are used to highlight significant differences of the sample with respect to the control (Col-4 watered sample), while asterisks on horizontal lines highlight significant differences in other comparisons.
Supplementary Figure 6 | Putative interactor network of MCU homolog in Oryza sativa OS10T0501500-01 according to STRING interaction database.
References
Antoniadi, I., Plačková, L., Simonovik, B., Doležal, K., Turnbull, C., Ljung, K., et al. (2015). Cell-type-specific cytokinin distribution within the arabidopsis primary root apex. Plant Cell 27, 1955–1967. doi: 10.1105/tpc.15.00176
Asakura, Y., Galarneau, E., Watkins, K. P., Barkan, A., van Wijk, K. J. (2012). Chloroplast RH3 DEAD box RNA helicases in maize and Arabidopsis function in splicing of specific group II introns and affect chloroplast ribosome biogenesis. Plant Physiol. 159, 961–974. doi: 10.1104/pp.112.197525
Austin, S., Tavakoli, M., Pfeiffer, C., Seifert, J., Mattarei, A., De Stefani, D., et al. (2017). LETM1-mediated K(+) and na(+) homeostasis regulates mitochondrial ca(2+) efflux. Front. Physiol. 8. doi: 10.3389/fphys.2017.00839
Bhagat, P. K., Verma, D., Sharma, D., Sinha, A. K. (2021). HY5 and ABI5 transcription factors physically interact to fine tune light and ABA signaling in Arabidopsis. Plant Mol. Biol. 107, 117–127. doi: 10.1007/s11103-021-01187-z
Bölter, B., Sharma, R., Soll, J. (2007). Localisation of arabidopsis NDPK2–revisited. Planta 226, 1059–1065. doi: 10.1007/s00425-007-0549-4
Breitenbach, H. H., Wenig, M., Wittek, F., Jordá, L., Maldonado-Alconada, A. M., Sarioglu, H., et al. (2014). Contrasting roles of the apoplastic aspartyl protease APOPLASTIC, ENHANCED DISEASE SUSCEPTIBILITY1-DEPENDENT1 and LEGUME LECTIN-LIKE PROTEIN1 in arabidopsis systemic acquired resistance. Plant Physiol. 165, 791–809. doi: 10.1104/pp.114.239665
Carraretto, L., Teardo, E., Checchetto, V., Finazzi, G., Uozumi, N., Szabo, I. (2016). Ion channels in plant bioenergetic organelles chloroplast and mitochondria: from molecular identification to function. Mol. Plant. 9(3):371–395. doi: 10.1016/j.molp.2015.12.004
Chakraborty, J., von Stockum, S., Marchesan, E., Caicci, F., Ferrari, V., Rakovic, A., et al. (2018). USP14 inhibition corrects an in vivo model of impaired mitophagy. EMBO molecular medicine 10:(11):e9014. doi: 10.15252/emmm.201809014
Chen, K., Gao, J., Sun, S., Zhang, Z., Yu, B., Li, J., et al. (2020). BONZAI proteins control global osmotic stress responses in plants. Curr. Biol. CB 30, 4815–4825.e4814. doi: 10.1016/j.cub.2020.09.016
Chen, Z., Zhou, M., Newman, I. A., Mendham, N. J., Zhang, G., Shabala, S. (2007). Potassium and sodium relations in salinised barley tissues as a basis of differential salt tolerance. Funct. Plant Biol. FPB 34, 150–162. doi: 10.1071/fp06237
Costa, A., Navazio, L., Szabo, I. (2018). The contribution of organelles to plant intracellular Calcium signalling. J. Exp. Bot. 69, 4175–4193. doi: 10.1093/jxb/ery185
Cutolo, E., Parvin, N., Ruge, H., Pirayesh, N., Roustan, V., Weckwerth, W., et al. (2019). The high light response in arabidopsis requires the calcium sensor protein CAS, a target of STN7- and STN8-mediated phosphorylation. Front. Plant Sci. 10. doi: 10.3389/fpls.2019.00974
D'Oria, A., Jing, L., Arkoun, M., Pluchon, S., Pateyron, S., Trouverie, J., et al. (2022). Transcriptomic, Metabolomic and Ionomic Analyses Reveal Early Modulation of Leaf Mineral Content in Brassica napus under Mild or Severe Drought. Int. J. Mol. Sci. 23(2):781. doi: 10.3390/ijms23020781
de Souza, A., Wang, J. Z., Dehesh, K. (2017). Retrograde signals: integrators of interorganellar communication and orchestrators of plant development. Annu. Rev. Plant Biol. 68, 85–108. doi: 10.1146/annurev-arplant-042916-041007
De Stefani, D., Raffaello, A., Teardo, E., Szabo, I., Rizzuto, R. A. (2011). forty-kilodalton protein of the inner membrane is the mitochondrial calcium uniporter. Nature 476, 336–340. doi: 10.1038/nature10230
DeTar, R. A., Barahimipour, R., Manavski, N., Schwenkert, S., Höhner, R., Bölter, B., et al. (2021). Loss of inner-envelope K+/H+ exchangers impairs plastid rRNA maturation and gene expression. Plant Cell 33, 2479–2505. doi: 10.1093/plcell/koab123
Du, S. Y., Zhang, X. F., Lu, Z., Xin, Q., Wu, Z., Jiang, T., et al. (2012). Roles of the different components of magnesium chelatase in abscisic acid signal transduction. Plant Mol. Biol. 80, 519–537. doi: 10.1007/s11103-012-9965-3
Estavillo, G. M., Crisp, P. A., Pornsiriwong, W., Wirtz, M., Collinge, D., Carrie, C., et al. (2011). Evidence for a SAL1-PAP chloroplast retrograde pathway that functions in drought and high light signaling in Arabidopsis. Plant Cell 23, 3992–4012. doi: 10.1105/tpc.111.091033
Floková, K., Tarkowská, D., Miersch, O., Strnad, M., Wasternack, C., Novák, O. (2014). UHPLC-MS/MS based target profiling of stress-induced phytohormones. Phytochemistry 105, 147–157. doi: 10.1016/j.phytochem.2014.05.015
Flores-Herrera, C., Preciado-Linares, G., Gonzalez-Vizueth, I., Corona de la Peña, N., Gutiérrez-Aguilar, M. (2019). In situ assessment of mitochondrial calcium transport in tobacco pollen tubes. Protoplasma 256, 503–509. doi: 10.1007/s00709-018-1316-z
Frank, J., Happeck, R., Meier, B., Hoang, M. T. T., Stribny, J., Hause, G., et al. (2019). Chloroplast-localized BICAT proteins shape stromal calcium signals and are required for efficient photosynthesis. New Phytol. 221, 866–880. doi: 10.1111/nph.15407
Guo, H., Feng, P., Chi, W., Sun, X., Xu, X., Li, Y., et al. (2016). Plastid-nucleus communication involves calcium-modulated MAPK signalling. Nat. Commun. 7, 12173. doi: 10.1038/ncomms12173
Huber, W., von Heydebreck, A., Sültmann, H., Poustka, A., Vingron, M. (2002). Variance stabilization applied to microarray data calibration and to the quantification of differential expression. Bioinformatics. 18 Suppl 1:S96–104. doi: 10.1093/bioinformatics/18.suppl_1.s96
Jin, H., Hong, Z., Su, W., Li, J. A. (2009). plant-specific calreticulin is a key retention factor for a defective brassinosteroid receptor in the endoplasmic reticulum. Proc. Natl. Acad. Sci. United States America 106, 13612–13617. doi: 10.1073/pnas.0906144106
Jung, C., Seo, J. S., Han, S. W., Koo, Y. J., Kim, C. H., Song, S. I., et al. (2008). Overexpression of AtMYB44 enhances stomatal closure to confer abiotic stress tolerance in transgenic Arabidopsis. Plant Physiol. 146, 623–635. doi: 10.1104/pp.107.110981
Kanno, Y., Jikumaru, Y., Hanada, A., Nambara, E., Abrams, S. R., Kamiya, Y., et al. (2010). Comprehensive hormone profiling in developing arabidopsis seeds: examination of the site of ABA biosynthesis, ABA transport and hormone interactions. Plant Cell Physiol. 51, 1988–2001. doi: 10.1093/pcp/pcq158
Keshishian, E. A., Cliver, B. R., McLaughlin, W. F., Hallmark, H. T., Plačková, L., Goertzen, L. R., et al. (2022). CYTOKININ RESPONSE FACTOR 2 is involved in modulating the salt stress response. Plant J. Cell Mol. Biol. 110, 1097–1110. doi: 10.1111/tpj.15726
Kmiecik, P., Leonardelli, M., Teige, M. (2016). Novel connections in plant organellar signalling link different stress responses and signalling pathways. J. Exp. Bot. 67(13):3793–807. doi: 10.1093/jxb/erw136
Kovács, H., Aleksza, D., Baba, A. I., Hajdu, A., Király, A. M., Zsigmond, L., et al. (2019). Light control of salt-induced proline accumulation is mediated by ELONGATED HYPOCOTYL 5 in arabidopsis. Front. Plant Sci. 10. doi: 10.3389/fpls.2019.01584
Kushiro, T., Okamoto, M., Nakabayashi, K., Yamagishi, K., Kitamura, S., Asami, T., et al. (2004). The Arabidopsis cytochrome P450 CYP707A encodes ABA 8'-hydroxylases: key enzymes in ABA catabolism. EMBO J. 23, 1647–1656. doi: 10.1038/sj.emboj.7600121
Lee, K. H., Park, J., Williams, D. S., Xiong, Y., Hwang, I., Kang, B. H. (2013). Defective chloroplast development inhibits maintenance of normal levels of abscisic acid in a mutant of the Arabidopsis RH3 DEAD-box protein during early post-germination growth. Plant J. Cell Mol. Biol. 73, 720–732. doi: 10.1111/tpj.12055
Lee, K. H., Piao, H. L., Kim, H. Y., Choi, S. M., Jiang, F., Hartung, W., et al. (2006). Activation of glucosidase via stress-induced polymerization rapidly increases active pools of abscisic acid. Cell 126, 1109–1120. doi: 10.1016/j.cell.2006.07.034
Leschevin, M., Marcelo, P., Ismael, M., San-Clemente, H., Jamet, E., Rayon, C., et al. (2021). Tandem Mass Tags (TMTs) labeling approach highlights differences between the shoot proteome of two Arabidopsis thaliana ecotypes, Col-0 and Ws. Proteomics 21, e2000293. doi: 10.1002/pmic.202000293
Li, B., Hou, L., Song, C., Wang, Z., Xue, Q., Li, Y., et al. (2022). Biological function of calcium-sensing receptor (CAS) and its coupling calcium signaling in plants. Plant Physiol. Biochem. PPB 180, 74–80. doi: 10.1016/j.plaphy.2022.03.032
Li, J., Sun, M., Liu, Y., Sun, X., Yin, K. (2022). Genome-wide identification of wild soybean mitochondrial calcium uniporter family genes and their responses to cold and carbonate alkaline stresses. Front. Plant Sci. 13. doi: 10.3389/fpls.2022.867503
Li, Y., Xiong, R., Bernards, M., Wang, A. (2016). Recruitment of arabidopsis RNA helicase atRH9 to the viral replication complex by viral replicase to promote turnip mosaic virus replication. Sci. Rep. 6, 30297. doi: 10.1038/srep30297
Littlejohn, G. R., Breen, S., Smirnoff, N., Grant, M. (2021). Chloroplast immunity illuminated. New Phytol. 229, 3088–3107. doi: 10.1111/nph.17076
Liu, L., Li, J. (2019). Communications between the endoplasmic reticulum and other organelles during abiotic stress response in plants. Front. Plant Sci. 10:749. doi: 10.3389/fpls.2019.00749
Liu, Y., Liu, Y., Tong, C., Cong, P., Shi, X., Shi, L., et al. (2020). Quantitative analysis of the global proteome in lung from mice with blast injury. Exp. Lung Res. 46, 308–319. doi: 10.1080/01902148.2020.1801896
Liu, C., Wang, H., Zhang, Y., Cheng, H., Hu, Z., Pei, Z. M., et al. (2022). Systematic characterization of the OSCA family members in soybean and validation of their functions in osmotic stress. Int. J. Mol. Sci. 23. doi: 10.3390/ijms231810570
Loro, G., Wagner, S., Doccula, F. G., Behera, S., Weinl, S., Kudla, J., et al. (2016). Chloroplast-specific in vivo Ca2+ Imaging using yellow cameleon fluorescent protein sensors reveals organelle-autonomous ca2+ Signatures in the stroma. Plant Physiol. 171, 2317–2330. doi: 10.1104/pp.16.00652
Luhua, S., Hegie, A., Suzuki, N., Shulaev, E., Luo, X., Cenariu, D., et al. (2013). Linking genes of unknown function with abiotic stress responses by high-throughput phenotype screening. Physiol. plantarum 148, 322–333. doi: 10.1111/ppl.12013
McAinsh, M. R., Pittman, J. K. (2009). Shaping the calcium signature. New Phytol. 181, 275–294. doi: 10.1111/j.1469-8137.2008.02682.x
Mergner, J., Frejno, M., List, M., Papacek, M., Chen, X., Chaudhary, A., et al. (2020). Mass-spectrometry-based draft of the Arabidopsis proteome. Nature 579, 409–414. doi: 10.1038/s41586-020-2094-2
Moon, H., Lee, B., Choi, G., Shin, D., Prasad, D. T., Lee, O., et al. (2003). NDP kinase 2 interacts with two oxidative stress-activated MAPKs to regulate cellular redox state and enhances multiple stress tolerance in transgenic plants. Proc. Natl. Acad. Sci. United States America 100, 358–363. doi: 10.1073/pnas.252641899
Navazio, L., Formentin, E., Cendron, L., Szabò, I. (2020). Chloroplast calcium signaling in the spotlight. Front. Plant Sci. 11. doi: 10.3389/fpls.2020.00186
Nawaz, G., Kang, H. (2017). Chloroplast- or mitochondria-targeted DEAD-box RNA helicases play essential roles in organellar RNA metabolism and abiotic stress responses. Front. Plant Sci. 8. doi: 10.3389/fpls.2017.00871
Nomura, H., Komori, T., Kobori, M., Nakahira, Y., Shiina, T. (2008). Evidence for chloroplast control of external Ca2+-induced cytosolic Ca2+ transients and stomatal closure. Plant J. Cell Mol. Biol. 53, 988–998. doi: 10.1111/j.1365-313X.2007.03390.x
Nomura, H., Komori, T., Uemura, S., Kanda, Y., Shimotani, K., Nakai, K., et al. (2012). Chloroplast-mediated activation of plant immune signalling in Arabidopsis. Nat. Commun. 3, 926. doi: 10.1038/ncomms1926
Nomura, H., Shiina, T. (2014). Calcium signaling in plant endosymbiotic organelles: mechanism and role in physiology. Mol. Plant 7, 1094–1104. doi: 10.1093/mp/ssu020
Ono, S., Suzuki, S., Ito, D., Tagawa, S., Shiina, T., Masuda, S. (2021). Plastidial (p)ppGpp synthesis by the ca2+-dependent relA-spoT homolog regulates the adaptation of chloroplast gene expression to darkness in arabidopsis. Plant Cell Physiol. 61, 2077–2086. doi: 10.1093/pcp/pcaa124
Paieri, F., Tadini, L., Manavski, N., Kleine, T., Ferrari, R., Morandini, P., et al. (2018). The DEAD-box RNA helicase RH50 is a 23S-4.5S rRNA maturation factor that functionally overlaps with the plastid signaling factor GUN1. Plant Physiol. 176, 634–648. doi: 10.1104/pp.17.01545
Phua, S. Y., Yan, D., Chan, K. X., Estavillo, G. M., Nambara, E., Pogson, B. J. (2018). The arabidopsis SAL1-PAP pathway: A case study for integrating chloroplast retrograde, light and hormonal signaling in modulating plant growth and development? Front. Plant Sci. 9. doi: 10.3389/fpls.2018.01171
Pornsiriwong, W., Estavillo, G. M., Chan, K. X., Tee, E. E., Ganguly, D., Crisp, P. A., et al. (2017). A chloroplast retrograde signal, 3'-phosphoadenosine 5'-phosphate, acts as a secondary messenger in abscisic acid signaling in stomatal closure and germination. eLife 6:e23361. doi: 10.7554/eLife.23361
Porra, R. J., Thompson, W. A., Kriedemann, P. E. (1989). Determination of accurate extinction coefficients and simultaneous equations for assaying chlorophylls a and b extracted with four different solvents: verification of the concentration of chlorophyll standards by atomic absorption spectroscopy. Biochim. Biophys. Acta (BBA) - Bioener. 975, 384–394. doi: 10.1016/S0005-2728(89)80347-0
Ritchie, M.E., Phipson, B., Wu, D., Hu, Y., Law, C. W., Shi, W., et al. (2015). limma powers differential expression analyses for RNA-sequencing and microarray studies. Nucleic Acids Res. 43(7):e47. doi: 10.1093/nar/gkv007
Rizzuto, R., De Stefani, D., Raffaello, A., Mammucari, C. (2012). Mitochondria as sensors and regulators of calcium signalling. Nat. Rev. Mol. Cell Biol. 13, 566–578. doi: 10.1038/nrm3412
Rocha, A. G., Vothknecht, U. C. (2012). The role of calcium in chloroplasts–an intriguing and unresolved puzzle. Protoplasma 249, 957–966. doi: 10.1007/s00709-011-0373-3
Ruberti, C., Feitosa-Araujo, E., Xu, Z., Wagner, S., Grenzi, M., Darwish, E., et al. (2022). MCU proteins dominate in vivo mitochondrial Ca2+ uptake in Arabidopsis roots. Plant Cell 34, 4428–4452. doi: 10.1093/plcell/koac242
Saez, A., Apostolova, N., Gonzalez-Guzman, M., Gonzalez-Garcia, M. P., Nicolas, C., Lorenzo, O., et al. (2004). Gain-of-function and loss-of-function phenotypes of the protein phosphatase 2C HAB1 reveal its role as a negative regulator of abscisic acid signalling. Plant J. Cell Mol. Biol. 37, 354–369. doi: 10.1046/j.1365-313x.2003.01966.x
Sai, J., Johnson, C. H. (2002). Dark-stimulated calcium ion fluxes in the chloroplast stroma and cytosol. Plant Cell 14, 1279–1291. doi: 10.1105/tpc.000653
Schneider, A., Steinberger, I., Herdean, A., Gandini, C., Eisenhut, M., Kurz, S., et al. (2016). The evolutionarily conserved protein PHOTOSYNTHESIS AFFECTED MUTANT71 is required for efficient manganese uptake at the thylakoid membrane in arabidopsis. Plant Cell 28, 892–910. doi: 10.1105/tpc.15.00812
Schwacke, R., Schneider, A., van der Graaff, E., Fischer, K., Catoni, E., Desimone, M., et al. (2003). ARAMEMNON, a novel database for Arabidopsis integral membrane proteins. Plant Physiol. 131, 16–26. doi: 10.1104/pp.011577
Seiler, C., Harshavardhan, V. T., Rajesh, K., Reddy, P. S., Strickert, M., Rolletschek, H., et al. (2011). ABA biosynthesis and degradation contributing to ABA homeostasis during barley seed development under control and terminal drought-stress conditions. J. Exp. Bot. 62, 2615–2632. doi: 10.1093/jxb/erq446
Selles, B., Michaud, C., Xiong, T. C., Leblanc, O., Ingouff, M. (2018). Arabidopsis pollen tube germination and growth depend on the mitochondrial calcium uniporter complex. New Phytol. 219, 58–65. doi: 10.1111/nph.15189
Sello, S., Moscatiello, R., Mehlmer, N., Leonardelli, M., Carraretto, L., Cortese, E., et al. (2018). Chloroplast Ca(2+) Fluxes into and across Thylakoids Revealed by Thylakoid-Targeted Aequorin Probes. Plant Physiol. 177, 38–51. doi: 10.1104/pp.18.00027
Sello, S., Perotto, J., Carraretto, L., Szabo, I., Vothknecht, U. C., Navazio, L. (2016). Dissecting stimulus-specific Ca2+ signals in amyloplasts and chloroplasts of Arabidopsis thaliana cell suspension cultures. J. Exp. Bot. 67, 3965–3974. doi: 10.1093/jxb/erw038
Široká, J., Brunoni, F., Pěnčík, A., Mik, V., Žukauskaitė, A., Strnad, M., et al. (2022). High-throughput interspecies profiling of acidic plant hormones using miniaturised sample processing. Plant Methods 18, 122. doi: 10.1186/s13007-022-00954-3
Stael, S., Wurzinger, B., Mair, A., Mehlmer, N., Vothknecht, U. C., Teige, M. (2012). Plant organellar calcium signalling: an emerging field. J. Exp. Bot. 63, 1525–1542. doi: 10.1093/jxb/err394
Stevanato, P., Broccanello, C., Moliterni, V. M. C., Mandolino, G., Barone, V., Lucini, L., et al. (2018). Innovative approaches to evaluate sugar beet responses to changes in sulfate availability. Front. Plant Sci. 9. doi: 10.3389/fpls.2018.00014
Sugliani, M., Abdelkefi, H., Ke, H., Bouveret, E., Robaglia, C., Caffarri, S., et al. (2016). An ancient bacterial signaling pathway regulates chloroplast function to influence growth and development in arabidopsis. Plant Cell 28, 661–679. doi: 10.1105/tpc.16.00045
Tanaka, Y., Sano, T., Tamaoki, M., Nakajima, N., Kondo, N., Hasezawa, S. (2006). Cytokinin and auxin inhibit abscisic acid-induced stomatal closure by enhancing ethylene production in Arabidopsis. J. Exp. Bot. 57, 2259–2266. doi: 10.1093/jxb/erj193
Teardo, E., Carraretto, L., De Bortoli, S., Costa, A., Behera, S., Wagner, R., et al. (2015). Alternative splicing-mediated targeting of the Arabidopsis GLUTAMATE RECEPTOR3.5 to mitochondria affects organelle morphology. Plant Physiology 167, 216–227. doi: 10.1104/pp.114.242602
Teardo, E., Carraretto, L., Moscatiello, R., Cortese, E., Vicario, M., Festa, M., et al. (2019). A chloroplast-localized mitochondrial calcium uniporter transduces osmotic stress in Arabidopsis. Nat. Plants 5, 581–588. doi: 10.1038/s41477-019-0434-8
Teardo, E., Formentin, E., Segalla, A., Giacometti, G. M., Marin, O., Zanetti, M., et al. (2011). Dual localization of plant glutamate receptor AtGLR3.4 to plastids and plasmamembrane. Biochim. Biophys. Acta 1807, 359–367. doi: 10.1016/j.bbabio.2010.11.008
Thelin, L., Mutwil, M., Sommarin, M., Persson, S. (2011). Diverging functions among calreticulin isoforms in higher plants. Plant Signaling Behav. 6, 905–910. doi: 10.4161/psb.6.6.15339
Thor, K., Jiang, S., Michard, E., George, J., Scherzer, S., Huang, S., et al. (2020). The calcium-permeable channel OSCA1.3 regulates plant stomatal immunity. Nature 585, 569–573. doi: 10.1038/s41586-020-2702-1
Tsou, P. L., Lee, S. Y., Allen, N. S., Winter-Sederoff, H., Robertson, D. (2012). An ER-targeted calcium-binding peptide confers salt and drought tolerance mediated by CIPK6 in Arabidopsis. Planta 235, 539–552. doi: 10.1007/s00425-011-1522-9
Tsuzuki, T., Takahashi, K., Tomiyama, M., Inoue, S., Kinoshita, T. (2013). Overexpression of the Mg-chelatase H subunit in guard cells confers drought tolerance via promotion of stomatal closure in Arabidopsis thaliana. Front. Plant Sci. 4. doi: 10.3389/fpls.2013.00440
Völkner, C., Holzner, L. J., Day, P. M., Ashok, A. D., Vries, J., Bölter, B., et al. (2021). Two plastid POLLUX ion channel-like proteins are required for stress-triggered stromal Ca2+release. Plant Physiol. 187, 2110–2125. doi: 10.1093/plphys/kiab424
Wagner, S., De Bortoli, S., Schwarzlander, M., Szabo, I. (2016). Regulation of mitochondrial calcium in plants versus animals. J. Exp. Bot. 67, 3809–3829. doi: 10.1093/jxb/erw100
Wang, C., Chen, S., Dong, Y., Ren, R., Chen, D., Chen, X. (2020). Chloroplastic Os3BGlu6 contributes significantly to cellular ABA pools and impacts drought tolerance and photosynthesis in rice. New Phytol. 226, 1042–1054. doi: 10.1111/nph.16416
Wang, L., Wang, L., Chen, Q., Chen, G., Zhang, S., Wu, J., et al. (2018). Identification and comparative analysis of the MCU gene family in pear and its functions during fruit ripening. J. Plant Physiol. 229, 53–62. doi: 10.1016/j.jplph.2018.07.001
Weinl, S., Held, K., Schlucking, K., Steinhorst, L., Kuhlgert, S., Hippler, M., et al. (2008). A plastid protein crucial for Ca2+-regulated stomatal responses. New Phytol. 179, 675–686. doi: 10.1111/j.1469-8137.2008.02492.x
Wellburn, A. R. (1994). The spectral determination of chlorophylls a and b, as well as total carotenoids, using various solvents with spectrophotometers at different resolution. J. Plant Physiol. 144.
Xu, Z. Y., Lee, K. H., Dong, T., Jeong, J. C., Jin, J. B., Kanno, Y., et al. (2012). A vacuolar β-glucosidase homolog that possesses glucose-conjugated abscisic acid hydrolyzing activity plays an important role in osmotic stress responses in Arabidopsis. Plant Cell 24, 2184–2199. doi: 10.1105/tpc.112.095935
Xu, X., Wan, W., Jiang, G., Xi, Y., Huang, H., Cai, J., et al. (2019). Nucleocytoplasmic trafficking of the arabidopsis WD40 repeat protein XIW1 regulates ABI5 stability and abscisic acid responses. Mol. Plant 12, 1598–1611. doi: 10.1016/j.molp.2019.07.001
Yuan, F., Yang, H., Xue, Y., Kong, D., Ye, R., Li, C., et al. (2014). OSCA1 mediates osmotic-stress-evoked Ca2+ increases vital for osmosensing in Arabidopsis. Nature 514, 367–371. doi: 10.1038/nature13593
Zavaliev, R., Levy, A., Gera, A., Epel, B. L. (2013). Subcellular dynamics and role of Arabidopsis β-1,3-glucanases in cell-to-cell movement of tobamoviruses. Mol. Plant-Microbe Interact. MPMI 26, 1016–1030. doi: 10.1094/mpmi-03-13-0062-r
Zhai, Y., Wen, Z., Han, Y., Zhuo, W., Wang, F., Xi, C., et al. (2020). Heterogeneous expression of plasma-membrane-localised OsOSCA1.4 complements osmotic sensing based on hyperosmolality and salt stress in Arabidopsis osca1 mutant. Cell calcium 91, 102261. doi: 10.1016/j.ceca.2020.102261
Zhang, X., Ma, C., Bao, X., Zhang, S., Zayed, O., Zhang, Z., et al. (2022). Perturbation of mitochondrial Ca2+ homeostasis activates cross-compartmental proteostatic response in Arabidopsis. BioRxiv. doi: 10.1101/2022.10.02.510489
Zhao, X., Xu, M., Wei, R., Liu, Y. (2015). Expression of osCAS (Calcium-sensing receptor) in an arabidopsis mutant increases drought tolerance. PloS One 10, e0131272. doi: 10.1371/journal.pone.0131272
Zhigang, L., Cao, Y., Zhang, J., Chen, S. (2008). Characterization of Arabidopsis calreticulin mutants in response to calcium and salinity stresses. Prog. Natural Sci. 18, 1219–1224.
Keywords: chloroplast, calcium channel, calcium sensor, drought stress, comparative proteomics
Citation: Corti F, Festa M, Stein F, Stevanato P, Siroka J, Navazio L, Vothknecht UC, Alboresi A, Novák O, Formentin E and Szabò I (2023) Comparative analysis of wild-type and chloroplast MCU-deficient plants reveals multiple consequences of chloroplast calcium handling under drought stress. Front. Plant Sci. 14:1228060. doi: 10.3389/fpls.2023.1228060
Received: 24 May 2023; Accepted: 28 July 2023;
Published: 25 August 2023.
Edited by:
Matteo Ballottari, University of Verona, ItalyReviewed by:
Markus Kuhlmann, Leibniz Institute of Plant Genetics and Crop Plant Research (IPK), GermanySibaji Kumar Sanyal, Heinrich Heine University of Düsseldorf, Germany
Copyright © 2023 Corti, Festa, Stein, Stevanato, Siroka, Navazio, Vothknecht, Alboresi, Novák, Formentin and Szabò. This is an open-access article distributed under the terms of the Creative Commons Attribution License (CC BY). The use, distribution or reproduction in other forums is permitted, provided the original author(s) and the copyright owner(s) are credited and that the original publication in this journal is cited, in accordance with accepted academic practice. No use, distribution or reproduction is permitted which does not comply with these terms.
*Correspondence: Ildikò Szabò, ildiko.szabo@unipd.it