Long-term monitoring of fish in a freshwater reservoir: Different ways of weighting complex spatial samples
 Gashaw C. Tesfaye1,2
  Allan T. Souza1
  Daniel Bartoň1
  Petr Blabolil1,3 Martin Čech1 Vladislav Draštík1 Jaroslava Frouzová1 Michaela Holubová1 Luboš Kočvara1 Tomáš Kolařík1
  Carlos Martinez1 Karlos R. Moraes1
  Milan Muška1
  Marie Prchalová1 Milan Říha1 Zuzana Sajdlová1 Kateřina Soukalová1
  Marek Šmejkal1
  Michal Tušer1
  Mojmír Vašek1 Lukáš Vejřík1
  Ivana Vejříková1 Jiří Peterka1 Tomáš Jůza1
  Jan Kubečka1*
- 1Institute of Hydrobiology, Biology Centre of CAS, Ceske Budejovice, Czechia
- 2Ethiopian Institute of Agricultural Research, National Fishery and Other Aquatic Life Research Center, Sebeta, Ethiopia
- 3Faculty of Science, University of South Bohemia, Ceske Budejovice, Czechia
Anthropogenic activities continue to pose the greatest challenges to freshwater ecosystems. Therefore, long-term monitoring is essential for the management and conservation of these resources. Monitoring programs for freshwater bodies often use a range of indicators, including biological elements such as fish. Existing European standard provides a depth-stratified gillnet sampling approach mainly in benthic habitats and at the deepest part of lakes to account for the uneven distribution of fish. However, the commonly used CEN (European Committee for Standardization) protocol does not weight sufficiently habitat volumes and underrepresent pelagic habitats to calculate whole-lake catch and biomass per unit effort (CPUE and BPUE, respectively). Extended European standard gillnet (4 larger mesh-sizes added in the geometric series) catch data collected over 18 years (2004–2021) in Římov Reservoir (Czech Republic) were used for a method comparison on indices for relative abundance and biomass of fish: CEN protocol without volume-weighting and two volume-weighted approaches. We also evaluated changes in species composition and trends in these fish population over time. Results indicated interannual changes in species composition, relative abundance, and biomass of fish community. The CEN protocol tended to put greater emphasis on benthic habitats which generally have larger CPUE and BPUE. Consequently, the two volume-weighting approaches produced lower estimates of the two parameters, with the exception of the most dominant pelagic bleak Alburnus alburnus (L.). All approaches consistently showed an increasing trend in whole-reservoir fish abundance and a decreasing trend in biomass over the study period. Following our assessment, we put forward the volume-weighting approach that considers the Volume of the depth Stratum (VOST) for weighting as the most realistic approximation of fish populations and therefore recommend its use.
Introduction
Freshwater ecosystems are one of the most productive ecosystems and support high biodiversity (Dudgeon et al., 2006; Radinger et al., 2019). They provide a wide range of important socioeconomic services, and are vital in regulating and maintaining ecosystem services. In contrast, they are under severe threat due to anthropogenic impacts (Sala et al., 2000; Dudgeon et al., 2006). Anthropogenic influences such as climate change, habitat degradation, alteration of flow patterns, pollution (nutrients and toxic chemicals), over-exploitation, and biological invasions are among the greatest threats to freshwater biodiversity (Dudgeon et al., 2006; Ritterbusch et al., 2022). Freshwater systems are recipients of pollutants and all other anomalies in the watershed and are therefore often highly vulnerable. Unfortunately, they also have limited capacity to dilute significant amounts of wastes and other pressures (Dudgeon et al., 2006). Therefore, regular monitoring and taking timely corrective actions are imperative to address these challenges and sustain their societal benefits and ecological services.
Monitoring programs for freshwater often use a range of indicators, including biological elements, such as plants, invertebrates, fish, and microbes (Davis, 1995). Fish are considered an important bioindicator of the ecological quality of freshwater systems. The importance of fish as bioindicators stems from their biological and ecological attributes. For example, as long-lived organisms, fish can map integrated environmental influences and provide consolidated insight into the state of their environment over extended periods (Harris, 1995; Alexander et al., 2015a; Plessl et al., 2017). In addition, fish play a significant role in structuring ecosystems through trophic interactions and often have a strong influence on community composition, ecological condition, and water quality (Jeppesen et al., 2000; Jakobsen et al., 2004; Alexander et al., 2015a). Furthermore, in a healthy lake and reservoir ecosystem, fish generally occupy all major habitats (i.e., littoral, benthic, and pelagic) and a wide spectrum of trophic niches (Alexander et al., 2015a). However, different fish species prefer and tolerate different physicochemical regimes, so changes in fish community composition can reflect shifting ecological state (Mehner et al., 2005; Alexander et al., 2015a).
Fish community attributes specified in the EU Water Framework Directive (WFD) to be monitored by member states and used in the assessment of freshwater systems include species composition, abundance, and age structure of fish assemblages (European Commission, 2000). In the WFD and fisheries literature, whole-lake estimates of fish catch per unit effort (CPUE) and biomass per unit effort (BPUE) are used as measures of relative fish abundance and biomass, respectively. Information on long-term trends in these fish metrics is critical for most stock assessments, and fishery scientists often use commercial catch rate data (CPUE computed from commercial catch and effort records) to estimate such trends (Hilborn and Walters, 1992; Walters, 2003). However, this widely used approach has been criticized for not fully representing the whole lake system. Walters (2003) pointed out two common mistakes made when analyzing catch rate data. He indicated that the mistakes are related to the use of CPUE at an inappropriate spatial scale: data obtained only from limited fishing grounds are extrapolated to represent the large area (the entire system), and to the fact that unfished strata are usually ignored in the construction of abundance indices—he referred to these as ‘‘folly’’ and ‘‘fantasy”, respectively. Some techniques have been proposed to address these issues (e.g., Walters, 2003; Campbell, 2004). It has been suggested that depth stratified random sampling, and the use of appropriate statistical techniques might overcome these limitations.
Accordingly, the European Committee for Standardization (CEN) requires member states to apply depth stratified sampling method mainly in benthic habitats, but also at the deepest part (locality) of the lake in pelagic habitats (for lakes with a maximum depth of >10 m) using European standard gillnets (ESG) to account for the uneven distribution of fish (CEN, 2005, 2015). However, whole-lake estimates of CPUE and BPUE derived from gillnet habitats without weighting by habitat volume (commonly referred to as the CEN protocol) may not provide a real picture of the system’s fish population because the share of different depth strata is not uniform, and sampling of pelagic habitats is not fully covered. The distribution of fish in elongated reservoirs is also heterogeneous along the longitudinal axis (Vašek et al., 2004; Prchalová et al., 2009a; Vašek et al., 2016). Therefore, simply averaging the abundance and biomass indices of the different species caught by the total number of gillnet habitats (depth strata where gillnets were set) would mean that such habitat and distribution heterogeneity would be unrealistically equally weighted.
Researchers recommended volume-weighting of CPUE and BPUE by considering the volume of habitats and depth layers (strata) addresses this problem (Mehner et al., 2005; Lauridsen et al., 2008; Kubečka et al., 2013; Alexander et al., 2015a; Blabolil et al., 2016). However, previous volume weighting studies have used stratum volume as a proportion of total reservoir volume to weight catch rates according to the CEN sampling design (protocol). This means that pelagic fish are still underrepresented because sampling was only conducted in the deepest part of the lake or reservoir - which would ultimately result in lower volume-weighted relative abundance and biomass of fish populations and communities in pelagic habitats, so whole-lake estimates do not show a realistic picture of the lake or reservoir system. This is particularly important for large lakes and reservoirs, where nutrient enrichment by inflows and subsequent gradient formation along the longitudinal axis is inevitable (Prchalová et al., 2009a).
Therefore, this study aims to (a) estimate and compare reservoir-wide relative abundance and biomass indices of fish populations and communities, derived from the established CEN protocol and two volume-weighting approaches that consider both depth strata and horizontal gradients (new approach) and depth strata only, (b) assess whether species composition in Římov Reservoir has changed over time, and (c) examine trends in these fish population and community indices over time. To this end, we used gillnet catch data collected over 18 years (2004–2021) in Římov Reservoir (Czech Republic).
Materials and methods
The study area
The study was conducted in the canyon-shaped Římov Reservoir located (48°51′0.257″ N, 14°29′27.409″E) in the České Budějovice district of the Czech Republic (Figure 1A). The reservoir primarily serves as a drinking water supply for South Bohemia, helping to maintain a minimum downstream flow and flood control, and is not open to the public (neither recreational activities nor fishing are allowed). Although the water level fluctuates annually depending on annual precipitation and subsequent inflow from the Malše River (its main tributary), the reservoir has an average surface area of about 206 ha and maximum and average depths of 42 m and 16 m, respectively. The total volume of the reservoir used for the volume-weighting assessment (29.2 million m3) refers to the volume of the reservoir at a usual water level of 469 m above sea level. It is a eutrophic and mono to dimictic reservoir with summer thermal stratification developing from April to October (Prchalová et al., 2009a).
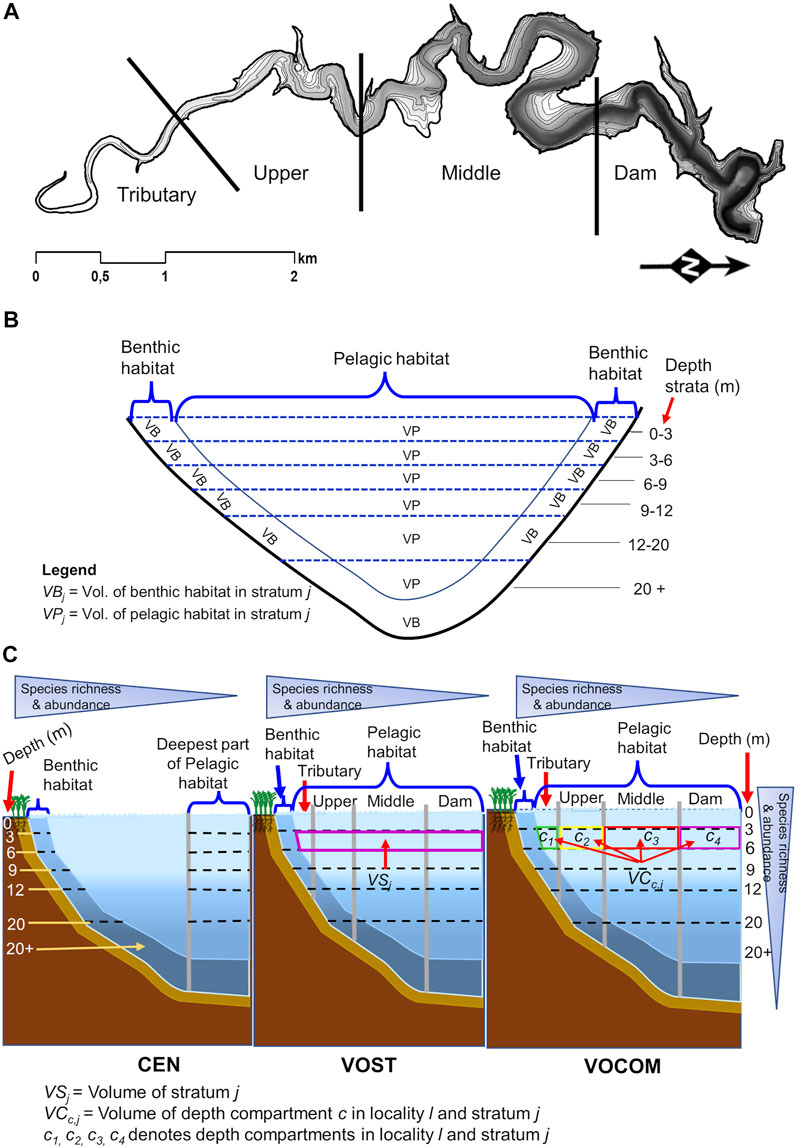
FIGURE 1. Map of Římov Reservoir with depth contours and four reservoir localities (A), schematic representation of habitat definitions on the reservoir transversal cross-section with depth strata for middle and dam localities as an example (B), and schematic representation of habitats on the reservoir cross-section with depth strata and gillnet settings of the three methods (CEN, VOST and VOCOM) (C). The color depth of the gray shading in panel A indicates the depth of the reservoir, and the contour lines refer to the investigated depth strata starting from 0 to 3 m. The number of depth strata decreases from the dam (the deepest point) to the tributary. CEN refers to the European Committee for Standardization protocol, VOST is a method that weights catch rates using the volume of the depth stratum relative to the volume of the reservoir, while VOCOM is a method that weights catch rates using the volume of the depth compartment in each locality and stratum relative to the volume of the reservoir.
The reservoir harbors more than 40 freshwater fish species belonging to 15 families (Table 1), including Acipenseridae, Anguillidae, Centrarchidae, Cottidae, Cyprindae, Esocidae, Gobionidae, Leuciscidae, Nemacheilidae, Percidae, Petromyzontidae, Salmonidae, Siluridae, Tincidae, and Xenocyprididae (Hladík et al., 2008; Prchalová et al., 2009b; Šmejkal et al., 2015; Blabolil et al., 2021). As shown in Table 1, about a quarter of the species are non-native species (Musil et al., 2010). Stock enhancement of predatory fish such as asp Leuciscus aspius L., pikeperch Sander lucioperca L., pike Esox lucius L., and wels catfish Silurus glanis L., as well as removal of planktivorous leuciscids such as freshwater bream Abramis brama L., roach Rutilus rutilus L., and bleak Alburnus alburnus L., are regular biomanipulation measures to control phytoplankton biomass and thus improve water quality (Jůza et al., 2022). The authors reported that the removal of planktivorous fish has been about 1–2 kg/ha of fish per year, and the rate has increased since 2020 with a new biomanipulation project. According to Vašek et al. (2013), the annual stocking rate of predatory fish in Římov Reservoir from 2004 to 2008 was 0.2 kg ha−1 one-summer old fish and about 86 ind. ha−1 advanced fry.
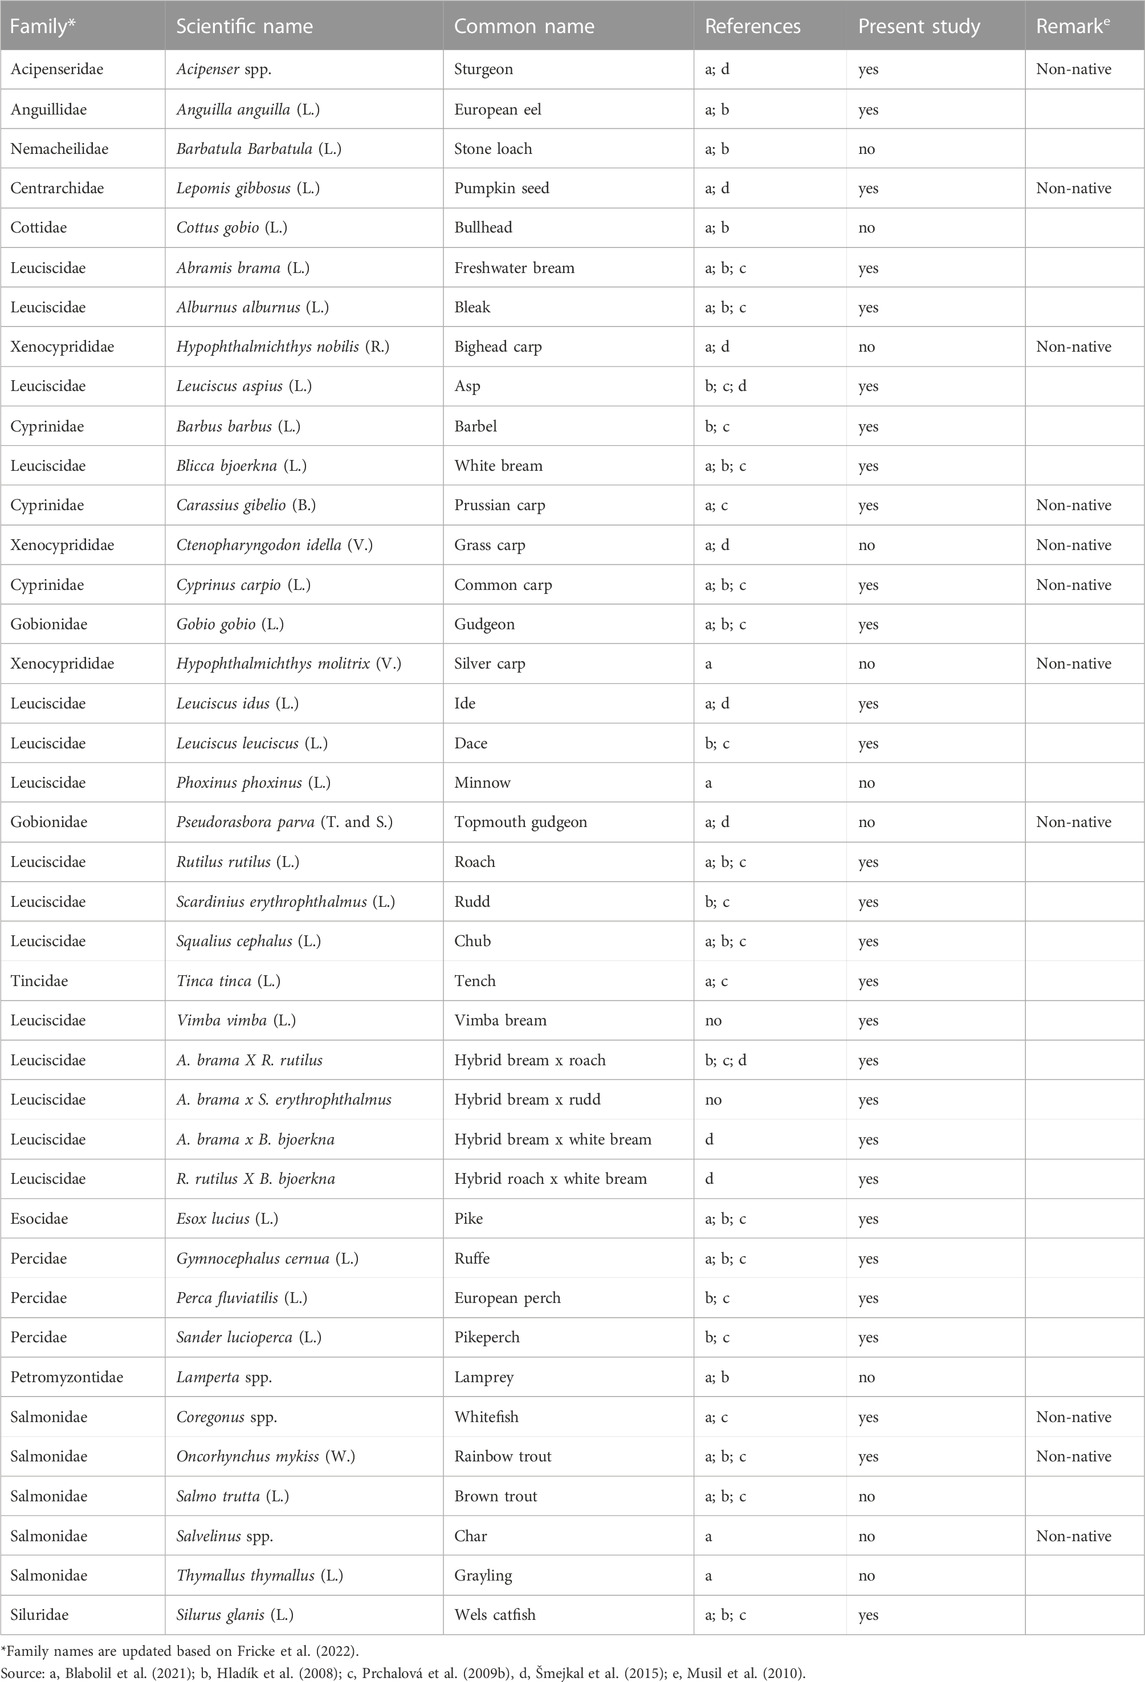
TABLE 1. List of fish species and their hybrids known to occur and caught during the sampling period (2004–2021) in Římov Reservoir (Czech Republic). Species caught, and not caught with the modified ESG or unreported before indicated with “yes” and “no”, respectively.
Gillnet setting and data collection
The reservoir was divided along its longitudinal axis into four main localities (tributary, upper, middle and dam) to cover the fish distribution following the longitudinal gradients (Figure 1A). These localities were further divided into benthic and pelagic habitats. In each habitat, multiple depth strata (layers) were considered to cover fish distribution along the vertical gradient (water column), and hence, depth-stratified random sampling was conducted in these compartments. Depth ranges generally included 0–3, 3–6, 6–9, 9–12, 12–20 and >20 m for both benthic and pelagic habitats (Figures 1B, C). Deeper layers >6 m of stratified eutrophic reservoir contain little or no fish in summer (Vašek et al., 2004, 2016; Prchalová et al., 2009a). Following the recommendations of Blabolil et al. (2017), we reduced the netting effort and strata resolution in deeper layers by using greater depth intervals (12-20, 20 + m) to reduce the sampling effort. It was also found that samplings in deeper layers of many natural and artificial lakes were not informative in terms of relative abundance, and therefore a reduction of sampling effort in deeper layers was proposed (Deceliere-Vergès et al., 2009).
Fish were sampled annually in each stratum and locality during the summer (end of July–August) for 18 years (2004–2021) using modified ESG, which included 12 ESG meshes and an additional four large mesh size gillnets, because standard CEN gillnets capture fish well only up to a standard length of 300 mm (Šmejkal et al., 2015). As many fish in the Římov Reservoir are larger than this threshold, we included data from large mesh nets to ensure that the results cover the entire fish community. The mesh sizes of the ESG follow a geometric series with a ratio of approximately 1.25 (5, 6.25, 8, 10, 12.5, 15.5, 19.5, 24, 29, 35, 43, and 55 mm); each panel is 1.5 m height × 2.5 m length for benthic nets and 3 m × 2.5 m for pelagic nets, and a total panel length of 30 m (both types). The four large mesh nets roughly follow the mean geometric series of the ESG and include mesh sizes of 70, 90, 110, and 135 mm: each panel is 1.5 m height × 10 m length for benthic nets and 3 m × 10 m for pelagic nets, and a total length of 40 m. The large mesh nets (≥70 mm) had four times higher effort (net area) than the CEN standard nets (<70 mm) to catch sufficient numbers of larger fish. Therefore, the catches and net areas of the large mesh gillnets were divided by four to standardize the length of each panel to 2.5 m for all meshes. When all 16 meshes were the same length (2.5 m), catch data was standardized to 1,000 m2 of net area.
Three gillnets were set parallel to the shore at each locality, depth stratum and habitat (Table 2). All gillnets were deployed 2 hours before dusk and hauled in 2 hours after dawn. All fish caught were then sorted by species, counted, a representative sample of common species and the entire catch weighed to the nearest 0.1 g. Only fish older than young-of-the-year (0+) were considered for this study (scale and otolith reading). Catch data were expressed as catch per unit effort (CPUE), measured as the number of fish caught per 1,000 m2 of gillnet area, and biomass per unit effort (BPUE) when catch was expressed in kilograms of fish per 1,000 m2 of gillnet area. The same approach was used to estimate whole-lake CPUE and BPUE. Therefore, for simplicity and to avoid unnecessary repetition, we have used a collective term “value per unit effort” (VPUE) for both CPUE and BPUE in the following formulas and discussion.
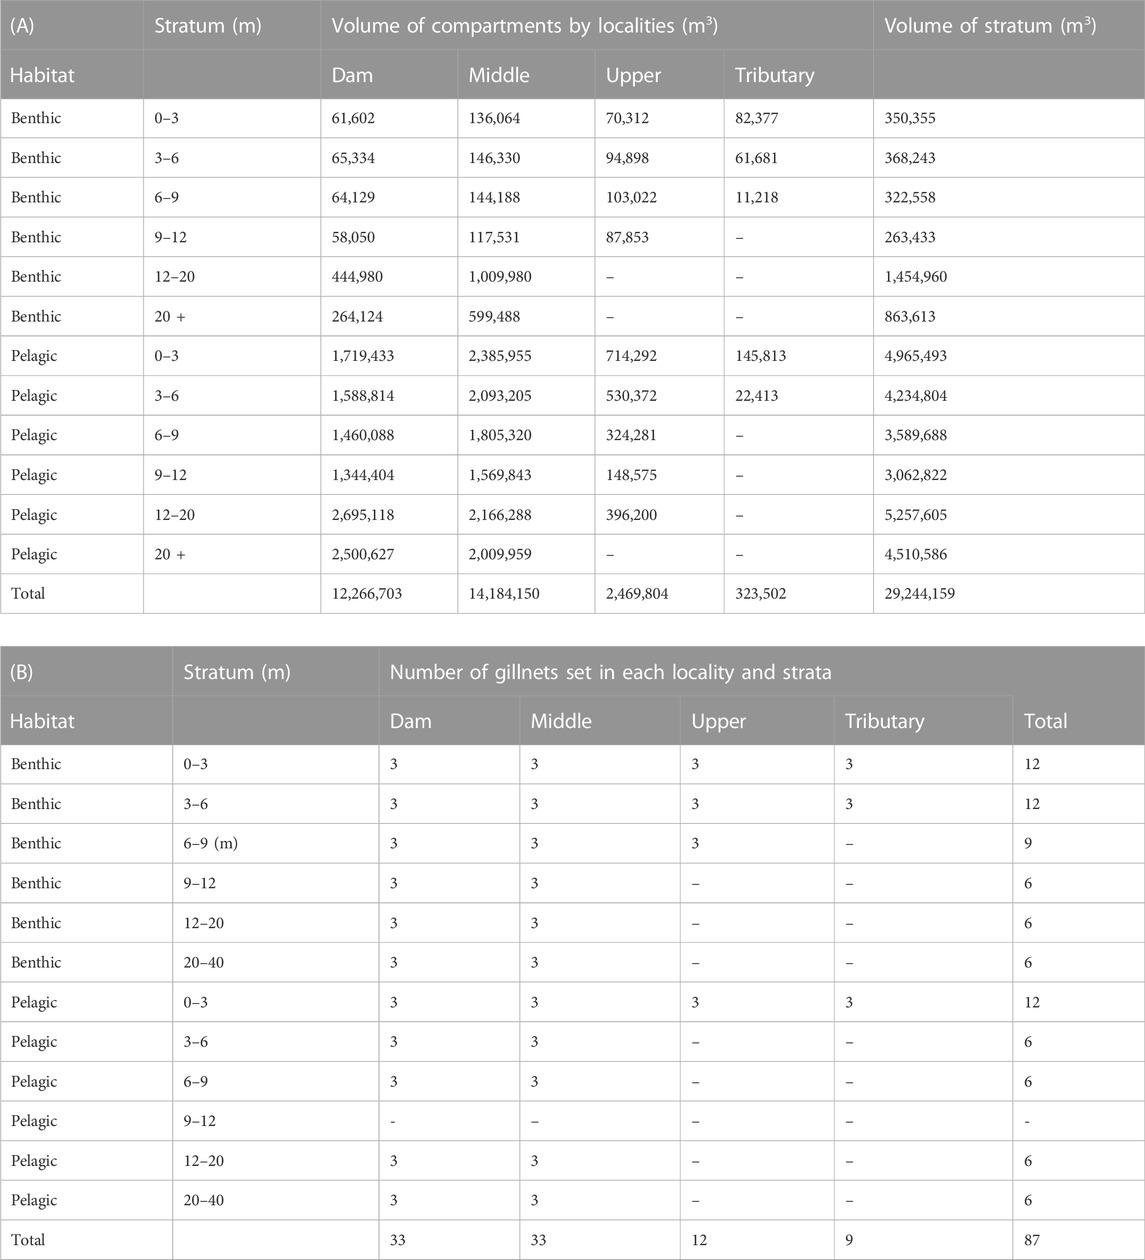
TABLE 2. Volume of depth strata and compartments (A), and the number of gillnets set (B) in different habitats and localities of the Římov Reservoir at 469 m above sea level–the common surface water level.
Volume estimation
The volume of the depth stratified compartment (denoted VC, in m3) was calculated from the surface area (m2) calculated in ArcMAP v10.6.1 (ESRI Inc., CA, United States) based on the depth contours of the bathymetric map (Figure 1A) generated before the reservoir was flooded, and the depth of the stratum (in m). The same depth strata (0–3, 3–6, 6–9, 9–12, 12–20 and >20 m) and localities (tributary, upper, middle and dam) were used during installation of gillnets. The depth of the stratum is the difference between the depth boundaries of two successive strata. Benthic volume was consistent with the results of Moraes et al. (2021) and was defined as the layer 1.5 m above the bottom within each stratum. All remaining volume in each depth stratum was considered pelagic. Then the volume of a stratum (VS., in m3) was calculated by summing up compartment volumes for the benthic and pelagic habitats separately (Table 2). For example, the volume of a given depth stratum j in the pelagic habitat, VPj (Figure 1C) was calculated as:
Where, VCjDam is the volume of the pelagic habitat of the dam locality of stratum j, VCj Mid is the same for the middle locality of stratum j, VCj Upp analogically for the upper locality of stratum j, and VCj Trib for tributary locality of stratum j. The same approach applied to calculate the volume of benthic habitat strata, VBj. The sum of the volumes of all strata in both pelagic and benthic habitat gives the total volume of the reservoir (Table 2).
Data analysis
Species composition
Temporal variation on fish species composition in the reservoir was examined by assessing the changes on percentage composition of dominant species over the sampling period. A literature review was also conducted to explore whether all known species in the system (Table 1) were sufficiently sampled with gillnets or not, and to find out if species were absent or introduced during the last 2 decades.
CEN and volume-weighted whole reservoir relative abundance and biomass
We compared the VPUEs derived from CEN protocol and two volume weighting approaches that considered the reservoir water volume of strata and compartments. Before beginning to determine VPUEs for the entire lake (reservoir) using all approaches, the mean VPUEs of the three nets deployed at each locality and depth stratum were calculated for each habitat. These VPUEs were then used as a baseline for all subsequent analyses.
a) CEN protocol
The whole-lake or reservoir CEN_VPUEi for species i was calculated as follows:
where, the first summation refers to the sum of the unweighted VPUEs for species i in locality l and stratum j, but only for benthic habitat b, while the second summation refers to the sum of the unweighted VPUEs for species i in stratum j, but only for pelagic habitat p of the dam (Figures 1B, C); the denominator “Gtotal” denote the total number of benthic gillnet sampling points plus the number of pelagic gillnets in the deepest locality (dam) of the reservoir.
The whole-reservoir unweighted VPUEs for the total fish community (CEN_VPUE) were then calculated as:
b) VOST approach
This method used the Volume of the depth Stratum (hereinafter VOST) as a proportion of the volume of the reservoir for weighting (Figure 1C). This volume-weighting approach accounts for the heterogeneous fish distribution in the different water column layers (Lauridsen et al., 2008; CEN, 2015). Using the VOST approach, the whole-reservoir VPUE for species i (VOST_VPUEi) was calculated following the next steps:
The first step is to calculate the mean VPUE of each species i in depth stratum j and habitat h using the following equation:
Where,
The mean VPUEs obtained using Eq. 4 were then multiplied by the volume of depth stratum j in each habitat h as:
Where,
The whole-reservoir VPUE for species i (VOST_VPUEi) was then calculated by summing the results obtained in Eq. 5 for each species in all strata and habitats, and dividing by the total volume of the reservoir (Vtotal) as follows:
Then, the annual whole-reservoir VPUEs for the total fish stock (VOST_VPUE) were calculated as:
c) VOCOM approach
On the other hand, VOCOM - the new volume-weighting approach, accounts for the uneven fish distribution along the longitudinal gradient (reservoir localities), as well as the vertical (water column) gradients (Figure 1C; Table 2). Therefore, this weighting approach used the Volume of the depth Compartment (hereinafter VOCOM) in each locality and stratum as a proportion of the volume of the reservoir for weighting. Thus, the whole-reservoir VPUE for species i was calculated following the next steps:
First, the VPUE of species i in each locality l at the depth compartment c of the stratum j was multiplied by the volume of the depth compartment in each habitat h (Figure 1C; Table 2) as:
Where,
The whole-reservoir VPUE for species i (VOCOM_VPUEi) was then calculated by summing the results obtained in Eq. 8 for each species in all depth compartments of strata and habitats and dividing by the total volume of the reservoir (Vtotal) as:
Then, the whole-reservoir VPUEs for the total fish community (VOCOM_VPUE) were calculated as:
Statistical analysis
The relative fish abundance and biomass for the whole community and the dominant species were compared using Analysis of covariance (ANCOVA). The ANCOVA was performed separately for each species and for CPUE and BPUE. The estimated weighted and unweighted CPUE and BPUE for each species and the whole community were used as dependent variables, method (CEN, VOST and VOCOM) as grouping or categorical variable (factor) and year as numeric variable (covariate). ANCOVA is a linear model similar to Analysis of variance (ANOVA), but unlike ANOVA, it includes at least one continuous variable, i.e., a covariate. Covariates represent sources of variation that are assumed to affect the dependent variable (response variable) but for which no control was conducted during the study procedures. Thus, including the covariate in the ANCOVA helps to control for the effects of the covariate on the response variable by making linear adjustments to the estimated group means. However, if this variable is not included in the analysis, it would be difficult to assess the true relationship between the factor and the response variable. In our case, we are interested in evaluating the differences between the outputs of the three methods (CEN, VOST and VOCOM) and thus year was included as a covariate so that its influence on the response variable could be accounted for in the model.
The interaction between the categorical and numeric variables was tested to cope with the ANCOVA assumptions of no interaction between these variables. Because their interaction was not significant for almost all groups, the final models were fitted without the interaction between the method (CEN, VOST, VOCOM) and the year. Models were fitted using the stats package (R Core Team, 2022). Model premises (e.g., linearity, heteroscedasticity and normality of residuals) and fits were evaluated using the performance package (Lüdecke et al., 2021). The means and slopes of the models were extracted using the modelbased package (Makowski et al., 2020). All VPUEs except for bleak were transformed (square root or log-transformed) to cope with the model premises as needed. For bleak, raw data were consistent with model premises and therefore were not transformed. Tukey post hoc test was then conducted to determine which method resulted in different estimates. Since the interaction between method and year was significant for roach CPUE, its marginal means were computed using the function estimate_means from the modelbased package. R software, v. 4.2.2 (R Core Team, 2022) was used to process the data and perform the statistical analysis. The figures were created using the ggplot2 package (Wickham, 2016).
Results
Fish species composition
During the 18-year sampling period, 34,714 specimens of 29 fish species and their hybrids from 11 families were captured, including Acipenseridae, Anguillidae, Centrarchidae, Cyprindae, Esocidae, Gobionidae, Leuciscidae, Percidae, Salmonidae, Siluridae, and Tincidae. Leuciscids were by far the most diverse in terms of species richness (10 species and four hybrids, 48.3% of the total number of species caught), followed by cyprinids (three species, 10.3%) and percids (three species, 10.3%). The other families were represented by only one or two species (Table 1). Of the 29 species and their hybrids, 27 had been reported in previous studies (Table 1). However, about 11 species known to occur in the Římov Reservoir catchment have not been caught once with gillnets (ESG and large-mesh nets) since 2004. The species that were not caught belong to the families Nemacheilidae (stone loach Barbatula barbatula L.), Cottidae (bullhead Cottus gobio L.), Xenocyprididae (bighead carp Hypophthalmichthys nobilis R., sliver carp Hypophthalmichthys molitrix V., and grass carp Ctenopharyngodon Idella V.), Leuciscidae (minnow Phoxinus phoxinus L.), Gobionidae (Topmouth gudgeon), and Salmonidae (brown trout Salmo trutta L., char Salvelinus spp. and grayling Thymallus thymallus L.) (Table 1). However, we caught two leuciscids that have not been previously reported, including the vimba bream Vimba vimba L. (caught only in 2021) and hybrid bream A. brama x rudd Scardinius erythrophthalmus L. (caught in 2009 and 2017).
Of the species caught, about half were not regularly caught during the annual sampling campaign. Overall, only 12 to 17 species and hybrids (15 species on average) were caught annually, with the lowest and highest numbers of species and hybrids caught in 2007 and 2019, respectively (Supplementary Table S1), indicating interannual variation in species composition and abundance. Species such as European eel Anguilla anguilla L., Siberian sturgeon Acipenser baerii B., pumpkinseed, rainbow trout Oncorhynchus mykiss W., whitefish Coregonus spp., barbel Barbus barbus L., Prussian carp, gudgeon Gobio gobio L., ide Leucisus idus L., dace Leucisus leuciscus L., chub Squalius cephalus L., tench Tinca tinca L., vimba bream and three leuciscid hybrids (bream x rudd, bream x white bream Blicca bjoerkna L., and roach x white bream) were not only caught less frequently, but their catch rates were also very low, so they were excluded from further analysis of relative abundance and biomass of dominant species (however they are still included in the total community results). In addition, although pike and rudd were frequently caught during the sampling period, they were not included in the subsequent analysis of relative abundance and biomass because they were less represented in the gillnet catches. Therefore, our analysis focused primarily on the remaining 10 important species and one hybrid, which accounted for 99.4% of the total fish sampled. These included bleak with a total catch of 14,774 (42.6%), roach 7,766 (22.4%), ruffe Gymnocephalus cernua L. 4,469 (12.9%), bream 3,750 (10.8%), perch Perca fluviatilis L.1,746 (5.0%), white bream 586 (1.7%), asp 578 (1.7%), pikeperch 362 (1.0%), hybrid bream x roach 307 (0.9%), common carp Cyprinus carpio L.110 (0.3%), and wels catfish 39 (0.1%).
Relative abundance and biomass
The different methods used to estimate CPUEs (Figure 2) and BPUEs (Figure 3) for the whole-reservoir yielded different VPUEs (Supplementary Table S2). In general, except for a few years, the CPUEs and BPUEs derived from CEN was bigger than VOST, which was bigger than VOCOM. However, CPUEs in 2009, 2012, 2013 and 2020, as well as BPUEs in 2009, were higher for VOCOM than for VOST, while CEN always generated higher VPUEs than either volume-weighting approach except for BPUEs in 2004 (Figure 3 Total). Comparing the estimated VPUEs of CEN with VOST VPUEs, the former provided on average of 47% (16%–76%) higher CPUEs and 46% (34%–63%) higher BPUEs. Similarly, the difference between estimates of CEN and VOCOM VPUEs increased by an average of 52% (35%–75%) for CPUEs and by 54% (34%–78%) for BPUEs. In contrast, the difference between the estimates of the two volume-weighting methods was an average of only 11% (−16%–41%) for the CPUEs and only 16% (−11%–44%) for the BPUEs. The negative values here indicate that VOCOM estimates were higher than VOST VPUEs, as noted above for some years.
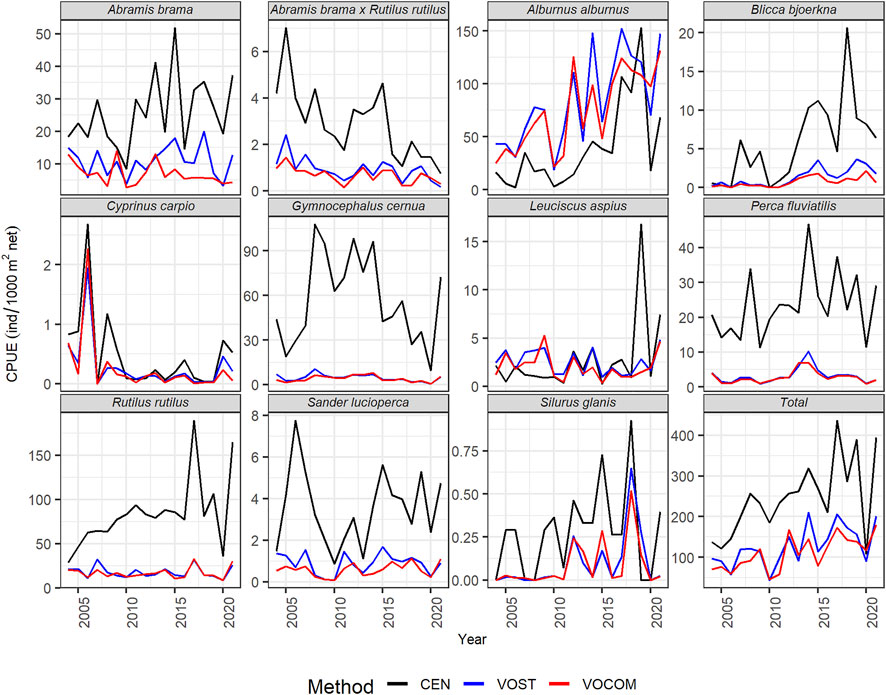
FIGURE 2. Estimated time-series whole-reservoir CPUE of the dominant fish species and the whole fish community (total) in the Římov Reservoir derived from CEN, VOST, and VOCOM approaches.
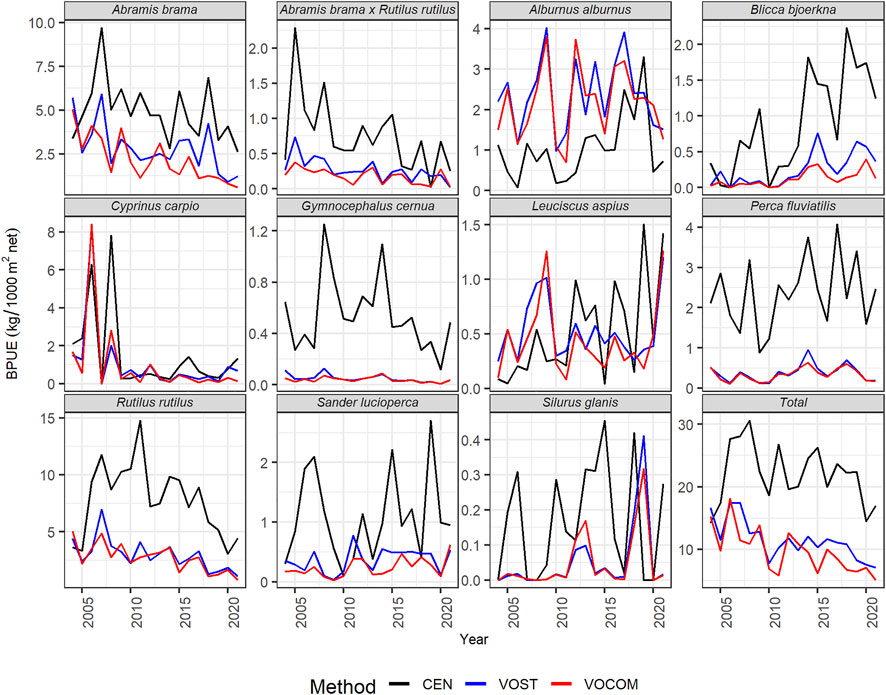
FIGURE 3. Estimated time-series whole-reservoir BPUEs of the dominant fish species and the whole fish community (total) in the Římov Reservoir derived from CEN, VOST, and VOCOM approaches.
Looking at the estimates by species, five most abundant species such as roach, ruffe, bleak, bream, and perch contributed an average of 93% (87%–97%) of the CEN CPUEs (Figure 4; Table 3), and 77% (68%–90%) of the BPUEs of the whole reservoir (Figure 4; Table 3). Of these species, roach and ruffe alone contributed a third and a quarter of the total CEN CPUE, respectively, while roach and bream accounted for the same proportion of the total CEN BPUEs. However, the contribution of bleak was only limited to about 14% and 5% for the total CEN CPUEs, and BPUEs, respectively. Moreover, predatory fish (asp, perch, pike, pikeperch, and wels catfish) accounted for 13% (6%–18%), and 21% (10%–36%) of the CEN relative abundance and biomass, respectively (Table 3). The CEN approach showed that perch was the most important predator species in the reservoir, accounting for about 10% of the total relative fish abundance and biomass, and more than three-quarters of the abundance and half of the biomass of the predatory fish (Tables 3).
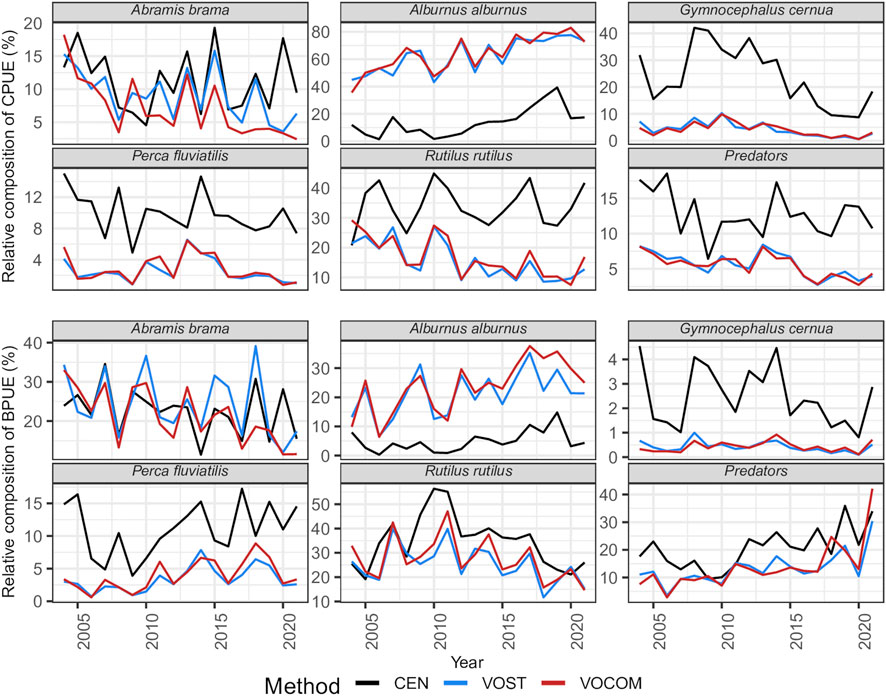
FIGURE 4. Relative composition of five predominant fish species and predators to the estimated total VPUEs of the time series obtained by three approaches (CEN, VOST and VOCOM) in Římov Reservoir.
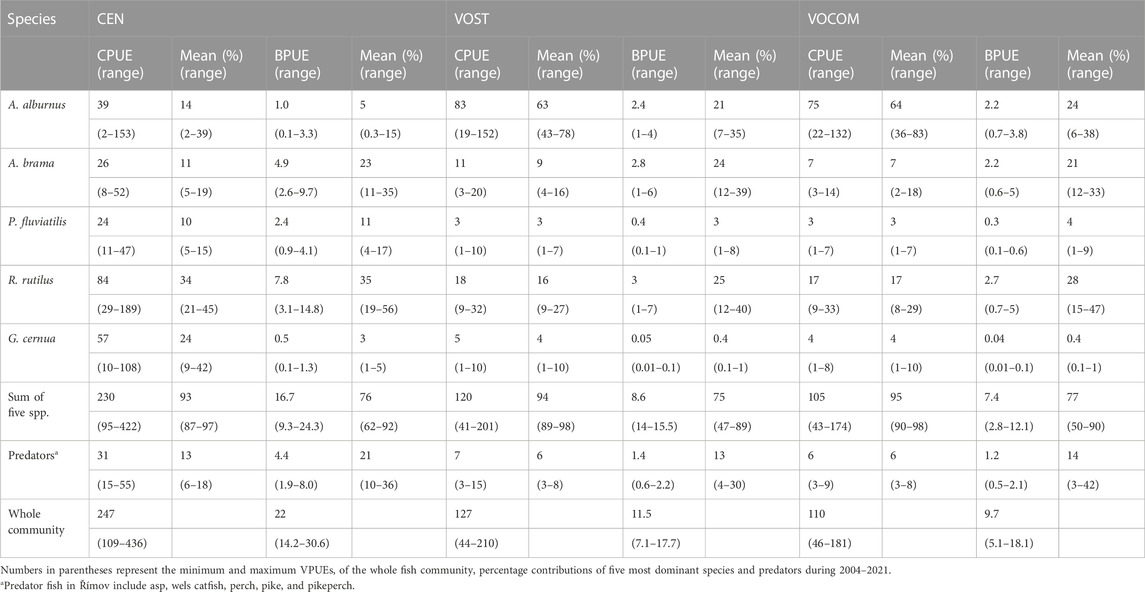
TABLE 3. Average whole-reservoir CPUEs (ind./1,000 m2 net) and BPUE (kg/1,000 m2 net) from the gillnet catch and percentage contribution of five most dominant species and predators in Římov Reservoir (Czech Republic) obtained using the three different weighting methods.
The contribution of roach, ruffe, bleak, bream, and perch taken together reached to an average of 95% (89%–98%) of the VOST CPUEs, and 75% (47%–89%) of BPUEs of the whole reservoir (Figure 4; Table 3), suggesting that other species also made valuable contributions to VOST BPUEs. For example, common carp and asp contributed to 8% (ranging from <1% to 48%) and 5% (ranging from 1% to 17% of the total VOST BPUEs), respectively, although their contribution to total VOST CPUEs was not substantial. Unlike the CEN approach, bleak alone contributed to an average of 63% (43%–78%) of the total VOST CPUEs, followed by roach at 16% (9%–27%), while bleak, bream, and roach accounted for 21% (7–35%), 24% (12–39%), and 25% (12–40%) of the total VOST BPUEs, respectively (Table 3). Furthermore, in contrast to the CEN approach, the five predatory fishes accounted for only 6% (3%–8%), and 13% (4%–30%) of VOST relative abundance and biomass, respectively (Table 3). In contrast to the CEN approach, perch contributed only about 45% of the predator abundance and a quarter of the estimated biomass of VOST.
Similarly, the contribution of roach, ruffe, bleak, bream, and perch reached to an average of 95% (91%–98%) of the VOCOM CPUEs, and 77% (49%–90%) of BPUEs of the whole reservoir (Figure 4; Table 3). In addition, common carp and asp contributed an average of 8% and 5%, respectively, to total VOST BPUEs, although their contribution to total VOCOM CPUEs was still low. Like VOST approach, bleak alone contributed to an average of 64% (36%–83%) of the total VOCOM CPUEs, followed by roach at 17% (8%–29%), while bleak, bream, and roach accounted for 24% (6%–38%), 21% (12%–33%), and 28% (15%–47%) of the total VOCOM BPUEs, respectively (Figure 4; Table 3). Moreover, the five predatory fishes accounted for only 6% (3%–8%), and 14% (3%–42%) of VOCOM relative abundance and biomass, respectively (Table 3). Perch alone contributed about 50% of the predator abundance and nearly a third of the estimated biomass (31%) of VOCOM. Worth noting is the contribution of ruffe (the smallest fish in the system), which accounted for an average of 24% of the total CEN CPUE reduced to only 5% of the total VOST CPUE and to 4% of the total VOCOM CPUE (Table 3).
Statistical evaluation of estimates from the three methods
Looking at the temporal trends in VPUEs, it is generally apparent that abundance of the total fish community showed an increasing trend through time (Figures 2, 5, total), while biomass showed a decreasing trend regardless of the methods used (Figures 3, 6, total). Interannual changes in VPUE varied by species and slightly by methods (Figures 2, 3).
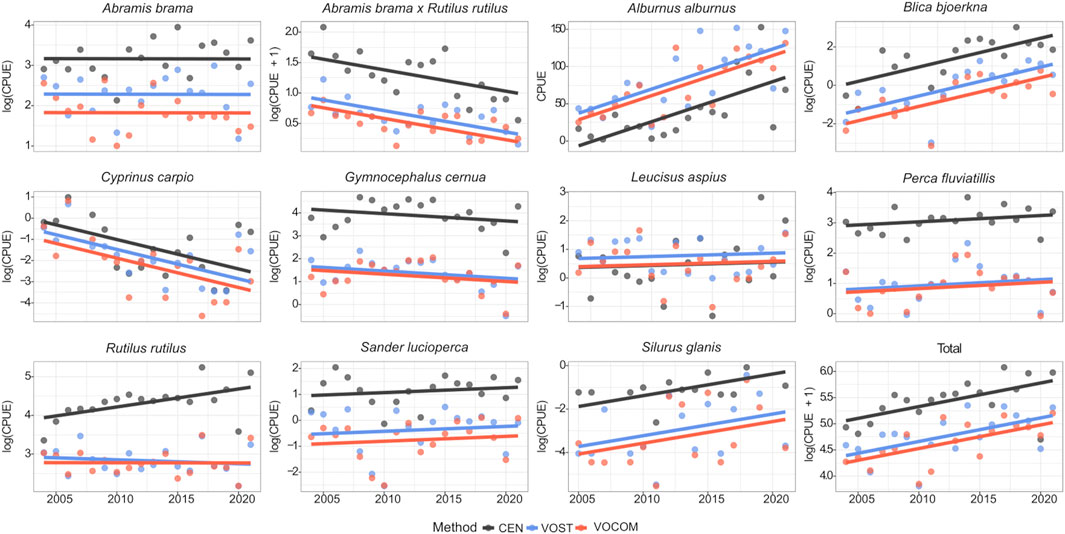
FIGURE 5. Temporal trends of CPUEs based on the ANCOVA model fits of transformed data determined by the three methods (CEN, VOST and VOCOM) for the dominant fish species and the whole fish community in the Římov Reservoir (Czech Republic).
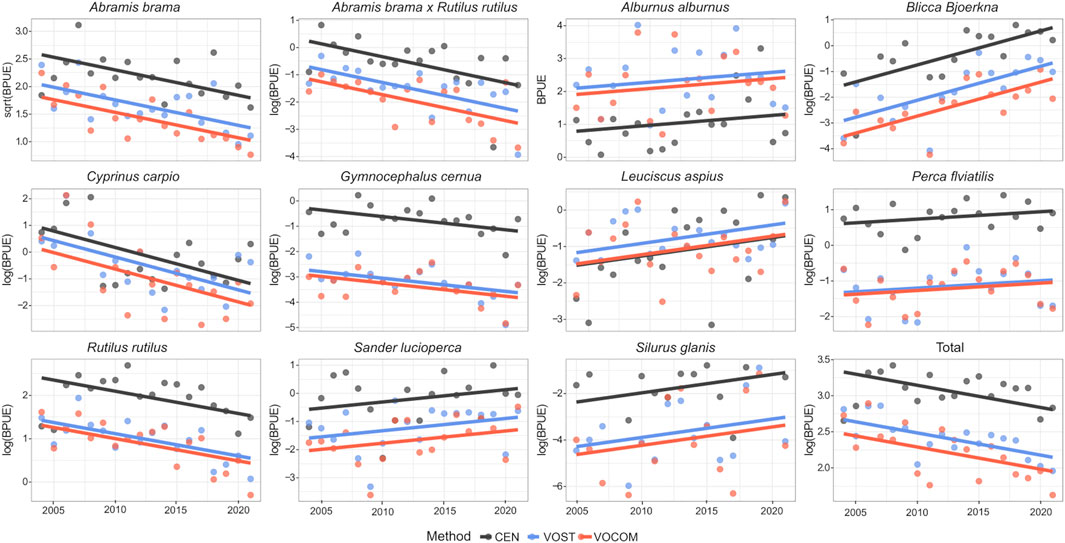
FIGURE 6. Temporal trends of BPUEs based on ANCOVA model fits of transformed data determined by the three methods (CEN, VOST and VOCOM) for the dominant fish species and the whole fish community in the Římov Reservoir (Czech Republic).
However, the ANCOVA model with the interaction term (method: year) were found to be non-significant (p > 0.05) for the whole community and all species except roach CPUE, which showed marginal significance (p = 0.046; Tables 4, 5). The significant interaction between method and year for roach CPUE indicates that there were different responses between methods and that trends over time (i.e., slopes) were statistically different for the different methods (Figure 5). On the other hand, the lack of a significant interaction between method and year implies that although VPUEs from CEN were higher than VOST and VOCOM VPUEs for all species except bleak and asp (Figures 5, 6), VPUEs from all three methods decreased or increased at more or less similar extent during the study period. Therefore, the interaction term was not included in our further analysis.
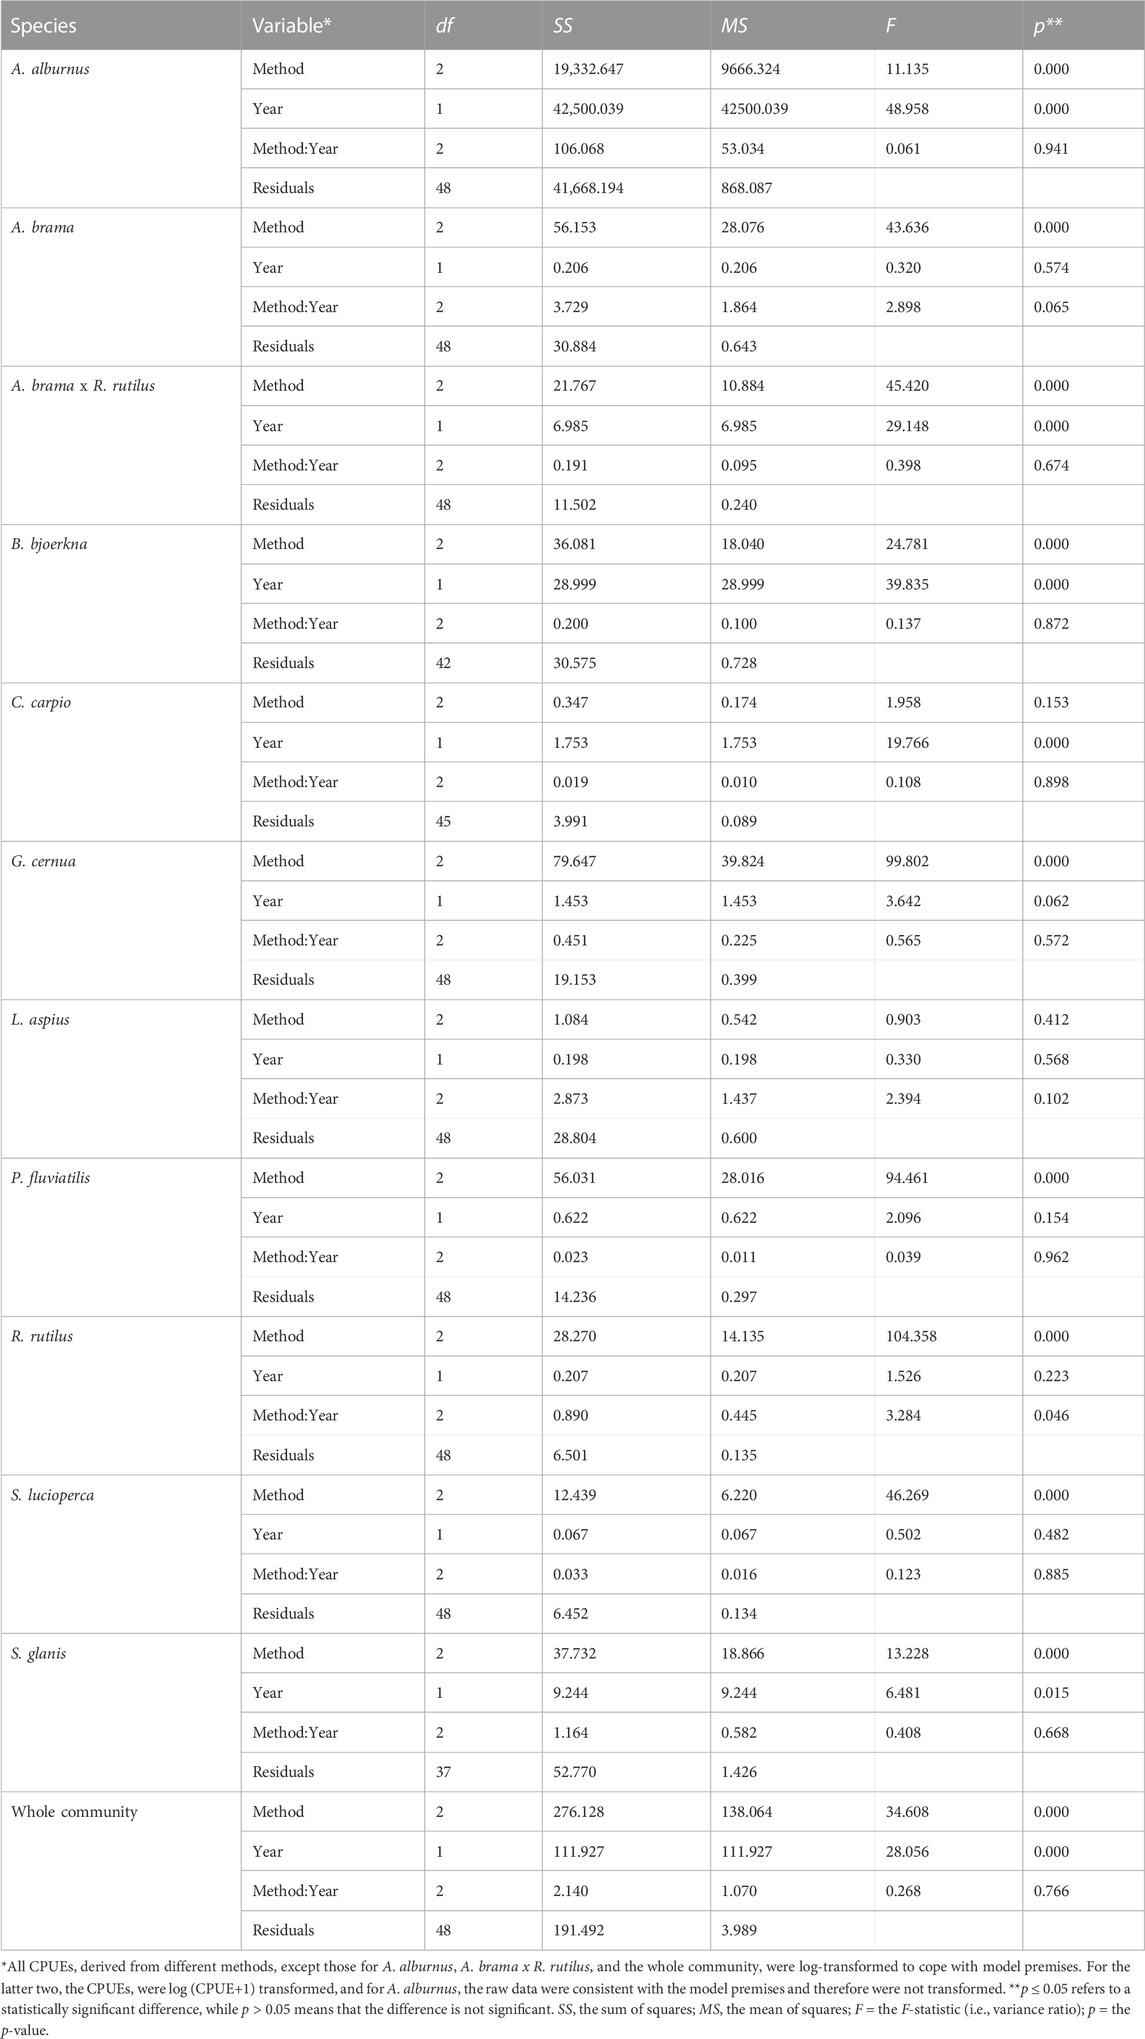
TABLE 4. ANCOVA results of the interaction test for CPUEs of the dominant species and the whole community sampled from 2004 to 2021 in Římov Reservoir, Czech Republic.
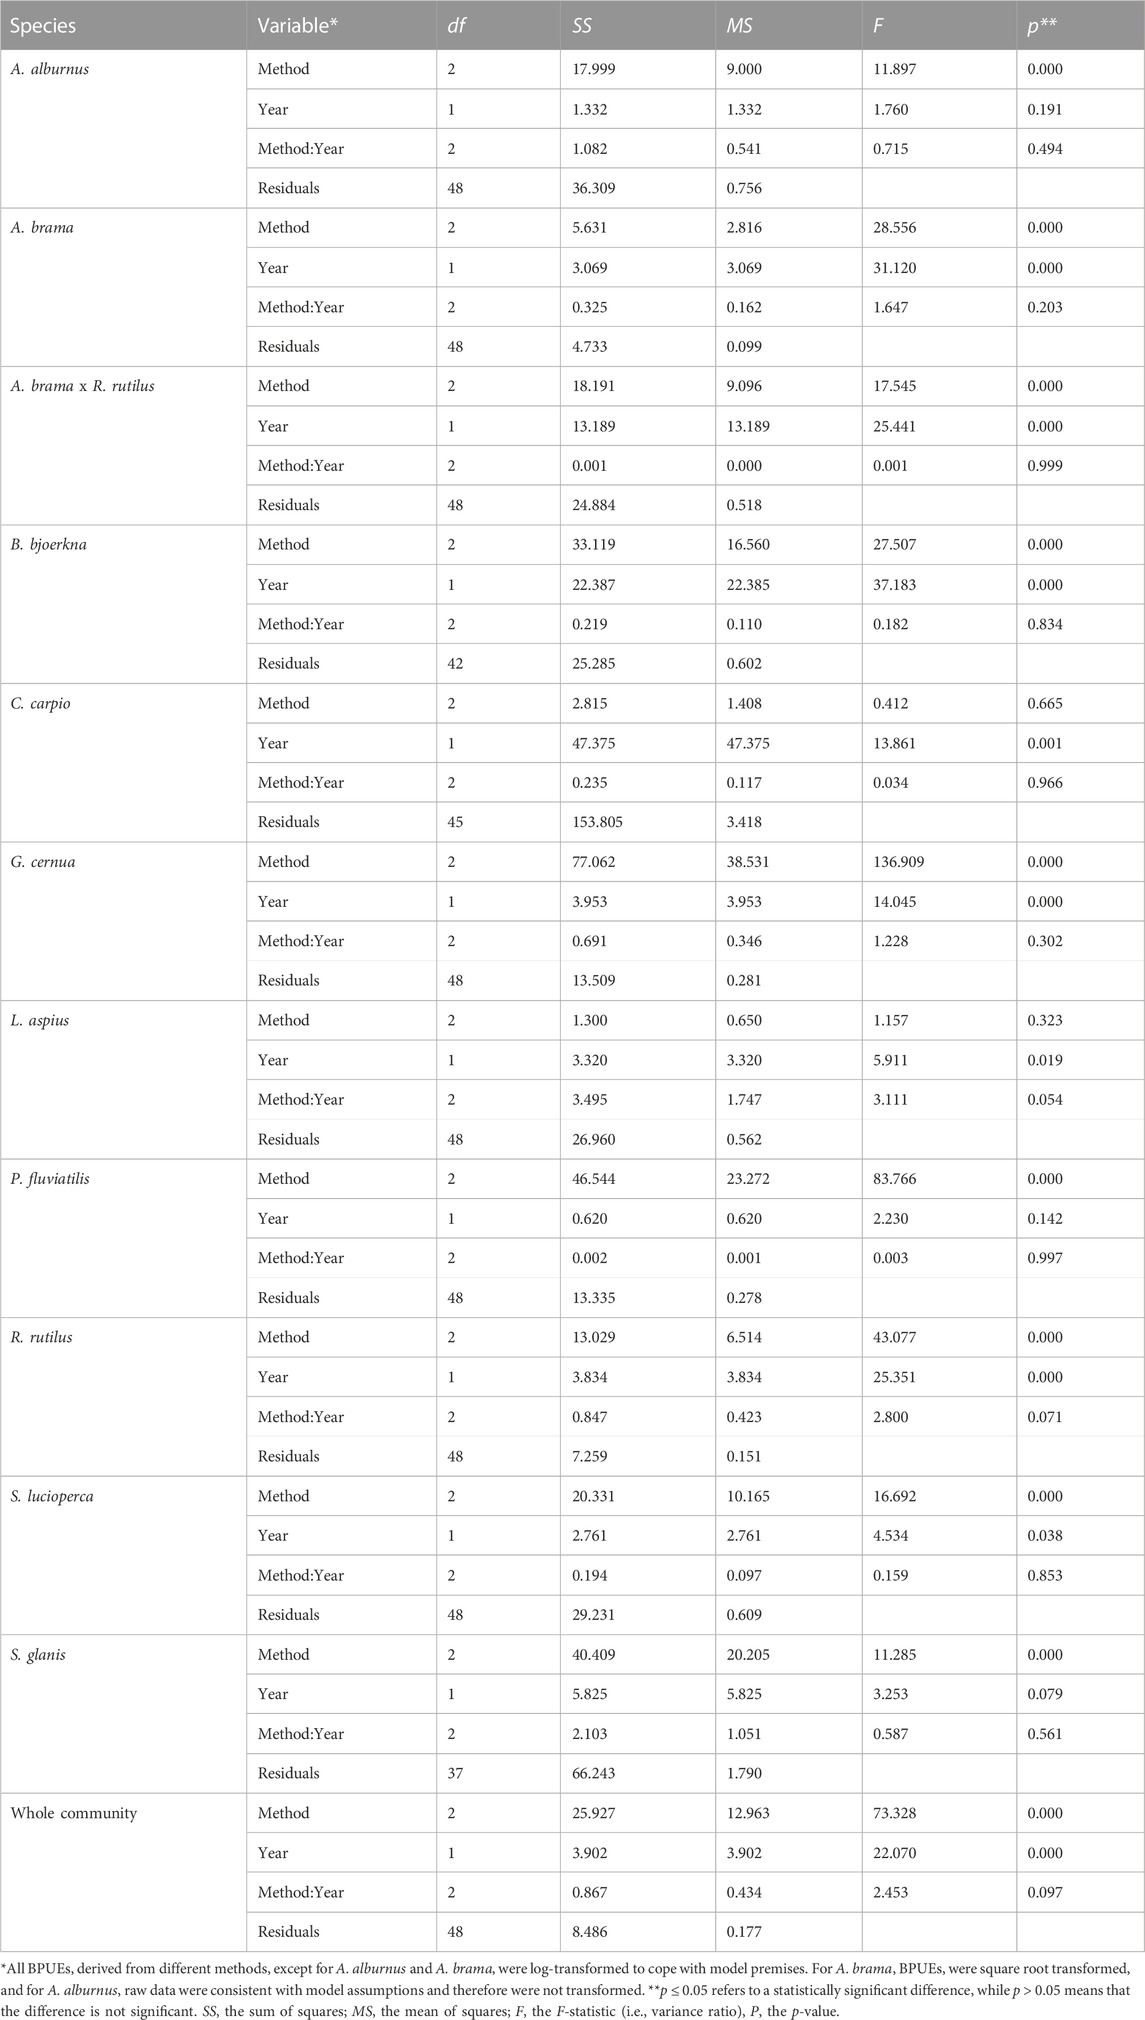
TABLE 5. ANCOVA results of the interaction test for BPUEs of the dominant species and the whole community sampled from 2004 to 2021 in Římov Reservoir, Czech Republic.
Species that exhibited significant changes (p < 0.05) in CPUE over time with our final ANCOVA model (without interaction term) include: bleak, hybrid bream x roach, white bream, common carp and wels catfish, while about half of the species studied, such as bream, ruffe, asp, perch and pikeperch did not show significant changes (p > 0.05) over time (Table 6). In contrast, all dominant species except bleak, perch, and wels catfish showed significant changes in BPUE (p < 0.05) during the study period (Table 6). The analysis also showed that estimated VPUEs changed over time for the whole community.
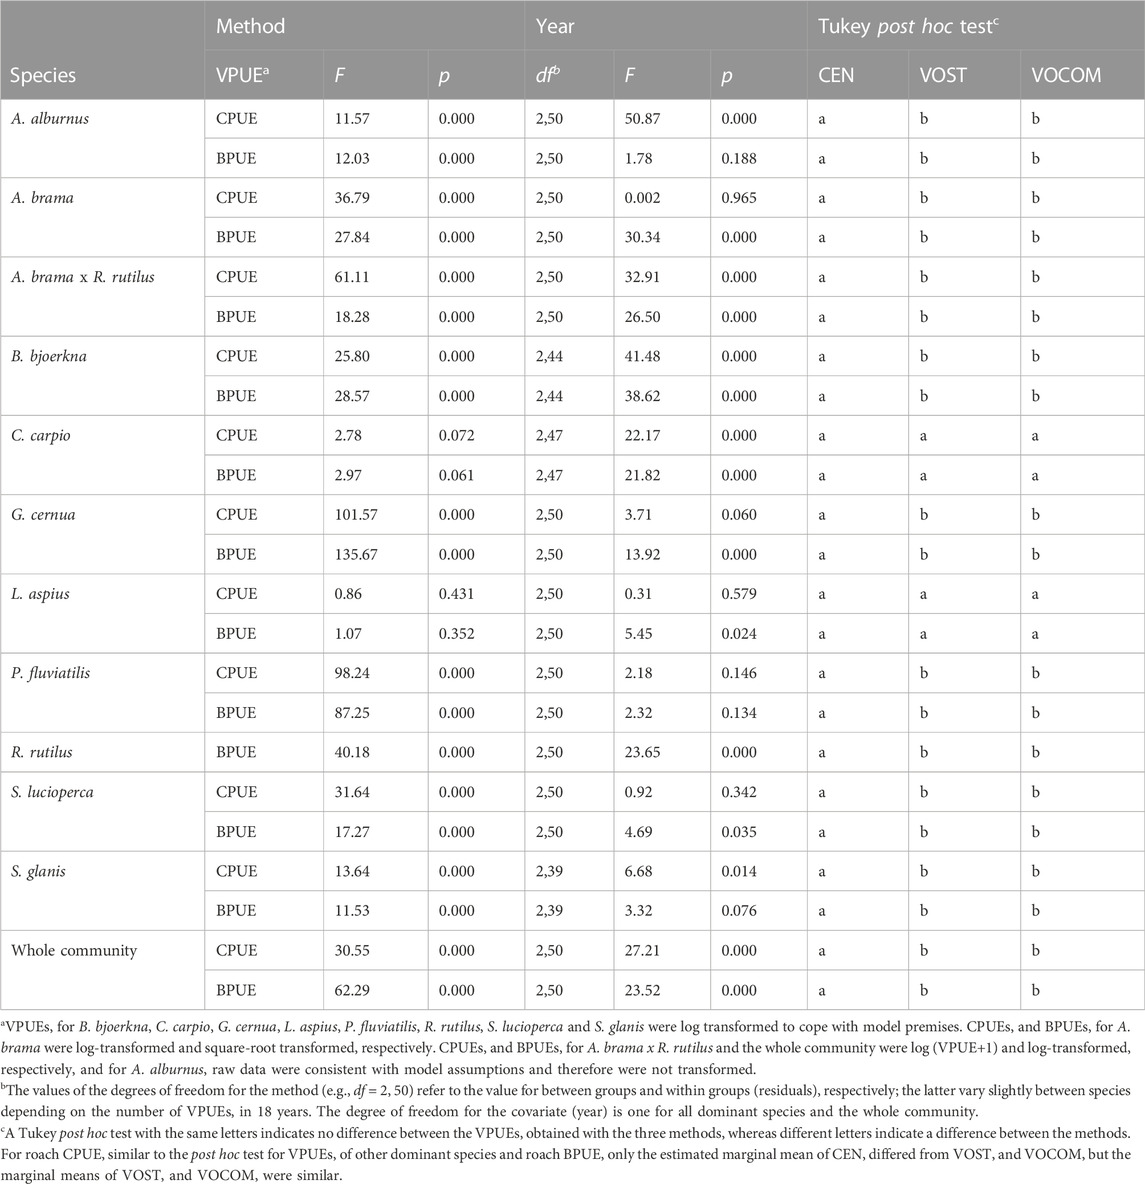
TABLE 6. Summary of comparisons (ANCOVA and Tukey post hoc test) for estimated VPUEs of fish community sampled in different years (2004–2021) in Římov Reservoir (Czech Republic) derived from CEN, VOST and VOCOM.
Furthermore, comparison of VPUEs derived from CEN, VOST, and VOCOM indicated that community-wide VPUEs for total relative abundance and biomass were significantly different (Table 6). However, the Tukey post hoc test showed that VPUEs derived from VOST and VOCOM were similar for the pooled community data, but differed from CEN (Table 6). When examined by individual species, CPUEs and BPUEs derived from CEN, VOST, and VOCOM were also significantly different for all dominant species except common carp and asp (p < 0.05). However, the Tukey post hoc test for the species with significant test showed that VPUEs derived from VOST and VOCOM were similar for all dominant species but different from CEN (Table 6). Besides, the estimated marginal means, standard errors, and 95% confidence intervals of the three methods for roach CPUE (ind./1000 m2 net) were 7.50, 0.52, and 6.48–8.59 for CEN; 2.82, 0.32, and 2.21–3.51 for VOST; and 2.55, 0.31, and 1.97–3.20 for VOCOM, respectively. Therefore, similar to the Tukey post hoc test for VPUEs of other dominant species and roach BPUE, only the estimated marginal mean of CEN differed from VOST and VOCOM, but the marginal means of VOST and VOCOM were similar.
Discussion
Methods for computing whole-reservoir relative fish abundance and biomass
The Římov Reservoir serves as a long-term ecological research site for monitoring all important components of aquatic biota (Znachor et al., 2017). Long-term, fishery-independent surveys conducted annually with standardized gear and a well-designed sampling approach can provide time series of fish population abundance - CPUE and biomass–BPUE indices (Martell and Froese, 2013; Froese et al., 2018; Froese et al., 2020) and ecosystem health indicators, as in the EU WFD (CEN, 2005; CEN, 2015). However, scientists long ago began to question the way we obtain input catch data and how these indices are determined (e.g., Walters, 2003; Campbell, 2004). Accordingly, depth-stratified sampling (a priori) (Walters, 2003; CEN, 2005) and volume-weighting of these indices (a posteriori) have been proposed (Mehner et al., 2005; Lauridsen et al., 2008; Kubečka et al., 2013; Alexander et al., 2015a). Here we discuss the results of three methods: the established CEN protocol and two volume-weighting approaches -VOST and VOCOM.
As expected, the three methods used to calculate the reservoir-wide relative abundance and biomass of the dominant species and the total fish community produced different VPUEs (Figures 2, 3). The CEN protocol places the greatest emphasis on benthic habitats, which generally harbor higher fish abundance, biomass, and species richness than pelagic habitats (Prchalová et al., 2008; Prchalová et al., 2009b; Moraes et al., 2021). Consequently, it provided higher reservoir-wide CPUEs and BPUEs by a factor of two when estimates are compared to the two volume-weighting approaches (Table 3). Similar differences were found by Lauridsen et al. (2008) for Danish lakes and by Alexander et al. (2015a) for many lakes in eastern France, Switzerland, and northern Italy. We see spatial scale problems in the CEN protocol that may have led to these differences. Walters (2003) pointed out that fisheries scientists typically use commercial catch rate data for stock assessments that come from only a few fishing areas to extrapolate to the entire system. Similarly, the CEN protocol uses ESG monitoring data primarily from benthic habitats and only at the deepest point of pelagic habitats to represent the entire lentic system. However, several authors have noted that the CEN protocol underrepresents pelagic species in whole-lake fish community assessments (Diekmann et al., 2005; Deceliere-Vergès and Guillard, 2008; Deceliere-Vergès et al., 2009; Specziár et al., 2009; Achleitner et al., 2012; Alexander et al., 2015b). In addition, sampling only the deepest spot of the lake/reservoir likely overlooks horizontal variation in fish communities in pelagic habitats (Lauridsen et al., 2008; Specziár et al., 2009; Alexander et al., 2015b). These issues are particularly important in large and deep lakes where pelagic habitats make up the majority of lake volume (Alexander et al., 2015b). Even in medium-sized reservoirs such as Římov Reservoir, the volume of pelagic habitats is much larger than that of benthic habitats (Table 2). In this respect, it seems correct to weight VPUEs by habitat volume.
CEN protocol is widely applied and suitable for assessing ecological quality and spatial and temporal comparisons of different water bodies (e.g., Diekmann et al., 2005; Mehner et al., 2005; Deceliere-Vergès and Guillard, 2008; Lauridsen et al., 2008; Prchalová et al., 2008; Achleitner et al., 2012; Alexander et al., 2015a; Šmejkal et al., 2015; Ritterbusch et al., 2022). However, high whole lake abundance and biomass indices of some species from CEN protocol could lead to expansion of resource use (e.g., by increasing fishing effort) or increased angling in recreational fisheries, which would have unforeseen ecological consequences for the freshwater system and ultimately affect long-term socioeconomic benefits. The volume weighting results presented here using nearly 2 decades of monitoring data and other previous studies (e.g., Lauridsen et al., 2008; Kubečka et al., 2013; Alexander et al., 2015a) clearly demonstrate the need to consider both vertical and horizontal weighted fish distribution to estimate realistic (less biased) fish metrics for the system when whole lake data are needed and for dealing with overall role of fish in the food web of the ecosystem.
The VOST approach used here is procedurally similar to previous volume weighting studies (e.g., Lauridsen et al., 2008; Kubečka et al., 2013; Alexander et al., 2015a). However, unlike the previous studies, VPUEs in VOST were calculated from the average catches of the four locations where pelagic nets were deployed to account for uneven horizontal fish distribution, whereas all previous volume-weighted studies used catches only from the deepest locality of the pelagic habitat and therefore have some of the limitations mentioned above. We therefore believe that the VOST-derived VPUEs better reflect the relative abundance and biomass of fish for the system.
Surprisingly, there are not many differences between the VPUEs derived from the VOST and VOCOM approaches for the Římov Reservoir. In the VOCOM calculation, the catch at each locality is weighted by the volume of its depth compartments. Lacustrine compartments in downstream localities (dam and middle) therefore have a greater weight in terms of volume than depth compartments in upper and tributary localities (Figure 1A), where the width of the reservoir and thus their volume is much smaller (Table 2). On the other hand, tributary and upper localities of the reservoir usually harbor more fish (Vašek et al., 2004, 2016; Prchalová et al., 2009a). When all localities are weighted equally using stratum volume (VOST), the increasing effect of tributary is not reduced by weighting their smaller strata volumes, and the numerical values of the estimates (VPUEs) are slightly larger than VOCOM. However, the difference between the CPUEs (Figure 5) and BPUEs (Figure 6) of VOST and VOCOM was not statistically significant for both the total fish community and the dominant fish species, except for asp and common carp, where there was no difference between the three methods (Table 6). The similarity of results between VOST and VOCOM could be due to the limited morphological differences of the canyon-shaped Římov Reservoir along its longitudinal axis. In the case of extreme morphological differences along this axis, which could be the case for large lakes and reservoirs, the relative abundance and biomass indices could differ because there would be differences in the volume contribution of the different compartments. Mehner et al. (2005) and Lauridsen et al. (2008) also indicated that estimates would depend on lake morphology.
Fish assemblages of pelagic habitats in reservoirs are generally less diverse than those of benthic habitats. There are no truly pelagic fish species in Římov Reservoir, and the pelagic habitat is dominated by eurytopic species such as bleak, bream, roach, asp, and pikeperch (Moraes et al., 2021). Bleak is a highly successful species that dominates the pelagic habitat and thus the VOST and VOCOM species composition (Figure 4). The proportion of bleak in CEN protocol is most likely underestimated. The opposite phenomenon can be noticed for more benthic species such as perch and ruffe. More species are present in benthic habitats, so the species composition of CEN is more diverse, however the volume-weighted results are more realistic due to real ratios of habitat volumes. Many researchers have reached similar conclusions, noting that the CEN protocol not only underrepresents pelagic habitats, but whole-lake estimates of CPUE, BPUE, and community composition are also biased toward benthic communities, which are disproportionately influenced by the ecological conditions of benthic habitats (Diekmann et al., 2005; Mehner et al., 2005; Lauridsen et al., 2008; Achleitner et al., 2012; Alexander et al., 2015a). Since we found no significant differences between VOST and VOCOM, we put forward the VOST approach especially for small and medium lakes and reservoirs with less diverse bathymetric morphologies. In cases where bathymetric morphological differences are very large at different sites, which is often the case for large lakes and reservoirs, VOCOM would provide more realistic estimates of these population and community indices.
Monitoring fish species composition
The European Standard Gillnet (ESG) is becoming increasingly popular and is widely used for sampling in European waters. Our results show that despite the use of the modified-ESG series and a sampling scheme representing all habitats along the horizontal and vertical gradients, only a limited number of species (<50% of the fish species present in the reservoir) were caught annually (Table 1; Supplementary Table S1). Apparently, dominant, and subdominant species were caught regularly, while rare species were caught only occasionally. The newly emerged vimba bream probably originated from the inflow river since it was caught only in 2021 in the tributary locality of the reservoir. The hybrid bream x rudd, on the other hand, is probably the result of hybridization of the two species present in the reservoir. Hybridization of the two species in the wild has been reported in other systems (Donnelly et al., 1998; Wyatt et al., 2006). The observed interannual variation in species composition (Figure 4; Table 3) also suggests temporal variation in fish community composition and species accessibility to gillnets. Although the extended-ESG series solved the widely reported problem of size selectivity (Lauridsen et al., 2008; Šmejkal et al., 2015) and allowed capture of large specimens of common species, the problem of species selectivity–another inherent problem of gillnets that also applies to ESG, has not yet been resolved. Other studies also reported the problem of species selectivity in terms of low catchability in gillnets for eel and pike (Prchalová et al., 2013; CEN, 2015), burbot Lota lota and (Argillier et al., 2013) and wels catfish, which has a large, depressed head that is not suitable for gillnets. However, the comparisons with studies of the reservoir by other active methods (Říha et al., 2009; Říha et al., 2015) show that extended ESG cover the main players of the community.
Trends in fish abundance and biomass
Our study revealed trends in the abundance of some common species. Most striking is the increase in the abundance of the bleak in the volume-weighted VPUEs (Figures 2, 5). The population of this species has been gradually developing in the reservoir (Říha et al., 2009) and is clearly becoming more successful, while the total biomass of other fishes is decreasing, although bleak increase is seen only in numbers, not biomass. Another expanding species is white bream, which entered the reservoir relatively late and whose density is still relatively low. Perch abundance is increasing in the benthic habitat, which is inhabited primarily by small individuals. Predators (asp, pikeperch, and wels catfish) were found to have a slight population increase. They are regularly stocked into the reservoir, but their increase is limited by illegal fishing (Vašek et al., 2013). Common carp seldom breeds in central European reservoirs (Souza et al., 2022), and their population is supported by flood events that bring common carp from aquaculture ponds in the watershed (Boukal et al., 2012). The common carp population peaked in 2006, when significant flooding occurred (Znachor et al., 2017), and declined since then until 2020, when further flooding brought new inflow of common carps (Figure 2).
Roach abundance is also increasing in the benthic habitat, which is inhabited primarily by small individuals. In fact, the total biomass of roach is decreasing (Figures 3, 6), so the population consists of smaller individuals. These observed changes in roach size structure and shift in habitat from pelagic to littoral (benthic) may have greatly influenced the results of CEN for roach. This could also be why the CPUE interaction test for roach was significant over time for the different methods (Table 4), as the small (juvenile) roach prefer littoral habitats where plankton are abundant and the water is warmer, resulting in an increasing trend in their CPUE for CEN, but not for VOST and VOCOM (Figures 2, 6).
As a result, regardless of the methods used, a general downward trend in the relative biomass of the entire fish community was observed (Figures 3, 6), while abundance showed the opposite trend (Figures 2, 5). Also, the increasing trend in abundance clearly reflects the increase in abundance of small fish species (e.g., bleak) and small individuals of bream, roach, and white bream (Figure 2). Several factors may be responsible for this contrasting situation. Regular biomanipulation of fish (removal of planktivorous fish such as bleak, bream, and roach and enhancement of predators) could be a possible reason for this declining trend in size and thus total community biomass. Although biomass of predators has slowly increased over time (Figures 3, 6), they have generally remained at low levels (Figure 4). The most abundant predators, such as pikeperch, asp, and perch, consume small prey (Kubečka et al., 1998; Vašek et al., 2018) and are therefore unlikely to eliminate the largest individuals and reduce the average size of populations. Emerging wels catfish may play a role here. In addition, a fishery-induced evolution toward smaller size (Law, 2000; de Roos et al., 2006) is very unlikely, as the usual catches of planktivorous fish are only 1–2 kg/ha, except in the years from 2020 onwards, when more biomanipulation occurred (Jůza et al., 2022). Therefore, we can say that the direct impact on fish population size is unlikely. The most likely impact of fish removal could be more indirect through their food web. A study of bream growth performance in the Římov Reservoir using several decades of age structure and climate data showed a decreasing trend in the von Bertalanffy growth parameter K - a growth curvature parameter that indicates the growth rate of fish toward the asymptotic length (L∞) or weight (W∞) (Souza AT et al., unpublished data). This situation signals that predation pressure on zooplankton by abundant small planktivorous fish was high and these fish may have suffered from strong competition for food, resulting in a downward trend in their biomass.
Conclusion
This paper provides the most comprehensive description of long-term fish community dynamics, as it summarizes fish samples from all habitats (i.e., all fish older than 0+) collected with both European standard and large mesh gillnets. Using long-term fish catch data from Římov Reservoir, we present whole-reservoir species composition, abundance, and biomass indices for the dominant fish species and the entire community derived from volume-weighted and unweighted catch rates.
The CEN appeared to provided higher estimates of population and total community abundance and biomass by a factor of two when compared to the two volume weighting approaches. Therefore, using such a high VPUE could have serious implications for resource management plans and strategies, and food web models for ecosystem level assessments. We believe that the volume-weighted results are more realistic because habitat volumes are used for weighting and sampling accounts for heterogeneity in the vertical and horizontal distribution of fish. Since we found no significant differences between VOST and VOCOM, we put forward the VOST approach especially for small and medium lakes and reservoirs with less diverse bathymetric morphologies. In cases where bathymetric morphological differences are very large at different sites, which is often the case for large lakes and reservoirs, VOCOM would provide more realistic estimates of these population and community indices. To avoid overestimating the importance of benthic species at the expense of pelagic species (e.g., ruffe, perch, and roach vs bleak in Římov), we recommend pelagic sampling at more locations than just over the deepest part of the water body to cover heterogeneity of fish distribution in this habitat (usually the largest volume of the water body) as well, and weighting catches by the volume of a given depth stratum in a given water body to properly reflect actual volume proportions and provide the most representative picture of the whole community, as required by the WFD for ecosystem status assessment.
All approaches consistently showed an increasing trend in whole fish community abundance and a decreasing trend in biomass during the study period, which is supported by the observed increase in abundance of small fish. Overall, long-term fish monitoring data have proven critical for examining the status and understanding of fish community composition, relative abundance, and biomass trends, and for deciphering a realistic picture of fish populations and communities in the freshwater system by using habitat volume for weighting.
Data availability statement
The raw data supporting the conclusion of this article will be made available by the authors, without undue reservation.
Ethics statement
The animal study was reviewed and approved by Animal ethics committee of the Biology Centre CAS.
Author contributions
GT: Conceptualization, methodology, data processing, formal analysis, visualization, writing-original draft, review and editing; AS: Conceptualization, data processing, formal analysis, investigation, methodology, validation, visualization, and review and editing; DB: Investigation, writing—review and editing; PB: Investigation, writing—review and editing; MČ: Investigation, writing—review and editing; VD: Investigation, writing—review and editing; JF: Investigation, writing—review and editing; MH: Investigation, writing—review and editing; LK: Investigation, data curation, Writing—review and editing; TK: Investigation, data curation, Writing—review and editing; CM: Investigation, data curation, writing—review and editing; KM: Investigation, writing—review and editing; MM: Investigation, formal analysis, writing—review and editing; MP: Investigation, writing—review and editing; MŘ: Investigation, writing—review and editing; ZS: Investigation, writing—review and editing; KS: Investigation, writing—review and editing; MŠ: Investigation, writing—review and editing; MT: Investigation, writing—review and editing; MV: Investigation, writing—review and editing; LV: Investigation, writing—review and editing; IV: Investigation, writing—review and editing; JP: investigation, resources, writing—review and editing, funding acquisition and project administration; TJ: Investigation, writing—review and editing; JK: Conceptualization, investigation, methodology, review and editing, resources, validation, funding acquisition and project administration. All authors have agreed to be responsible for the content of the paper and approved it for publication.
Funding
European Union within ESIF in frame of Operational Program Research, Development and Education (Project No. CZ.02.1.01/0.0/0.0/16_025/0007417 administrated by the Ministry of Education, Youth and Sports of the Czech Republic)” and AV 21 strategy support program “Water for Life”.
Acknowledgments
We acknowledge the help of many volunteers, colleagues and students helping occasionally with sampling in Římov reservoir, and Professor Gejza Dohnal (Czech Technical University) and Professor Tomaš Mrkvička (University of South Bohemia) for checking our statistical analyses. The suggestions of two reviewers and the associate editor, Prof. Robert Ptacnik greatly improved the manuscript.
Conflict of interest
The authors declare that the research was conducted in the absence of any commercial or financial relationships that could be construed as a potential conflict of interest.
Publisher’s note
All claims expressed in this article are solely those of the authors and do not necessarily represent those of their affiliated organizations, or those of the publisher, the editors and the reviewers. Any product that may be evaluated in this article, or claim that may be made by its manufacturer, is not guaranteed or endorsed by the publisher.
Supplementary material
The Supplementary Material for this article can be found online at: https://www.frontiersin.org/articles/10.3389/fenvs.2022.1000087/full#supplementary-material
References
Achleitner, D., Gassner, H., and Luger, M. (2012). Comparison of three standardised fish sampling methods in 14 alpine lakes in Austria. Fish. Manag. Ecol. 19, 352–361. doi:10.1111/j.1365-2400.2012.00851.x
Alexander, T. J., Vonlanthen, P., Periat, G., Degiorgi, F., Raymond, J. C., and Seehausen, O. (2015a). Estimating whole-lake fish catch per unit effort. Fish. Res. 172, 287–302. doi:10.1016/j.fishres.2015.07.024
Alexander, T. J., Vonlanthen, P., Periat, G., Degiorgi, F., Raymond, J. C., and Seehausen, O. (2015b). Evaluating gillnetting protocols to characterize lacustrine fish communities. Fish. Res. 161, 320–329. doi:10.1016/j.fishres.2014.08.009
Argillier, C., Caussé, S., Gevrey, M., Pédron, S., de Bortoli, J., Brucet, S., et al. (2013). Development of a fish-based index to assess the eutrophication status of European lakes. Hydrobiologia 704, 193–211. doi:10.1007/s10750-012-1282-y
Blabolil, P., Ricard, D., Peterka, J., Říha, M., Jůza, T., Vašek, M., et al. (2016). Predicting asp and pikeperch recruitment in a riverine reservoir. Fish. Res. 173, 45–52. doi:10.1016/j.fishres.2015.08.003
Blabolil, P., Boukal, D. S., Ricard, D., Kubečka, J., Říha, M., Vašek, M., et al. (2017). Optimal gillnet sampling design for the estimation of fish community indicators in heterogeneous freshwater ecosystems. Ecol. Indic. 77, 368–376. doi:10.1016/j.ecolind.2017.02.036
Blabolil, P., Harper, L. R., Říčanová, Š., Sellers, G., di Muri, C., Jůza, T., et al. (2021). Environmental DNA metabarcoding uncovers environmental correlates of fish communities in spatially heterogeneous freshwater habitats. Ecol. Indic. 126, 107698. doi:10.1016/j.ecolind.2021.107698
Boukal, D. S., Jankovský, M., Kubečka, J., and Heino, M. (2012). Stock–catch analysis of carp recreational fisheries in Czech reservoirs: Insights into fish survival, water body productivity and impact of extreme events. Fish. Res. 119-120, 23–32. doi:10.1016/j.fishres.2011.12.003
Campbell, R. A. (2004). CPUE standardisation and the construction of indices of stock abundance in a spatially varying fishery using general linear models. Fish. Res. 70, 209–227. doi:10.1016/j.fishres.2004.08.026
CEN (2005). Water quality – sampling fish with multi-mesh gillnets. Brussels: European Committee for Standardization. European Standard EN 14757:2005.
CEN (2015). Water quality – sampling of fish with multi-mesh gillnets. Brussels: European Committee for Standardization. European Standard EN 14757:2015.
Davis, W. S. (1995). “Bioassessment and criteria: Building on the past,” in Biological assessment and criteria: Tools for water resource planning and decision making. Editors W. S. Davis, and T. P. Simon (Boca Raton, FL: CRC Press), 15–29.
de Roos, A. M., Boukal, D. S., and Persson, L. (2006). Evolutionary regime shifts in age and size at maturation of exploited fish stocks. Proc. R. Soc. B 273, 1873–1880. doi:10.1098/rspb.2006.3518
Deceliere-Vergès, C., and Guillard, J. (2008). Assessment of the pelagic fish populations using CEN multi-mesh gillnets: consequences for the characterization of the fish communities. Knowl. Manag. Aquat. Ecosyst. 389, 04. doi:10.1051/kmae:2008005
Deceliere-Vergès, C., Argillier, C., Lanoiselée, C., de Bortoli, J., and Guillard, J. (2009). Stability and precision of the fish metrics obtained using CEN multi-mesh gillnets in natural and artificial lakes in France. Fish. Res. 99, 17–25. doi:10.1016/j.fishres.2009.04.012
Diekmann, M., Braemick, U., Lemcke, R., and Mehner, T. (2005). Habitat-specific fishing revealed distinct indicator species in German lowland lake fish communities. J. Appl. Ecol. 42, 901–909. doi:10.1111/j.1365-2664.2005.01068.x
Donnelly, R. E., Caffrey, J. M., and Tierney, D. M. (1998). Movements of a bream (Abramis brama (L.)), rudd x bream hybrid, tench (Tinca tinca (L.)) and pike (Esox lucius (L.)) in an Irish canal habitat. Hydrobiologia 371/372, 305–308. doi:10.1023/a:1017083423786
Dudgeon, D., Arthington, A. H., Gessner, M. O., Kawabata, Z. I., Knowler, D. J., Lévêque, C., et al. (2006). Freshwater biodiversity: Importance, threats, status, and conservation challenges. Biol. Rev. 81, 163. doi:10.1017/S1464793105006950
European Commission (2000). Directive 2000/60/EC of the European Parliament and of the Council of 23 October 2000 establishing a framework for Community action in the field of water policy action in the field of water policy. Off. J. Eur. Communities L327, 1–73.
Fricke, R., van der Laan, R., and Eschmeyer, W. (2022). Eschmeyer’s catalog of fishes: Genera, species, references. Available at: https://researcharchive.calacademy.org/research/ichthyology/catalog/fishcatmain.asp (Accessed September 28, 2022).
Froese, R., Winker, H., Coro, G., Demirel, N., Tsikliras, A. C., Dimarchopoulou, D., et al. (2018). A new approach for estimating stock status from length frequency data. ICES J. Mar. Sci. 75, 2004–2015. doi:10.1093/icesjms/fsy078
Froese, R., Winker, H., Coro, G., Demirel, N., Tsikliras, A. C., Dimarchopoulou, D., et al. (2020). Estimating stock status from relative abundance and resilience. ICES J. Mar. Sci. 77, 527–538. doi:10.1093/icesjms/fsz230
Harris, J. H. (1995). The use of fish in ecological assessments. Austral Ecol. 20, 65–80. doi:10.1111/j.1442-9993.1995.tb00523.x
Hilborn, R., and Walters, C. (1992). Quantitative fisheries stock assessment: Choice, dynamics, and uncertainty. New York: Chapman & Hall.
Hladík, M., Kubečka, J., Mrkvička, T., Čech, M., Draštík, V., Frouzová, J., et al. (2008). Effects of the construction of a reservoir on the fish assemblage in an inflow river. Czech J. Anim. Sci. 53, 537–547. doi:10.17221/370-cjas
Jakobsen, T. S., Hansen, P. B., Jeppesen, E., and Søndergaard, M. (2004). Cascading effect of three-spined stickleback Gasterosteus aculeatus on community composition, size, biomass and diversity of phytoplankton in shallow, eutrophic brackish lagoons. Mar. Ecol. Prog. Ser. 279, 305–309. doi:10.3354/meps279305
Jeppesen, E., Lauridsen, T. L., Mitchell, S. F., Christoffersen, K., and Burns, C. W. (2000). Trophic structure in the pelagial of 25 shallow New Zealand lakes: Changes along nutrient and fish gradients. J. Plankton Res. 22, 951–968. doi:10.1093/plankt/22.5.951
Jůza, T., Blabolil, P., Čech, M., Draštík, V., Frouzová, J., Sajdlová, Z., et al. (2022). Fish stock mass reduction is indicated in standard abundance and biomass estimates from gillnets and hydroacoustics. Fish. Res. 253, 106389. doi:10.1016/j.fishres.2022.106389
Kubečka, J., Seda, J., and Matena, J. (1998). Fish-zooplankton interactions during spring in a deep reservoir. Int. Rev. Hydrobiol. 83, 431–441.
Kubečka, J., Prchalová, M., Čech, M., Draštík, V., Frouzová, J., Hladík, M., et al. (2013). Fish (osteichthyes) in biesbosch storage reservoirs (the Netherlands): a method for assessing complex stocks of fish. Acta Soc. Zool. Bohem. 77, 37–54.
Lauridsen, T. L., Landkildehus, F., Jeppesen, E., Jørgensen, T. B., and Søndergaard, M. (2008). A comparison of methods for calculating Catch Per Unit Effort (CPUE) of gill net catches in lakes. Fish. Res. 93, 204–211. doi:10.1016/j.fishres.2008.04.007
Law, R. (2000). Fishing, selection, and phenotypic evolution. ICES J. Mar. Sci. 57, 659–668. doi:10.1006/jmsc.2000.0731
Lüdecke, D., Ben-Shachar, M., Patil, I., Waggoner, P., and Makowski, D. (2021). performance: An R package for assessment, comparison and testing of statistical models. J. Open Source Softw. 6, 3139. doi:10.21105/joss.03139
Makowski, D., Ben-Shachar, M. S., Patil, I., and Lüdecke, D. (2020). Estimation of model-based predictions, contrasts and means. CRAN. Available at: https://easystats.github.io/modelbased/authors.html (Accessed August 8, 2022).
Martell, S., and Froese, R. (2013). A simple method for estimating MSY from catch and resilience. Fish. Fish. 14, 504–514. doi:10.1111/j.1467-2979.2012.00485.x
Mehner, T., Diekmann, M., Brämick, U., and Lemcke, R. (2005). Composition of fish communities in German lakes as related to lake morphology, trophic state, shore structure and human-use intensity. Freshw. Biol. 50, 70–85. doi:10.1111/j.1365-2427.2004.01294.x
Moraes, K., Souza, A. T., Vašek, M., Bartoň, D., Blabolil, P., Čech, M., et al. (2021). Openness of fish habitat matters: Lake pelagic fish community starts very close to the shore. Water (Basel) 13, 3291. doi:10.3390/w13223291
Musil, J., Jurajda, P., Adámek, Z., Horký, P., and Slavík, O. (2010). Non-native fish introductions in the Czech Republic - species inventory, facts and future perspectives. J. Appl. Ichthyol. 26, 38–45. doi:10.1111/j.1439-0426.2010.01500.x
Plessl, C., Otachi, E. O., Körner, W., Avenant-Oldewage, A., and Jirsa, F. (2017). Fish as bioindicators for trace element pollution from two contrasting lakes in the eastern rift valley, Kenya: spatial and temporal aspects. Environ. Sci. Pollut. Res. 24, 19767–19776. doi:10.1007/s11356-017-9518-z
Prchalová, M., Kubečka, J., Říha, M., Litvín, R., Čech, M., Frouzová, J., et al. (2008). Overestimation of percid fishes (Percidae) in gillnet sampling. Fish. Res. 91, 79–87. doi:10.1016/j.fishres.2007.11.009
Prchalová, M., Kubečka, J., Čech, M., Frouzová, J., Draštík, V., Hohausová, E., et al. (2009a). The effect of depth, distance from dam and habitat on spatial distribution of fish in an artificial reservoir. Ecol. Freshw. Fish. 18, 247–260. doi:10.1111/j.1600-0633.2008.00342.x
Prchalová, M., Kubečka, J., Říha, M., Mrkvička, T., Vašek, M., Jůza, T., et al. (2009b). Size selectivity of standardized multimesh gillnets in sampling coarse European species. Fish. Res. 96, 51–57. doi:10.1016/j.fishres.2008.09.017
Prchalová, M., Kubečka, J., Říha, M., Čech, M., Jůza, T., Ketelaars, H. A. M., et al. (2013). Eel attacks-A new tool for assessing European eel (Anguilla anguilla) abundance and distribution patterns with gillnet sampling. Limnologica 43, 194–202. doi:10.1016/j.limno.2012.09.003
R Core Team (2022). R: A language and environment for statistical computing. Available at: https://www.R-project.org/ (Accessed November 04, 2022).
Radinger, J., Britton, J. R., Carlson, S. M., Magurran, A. E., Alcaraz-Hernández, J. D., Almodóvar, A., et al. (2019). Effective monitoring of freshwater fish. Fish. Fish. 20, faf.12373. doi:10.1111/faf.12373
Říha, M., Kubečka, J., Vašek, M., Seďa, J., Mrkvička, T., Prchalová, M., et al. (2009). Long-term development of fish populations in the Římov Reservoir. Fish. Manag. Ecol. 16, 121–129. doi:10.1111/j.1365-2400.2008.00650.x
Říha, M., Ricard, D., Vašek, M., Prchalová, M., Mrkvička, T., Jůza, T., et al. (2015). Patterns in diel habitat use of fish covering the littoral and pelagic zones in a reservoir. Hydrobiologia 747, 111–131. doi:10.1007/s10750-014-2124-x
Ritterbusch, D., Blabolil, P., Breine, J., Erős, T., Mehner, T., Olin, M., et al. (2022). European fish-based assessment reveals high diversity of systems for determining ecological status of lakes. Sci. Total Environ. 802, 149620. doi:10.1016/j.scitotenv.2021.149620
Sala, O. E., Stuart, F., Iii, C., Armesto, J. J., Berlow, E., Bloomfield, J., et al. (2000). Global biodiversity scenarios for the year 2100. Science 287, 1770–1774. doi:10.1126/science.287.5459.1770
Šmejkal, M., Ricard, D., Prchalová, M., Říha, M., Muška, M., Blabolil, P., et al. (2015). Biomass and abundance biases in European standard gillnet sampling. PLoS One 10, e0122437. doi:10.1371/journal.pone.0122437
Souza, A. T., Argillier, C., Blabolil, P., Děd, V., Jarić, I., Monteoliva, A. P., et al. (2022). Empirical evidence on the effects of climate on the viability of common carp (Cyprinus carpio) populations in European lakes. Biol. Invasions 24, 1213–1227. doi:10.1007/s10530-021-02710-5
Specziár, A., Erős, T., György, Á. I., Tátrai, I., and Bíró, P. (2009). A comparison between the benthic Nordic gillnet and whole water column gillnet for characterizing fish assemblages in the shallow Lake Balaton. Ann. Limnol. - Int. J. Lim. 45, 171–180. doi:10.1051/limn/2009016
Vašek, M., Kubečka, J., Peterka, J., Čech, M., Draštík, V., Hladík, M., et al. (2004). Longitudinal and vertical spatial gradients in the distribution of fish within a canyon-shaped reservoir. Int. Rev. Hydrobiol. 89, 352–362. doi:10.1002/iroh.200410734
Vašek, M., Prchalová, M., Peterka, J., Ketelaars, H. A. M., Wagenvoort, A. J., Čech, M., et al. (2013). The utility of predatory fish in biomanipulation of deep reservoirs. Ecol. Eng. 52, 104–111. doi:10.1016/j.ecoleng.2012.12.100
Vašek, M., Prchalová, M., Říha, M., Blabolil, P., Čech, M., Draštík, V., et al. (2016). Fish community response to the longitudinal environmental gradient in Czech deep-valley reservoirs: Implications for ecological monitoring and management. Ecol. Indic. 63, 219–230. doi:10.1016/j.ecolind.2015.11.061
Vašek, M., Eloranta, A. P., Vejříková, I., Blabolil, P., Říha, M., Jůza, T., et al. (2018). Stable isotopes and gut contents indicate differential resource use by coexisting asp (Leuciscus aspius) and pikeperch (Sander lucioperca). Ecol. Freshw. Fish. 27, 1054–1065. doi:10.1111/eff.12414
Walters, C. (2003). Folly and fantasy in the analysis of spatial catch rate data. Can. J. Fish. Aquat. Sci. 60, 1433–1436. doi:10.1139/f03-152
Wickham, H. (2016). ggplot2: Elegant graphics for data analysis. Available at: https://ggplot2.tidyverse.org (Accessed September 29, 2022).
Wyatt, P. M. W., Pitts, C. S., and Butlin, R. K. (2006). A molecular approach to detect hybridization between bream Abramis brama, roach Rutlius rutilus and rudd Scardinius erythrophthalmus. J. Fish. Biol. 69, 52–71. doi:10.1111/j.1095-8649.2006.01104.x
Znachor, P., Hejzlar, J., Vrba, J., Nedoma, J., Seďa, J., Šimek, K., et al. (2017). in Brief history of long-term ecological research into aquatic ecosystems and their catchments in the Czech Republic. Part I: Manmade reservoirs. Editor P. Znachor (České Budějovice: Biology Centre CASInstitute of Hydrobiology), v.v.i.
Keywords: abundance, biomass, BPUE, CEN, CPUE, sampling design, species composition, volumeweighting
Citation: Tesfaye GC, Souza AT, Bartoň D, Blabolil P, Čech M, Draštík V, Frouzová J, Holubová M, Kočvara L, Kolařík T, Martinez C, Moraes KR, Muška M, Prchalová M, Říha M, Sajdlová Z, Soukalová K, Šmejkal M, Tušer M, Vašek M, Vejřík L, Vejříková I, Peterka J, Jůza T and Kubečka J (2022) Long-term monitoring of fish in a freshwater reservoir: Different ways of weighting complex spatial samples. Front. Environ. Sci. 10:1000087. doi: 10.3389/fenvs.2022.1000087
Received: 21 July 2022; Accepted: 01 December 2022;
Published: 13 December 2022.
Edited by:
Robert Ptacnik, Wasser Cluster Lunz, AustriaReviewed by:
Maxime Logez, Institut National de recherche pour l’agriculture, l’alimentation et l’environnement (INRAE), FranceCarla Ferreira Rezende, Federal University of Ceara, Brazil
Copyright © 2022 Tesfaye, Souza, Bartoň, Blabolil, Čech, Draštík, Frouzová, Holubová, Kočvara, Kolařík, Martinez, Moraes, Muška, Prchalová, Říha, Sajdlová, Soukalová, Šmejkal, Tušer, Vašek, Vejřík, Vejříková, Peterka, Jůza and Kubečka. This is an open-access article distributed under the terms of the Creative Commons Attribution License (CC BY). The use, distribution or reproduction in other forums is permitted, provided the original author(s) and the copyright owner(s) are credited and that the original publication in this journal is cited, in accordance with accepted academic practice. No use, distribution or reproduction is permitted which does not comply with these terms.
*Correspondence: Jan Kubečka, kubecka@hbu.cas.cz