


Abstract
Tens of thousands of rapidly evolving long non-coding RNA (lncRNA) genes have been identified, but functions were assigned to relatively few of them. The lncRNA contribution to the mouse oocyte physiology remains unknown. We report the evolutionary history and functional analysis of Sirena1, the most expressed lncRNA and the 10th most abundant poly(A) transcript in mouse oocytes. Sirena1 appeared in the common ancestor of mouse and rat and became engaged in two different post-transcriptional regulations. First, antisense oriented Elob pseudogene insertion into Sirena1 exon 1 is a source of small RNAs targeting Elob mRNA via RNA interference. Second, Sirena1 evolved functional cytoplasmic polyadenylation elements, an unexpected feature borrowed from translation control of specific maternal mRNAs. Sirena1 knock-out does not affect fertility, but causes minor dysregulation of the maternal transcriptome. This includes increased levels of Elob and mitochondrial mRNAs. Mitochondria in Sirena1−/− oocytes disperse from the perinuclear compartment, but do not change in number or ultrastructure. Taken together, Sirena1 contributes to RNA interference and mitochondrial aggregation in mouse oocytes. Sirena1 exemplifies how lncRNAs stochastically engage or even repurpose molecular mechanisms during evolution. Simultaneously, Sirena1 expression levels and unique functional features contrast with the lack of functional importance assessed under laboratory conditions.
INTRODUCTION
Long non-coding RNAs (lncRNAs) are polymerase II transcripts longer than 200 nucleotides that lack the protein coding ability (1). LncRNAs emerge in large numbers and evolve rapidly with high evolutionary turnover (e.g. (2,3)); tens of thousands have been annotated (4) and many more are yet to be discovered. Functional analysis of lncRNAs is challenging; it usually requires detailed characterization of mutant animals to understand lncRNA evolution and function in vivo, because phenotypes of specific lncRNAs in cultured cells do not necessarily correlate with the phenotypes in mutant animals (5). Specific lncRNAs have been implicated in many processes including regulation of chromatin states in cis and trans, scaffolding ribonucleoprotein complexes, allosteric protein regulations, signaling, or providing precursors for different types of small RNAs (reviewed in (6)). However, it is unclear what fraction of lncRNAs is functional and what fraction represents ‘transcriptional noise’ affecting local chromatin structure and interacting with splicing machinery and other RNA mechanisms without a measurable effect. In many mammalian cell types, the lncRNA roles remain unknown. One such an example is the oocyte.
Mammalian oocyte development is a complex process (reviewed in (7)). Oocyte progenitors enter meiosis and become arrested at the prophase of the first meiotic division during embryonic development. Upon reaching puberty, cohorts of oocytes are recruited into the growth phase, which yields developmentally competent, transcriptionally silent, fully-grown germinal vesicle-intact (GV) oocytes. Subsequent meiotic maturation into metaphase II (MII) eggs, fertilization, and initiation of zygotic development are regulated by maternally deposited RNAs and proteins. Although murine maternal lncRNAs have been annotated (8,9), their validated functional contribution to the oocyte's growth and oocyte-to-embryo transition remains unknown. We annotated 1600 lncRNAs expressed during oocyte-to-embryo transition and found two unique groups of maternal lncRNAs with predicted roles: (i) lncRNAs carrying putative cis-acting cytoplasmic polyadenylation elements (CPEs); CPEs regulate timely translation of dormant mRNAs through cytoplasmic polyadenylation during meiotic maturation and (ii) lncRNAs that serve as templates for production of gene-specific small interfering RNAs (siRNAs) guiding mRNA degradation by RNA interference (RNAi) (9).
Here, we analyzed the most abundant maternal lncRNA and dissected its evolution in rodents and function in mouse oocytes. We named it Sirena1 for its function as a siRNA substrate and its chimeric combination of two unique functional properties associated with post-transcriptional control of the maternal transcriptome. Sirena1 harbors the Elob pseudogene in its first exon and carries six putative CPEs in its 3′ exon, hence it is a substrate for RNAi-mediated gene regulation with putative dormancy. Although Sirena1 knock-out mice did not exhibit fertility defects, Sirena1−/− oocytes showed increased levels of Elob and many mitochondrial mRNAs. Furthermore, we observed altered mitochondrial distribution in the perinuclear space of Sirena1−/− oocytes, suggesting that Sirena1 evolved a structural role in organization of the perinuclear compartment.
MATERIALS AND METHODS
Oocyte collection and culture
Fully grown, germinal vesicle (GV)-intact oocytes and early embryos were obtained from superovulated C57Bl/6J or C57Bl/6NCrl mice as described previously (10). Oocytes were collected in M2 medium (Sigma-Aldrich) and cultured in MEM medium (Sigma-Aldrich) supplemented with sodium pyruvate (Sigma-Aldrich), 4 mg/ml bovine serum albumin (Sigma-Aldrich) and penicillin, streptomycin (100 U/ml: 100 mg/ml, Sigma-Aldrich) at 37°C in a 5% CO2 atmosphere. Resumption of meiosis during culture of GV oocytes was prevented with 0.2 mM 3-isobutyl-1-methyl-xanthine (IBMX; Sigma) or with 2.5 mM Milrinone (Sigma-Aldrich), (11). For time-lapse microscopy experiments, oocytes were stained with 100 nM SiR-tubulin (Spirochrome) for microtubule visualization (12). Sprague Dawley rat fully-grown GV oocytes were collected using the same procedure as for isolation of mouse oocytes without superovulation. Animal experiments were approved by the Institutional Animal Use and Care Committees (Approval no. 58-2015) and were carried out in accordance with the law.
Production of Sirena1 mouse mutant
The Sirena1 deletion mutant model was produced in the Czech Centre for Phenogenomics at the Institute of Molecular Genetics ASCR using Cas9-mediated deletion of the Sirena1 promoter (13). Sequences of guide RNAs are listed in Supplementary Table S1. To produce guide RNAs, synthetic 128 nt guide RNA templates including T7 promoter, 18nt sgRNA and tracrRNA sequences were amplified using T7 and tracrRNA primers. Guide RNAs were produced in vitro using the Ambion mMESSAGE mMACHINE T7 Transcription Kit, and purified using the mirPremier™ microRNA Isolation Kit (Sigma). The Cas9 mRNA was synthesized from pSpCas9-puro plasmid using the Ambion mMESSAGE mMACHINE T7 Transcription Kit, and purified using the RNeasy Mini kit (Qiagen). A sample for microinjection was prepared by mixing two guide RNAs in water (25 ng/μl for each) together with Cas9 mRNA (100 ng/μl). Five picoliters of the mixture were microinjected into male pronuclei of C57Bl/6J zygotes and transferred into pseudo-pregnant recipient mice. PCR genotyping was performed with tail biopsies from four-week-old animals (primers are listed in Supplementary Table S1). We obtained seven positive founders, of which one transmitted the mutant allele to F1. After two generations of breeding with C57Bl/6NCrl animals, the heterozygotes were used for breeding Sirena1−/− animals for phenotype analysis.
RNA isolation, reverse transcription, PCR and real-time PCR
Total RNA from mouse oocytes and embryos (20–30 oocytes/embryos) was released by incubating cells in water with RNase inhibitor for 5 min at 85°C prior to reverse transcription. Reverse transcription was performed using the Premium RevertAid First Strand cDNA Synthesis Kit (Fermentas). Total RNA from mouse tissues and cultured cells was isolated using the RNeasy Mini kit (Qiagen) according to the manufacturer's instructions. One microgram of total RNA was reverse transcribed using the RevertAid First Strand cDNA Synthesis Kit (Fermentas) and used for real-time qPCR. Quantitative PCR was performed using Maxima SYBR Green qPCR Master Mix (Fermentas) in the LC480 (Roche) system. qPCR data were normalized to Hprt1 and Alas expression by the ΔΔCt approach using in-house software. Primers are listed in Supplementary Table S1.
Polysome fractionation
Prior to oocyte collection, 100 μg/ml of cycloheximide (CHX, Sigma Aldrich) was added for 10 min. Two hundred oocytes (per sample) were washed in PBS supplemented with CHX and frozen at −80°C. Oocytes were lysed by using zirconia-silica beads (BioSpec) and lysis buffer (10 mM HEPES, pH 7.5; 62.5 mM KCl; 5 mM MgCl2; 2 mM DTT; 1% Triton X-100; 100 μg/ml of CHX supplemented with Complete-EDTA-free Protease Inhibitor-Roche and Ribolock 20 U/ml, Thermo Fisher). The debris was cleared by centrifugation (8000 × g for 5 min) at 4°C. Supernatants were layered onto 10–50% linear sucrose gradients in SW55 tubes. Centrifugation was carried out using an Optima L-90 ultracentrifuge (Beckman Coulter) at 35 000 × g for 65 min at 4°C. HEK293 cells were used as positive control to monitor the polysome fractionation. Ten equal fractions were recovered from each sample and subjected to RNA isolation by Trizol reagent (Sigma-Aldrich). Non-polysomal and polysomal fractions were pooled and analyzed by qPCR with Sirena1, Ccnb1 and Mos specific primers (Supplementary Table S1) in a QuantStudio 3 cycler (Applied Biosystems). Three independent experiments (biological replicates) analyzing GV and MII stages were performed. For quantification, we estimated the abundance of each transcript in the polysomal fraction (relative to the non-polysomal fraction) in GV and MII samples in each experiment. To disrupt polysomes, 100 mM EDTA was added to the lysis buffer. Paired t-test was used or statistical analysis of significant differences between GV and MII stages.
Western blotting
Oocytes were washed in PBS and frozen to −80°C. Thirty oocytes were lysed in Reducing SDS loading buffer and denatured for 5 min. Proteins were separated by gradient precast 4–12% SDS–PAGE gel (Thermo Fisher) and transferred to Immobilon P membrane (Millipore) by the semidry blotting system. Membranes were blocked by 5% skimmed milk for 1 h and incubated with the following primary antibodies diluted in 1% milk/TTBS overnight: Anti-MOS (1:1000, SantaCruz; SC-1093-R), Anti-CCNB1 (1:500, Thermo Fisher; MA5-13128) and Anti-GAPDH (1:1000, Sigma Aldrich; G9545). The membranes were incubated in secondary antibodies diluted 1:10 000 (Peroxidase Donkey Anti-Rabbit; #711-035-152, Jackson ImmunoResearch, and Peroxidase Donkey Anti-Mouse; #715-035-151, Jackson ImmunoResearch) for 1 h at room temperature. Proteins were visualized by chemiluminescence using ECL (Amersham). Negatives were scanned using a GS-800 calibrated densitometer (Bio-Rad).
Preparation of RNA reporters for microinjection
For CPE analysis, Sirena1 and Ccnb1 3′ ends were amplified from oocyte cDNA using primers with NotI and BamHI restriction sites (Supplementary Table S1). The resulting PCR products were digested with NotI and BamHI restriction enzymes and inserted downstream of the Renilla coding sequence in phRL-SV40 vector digested with NotI + BamHI. The 3′ untranslated regions (UTRs) in Renilla reporters were then mutated/deleted using the Q5® Site-Directed Mutagenesis Kit (NEB) according to the manufacturer's protocol (mutagenesis primers are listed in Supplementary Table S1). Firefly control reporter was pGL4-CMV (Promega). Generation of the H2B-mCherry reporter used for time-lapse microscopy was described previously (14).
Reporter RNA for microinjection was produced from linearized plasmids using the mMESSAGE mMACHINE™ T7 Transcription Kit (Invitrogen) according to the manufacturer's protocol, purified using the RNeasy Mini kit (Qiagen), diluted to 100 000 molecules/pl, aliquoted, and stored at −80°C.
Oocyte microinjection
Denuded GV oocytes were microinjected in M2 medium using micromanipulator PM 2000B microinjector (MicroData Instrument). For CPE analysis, we microinjected ∼7–10 pl of luciferase reporters with 1 pl containing 10 000 molecules of each Renilla and firefly reporter. For live cell imaging, oocytes were microinjected with ∼7–10 pl of 50 ng/μl H2B-mCherry (14).
Luciferase reporter assay
Microinjected oocytes (5 oocytes per sample) were lysed in 5 μl of 1 × Passive Lysis Buffer (Promega) and the lysate was transferred into 96-well plates (Fisher Scientific). Luciferase activity was measured in the Modulus Microplate Reader luminometer (Turner Biosystems) using the Dual Luciferase Reporter Assay System (Promega) according to the manufacturer's protocol. The obtained Renilla luciferase signal (experimental reporter) was normalized to firefly luciferase activity (from the co-injected reference reporter).
ATP assay
ATP assay in oocytes was done with the Adenosine 5′-triphosphate bioluminescent somatic cell assay kit (FLASC) according to the manufacturer's protocol. GV oocytes were either denuded and analyzed immediately, or cultured in M16 media with IBMX (0.2 mM) for 20 h before analysis. Five GV oocytes were collected per tube in 100 μl of somatic cell ATP releasing buffer, 100 μl of ATP assay mix was added to each tube, and luminescence was immediately measured using Glomax 20/20 (Promega). ATP per oocyte was estimated by comparison with a standard curve generated over the range of 20–2000 fmol/100 μl.
Confocal microscopy and mitochondria staining
Oocyte mitochondria were visualized using MitoTracker CMXRos (ThermoFischer, #M7512). Oocytes were isolated in M2 media and incubated with Mitotracker for 30 min followed by three washes with M2 media. Oocytes were then live-imaged in a Leica TCS SP5 confocal microscope.
Time-lapse microscopy
Time-lapse image acquisitions were performed using Leica TCS SP5 with an HCX PL Apo Lambda Blue 40× 1.25 oil objective with 1× zoom, and 14 confocal 5-μm optical sections were taken with a 1024 × 1024 pixel image resolution using 10 min time intervals as described previously (15).
Electron microscopy
Oocytes were fixed with 2.5% glutaraldehyde in Sörensen buffer (0.1 M sodium/potassium phosphate buffer, pH 7.3; SB) for 1 h, washed in SB, and then post-fixed with 1.5% OsO4 in SB for 16 h in 4°C in the dark. Fixed oocytes were washed with chilled H2O and post-fixed/stained with 2% uranyl acetate in water on ice. Samples were then dehydrated with an ethanol series, embedded in Quetol 651 resin and heat-polymerized at 60°C for 72 h. Resin-embedded oocytes were then sliced to 800 nm thick sections using a glass knife on Leica UC6 ultramicrotome, collected on glass slides, stained with toluidine blue, and examined under a light microscope. Sections containing nuclei were re-embedded in epon-durcupan blocks and used for preparation of ultrathin sections using a diamond knife. Eighty nm thick sections were placed on formwar-coated slot grids, post-stained with 2% uranyl acetate and visualized using Jeol JEM-1011 TEM operated at 80 kV. Images were captured by a side mounted Olympus Veleta CCD camera.
Single-molecule fluorescence in situ hybridization (smFISH)
Fixed oocytes (30–45 min in 4% paraformaldehyde) were pretreated for 10 min at RT in protease III (RNAScope H2O2 and Protease Reagents kit, Cat. No. 322381, ACD; diluted 1:15 in nuclease-free water) and proceeded to hybridization with probes for C86187/Sirena1 (NR_015609.1, targeted region 655–1996, 20 ZZ pairs, Cat. No. 563151), Polr2a (NM_009089.2, targeted region 2802–3678, 20 ZZ pairs, Cat. No. 312471), and DapB negative control (EF191515, targeted region 414–862, 10 ZZ pairs, Cat. No. 310043). Probes were hybridized for 2 h at 40°C. The RNAScope Multiplex Fluorescent Detection Reagents v2 kit (Cat. No. 323110, ACD) was used for probe detection with extended wash times in 1× wash buffer (RNAScope Wash Buffer Reagents, Cat. No. 310091, ACD; diluted in nuclease free water): 2 × 10 min after probe hybridization, and 2 × 5 min after each step. ¨The following steps were performed according to the manufacturer's instructions: amplification was applied using v2 Amp1-3 reagents (v2 Amp1 for 30 min at 40°C, v2 Amp2 for 30 min at 40°C, and v2 Amp3 for 15 min at 40°C); HRP-C1 (15 min at 40°C); TSA Cy5 dye (Perkin Elmer; diluted 1:1500 in TSA buffer, ACD) 30 min at 40°C, HRP-blocker 30 min at 40°C. Oocytes were mounted in Prolong Gold Antifade Mountant with DAPI (Life Technologies) on epoxy coated slides (Thermo Scientific). Samples were scanned using inverted confocal microscope Leica SP5.
Image analysis
The images were processed using the LASX and FIJI software (16); the results were statistically analyzed in Matlab software (Release 2018b, The MathWorks, Inc., Natick, MA, USA).
For mitochondrial cluster analysis in individual oocytes (Figure 9C), an Otsu threshold was calculated for the whole image stack for each oocyte. Subsequently, 3D Objects Counter (17) with minimum 10 voxels and calculated Otsu threshold were used to segment and compute the volume of each spot representing mitochondrial clusters in oocytes. Due to the non-normal distribution of the volumes, the median spot volume value was computed for each oocyte, and the values were pooled for both wild-type and Sirena1−/− genotype for each measurement. Wilcoxon rank-sum test was used to compare the median values of the measured volumes of wild-type and Sirena1−/− genotypes for each measurement.
Mean oocyte mitochondrial signal (Figure 9B) was measured in each oocyte in a 1 μm confocal section positioned through the nuclear center. The same confocal section was used for mitochondrial radial profile analysis (Figure 9D) using Radial Profile Extended ImageJ plugin provided by Philippe Carl (University of Strasbourg, http://questpharma.u-strasbg.fr/html/radial-profile-ext.html). The radial profile data were tested for the difference in distribution along the radius using Repeated Measure ANOVA analysis (NCSS11 Statistical Software), and the regular probability level was used.
RNA sequencing
Total RNA was extracted from 25 wild-type or Sirena1 knock-out oocytes from 11 (GV) or 13–16 (MII) week old animals using the PicoPure RNA Isolation Kit with on-column genomic DNA digestion according to the manufacturer's instructions (Qiagen). Each sample was spiked with 0.2 pg synthesized Renilla luciferase mRNA before extraction. RNA-Seq libraries were constructed using the Ovation RNA-Seq system V2 (NuGEN) followed by Ovation Ultralow Library system (DR Multiplex System, NuGEN). RNA-Seq libraries were pooled and sequenced using 65-nt single-end-sequencing using Illumina HiSeq. All high-throughput datasets used in this work are listed in Supplementary Table S2. The code used for sequencing data analysis is available through GitHub: https://github.com/fhorvat/bioinfo_repo/tree/master/papers/Sirena1_2019.
Bioinformatic analysis
Coding potential analysis
The Sirena1 transcript sequences were downloaded from GenCode vM23 (4); we used four annotated transcripts: ENSMUST00000209331.1 (C86187-201); ENSMUST00000209497.1 (C86187-202); ENSMUST00000210486.1 (C86187-203); ENSMUST00000210794.1 (C86187-204). The present ORF regions were identified using TransDecoder software (http://transdecoder.github.io); the same software was used for translation into the peptide sequences. Only peptides containing seven and more amino acids were further analyzed. The set of peptide sequences present in oocytes was built from experimentally obtained proteomic data (18–21). The proteomic data were downloaded from PRIDE Archive (22) or from supplemental information. All the peptide sequences found in the oocytes were matched against the peptides identified in Sirena1 transcripts. Only perfect matches were counted. The results were summarized in Supplementary Table S3.
RNA-seq mapping and expression analysis
All RNA-seq data were mapped onto the indexed mm10 mouse genome using STAR 2.5.3a (23) as previously described (24). Read mapping coverage was visualized in the UCSC Genome Browser by constructing bigWig tracks using the UCSC tools (25). Differential expression analysis was done in the R software environment (http://www.r-project.org/) using the DESeq2 package (26) as previously described (24). GO annotation analysis and visualization was done using the clusterProfiler (27) R package. Small RNA-seq data were preprocessed and mapped onto the mm10 genome as previously described (28). After mapping, 21–23 nt long reads perfectly matching the genome sequence were selected.
Differential expression analysis of microarray data
Microarray data from Affymetrix Mouse Genome 430 2.0 Array (Lhx8 and Nobox knock-out data) were normalized and background corrected using the RMA procedure (29). Data from the VMSR Mus 20K cDNA array was background corrected using the normexp method (30) and normalized using the loess method (31). Statistical significance and fold changes in gene expression were computed using the limma package (32).
RESULTS
Characterization of Sirena1, the most abundant lncRNA in mouse oocytes
Originally annotated as murine expressed sequence C86187 (4), the Sirena1 gene resides on chromosome 7qB between Spty2D1 and Uevld, and its transcript level in oocytes is at least fifty times higher than that of neighboring genes (Figure 1A). Sirena1 transcript models (9) revealed five alternatively spliced exons with common first and last exons. The majority of transcripts are represented by a 2057 nucleotide (nt) long transcript composed of the first and the last exon; the second most common transcript has 2415 nt and is composed of exons 1, 3, 4 and 5. The first exon carries a processed pseudogene of Elongin B (Elob) in antisense orientation. Exon 3 was exapted from an L1 sequence. The Sirena1 locus also includes a weak alternative transcription start site 30 nt downstream of exon 1.
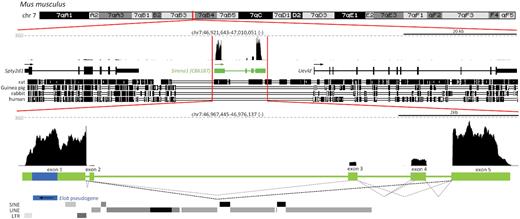
Genomic organization of the Sirena1 locus in the mouse genome. Shown is composition of UCSC genome browser snapshots depicting the Sirena1 locus and its expression in a fully grown GV oocyte from total RNA-seq (37). The Sirena1 gene is localized on chr. 7 between Spty2d and Uevld genes; all three genes have the same transcriptional orientation. Expression maximum is indicated by a grey dashed line and the counts per million (CPM) value at its beginning. Dashed angular lines depict alternative splicing events observed in the RNA-seq data. The black angular dashed line depicts the most common splice variant identified during lncRNA annotation in oocytes (9). The blue rectangle represents the Elob antisense pseudogene fragment in the first exon, the black arrow indicates sense orientation of the pseudogene.
Sirena1 is a non-coding RNA gene, as suggested by the Coding Potential Assessment Tool (CPAT (33)) and the Coding Potential Calculator (CPC) (34). None of the predicted open reading frames (ORFs) originating from Sirena1 transcripts has a Kozak-related sequence (Supplementary Table S3). Only one short ORF (18 aminoacids) in exon 4 (Supplementary Table S3), which is absent in the dominant Sirena1 transcript, is conserved in the rat genome. Moreover, there is no evidence for translation of any of the predicted ORFs in four published proteome datasets from mouse oocytes (18–21) despite the high level of Sirena1 expression; it is by far the most abundant lncRNA among the 1600 annotated lncRNAs in mouse oocytes and zygotes (9). In fact, Sirena1 ranks among the top 10 most expressed genes in oocytes with a transcript level as abundant as Zp3 mRNA (Figure 2A), which has ∼240 000 copies per oocyte (35). Consistent with high oocyte-specific expression, Sirena1 was detected in the ovary but not in other tissues of the ENCODE mouse tissue RNA-seq panel (36) (Figure 2B). smFISH showed that Sirena1 localizes to the cytoplasm and is enriched in the perinuclear region of GV oocytes (Figure 2C).
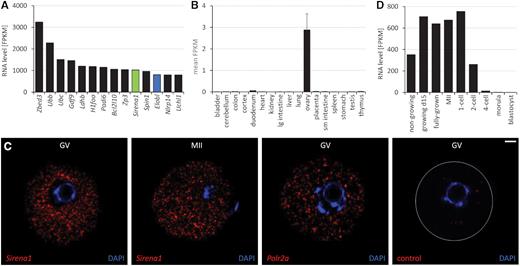
Sirena1 expression (A) Most expressed genes in fully-grown GV mouse oocytes. Gene expression in fragments per million per kilobase (FPKM) was estimated from total RNA-seq data (37). Sirena1 transcript abundance was estimated from reads mapping to the first and the last exon. (B) Sirena1 expression in mouse tissues. Expression was estimated as FPKM from the ENCODE polyA RNA NGS mouse tissue raw data (GSE49417 (36)). Error bars = standard deviation (SD). (C) Localization of Sirena1 in GV and MII oocytes by smFISH. As a positive control, we used Polr2a, as a negative control, bacterial DapB RNA (control). Shown is a 5 μm slice made of a maximum projection of 0.5 μm confocal sections. RNA staining signal is red, DNA labeled with DAPI is blue. Size bar = 10 μm. (D) Temporal pattern of expression of Sirena1 (C86187 splice variant) during oocyte development and in early embryos based on RNA-seq data (8,37).
RNA-seq data show that the Sirena1 transcript is abundant in oocytes already in the primordial follicle stage (2 days post partum) (8,37). It remains highly abundant until the 1-cell stage, and becomes rapidly degraded after the first cleavage (Figure 2D). The oocyte-specific expression of Sirena1 depends on the FIGLA, LHX8, and NOBOX maternal transcription factor network, as evidenced by reduced Sirena1 expression in Figla, Lhx8 and Nobox knock-outs (38,39) (Supplementary Figure S1). NOBOX seems particularly important; its knock-out has a minor effect on Figla and Lhx8 expression but has a strong effect on Sirena1, which is among a few strongly downregulated genes (Supplementary Figure S1).
Evolutionary history of Sirena1
The protein-coding genes Spty2D1 and Uevld flanking the Sirena1 gene are syntenic across mammals (Figure 3). The entire locus including Sirena1 is conserved in the rat genome. However, the Sirena1 sequence was not found in gerbil and hamster genomes, which phylogenetically separated before the last common ancestor of Mus musculus and Rattus norvegicus. The absence of Sirena1 in gerbil and hamster genomes is supported in Acomys, Meriones and Cricetulus genomes, whose assemblies do not contain annotated gaps between Spty2D1 and Uevld genes (Figure 3). Since Mesocricetus genome assembly contained a gap in the Sirena1 locus, we performed de novo transcriptome assembly of our RNA-seq data from its oocytes (40) and did not identify any hamster transcripts with significant similarity to Sirena1. Taken together, Sirena1 appeared in the mouse ancestor between the mouse/gerbil split but before the mouse/rat split, which occurred 16–23 million years ago (MYA) (41–43).
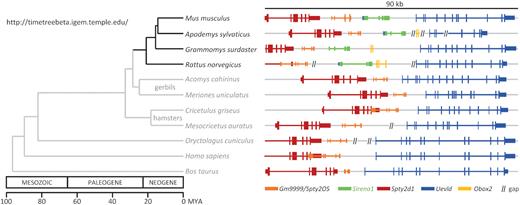
Evolutionary origin of Sirena1. Positions of Spty2d and Uevld genes in mammalian genomes are syntenic. The Sirena1 gene (depicted in green) can be identified in the mouse and rat genomes, but not in gerbils and hamsters. The phylogenetic tree depicting the phylogenetic relationship of the analyzed species was generated with Timetree (82).
To characterize the rat Sirena1 ortholog in more detail, we performed RNA-seq analysis of rat fully-grown GV oocytes and analyzed the transcriptional landscape of the Sirena1 locus (Figure 4). Similarly to the mouse oocyte, we observed high expression of Sirena1 between low-expressed Spty2D1 and Uevld. However, the locus exhibited several rat-specific differences caused by multiple retrotransposon insertions, which particularly remodeled the Sirena1 gene at the 5′ end and in the region syntenic to mouse exon 3 (Figure 4). Consequently, the rat Sirena1 gene acquired a truncated exon 1, whose transcription initiates after the Elob antisense pseudogene region. Absent in the rat genome are also equivalents of mouse Sirena1 exons 2 and 3. In addition, the rat Sirena1 gene has three rat-specific exons, which evolved at the 5′ end; two of them appear to be 5′ exons and one of them an internal exon. The 3′ end of Sirena1, i.e. exons 4 and 5, appears well conserved. Similarly to the mouse, most rat Sirena1 transcripts are composed of the first and the last exon.
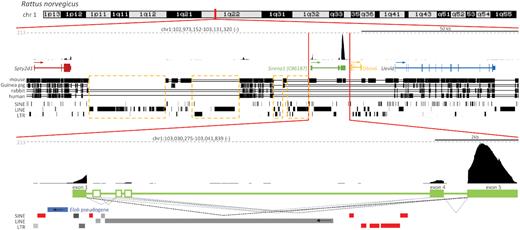
Genomic organization of the Sirena1 locus in the rat genome. Shown is the composition of UCSC genome browser snapshots depicting the Sirena1 locus and its expression in fully grown GV oocyte RNA-seq as in Figure 1A for the mouse ortholog. Dashed angular lines depict alternative splicing events observed in the RNA-seq data. The black angular dashed line depicts the most common splice variant. Dashed yellow rectangles depict upstream regions that evolved in the rat lineage differently because of retrotransposon insertions. The blue rectangle depicts the Elob antisense pseudogene fragment upstream of the first exon. Red rectangles depict rat-specific retrotransposon insertions in the Sirena1 locus.
Notably, the Grammomys Sirena1 lacks the Elob pseudogene insertion, suggesting that it was deleted during Grammomys evolution, while Apodemus Sirena1 is highly similar to the mouse Sirena1 (Figure 3). The divergence of the 5′ end structure and the conservation of the 3′ end between rat and mouse orthologs is interesting, because these two regions carry the predicted functional sequence elements: (i) the antisense pseudogene sequence at the 5′ end could basepair with Elob mRNA and function as its suppressing element through RNAi and (ii) the 3′ end carries an AU-rich motif predicted to regulate Sirena1 by cytoplasmic polyadenylation during meiotic maturation (9).
Cytoplasmic polyadenylation of Sirena1 transcripts
We noticed that Sirena1 (listed as lncRNA exon cluster lncRNA-OET-07-157) is enriched in poly(A)-selected RNA-seq data from matured MII oocytes and carries a UUUUAAU motif 117 nt upstream of its poly(A) signal (9). Sirena1 could be subjected to cytoplasmic polyadenylation, being cytoplasmic and enriched in the perinuclear space in GV oocytes (Figure 5A).
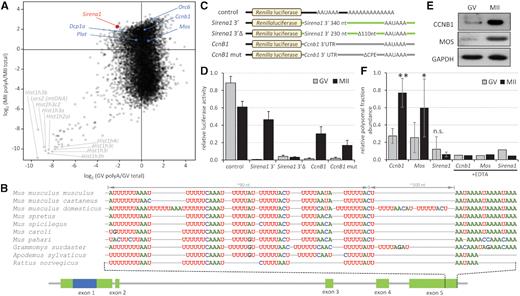
Cytoplasmic polyadenylation of Sirena1. (A) Sirena1 RNA abundance in RNA-seq data indicates cytoplasmic polyadenylation during meiotic maturation. The plot depicts the ratios of poly(A)-selected RNA-seq data (44) relative to total RNA-seq data (37), positive numbers and negative log2 values indicate enrichment and depletion of transcripts in poly(A)-selected RNA-seq data, respectively. In blue are labeled dormant mRNAs with a short poly(A) tail in GV oocytes, which undergo polyadenylation during meiotic maturation. Gray labels depict histone and mitochondrial genes underrepresented in poly(A)-selected RNA-seq data. (B) Sequence organization and conservation of the 3′end of Sirena1. Depicted are putative CPE elements ∼100 nucleotides from the poly(A) signal in ten rodent genomes. (C) Schematic design of reporters for analysis of cytoplasmic polyadenylation. Renilla luciferase reporter (control) was polyadenylated, other reporters were not polyadenylated. (D) Relative luciferase activity of microinjected reporters. Reporters were microinjected into GV oocytes, which were either matured for 20 h (MII) or cultured in the presence of milrinone, which prevents resumption of meiosis (GV). Activity was calculated as luciferase activity of each Renilla reporter divided by a co-injected polyadenylated firefly reporter standard. Error bars = SD. (E) Western blot analysis of MOS and CCNB1 proteins in fully-grown GV oocytes and MII eggs. (F) Relative abundance of Mos, Ccnb1, and Sirena1 transcripts in the polysomal fraction in GV oocytes and MII eggs. Three independent experiments were performed, error bars = SD. *P < 0.05 and **P < 0.01, n.s. = not significant (paired t-test). In a control experiment in the right half of the graph, polysomes were disrupted during fractionation by adding EDTA. The control experiment was performed once as a technical duplicate, shown is the average value.
First, we reproduced our earlier result showing that Sirena1 is enriched in poly(A)-selected RNA-seq data from MII stage relative to GV oocytes, which implied that Sirena1 undergoes cytoplasmic polyadenylation during meiotic maturation (Figure 5A). We used an independent recently published poly(A)-selected RNA-seq dataset from GV oocytes and MII eggs (44) and compared it with RNA-seq of total RNA from the same stages (37). The relative enrichment/depletion of mRNAs in poly(A)-selected samples should indicate deadenylation and polyadenylation trends. Consistent with cytoplasmic polyadenylation during meiosis and our previous data, the Sirena1 transcript was relatively under-represented in the poly(A) fraction (∼4-fold) in GV oocytes but over-represented (∼4-fold) in matured MII eggs (Figure 5A).
Cytoplasmic polyadenylation employs a cis-acting CPE sequence located near the poly(A) signal AAUAAA (reviewed in (45)). We thus analyzed putative CPEs in the 3′ end of Sirena1 orthologs in three Mus musculus subspecies (musculus, castaneus and domesticus), four other species of the Mus genus (spretus, spicilegus, caroli and pahari), Grammomys surdaster, Apodemus sylvaticus and Rattus norvegicus. Sequence alignment revealed a complex ∼90 nucleotide-long region upstream of the poly(A) signal, which carries up to nine consecutive U-rich motifs (Figure 5B). Four of such motifs were present in the rat genome; other species contained at least six of them. They either were the canonical ‘strong’ CPE sequences (UUUUAAU and UUUUAU) or the ‘weak’ ones (UUUUACU and UUUCAU) (45), or were similar to CPE. The U-rich element UUUUUUCAAAU was completely conserved in all genomes examined. Except for Mus pahari, which carried two weak CPEs and did not contain the poly(A) signal in the same position, each genome carried at least one strong and two weak CPE sequences. The Mus musculus musculus gene had two strong and two weak CPEs, while the rat gene carried three strong CPE sequence,s but not in identical positions as those in the Mus musculus musculus gene. Sequence analysis thus supported the existence of CPE-like sequences at the 3′ end of the Sirena1 locus in the Murinae subfamily.
The enrichment of Sirena1 transcript in MII poly(A)-selected RNA-seq data and the presence of a putative CPE region provided circumstantial evidence that Sirena1 undergoes cytoplasmic polyadenylation during meiotic maturation. However, adoption of this type of regulation by a lncRNA would be unusual, because it is common for temporal control of translation of dormant maternal mRNAs upon resumption of meiosis (reviewed in (46)). To test the functionality of the putative CPE region, we tested whether the Sirena1 3′ end fused as a 3′ UTR to a Renilla luciferase reporter would induce translation during meiotic maturation. The experimental set up based on microinjection of in vitro transcribed reporters (Figure 5C) was similar to that used for testing dormancy of decapping (47). Polyadenylated Renilla luciferase reporter mRNA served as a control for normal reporter translation. The remaining Renilla reporters were microinjected without polyadenylation. For the Sirena1 3′ reporter, the last 340 nt of the 3′ terminal exon were inserted after the Renilla luciferase coding sequence. As a negative control, we produced a Sirena1 3′Δ reporter lacking the U-rich 90 nt region. As a positive control for CPE-induced translation, we used the 3′ UTR of Cyclin B1 (Ccnb1), a well-known example of dormant maternal mRNA (48). The CcnB1 reporter contained an intact Ccnb1 3′ UTR and CcnB1 mut had the most active CPE deleted. To normalize for variable injection volumes, oocytes were co-injected with an equal amount of polyadenylated firefly luciferase reporter mRNA.
Upon reporter microinjection into fully-grown GV oocytes, a half of oocytes were matured in vitro to MII and assayed for luciferase activity, while the second half were cultured in the presence of Milrinone, a phosphodiesterase inhibitor blocking resumption of meiosis (49). Milrinone-treated oocytes thus remain at the GV stage and do not mobilize dormant mRNAs. In contrast to the polyadenylated Renilla reporter, there was minimal expression of deadenylated reporters in the GV oocytes (Figure 5D). Remarkably, the Sirena1 3′ reporter produced a 70-fold increase in luciferase activity upon meiotic maturation. This increase was even higher than that directed by the Ccnb1 3′ UTR (20-fold increase). Furthermore, deletion of the U-rich 90 nt region from the Sirena1 3′ end completely abolished the maturation-associated increase in luciferase activity. The CcnB1 mut reporter showed reduced luciferase activity by ∼50%, presumably because the CcnB1 mut reporter carried a mutation in only one of the four CPEs. Taken together, the U-rich region in the Sirena1 3′ end is a functional cis-acting element able to recruit non-polyadenylated mRNA for translation. However, unlike dormant maternal mRNA such as Mos and Ccnb1, which are translated during meiotic maturation (Figure 5E), Sirena1 did not exhibit any enrichment in the polysomal fraction isolated from MII eggs (Figure 5F). When EDTA was added to the preparation to disrupt polysomes, the relative abundance of dormant RNAs in the polysomal fraction fell <10% (Figure 5F). This experiment thus further supports the model that Sirena1 is an lncRNA carrying a functional CPE element uncoupled from translation control.
Role of Sirena1 in endogenous canonical RNAi
Mouse Sirena1 was among ∼100 annotated lncRNA loci containing pseudogene insertions transcribed in an antisense orientation (9). Such lncRNAs could basepair with complementary mRNAs in trans to produce double-stranded RNA (dsRNA) that could enter the canonical RNAi pathway, an essential post-transcriptional control mechanism in the oocyte (50–53). During canonical RNAi, long dsRNA is processed by RNase Dicer into 21–23 nt siRNAs, which guide sequence-specific cleavage of complementary sequences by Argonaute 2 (AGO2). LncRNAs carrying antisense pseudogenes, such as Sirena1, thus can serve as precursors for siRNAs regulating parental protein-coding genes.
Sirena1 harbors in its first exon an antisense-oriented pseudogene of Elongin B (Elob, also named Tceb2). ELOB is an animal protein originally found as a transcription factor SIII component of the RNA polymerase II elongation complex (54). Mammalian ELOB serves as an adaptor protein bridging substrate receptor to the Cullin 2 protein in E3 ubiquitin ligase complex and has been implicated, for example, in downregulation of HIF-1α and monoubiquitination of histone H2B (55–57). The role of ELOB in mammalian oocytes is unknown.
The mouse genome contains 12 loci harboring an Elob pseudogene (Supplementary Table S4). Three genomic loci are relevant for Elob siRNA production (Figure 6A). The primary source of antisense Elob RNA in the genome is the Sirena1 locus. One sense RNA comes from the Elob gene itself, which has low expression relatively to Sirena1 (Supplementary Table S4). Further sense RNA capable of basepairing with Sirena1 is produced from chromosome 11, which carries a tandem duplication of the Elob-like (Elobl) gene. Elobl is an Elob paralog formed from a pseudogene insertion, which was recycled into a protein-coding gene by a retrotransposon insertion similarly as Speer5-ps1 (40). Elobl is also highly expressed (ranks among the most expressed genes in oocytes, Figure 2A) and has an open reading frame, which is apparently translated (18,19).
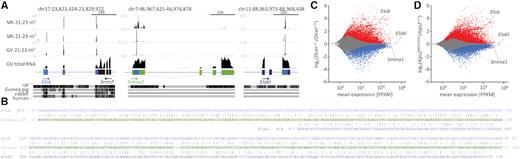
Elob regulation by RNAi through Sirena1. (A) Shown is expression and 21–23 nt small RNAs in Elob, Elobl and Sirena1 loci. Each locus scheme was built from UCSC browser snapshots containing four tracks. Three of them display RNA-seq data of small RNA from GV oocytes (52) or MII eggs (71,72), the fourth displays total RNA (37). Dashed lines represent maximum CPM values written at their beginning. At the bottom, conservation tracks for four mammalian genomes are shown. The Elob locus contains convergent transcription of Elob (blue) and Srrm2, which does not produce small RNAs. Elob can basepair with the Sirena1 transcript produced in trans. The Sirena1 transcript carries antisense oriented Elob pseudogene. The Elobl locus contains the Elob pseudogene, which has been incorporated into the last exon of a transcript driven by a RMER6BA retrotransposon-derived promoter. (B) Basepairing of the Sirena1 transcript with Elob and Elobl mRNAs. (C) MA plot of gene expression in Dicer knock-out oocytes. (D) MA plot of gene expression in oocytes expressing catalytically inactive AGO2. RNA-seq data come from (59).
An important aspect of dsRNA production by Sirena1 and Elob/Elobl transcripts is that the three loci are syntenic between mouse and rat, hence their sequences started to diverge already before the mouse/rat split 16–23 MYA (41–43). Consequently, dsRNA formed by Sirena1 and Elob/Elobl transcripts has many imperfections (Figure 6B), which could reduce the efficiency of processing by Dicer and targeting by AGO2, as AGO2-mediated cleavage requires extensive basepairing (58). It could also explain why siRNAs come from small regions along the Elob sequence overlap (Figure 6A).
To examine whether RNAi has any impact on expression of Elob, Elobl or Sirena1, we examined the transcriptomes of oocytes lacking Dicer or expressing catalytically inactive AGO2 (Ago2DAH allele) (59). Elob mRNA levels were increased about three fold in both mutants (Figure 6C,D), which is consistent with the idea that Sirena1-derived antisense siRNAs efficiently target Elob. The increased Elob mRNA level in the catalytically inactive AGO2 demonstrates that there is enough Sirena1 transcript-derived antisense siRNAs to guide cleavage of Elob mRNA (Figure 6D). We did not observe any strong effect on the Sirena1 abundance. A minor (5.3%) but significant increase was present in the Dicer knock-out. Elobl did not show any significant upregulation in either mutant. Elobl basepairing with Sirena1 RNA is actually shorter and more deteriorated than that of Elob and Sirena1 (Figure 6B); Elobl may thus represent an RNAi target that has escaped suppression. However, given the extremely high Elobl expression, it is also possible that endogenous RNAi is not potent enough to downregulate it.
Taken together, the available data are consistent with the model where Sirena1 remains the source of functional antisense siRNAs suppressing Elob expression in the oocyte despite the evolutionary divergence, while RNAi-mediated suppression of Elob was lost during rat evolution upon losing the Elob pseudogene sequence from the first exon of Sirena1.
Loss of function analysis of Sirena1
To investigate the role of Sirena1, we generated a mutant mouse model by making ∼1.7 kb deletion including the promoter and exon 1 (Figure 7A). The deletion of chr7: 46 974 556–46 976 233 sequence was identified by PCR and confirmed by sequencing (Supplementary Figure S2A). The loss of Sirena1 expression in oocytes of Sirena1−/− mice was validated by qPCR (Figure 7B) and in situ hybridization (Figure 7C).
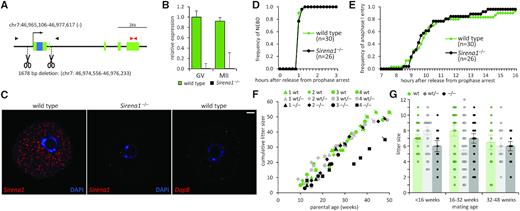
Sirena1 knock-out. (A) Schematic depiction of CRISPR cleavage sites in the Sirena1 locus. (B) qPCR analysis of Sirena1 expression in knock-out oocytes. Error bars = SD. (C) smFISH of Sirena1 in wild-type and knock-out GV oocytes. Shown is a 0.5 μm confocal section. Red color marks RNA staining, blue color marks DNA labeled with DAPI. The DapB probe set served as a negative control. Size bar = 10 μm. (D) Quantification of nuclear envelope breakdown (NEBD) in Sirena1−/− and wild-type oocytes resuming meiosis. The number of analyzed oocytes is indicated in brackets. (E) Quantification of entry of Sirena1−/− and wild-type oocytes into anaphase I of meiosis. The number of analyzed oocytes is indicated in brackets. (F) Long-term breeding experiment with four breeding pairs where both parents had the same genotype. The Y axis depicts the cumulative litter size of each breeding pair. A symbol crossed with a line indicates the last litter of each breeding pair. (G) Breeding performance of all females with indicated genotypes mated before 16 weeks, 16–32 weeks and 32–48 weeks of age. Error bars = SD.
Sirena1−/− mice did not exhibit any apparent phenotype. Sirena1−/− fully-grown GV oocytes appeared normal and were recovered from mice in usual amounts. We analyzed meiotic maturation of Sirena1−/− oocytes using time-lapse confocal microscopy. The analysis did not reveal any difference from wild-type oocytes. This included the timing and frequency of nuclear envelope breakdown (Figure 7D), timing and frequency of anaphase I entry (Figure 7E), polar body extrusion, spindle appearance, chromosomal alignment in metaphase I, and chromosome segregation errors in anaphase I (Supplementary Figure S2B–E and Supplementary Files 1 and 2).
To examine developmental competence, we analyzed the breeding performance of Sirena1 mutant homozygotes and heterozygotes (Table 1). The average litter size of breeding Sirena1−/− females with Sirena1−/− males from all matings was 6.4 ± 0.7, which was not significantly different from the average litter size of wild-type parents (7.4 ± 0.9) or the published average C57BL/6 litter size (6.2 ± 0.2 (60)). Furthermore, breeding of Sirena1−/− females with wild-type males yielded the same litter size (7.5 ± 1.3) as breeding of wild-type animals.
Breeding performance of Sirena1 mutants
| M × F | Litter # | Born # | Litter size | M | F | +/+ | +/− | −/− | Dead |
|---|---|---|---|---|---|---|---|---|---|
| +/+ × +/+ | 27 | 200 | 7.4 ± 0.9 | 94 | 102 | 196 | 0 | 0 | 4 |
| +/+ × +/− | 29 | 179 | 6.2 ± 1.1 | 82 | 88 | 90 | 80 | 0 | 9 |
| +/− × +/− | 36 | 229 | 6.5 ± 0.8 | 112 | 110 | 69 | 107 | 46 | 7 |
| +/+ × −/− | 8 | 60 | 7.5 ± 1.3 | 24 | 35 | 0 | 59 | 0 | 1 |
| −/− × −/− | 29 | 186 | 6.4 ± 0.7 | 87 | 95 | 0 | 0 | 182 | 4 |
To test the breeding performance of Sirena1 mutants over a long period, we set up four young breeding pairs (∼7 weeks old) with three different parent genotype combinations: wild-type (Sirena1wt/wt × Sirena1wt/wt), heterozygotes (Sirena1wt/– × Sirena1wt/–) and knock-outs (Sirena1−/− × Sirena1−/−). The breeding pairs were continuously mated and their litters weaned until almost 50 weeks of age. Knock-out matings seemed to produce the first litter on average two weeks later than wild-type animals and seemed to have a slightly lower (∼one pup) cumulative litter size until ∼20 weeks of age (Figure 7F), but the difference in the average litter size in animals under 16 weeks of age was not significant. At later age, two of the four knock-out breeding pairs stopped producing progeny ∼30 weeks of age, while all four wild-type matings produced progeny at least ten weeks longer (Figure 7F). However, the two remaining knock-out breeding pairs produced progeny beyond 40 weeks of age. One of the knock-out matings showed the same breeding performance as wild-type matings. The other had had two litters separated by ∼10 weeks, but recovered and produced four additional litters after 30 weeks of age. Importantly, we did not observe any significant effect on the litter size when we stratified all matings according to the female age to test for fertility issues associated with age (Figure 7G). These data demonstrate that Sirena1 mutants have normal breeding performance under laboratory conditions.
Transcriptome changes in Sirena1−/− oocytes
In the quest for understanding the role of Sirena1 in oocytes, we performed RNA-seq analysis of GV oocytes and MII eggs from Sirena1−/− animals and their wild-type littermates obtained upon heterozygote matings. The comparison of transcriptomes from wild-type and mutant oocytes revealed minimal transcriptome changes (Figure 8A, Supplementary Table S5). Remarkably, Sirena1−/− MII oocytes had even less expression changes than Sirena1−/− GV oocytes. No cis effect was observed on the neighboring genes (Figure 8B and Supplementary Figure S3). Elob showed the most increased relative mRNA abundance (>2-fold, Figure 8A). Elob mRNA upregulation in Sirena1−/− GV and MII stages was confirmed by qPCR (Figure 8C). This provided another line of evidence of the trans-acting inhibitory impact of Sirena1−/− on Elob.
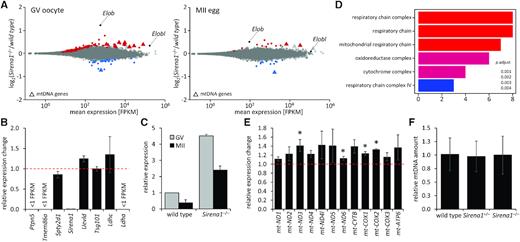
Gene expression analysis of Sirena1−/− oocytes. (A) MA plots depict gene expression in fully-grown GV oocytes (left) and MII eggs (right). Significantly upregulated transcripts are depicted in red, the downregulated ones in blue. Triangles represent genes encoded by mtDNA. (B) Relative expression change of the neighboring genes. (C) qPCR validation of the increased abundance of Elob transcript in Sirena1−/− oocytes. (D) GO annotation analysis of the cellular component of transcriptome changes. (E) qPCR analysis of upregulation of mitochondrial genes; shown is expression of genes in Sirena1−/− GV oocytes relative to wild-type controls. * indicates P < 0.05. (F) Analysis of mitochondrial DNA amount. All error bars = SD.
Transcriptome analysis also revealed that 8/13 mRNAs encoded by the mitochondrial genome were upregulated in Sirena1−/− GV oocytes (Figure 8A). This was consistent with the gene ontology annotation of transcriptome changes in Sirena1−/− oocytes, which identified mitochondria-associated functions on top of the list (Figure 8D). Importantly, these changes concerned genes encoded by the mitochondrial genome; the expression of mitochondrial genes encoded by the nuclear genome was not affected. The upregulation of mitochondrial genes was relatively small, but could be confirmed by qPCR for several of them (Figure 8E).
The increase in mitochondrial mRNA levels could be either caused by increased mitochondrial gene expression, or by an increased number of mitochondria in Sirena1−/− oocytes. Therefore, we quantified the amount of mitochondrial DNA in Sirena1−/− oocytes by qPCR with specific primers amplifying different regions of the mitochondrial genome. We did not find any difference between Sirena1wt/wt, Sirena1wt/– and Sirena1−/− oocytes (Figure 8F), suggesting that the observed increase of mitochondrial mRNA levels in Sirena1−/− mutant comes from increased expression rather than from changes in the mitochondrial population size.
Mitochondrial distribution in oocytes of Sirena1 mutants
Since mitochondrial genes exhibited disturbed expression in Sirena1−/− oocytes, we examined mitochondria in wild-type and Sirena1−/− GV oocytes and MII eggs by confocal microscopy. For staining, we used MitoTracker Red CMXRos, a far red-fluorescent dye that accumulates in mitochondria based upon their membrane potential (61). Confocal sections of wild-type GV oocytes showed clustering of mitochondria in the perinuclear and subcortical regions (Figure 9A). Of note, Sirena1 localization by smFISH also showed increased perinuclear staining in GV oocytes (Figure 5A). In wild-type MII eggs, we observed mitochondrial clustering around the spindle domain (Figure 9A). Mitochondrial staining of Sirena1−/− GV oocytes appeared weaker in the perinuclear region, and the mitochondrial clusters appeared smaller (Figure 9A). Importantly, the overall fluorescence signal per oocyte was not significantly different between wild-type and Sirena1−/− GV oocytes (Figure 9B), which was consistent with qPCR analysis of mtDNA (Figure 8F) and would imply that mitochondria are rather redistributed than less active.
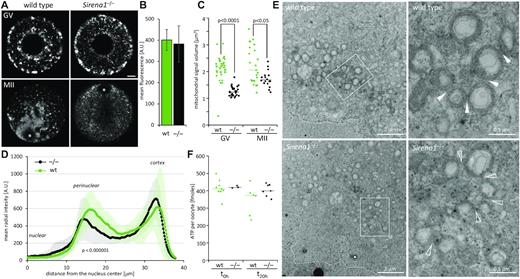
Changes in mitochondrial distribution in Sirena1−/− knock-out oocytes. (A) Confocal images of living GV and MII oocytes stained with MitoTracker. A single optical section is shown. Size bar = 10 μm. (B) Mean fluorescence signal per GV oocyte. Error bars = SD. (C) Quantitative analysis of the MitoTracker signal. Each data point represents the median size of mitochondrial clusters in an oocyte estimated as median mitochondrial signal volume (μm3) per oocyte from confocal microscopy data. (D) Mitotracker signal distribution analyzed as mean radial intensity from the nucleus center. (E) Transmission electron microscopy of wild-type and Sirena1−/− oocytes. The dashed line indicates position of the nuclear envelope. The white rectangle indicates the region magnified in the neighboring panel. Filled arrowheads point to contacts between mitochondria; empty arrowheads point to absenting contacts between mitochondria. (F) Quantification of ATP in Sirena1−/− and wild-type oocytes using the Adenosine 5′-triphosphate (ATP) bioluminescent somatic cell assay kit (FLASC). GV oocytes were denuded and analyzed immediately (t0 h), or were cultured without cumulus cells for an additional 20 h in the presence of IBMX (t20 h). Each data point represents one estimation of ATP level per oocyte, the horizontal line represents the mean.
This notion was confirmed by quantitative image analysis, which showed that wild-type oocytes have significantly larger median volume of the mitochondrial cluster size than knock-out GV oocytes (Figure 9C). The difference in the median volume of mitochondrial signal in MII eggs was lower but still statistically significant (Figure 9C). Similarly, Sirena1−/− GV oocytes had significantly different mitochondrial distribution showing reduced perinuclear accumulation (Figure 9D).
We also examined the mitochondrial distribution and morphology at the ultrastructural level by transmission electron microscopy (Figure 9E). Mitochondria in the perinuclear area in wild-type oocytes appeared more clustered, i.e., seemed to have more direct contacts with each other than mitochondria in the Sirena1−/− oocytes, which appeared more dispersed (Figure 9E). Similar to wild-type, mitochondria in Sirena1−/− GV oocytes do retain their distinct spherical appearance with transverse or peripheral cristae and lighter areas inside. Such appearance is common for animal ovarian oocytes, where mitochondria are metabolically quiescent (62,63). Electron microscopy data were thus consistent with confocal microscopy MitoTracker staining described above (Figure 9A–D).
Finally, we examined whether changes in the mitochondrial gene expression and perinuclear redistribution of mitochondria would have an effect on ATP levels in fully-grown GV oocytes. Analysis of ATP levels did not reveal any difference between wild-type and Sirena1−/−oocytes. The analysis included quantification of ATP in denuded oocytes cultured for 20 h in the presence of IBMX in order to assess the ATP levels without effects of ATP produced in cumulus cells (Figure 9F).
Taken together, the loss of Sirena1 in oocytes was accompanied by redistribution of mitochondria in the perinuclear region of fully-grown GV oocytes and with mildly increased expression of the majority of mitochondrial genome-encoded genes. At the same time, we did not observe any impact on the mitochondria number, ultrastructure, and ATP levels in Sirena1−/− oocytes.
DISCUSSION
LncRNAs have emerged en masse from transcriptome analyses as pol II-transcribed genes whose numbers constantly grow over protein-coding genes as RNA-seq data from more cells, tissues and organs are being analyzed and annotated. Functional analysis of lncRNAs is challenging and function has only been assigned to a small fraction of lncRNAs, while it is not clear what fraction of lncRNAs has a measurable effect beyond being transcribed and processed through the RNA metabolism. Annotation of mouse maternal lncRNAs brought up interesting features such as antisense pseudogene-carrying lncRNAs, presence of putative CPE elements, and contribution of retrotransposons to their evolution (8,9,40), but the roles of maternal lncRNAs remain unexplored. We analyzed Sirena1, a maternal lncRNA unique in many aspects while also exhibiting many common features of lncRNAs.
Sirena1 is a relatively young gene, which is absent in hamsters and gerbils; this places its first appearance somewhere between 20 and 30 MYA. LncRNA evolution is often impacted by retrotransposon insertions (reviewed in (64)). Indeed, retrotransposon insertions strongly contributed to the Sirena1 gene structure, particularly its 5′ half. In the mouse gene, exons 1, 2 and 3 contain retrotransposon sequences; exon 3 is entirely derived from the (–) strand of the L1 sequence. The rat Sirena1 gene was further affected by retrotransposon insertions, which remodeled the 5′ end, but enhancers for maternal Sirena1 expression apparently remained intact.
Sirena1 evolved into the most expressed lncRNA in the mouse oocyte and 1-cell zygote; it is among the 10 most expressed genes in mouse oocytes and is present in around a quarter of a million copies per oocyte. For comparison, somatic cells contain 100 000 to 600 000 mRNAs per cell (65–68) and 250 000 molecules correspond to ∼1% of maternal poly(A) transcripts (an oocyte contains 17–27 × 106 poly(A) RNAs (69,70)). The high oocyte-specific expression of Sirena1 is controlled through the oocyte-specific transcription factor network, from which NOBOX stands out as the main candidate driving Sirena1 expression. Given the expression level of Sirena1 in rat oocytes, maternal expression seems to be an ancestral feature.
Mouse Sirena1 is a cytoplasmic lncRNA with increased abundance in the perinuclear space, which combines two remarkable features. The first is the presence of a conserved CPE cluster at its 3′ end, which is sufficient to induce cytoplasmic polyadenylation and translation when fused with a protein-coding reporter. Given the conservation of the CPE cluster in the rat and mouse genomes, this feature is also likely ancestral. Its functional significance is unclear but likely contributes to high accumulation of Sirena1 transcripts in fully-grown oocytes. Implicitly, Sirena1 must form ribonucleoprotein complexes with factors controlling deadenylation and cytoplasmic polyadenylation through CPE elements, particularly CPE-binding proteins (CPEB). The exceptional transcript abundance and multiple CPE sites at its 3′ end make Sirena1 one of the most significant binders of CPEB in mouse oocytes. However, the loss of Sirena1 has no impact on progression of meiotic maturation, arguing that Sirena1 does not significantly influence the CPEB-mediated control of dormant genes.
The second remarkable feature of the Sirena1 transcript is the antisense oriented Elob pseudogene insertion, which became a part of the Sirena1 locus in the common ancestor of mouse and rat. Given the disruption of the 5′ end of Sirena1 gene in the rat genome by retrotransposon insertions, the pseudogene was likely included in the ancestral Sirena1 transcript and was lost from it in the rat lineage, but was retained in the mouse lineage. Preservation of CPE elements in all species having Sirena1 implies that the RNAi functionality and dormancy exist in Sirena1 independently.
Small RNA sequencing (71,72) and mutants of the RNAi pathway (59) reveal that Sirena1 gives rise to antisense siRNAs targeting Elob and Elob1. The model where antisense-transcribed pseudogenes would basepair in trans with mRNAs and give rise to siRNAs reducing mRNA levels was postulated in 2008 (52,53). Maternal lncRNA analysis subsequently annotated lncRNA transcripts bearing antisense pseudogene sequences, such as Sirena1 (9). Our work on Sirena1 provides an insight into the complexity of pseudogene impacts on the parental gene.
Elob has generated 12 pseudogenes, 10 of them directly. Of these, one insertion became a part of highly abundant Elob paralog Elobl, which itself produced one pseudogene while the Elobl locus became tandemly duplicated. Seven of Elob pseudogenes emerged after the mouse/rat split, while two existed before; one of them is the pseudogene in the Sirena1 locus. This frequency of Elob pseudogene formation is remarkable given the relatively low abundance of the Elob transcript in mice. It is possible that Elob expression was higher in the germline of mouse ancestors, while the highly expressed Elobl paralog is a recent adaptation.
Sirena1 is the only locus generating a significant level of transcripts antisense to Elob and Elobl. This offers an interesting example of the complex and transient (on an evolutionary scale) effects of trans-acting antisense RNAs. The Sirena1 inhibitory effect on Elob and Elob1expression would already start upon forming dsRNA as a structure that likely interferes with translation. The duplex would then be recognized by dsRNA binding proteins (dsRBPs), which would determine its further processing. Dicer and TARBP2 would represent the RNAi fate, but we cannot rule out that other dsRPBs would recognize and affect the Elob and Elobl mRNA stability or translation. RNA destabilization of Elob and Elob1 by RNAi would include Dicer processing of the duplex with Sirena1 transcript and subsequent siRNA effect on Elob and Elob1 mRNAs. Thanks to the detailed characterization of the RNAi pathway in oocytes by Stein et al. (59) and Sirena1 knock-out transcriptome analysis, we can observe the principles governing endogenous RNAi and antisense-based regulations at the transcript level. Sirena1 is a relatively old antisense RNA, and its basepairing with Elob and Elobl deteriorated to the point where (i) it could interfere with efficient Dicer processing and (ii) only a small fraction of siRNAs would have extensive complementarity required for AGO2-mediated cleavage. At the same time, the increased abundance of Elob RNA in the Ago2DAH/DAH mutant demonstrates that there are enough functional siRNAs targeting Elob. Notably, the expression of Elobl, Elob paralog, which has less complementarity to Sirena1, is not affected in Ago2DAH/DAH, but exhibits a slight increase in Dicer−/− GV oocytes (Figure 6C) and is even higher in the Sirena1−/− mutant (Figure 8A). This suggests that Sirena1 interacts with Elobl in trans, affects its stability, which may in part involve Dicer-mediated cleavage, but effective bona-fide RNAi-mediated repression does not take place anymore.
The evolution of Sirena1 therefore manifests two features of endogenous gene targeting by RNAi via trans-acting antisense pseudogene transcripts: (i) it can be eliminated through disruption of expression of the antisense pseudogene (Sirena1 in rat oocytes) and (ii) this type of RNAi substrate has limited duration during evolution, as it deteriorates over time until it becomes ineffective. Sirena1-mediated repression of Elob could thus be significant in the evolutionary past and become redundant or irrelevant during the mouse evolution.
In terms of biological significance, Sirena1 is a non-essential gene. To generate a loss of function mouse model, we decided to delete the first exon along with the promoter in order to shut down Sirena1 expression. The CRISPR-mediated deletion eliminated the entire first exon, hence the RNAi functionality. The residual expression of Sirena1 3′ end from a cryptic promoter, which emerged in the L1 element insertion further downstream, generates <1% of the original Sirena1 expression.
The loss of Sirena1 did not affect meiotic maturation, nor the developmental potential. The most interesting biological change observed in oocytes lacking Sirena1 was an effect on mitochondria manifested as upregulation of expression of mitochondrial genes and mitochondrial redistribution. Quantification of mtDNA and MitoTracker signal suggests that the Sirena loss does not affect the mitochondrial number, but the distribution of mitochondria. At the same time, the increased expression of mitochondrial genes is not accompanied by an effect on ATP synthesis, as ATP levels in the mutant oocytes appeared normal. A change in ATP synthesis in the oocyte could be compensated for by cumulus cells because of gap junctions through which ATP can diffuse (73). Cumulus cells thus could buffer metabolic defects in the oocyte, as was shown for glycolysis-deficient oocytes (74). However, extended culture of denuded oocytes suggests that ATP synthesis in Sirena1−/− oocytes is intact. While we cannot rule out that more detailed analysis of the metabolism in Sirena1−/− oocytes could reveal additional phenotypical consequences, it is likely that the observed changes in mitochondria are an indirect effect of the loss of dormant Sirena1. We propose that the Sirena1 transcript abundance and dormancy are connected with perinuclear cytoplasmic organization and loss of Sirena1 changes properties of the perinuclear space, which affect mitochondrial distribution and yield a minor increase in the transcript levels of mitochondrial genes; these effects largely disappear upon resumption of meiotic maturation when mitochondria become redistributed. We cannot formally rule out that mitochondrial redistribution is an indirect consequence of increased Elob and Elobl levels, but there are three lines of evidence that the effect could be associated with the Sirena1 dormancy. First, dormant mRNA encoding Mos also localizes to the perinuclear space (75,76). Second, weaker mitochondria-related phenotypes observed in Sirena1−/− MII eggs (Figures 8A and 9C, D) would be consistent with a role of a dormant RNA complex in the GV oocyte. Third, acquisition of some structural/scaffolding role in the cytoplasm would fit the high abundance of Sirena1. Dormant Sirena1 would form ribonucleoprotein complexes like other dormant RNAs. Such complexes in the perinuclear region might contribute to the environment promoting mitochondrial perinuclear aggregation. The observed minor increase in expression of mitochondrial genes then would be a consequence of the reduced mitochondrial aggregation. Although there was no apparent impact on fertility, the contribution to mitochondrial distribution and changes of mitochondrial physiology in fully-grown oocytes lacking Sirena1 could be important from a long-term evolutionary perspective.
Recently, Cerox1 lncRNA was discovered, which is a post-transcriptional regulator of mitochondrial Complex I catalytic activity (77). Cerox1 is a highly abundant lncRNA conserved across placental mammals. It is enriched in the cytoplasm, and its high abundance stimulates expression of Complex I transcripts and reduces reactive oxygen species production (77). However, despite some superficial similarities, Sirena1 and Cerox1 represent two entirely different stories. Cerox1 positively regulates nuclear-encoded Complex I components through decoying specific miRNAs (77). While Cerox1 itself is not expressed in oocytes (E-MTAB-2950NA), the Cerox1-like mechanism is unlikely to operate in oocytes where the miRNA pathway is functionally irrelevant (78). Furthermore, Sirena1 knock-out causes upregulation of genes encoded by the mitochondrial genome, while oocyte mitochondria are metabolically quiescent (reviewed in (79,80)).
Taken together, Sirena1 exemplifies how an evolving lncRNA can become engaged in existing molecular mechanisms, even in a molecular mechanism that evolved to control the timing of translation. Sirena1 has two functions: it is a repressor of Elob, and it contributes to cytoplasmic organization of mitochondria in the fully-grown oocyte. That neither of these roles appears important for fertility under laboratory conditions is rather a common theme in the lncRNA field (81). Sirena1 thus exemplifies a case where the defined engagement in specific molecular functions contrasts with a failure of the mouse knock-out model to reveal a phenotype. However, the Sirena1 contribution to fitness in nature and during mouse evolution may not manifest when inbred mice are maintained in air-conditioned rooms and fed ad libitum.
DATA AVAILABILITY
Sirena knock-out RNA-seq analysis and the rat oocyte transcriptome were deposited in the GEO database as GSE137563.
SUPPLEMENTARY DATA
Supplementary Data are available at NAR Online.
ACKNOWLEDGEMENTS
We thank Vlada Filimonenko for the help with electron microscopy, Pinar Bahsi for technical assistance, Sarka Takacova for the help with manuscript preparation, animal caretakers and the Czech Centre for Phenogenomics staff for technical assistance, the Laboratory of Electron Microscopy, Faculty of Science, Charles University, for the possibility to use the transmission electron microscope JEOL JEM-1011 with the Veleta CCD camera, and the Mediterranean Institute for Life Sciences for hosting data mining sessions.
FUNDING
Marie Curie Initial Training Network [607720, RNATRAIN]; Ministry of Education, Youth and Sports (MEYS) National Sustainability Programme (NPU) project [NPU I LO1419]; Charles University in the form of a PhD student fellowship (to S.G., F.H., A.J., in part); this work will be partly used to fulfill the requirements for a PhD degree, and hence can be considered ‘school work’; Czech Science Foundation [GACR 18-19395S to A.J., A.S.]; MEYS, project [NPU I LO1609 to P.So. and D.D.]; European Structural and Investment Funds grant for the Croatian National Centre of Research Excellence in Personalized Healthcare [KK.01.1.1.01.0010 to F.H., K.V.]; Croatian National Centre of Research Excellence for Data Science and Advanced Cooperative Systems [KK.01.1.1.01.0009]; Croatian Science Foundation [IP-2014-09-6400]; Facility support acknowledgement includes the Transgenic and Archiving Module of the Czech Centre for Phenogenomics, Institute of Molecular Genetics ASCR, whose work was supported by the Ministry of Education, Youth and Sports (MEYS) [LM2011032, LM2015040]; BIOCEV European Regional Development Fund [CZ.1.05/1.1.00/02.0109]; We also acknowledge the Light Microscopy Core Facility and the Microscopy Centre - Electron Microscopy Core Facility, IMG ASCR, Prague, Czech Republic, supported by MEYS (the Czech-BioImaging large research infrastructure project LM2015062 [CZ.02.1.01/0.0/0.0/16_013/0001775]; Biomodels for Health - Centre for Model Organisms, project LO1419, OPPK [CZ.2.16/3.1.00/21547], for their support with the confocal and electron microscopy presented herein; Access to the National Grid Infrastructure MetaCentrum was supported through CESNET [LM2015042]. Funding for open access charge: Ministry of Education, Youth, and Sports (MEYS) National Sustainability Programme (NPU) project [NPU I LO1419].
Conflict of interest statement. None declared.

Comments