


Abstract
The electron temperature and density pedestals tend to vary in their relative radial positions, as observed in DIII-D (Beurskens et al 2011 Phys. Plasmas 18 056120) and ASDEX Upgrade (Dunne et al 2017 Plasma Phys. Control. Fusion 59 14017). This so-called relative shift has an impact on the pedestal magnetohydrodynamic (MHD) stability and hence on the pedestal height (Osborne et al 2015 Nucl. Fusion 55 063018). The present work studies the effect of the relative shift on pedestal stability of JET ITER-like wall (JET-ILW) baseline low triangularity (δ) unseeded plasmas, and similar JET-C discharges. As shown in this paper, the increase of the pedestal relative shift is correlated with the reduction of the normalized pressure gradient, therefore playing a strong role in pedestal stability. Furthermore, JET-ILW tends to have a larger relative shift compared to JET carbon wall (JET-C), suggesting a possible role of the plasma facing materials in affecting the density profile location. Experimental results are then compared with stability analysis performed in terms of the peeling-ballooning model and with pedestal predictive model EUROPED (Saarelma et al 2017 Plasma Phys. Control. Fusion). Stability analysis is consistent with the experimental findings, showing an improvement of the pedestal stability, when the relative shift is reduced. This has been ascribed mainly to the increase of the edge bootstrap current, and to minor effects related to the increase of the pedestal pressure gradient and narrowing of the pedestal pressure width. Pedestal predictive model EUROPED shows a qualitative agreement with experiment, especially for low values of the relative shift.
Export citation and abstract BibTeX RIS

Original content from this work may be used under the terms of the Creative Commons Attribution 3.0 licence. Any further distribution of this work must maintain attribution to the author(s) and the title of the work, journal citation and DOI.
1. Introduction
The edge pedestal structure in H-mode plasmas strongly affects the fusion power [Maget NF2013, Urano NF2014]. Formation of the edge transport barrier (also called the pedestal)—a region with a steep pressure gradient inside the last closed flux surface (LCFS), leads to a suppression of turbulent transport and enhanced confinement of the fusion plasma. Studying the parameters that determine the properties of the pedestal, such as the width, height and gradient, has been therefore of high interest. In JET, their role in confinement has been examined e.g. in [Giroud NF2013, Beurskens NF2014, Maggi NF2015, Frassinetti PPCF2017].
With the installation of the new metal wall in JET, consisting of the tungsten divertor and beryllium main wall (typically called ITER-like wall, JET-ILW), the ITER baseline scenario has shown a degradation of global confinement compared to the operation with the previous JET carbon wall (JET-C) [Giroud NF2013, Beurskens NF2014]. The degradation has been ascribed, at least in part, to the requirement to operate with increased gas fuelling in order to reduce the accumulation of tungsten in the plasma core [Beurskens NF2014, Nunes IAEA2014, Nunes PPCF2016]. The increased gas fuelling has led to a reduction of the pedestal pressure top values, mainly due to the lower pedestal temperature compared to JET-C, as described in [Beurskens NF2014, Maggi NF2015]. However, the pedestal confinement of JET-ILW plasmas with high triangularity (δ) has been successfully recovered with N2 seeding [Giroud NF2013, Giroud PPCF2015]. Moreover, good confinement with H98 ≈ 1 can be achieved also in low triangularity JET-ILW plasmas—by moving the outer strike point close to the pumping duct, leading to an improvement of the core stored energy [Joffrin IAEA2014, Joffrin NF2017, de la Luna IAEA2014, Maggi NF2015].
Recent work carried out on NSTX, DIII-D and ASDEX Upgrade (AUG) show that the seeding of impurities like N2 and Li affects the pedestal position. The role of the density profile position in the pedestal stability has been observed in DIII-D [Osborne NF2015] and NSTX [Maingi PRL2009, Maingi NF2012]. For example, in DIII-D discharges with the injection of Li, an enhanced pedestal pressure and global energy confinement has been observed. This has been linked with the increase of the pedestal temperature. The Li injection is correlated to the inward shift of the electron density profile [Osborne NF2015]. When the density moves inwards, this moves the position of the normalized pressure gradient maximum slightly inwards, towards the plasma centre, contributing to a positive effect on pedestal stability [Lonnroth NF2011, Saarelma PoP2015].
Similarly on AUG, the effects of gas fuelling, heating power and impurity (nitrogen) seeding on pedestal structure have been studied [Dunne PPCF2017, Dunne IAEA2016]. It has been shown that a so-called high-field side high density region (HFSHD) has an impact on the density profile location relative to the separatrix, and a subsequent impact on pedestal stability. In AUG, the HFSHD is one of the parameters which link the effect of fuelling and seeding to scrape-off layer parameters [Reimold NME2017]. When the density in HFSHD region is increased (mainly by gas fuelling), the pedestal density profile is shifted radially outwards leading to an outward shift of the pedestal pressure. Measurements and predictive pedestal modelling have shown that this shift is correlated with the reduction of the pedestal pressure. Conversely, the density in the HFSHD region can be reduced by applying nitrogen seeding, allowing the density profile to shift back inwards and improving pedestal stability [Dunne PPCF2017, Dunne IAEA2016].
On JET, it has not been understood yet why the gas fuelling has an influence on the pedestal pressure or confinement. It is worth noting that already in [Cordey PPCF 1996] the increase of gas fuelling has been correlated with an outward shift of the pedestal density. However, at that time, pedestal studies were still at an early stage and the diagnostics where not good enough for detailed measurement of the pedestal structure, so no link between the pedestal position and pedestal stability was put forward.
This paper is focused mainly on the investigation of the electron temperature (Te) and density (ne) pedestal positions in both JET-C and JET-ILW unseeded plasmas. As shown in this work, the changes in pedestal structure, when the electron temperature and electron density have different relative pedestal positions, are correlated with a reduction in the normalized pressure gradient, therefore playing a significant role in pedestal stability. Also, pedestal ne is typically located farther out than pedestal Te.
The paper is organized as follows: section 2 describes the diagnostics and analysis technique, section 3 deals with experimental correlation between the relative shift and the pedestal stability, section 4 discusses the difference in the relative shift between JET-C and JET-ILW, section 5 compares stability analysis with the experimental data. Discussion is in section 6 and finally conclusions are in section 7.
2. Diagnostics and analysis technique
Profiles of the electron temperature and density from the high resolution Thomson scattering system on JET [Pasqualotto RSI2004] are used for the analysis of the pedestal structure. All profiles are selected from stationary phases at least 0.5 s long and at least 2–3 energy confinement times long. From the point of view of the pedestal structure, it is essential to analyze only profiles in the pre-ELM phase of the cycle, as ELMs cause a periodic collapse of the H-mode pedestal. In this work, the pre-ELM profiles are defined as 70%–99% of the ELM cycle, as done in earlier pedestal studies in JET. The experimental profiles are fitted with a so-called mtanh function [Groebner NF2001], taking into consideration the Thomson scattering instrument function [Frassinetti RSI2012]. The fit provides the parameters of the pedestal structure, such as height, width, and position. Pedestal relative shift is calculated using the positions of the middle of the pedestals. An example of HRTS experimental data (Te) of a JET-ILW discharge is shown in figure 1. Solid line indicates fit with mtanh function, and pedestal parameters discussed in this paper are indicated with dashed lines. The advantage of using the Thomson scattering is that the diagnostic provides the simultaneous measurement of both density and temperature. The relative position of the pedestal density and pedestal temperature is therefore very accurate. The absolute position is slightly less accurate, in part because of the uncertainty in the EFIT mapping and in part because of the lack of a good experimental measurement of the separatrix temperature,  . As commonly done in JET and in AUG, this problem is, at least in part, avoided by using a two points model for the power balance at the separatrix [Kallenbach JNM2005] where
  ≈ 100 eV is expected. Therefore, the temperature profiles are shifted in order to have 100 eV at the LCFS. The same shift is applied to the density. This procedure guarantees that the relative shift between density and temperature position is unaffected. The relative pedestal position of the density has been cross-checked with the reflectometer [Sirenelli RSI2010]. The reflectometer measurements are available only for a limited subset of the shots analyzed, but, when available, reflectometer and HRTS give consistent results. In the present dataset, the ECE diagnostics is in cut-off and/or has insufficient optical depth so it cannot resolve the entire pedestal structure. Therefore, the ECE cannot be used to cross-check the pedestal temperature position.

Figure 1. TS profile of electron temperature in pedestal region in the normalized poloidal flux ψN for discharge #84598, fitted with modified hyperbolic tangent fuction (magenta solid line), and with indicated pedestal parameters. Blue dashed line marks pedestal height, green dashed line indicates pedestal position, and the pedestal width is indicated with two black dashed lines.
Download figure:
Standard image High-resolution image3. Experimental correlation between the relative shift and the pedestal stability
The aim of this section is to investigate the experimental correlation between the pedestal position of electron density and temperature and the pedestal stability. The pedestal stability is affected by several parameters. In terms of dimensionless parameters, the normalized thermal pressure β (β = 2µ0 /B2) and the normalized collisionality ν* (ν* = 6.92 · 10−18neR5/2q95Zeff lnΛ/(ε3/2
 )) are the most important. Here R is the major radius, q95 is the safety factor, Zeff is the effective charge number, ε is inverse aspect ratio, and factor lnΛ appears due to many small angle collisions within the Debye sphere.
The increase of β leads to an increase of the pedestal stability via the stabilizing effect of the Shafranov shift [Urano NF2014, Urano IAEA2016]. The increase of ν* leads to the reduction of the stability mainly because of the reduction of the bootstrap current jbs [Frassinetti NF2017]. On the other hand, the normalized ion Larmor radius ρ* (ρ* = 4.57 · 10−3(2Ti)1/2/(aB), where Ti is ion temperature, B is the magnetic field on the axis, a is the plasma minor radius) is not supposed to have any effect on peeling-ballooning stability. Indeed, recent experimental results have shown that ρ* does not affect the pedestal stability in JET [Frassinetti PPCF2017]. Therefore, to disentangle the effect of the position on the stability from the effect of β and ν*, the initial part of the work has been carried out on a limited dataset composed of three discharges with identical operational parameters except for the gas fuelling and the NBI power. The dataset has similar β, ν* and ρ*.
The discharges are performed with plasma current Ip = 2 MA, magnetic field B = 2 T, and safety factor q95 = 3. The gas puffing level is varied in the range 1–9 1022 e s−1, and a constant value of thermal normalized beta  = 1.4 is achieved by increasing the additional input power (PNBI) in feedback (
 = β/(Ip/aBT), where BT is the toroidal magnetic field). The power is varied by 40% from 6.5 MW (at low gas) to 10.5 MW (at high gas), while other important parameters like the effective charge number Zeff ≈ 1.25, volume averaged collisionality 〈ν*〉 ≈ 0.2, pedestal collisionality ν*,ped ≈ 1.1, and the ratio of electron to ion temperature Te/Ti ≈ 1 (both in the core and in the pedestal region) are constant. The time evolution of gas, power, normalized thermal β, and energy confinement time are shown in figure 2.

Figure 2. Time evolution of (a) gas puffing, (b) NBI power, (c) normalized thermal β, (d) energy confinement time τE.
Download figure:
Standard image High-resolution imageThe increase of gas puffing leads to a degradation in the energy confinement time τE from 0.37 s to 0.23 s (≈40% variation). The variation of τE cannot be ascribed to a change in the stored energy (which is less than 5%), as both the core and the pedestal Te and ne have minimal and no systematic variation. The pre-ELM TS profiles for the low and the high-gas cases are shown in figures 3(a) and (b). The pedestal height has minimal variation as shown in figure 4 (6% and 9% respectively). This behavior can be explained by the fact that both gas fuelling and power are varied in this dataset, and both can influence the ne and Te pedestal top values in the opposite way [Maggi NF2015]. What might have a slight influence on the confinement is the Mach number in the pedestal, which is not perfectly constant and is changing up to 20%. However, according to the scaling proposed in [de Vries NF2008] this variation can affect the confinement by at most 3–4% and therefore cannot explain the 40% drop in the confinement.

Figure 3. (a) Comparison of TS profiles of electron temperature in normalized poloidal flux ψN for discharges #84600 – low gas (red color), and #84598 – high gas (black color) (b) comparison of TS profiles of electron density in normalized poloidal flux ψN for discharges #84600 – low gas (red color), and #84598 – high gas (black color).
Download figure:
Standard image High-resolution image
Figure 4. (a) Pedestal electron density and (b) pedestal electron temperature height dependence on the gas puffing for the dataset with constant βN = 1.4 (figure 2). The uncertainty on the pedestal height is roughly 1% for pedestal density and 3.5% for pedestal temperature.
Download figure:
Standard image High-resolution imageA major difference in the pre-ELM TS profiles is present in the pedestal structure. Figure 5 shows the TS profiles of ne and Te in the pedestal region for the discharge with low-gas puffing (figure 5(a)), and high-gas puffing (figure 5(b)). In both cases, the density position is not the same as the temperature position. Hereafter, the difference in their positions will be referred to as the 'relative shift'. Figure 5(c) shows profiles of the pedestal pressure for low-gas (red) and high-gas (black) cases. As shown in figure 6(a), the increase of the gas (and simultaneous increase of PNBI, see figure 2) is correlated to the increase in the relative shift between the ne and Te pedestal position, as the pedestal ne tends to move more outwards. Figure 6(b) shows the pedestal pressure position for all three discharges. Within the error bars, no systematic variation in the pressure position with the change in gas puffing has been observed (this behavior is analyzed at the end of this section, along with the discussion of figure 9).
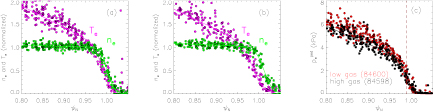
Figure 5. (a) TS profiles of electron temperature and density in the pedestal region for shot #84600 – low relative shift. (b) TS profiles of electron temperature and density in the pedestal region for shot #84598 – high relative shift. The profiles are normalized to 1 at the pedestal top. The temperature is in magenta and the density is in green. (c) Comparison of pedestal pressure profiles for shot #84600 – low relative shift (red) and shot #84598 – high relative shift (black). Vertical lines indicate pedestal pressure positions for both cases (lines are overlapping). The dataset with constant βN = 1.4 shown in figure 2 is used.
Download figure:
Standard image High-resolution image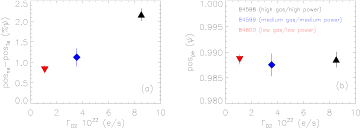
Figure 6. (a) Dependence of the relative shift and (b) of the pedestal pressure position on the gas puffing for the dataset with constant βN = 1.4 (figure 2).
Download figure:
Standard image High-resolution imageThe ne pedestal position for the discharges with low and high gas puffing has been cross-checked with data obtained from the reflectometer diagnostics, figure 7, confirming an outward shift for the discharge with high gas puffing and high NBI power. This is consistent with what was observed in AUG [Dunne PPCF2017].
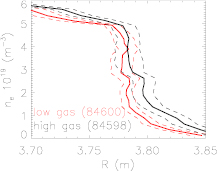
Figure 7. Comparison of the ne pedestal position from reflectometer (solid lines) for the discharges with low (red color) and high gas puffing (black color). Dashed lines indicate the standard deviation.
Download figure:
Standard image High-resolution imageThe relative shift has a strong effect on the experimental pressure gradient. For a more direct comparison with the theory, as discussed later in this paper, the experimental normalized pressure gradient αexp is calculated according to [Miller PoP1998]:
where ψ is the poloidal flux, V is the plasma volume, R is the major radius, µ0 is permeability in vacuum, and p' the pressure derivative in ψ. Fits of the experimental TS profiles and standard EFIT equilibrium have been used for the calculation. α is roughly proportional to the pressure gradient divided by  . Figure 8(a) shows αexp dependence on the relative shift. With the increase of the relative shift, αexp is reduced by ≈40%.

Figure 8. (a) Experimental normalized pressure gradient αexp versus the relative shift. (b) Dependence of the pressure pedestal width on gas puffing. The dataset with constant βN = 1.4 shown in figure 2 is used.
Download figure:
Standard image High-resolution imageA second difference in the pedestal structure of the TS profiles is that the pedestal pressure width tends to increase with increasing gas (figure 8(b)). This is consistent with observation in [Leyland NF2015].
As shown in figure 6(a), there is a correlation between the relative shift and the increase of the gas puffing. But it is important to keep in mind that in this dataset there is also an increase of the power in order to maintain constant β. Therefore, using this dataset, it is not clear whether the relative shift increases due to the increase of the gas level or to the increase of the power. To further investigate which of these two parameters affects the shift, another set of JET-ILW discharges composed of three power scans (Psep = 3–14 MW) performed at low δ (~0.24), and different gas levels (low, medium and high gas injection) [Challis NF2015, Maggi NF2015] has been analyzed. These discharges have relatively high beta (βN ⩾ 1.8) and are commonly referred to as the 'hybrid plasmas'. Figure 9(a) shows the dependence of the relative shift on the power through the separatrix (Psep = Pnet − Pbulk, where Pnet is the input power, and Pbulk is power radiated from the bulk plasma, estimated from bolometers). At each gas level, an increase of the relative shift with increasing Psep can be observed. Also, at constant Psep, the relative shift tends to be lower for low-gas discharges than for medium and high-gas discharges. This shows that both the change in power and in gas rate can influence the relative shift. However, note that the relative shift does not change significantly between the medium and the high-gas rate cases, suggesting that the relative shift saturates at certain high gas levels. A further discussion on the possible influence of the gas fueling on pedestal density position is in section 6.

Figure 9. Power scan at three gas levels (light green: low gas <0.5 1022 e s−1, medium green: medium gas – 0.5–1.5 1022 e s−1, dark green: high gas >1.5 1022 e s−1): (a) dependence of the relative shift on power through the separatrix. (b) Position of the pedestal pressure versus the power through the separatrix. Data marked with black circles have similar  (0.21–0.25) and are used for comparison with dataset discussed in figure 10. Note that this dataset has higher βN ⩾ 1.8 and does not include the constant βN = 1.4 discharges in figures 2–8.
Download figure:
Standard image High-resolution imageThe corresponding pedestal pressure positions are shown in figure 9(b). For all the three gas levels, an inward shift of the pressure position with increasing power is observed. This is probably due to the increase of the pedestal width with increasing β. As mentioned at the beginning of this section, the increase of βN leads to the increase of the pedestal stability, which then leads to the increase of the pressure pedestal height and hence of the poloidal β at the top of the pedestal ( ). Consequently, this increases the pedestal width (Δ = 0.076
 [Snyder PoP2009], see section 5). Since the
  is expected to be ≈100 eV, the increase of the width then leads to the inward shift of the maximum gradient. Note that this behavior can explain why the pressure positions of the dataset discussed in figure 6(b) do not change significantly. In figure 6, to keep β constant, the discharges with high-gas rate are performed with high NBI power. So, the increasing gas leads to the outward shift of the density which, in principle, should lead to an outward shift of the pressure. However, this effect is compensated by the increased power that leads to an inward shift of the pressure, so the resulting pressure position does not change.
As a further note, even though the present analysis has been focused on investigation of the behavior of low triangularity plasmas, several high δ (~0.38), low-gas hybrid discharges have been added to figure 9 for comparison (light green star symbols), since these might be more relevant for ITER. Results suggest a very similar behavior of the relative shift (figure 9(a)) and pedestal pressure position (figure 9(b)) with Psep between low and high δ discharges at low-gas fuelling.
4. Comparison of the relative shift in JET-ILW and JET-C
The initial JET-ILW results show that the confinement is roughly 10–20% lower than in JET-C [Beurskens NF2013]. The reduction is mainly related to the pedestal degradation, while core transport is roughly comparable to JET-C [Beurskens NF2014]. The issue of the difference in the confinement between JET-C and JET-ILW is very complex. Any difference observed between JET-C and JET-ILW can possibly lead to a hint in understanding this problem.
Therefore, the analysis of the effect of the relative shift has been extended to a larger set of JET-ILW plasmas and to a set of JET-C discharges with ν*,ped and  (where
  = 2µ0pped/
 ) comparable to the JET-ILW dataset. The constant β and ν* are important in order to reduce the number of parameters that influence the pedestal stability.
Figure 10(a) shows the correlation of αexp on the pedestal relative shift. The JET-ILW dataset has been selected among baseline plasmas with low triangularity (δ ~ 0.24). The dataset is composed of discharges with a relatively large variation in the operational parameters. The current range is Ip = 2.0–3.5 MA and gas rate is ΓD2 = 1–10 1022 e s−1. These ranges have been selected in order to have a dataset as large as possible but still relatively constant ν*,ped (0.1–0.35) and  (0.15–0.23). This dataset is highlighted with full circles. The
  range is still relatively large, so the colors highlight subsets with narrower
  ranges. For comparison, the JET-ILW power scan discussed in figure 9 and with matching
  and ν*,ped (discharges highlighted in black circles in figure 9), has been added with full triangles. The present JET-ILW dataset has the relative shift in the range ≈1–3% ψN.
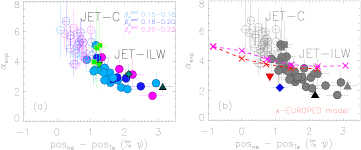
Figure 10. (a) Dependence of the experimental normalized pressure gradient αexp on the pedestal relative shift for JET-C low δ pulses (open symbols), JET-ILW baseline low δ (full circles), the three hybrid scenario pulses from figure 9 with  = 0.21–0.25 (full light green triangle, medium green diamond, and dark green triangle), and additional hybrid discharges with H98 = 1.3 and
  = 0.28–0.3 described in section 4 (full green squares). (b) Comparison of αexp with critical pressure gradient αcrit estimated with EUROPED model for discharge #84600, and with different values of the relative shift. Red cross symbols correspond to results with Hager definition of the bootstrap current, and magenta cross symbols represent Sauter definition of the bootstrap current. Red triangle, blue diamond and black triangle correspond to the dataset with constant βN = 1.4 (figure 2).
Download figure:
Standard image High-resolution imageThe results of sections 2 and 3 show that the relative shift decreases with decreasing fueling rate. In order to investigate if JET-ILW can reach relative shift lower than 1%, a further JET-ILW dataset characterized by very low gas rate (comparable to JET-C) and by good confinement has been analyzed (green squares in figure 10(a)), selected from a hybrid plasmas dataset. The discharges have low triangularity, H98 = 1.3, gas rate in the range ΓD2 ⩽ 0.5 1022 e s−1, and  = 0.28–0.3. However, their relative shift is still approximately 1% ψN.
The JET-C dataset (open symbols in figure 10(a)) has been selected to have low triangularity (δ ~ 0.25) and  and ν*ped comparable to the JET-ILW dataset. The plasma current is in the range Ip = 2.5–4.5 MA. Most of the discharges has a very low or zero gas fueling (ΓD2 ⩽ 0.5 1022 e s−1), the rest of the discharges have gas fueling in the range ΓD2 = 0.5-4 1022 e s−1. Here the outgassing coming from the carbon wall is not taken into account, since it is rather difficult to quantify. The relative shift for the whole JET-C dataset is in the range 0–1.4% ψN.
From figure 10(a), several observations can be made. First, αexp shows a decreasing trend with increasing relative shift for both JET-C and JET-ILW for all three selected ranges of  . Second, JET-C tends to have a smaller relative shift compared to JET-ILW, despite part of the JET-ILW dataset (green squares) having a gas rate comparable to the JET-C dataset. This might suggest that different plasma facing materials can affect the pedestal density position, possibly through a different wall recycling [Wolfrum NME2017], and hence have an impact on the pedestal stability. Finally, for similar values of the relative shift, αexp of JET-C is comparable to αexp of JET-ILW.
It is important to note that the JET-C and JET-ILW datasets in figure 10 have different ρ*. However, as discussed in section 2, ρ* does not directly influence P-B stability, so this difference does not affect the conclusions of this paper.
5. EUROPED simulations, stability analysis and comparison with experimental data
In addition to investigation of the experimental correlation of αexp with the pedestal relative shift, JET-ILW experimental discharge from dataset at constant β with low gas described in section 3 has been used as an input to the pedestal predictive model EUROPED [Saarelma PPCF2017]. EUROPED is built on the existing EPED1 model [Snyder PoP2009], which assumes that the pedestal pressure is limited by the combination of kinetic ballooning modes and peeling-ballooning modes, and that pedestal width scales (in normalized poloidal flux) as Δ = 0.076 . Pedestal width is assumed to be the same for both ne and Te. Moreover, the pedestal density is given as an input and pedestal temperature is predicted. As one of the latest improvements, EUROPED code allows to set the value of pedestal relative shift to study its role in the pedestal stability.
The results of the EUROPED simulation are shown in figure 10(b) with dashed lines. As initial step, EUROPED has been used to predict the normalized pressure gradient (αEUROPED) for the low-gas/low-power plasma discussed in section 3 (discharge 84600 in figure 2). The predicted normalized pressure gradient slightly overestimates the experimental one. Then, EUROPED has been used to estimate the dependence of the normalized pressure gradient on the relative shift. Two scans in the relative shift have been performed. In the first scan, the bootstrap current has been estimated using the Sauter formula [Sauter PoP1999], while in the second scan, the Hager formula was used [Hager PoP2016]. Apart from the relative shift (which has been varied in the range −0.25–1% of the pressure pedestal width), and the bootstrap current definition, the same input parameters as the initial step have been used in both relative shift scans.
Both cases show an increase of α with decreasing relative shift. However, the experimental results show a much stronger dependence of α versus the relative shift. It is interesting to note, that the predicted increase of α is slightly stronger in region where the relative shift is negative (this corresponds to the situation, when  is more outwards than
  ). This is further discussed in figure 14.
To investigate the relation between the relative shift and the pedestal stability from the theoretical point of view, the pedestal stability of the three experimental JET-ILW discharges at constant β described in section 3 has been studied in more detail in terms of the peeling-ballooning (P–B) model [Wilson PoP2002]. The j-α stability diagram and the self-consistent path in j-α space, where j is the current density and α is the normalized pressure gradient, has been determined using the ELITE code. For the equilibrium, the HELENA code has been used [Huysmans CP1991].
The fits to the experimental pre-ELM HRTS profiles of Te and ne are used as input to the model. The profiles are shifted according to the two-point model such that the electron temperature at the separatrix  is equal to 100 eV [Kallenbach JNM2005]. The edge bootstrap current is calculated as described in [Kho PoP2012].
The self-consistent path in j-α space is calculated by artificially increasing the pedestal temperature and then calculating the corresponding α and j. This process is repeated until the P–B boundary is reached. The intersection between the self-consistent path and the P–B boundary identifies a critical value for the normalized pressure gradient (αcrit). αcrit can be considered as the maximal α expected by the P–B model, and can be used for direct comparison with the experimental α (αexp).
Previous JET-ILW results with high gas fuelling have shown that the operational points tend to be far from the P-B boundary [Beurskens NF2014, Maggi NF2015], while only the plasmas with low gas rate tend to be located on the boundary [Maggi NF2015]. The P-B boundaries in the j-α space for the dataset described in section 3 are shown in figure 11(a). Indeed, the low-gas discharge is near the stability boundary on the unstable side, with the error bars nearly touching the boundary. The high-gas case is instead quite far from the boundary, in the P–B stable region. The medium gas fuelling discharge is also on the stable side, though the error bars cross the stability boundary. The profiles of the current density in the pedestal region are shown in figure 11(b).
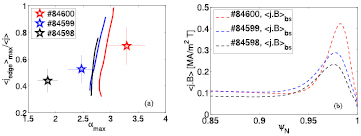
Figure 11. (a) j-α stability diagram for dataset with constant βN = 1.4 (figure 2). The colors indicate the low, medium and high value of the relative shift – red, blue, and black color respectively. (b) Corresponding bootstrap current density.
Download figure:
Standard image High-resolution imageThe comparison of the experimental normalized pressure gradient with the critical pressure gradient αcrit from the P–B model is shown in figure 12. In both cases, a decreasing trend with increasing relative shift is observed, however, the experimental trend is significantly stronger than the one obtained from the P–B model. Even if no good quantitative agreement between experiment and modelling has been observed, the results of the P–B stability analysis and the behaviour of the bootstrap current might still help to understand, albeit partially, the mechanism of the increase in the normalized pressure gradient with decreasing relative shift. The j-α diagram in figure 11(a) shows that with the reduction of the relative shift the operational point moves to higher j. Considering the shape of the stability boundary, moving the operational point to higher j values allows the achievement of slightly higher αcrit values.
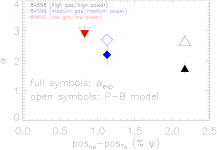
Figure 12. Comparison of the experimental normalized pressure gradient αexp (full symbols) with αcrit from the P–B model (open symbols) for dataset with constant βN = 1.4 (figure 2).
Download figure:
Standard image High-resolution imageThe main reason for the change in the bootstrap current is variation of the local ν* in the middle of the pedestal (i.e. maximum of the pressure gradient) and at the separatrix. Note that the value of the collisionality at the top of the pedestal does not change significantly (see the density and temperature profiles in figure 3). The reduction of ν* in the middle of the pedestal and at the separatrix with decreasing relative shift leads to the increase of the edge bootstrap current [Snyder PPCF2003, Sauter PoP1999]. Basically, the reduction of the relative shift—for example by the inward shift of the density—leads to the reduction of the density value at a fixed position and hence to the reduction of the local collisionality. This is qualitatively illustrated in figure 13, where the low-gas/low-power case of figure 2 is used to calculate the collisionality profile (red solid line), according to the definition given in section 3. The black solid line shows the collisionality using the same profiles, but with the density shifted outwards by 2% (comparable to the experimentally observed shift). Finally, the green solid line represents collisionality for the case when there is zero relative shift. The difference in collisionality in the outer part of the pedestal region (ψ ≈ 0.98–1.0) is between 50–100%. The reduction of the relative shift also leads to the increase of the pressure gradient (figure 13, dashed lines), which further contributes to the increase of the jbs [Saarelma PoP2015]. The magnitude of the pressure gradient affects the high n ballooning modes, while the radial shift near the separatrix affects mostly the low n peeling modes [Saarelma PoP2015]. The latter is negligible in the examined cases, as the operational points are located in the high n modes region of the stability diagram. Similar to figures 13 and 14 further qualitatively illustrates the behaviour of collisionality in the middle of the pedestal (figure 14(a)), and the behaviour of position of the maximum of electron pressure gradient (figure 14(b)) with the relative shift. This suggests that, within the experimental range of the relative shift in the present dataset (0.5–2.5% ψN), the change in the pedestal height can be correlated only to the variation of the bootstrap current. In the present experimental range, the change of the relative shift does not affect the pressure position. A change in the pressure position is achieved only for negative relative shifts. This explains the strong trend of αEUROPED for negative relative shifts shown in figure 10(b).
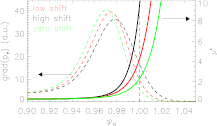
Figure 13. Electron pressure gradient (dashed lines) and effective collisionality (full lines) comparison for low (1%ψN, red color), high (3%ψN, black color), and zero pedestal relative shift (green color). Vertical black dashed line represents the separatrix.
Download figure:
Standard image High-resolution image
Figure 14. Dependence of (a) effective collisionality in the middle of the pedestal, and (b) position of the maximum of electron pressure gradient on pedestal relative shift. Vertical black dashed line represents zero value of the pedestal relative shift.
Download figure:
Standard image High-resolution imageIt should be highlighted that another factor that, in principle, can influence the stability in the present dataset, is the pedestal width. As discussed in the previous section, the reduction of the gas and power is correlated to the pedestal width reduction. The reduction of the pedestal width has a stabilizing effect, as described in [Snyder PoP2009]. However, the variation of the width is small (25%) and its impact on the pedestal stability should be rather limited.
6. Discussion
Analysis performed on various experimental data (JET-ILW baseline, low δ gas scan plasmas at constant β; JET-ILW low and high δ hybrid plasmas) has shown that the operational parameters that influence the relative shift are (at least) gas rate and power. Both the increase of the power and of the gas rate leads to the increase of the relative shift. However, concerning the gas, after an initial increase of the relative shift, a saturation is observed. Above a specific gas rate, the relative shift seems to remain constant.
The question of the origins of the relative shift remains unclear. A preliminary investigation has been done with JINTRAC [Wiesen JET2008, Romanelli PFR2014] simulations of neutral penetration [Tamor JCP1981] for the three gas scan discharges at constant β shown in figure 2. The result, illustrated in figure 15, suggests that the reduction of the relative shift is correlated with a slightly deeper position of the ionization source profile than in the case of the high relative shift. However, it is not clear why the profile of the ionization source is more outward in the high shift case. A possibility is that at high gas the opacity in the SOL is increased leading to a lower neutrals penetration. A further and more detailed investigation is currently ongoing.
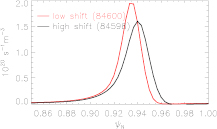
Figure 15. Comparison of the ionization source profile for the discharges with low (red color) and high relative shift (black color). The dataset with constant βN = 1.4 shown in figure 2 is used.
Download figure:
Standard image High-resolution imageRecent results from AUG [Dunne PPCF2017, Dunne IAEA2016] discuss the correlation between the formation of a localized region of high radiation and high density in the high field side scrape off layer (HFSHD) [Potzel JNM2015, Reimold NME2017] and the outward shift of the density profile, resulting in a significant degradation of the pedestal top pressure. To investigate if this can also play a role at JET, electron density in the HFS region was calculated using the measurements of the Stark broadening of the Balmer Dδ line from the inner divertor high-resolution spectrometer diagnostics [Lomanowski NF2015] for two selected discharges, with low (discharge #87412) and high (discharge #87392) value of the relative shift. Unfortunately, the measurement is available only for a very limited subset of the shots of figure 10. The diagnostic was not available for the dataset described in figure 2. The result is shown in figure 16(a). The difference between the two cases is not as clear as in the case of AUG and within the error bars no strong conclusions are possible. Nonetheless, the average value in the low relative shift case are up to 20–30% lower than in the high relative shift case. Therefore, the present data seems consistent with the AUG results, where the increase in HFSHD by 20% was observed with increased fueling rate [Dunne PPCF2017]. However, a further investigation in the future experimental campaign will be necessary to reach conclusive results, since there is no steady evidence of the existence of HFSHD region in JET plasmas in the present time. Figures 16(b) and (c) show a tomographic reconstruction of the divertor region for two discharges with low and high relative shift discharges #84600 and #84598 discussed in section 3. Again it is difficult to give a firm conclusion, but no obvious increase in the radiation is observed in the HFS for the high relative shift case (as instead expected in presence of the HFSHD).

Figure 16. (a) Electron density (solid lines) in the HFS region from the inner divertor high-resolution spectrometer measuring the Balmer Dδ line for discharges with a low (red color, #87412) and high (black color, #87392) relative shift. Dashed lines stand for standard deviation. (b) Tomographic reconstruction of the radiated power from the bolometric diagnostics for a JET-ILW discharge with low relative shift (#84600) and (c) with high relative shift (#84598). The small blob present in the reconstruction of the case with higher relative shift (at R = 2.3 m and Z = −1.25 m) is due to an artefact related to a malfunctioning channel. Vertical dashed lines in figures (b) and (c) approximately illustrate the range of view of the spectrometer diagnostic used in frame (a).
Download figure:
Standard image High-resolution image
This work has shown that the P–B model is not sufficient to fully explain the confinement degradation in the present dataset. It is possible that part of the confinement degradation in JET-ILW associated with the relative shift is due to the increase of the transport. The work described in [Hatch NF2017] briefly discusses the topic of degradation of confinement in JET-ILW plasmas with increased gas puffing. The gyrokinetic simulations suggest a strong dependence of transport on separatrix density, which is expected to be strongly affected by gas puffing and divertor physics [Dunne PPCF2017]. Indeed, in the present dataset, the increase of the relative shift with gas puffing leads to the increase of the separatrix density, as can be seen from figures 5(a) and (b). In the gyrokinetic simulations of [Hatch NF2017], approximately 50% increase in the separatrix density results in a ~50% increase in total transport, attributed to both electron temperature gradient (ETG) and electrostatic ion-scale transport. However, gyrokinetic simulations at JET are still in the early stages, requiring a further investigation.
Finally, it is important to highlight that the modifications in pedestal stability are related to a large variety of factors and changes in the pedestal values can occur even when the relative shift is not changed. For example, preliminary analysis suggests that the difference in the pedestal height between low and high triangularity plasmas is not related to the relative shift and the HFSHD [de la Luna IAEA2016].
7. Conclusions
This work studies the role of the pedestal relative shift in the pedestal stability of JET-ILW plasmas and compares the results with JET-C. Analysis on JET-ILW baseline, low δ gas scan dataset at constant β has linked the degradation of the energy confinement time with the modification of the pedestal structure, when the pedestal ne moves more outwards compared to Te pedestal. The increase of the relative shift is related to the reduction in the normalized pressure gradient α.
A systematic comparison between JET-C (low δ) and JET-ILW (low δ baseline and hybrid scenario) discharges with similar  and ν*,ped shows that JET-C tends to have a smaller relative shift than JET-ILW. The experimental normalized pressure gradient α has a decreasing trend with the relative shift. Moreover, for similar values of the relative shift, α of JET-C is comparable to α of JET-ILW. It is essential to note, that despite the narrow overlapping region of the relative shift (~1% ψ), investigated JET-ILW discharges do not access low shift values like the discharges in JET-C (<1% ψ). This suggests that plasma facing materials might play a role in affecting the density pedestal position.
Stability analysis performed in terms of the peeling-ballooning model show a qualitative agreement with the experimental results. However, quantitatively, the experimental trends are significantly stronger. The pedestal stability improvement is mainly due to the increase of the edge bootstrap current, with minor effects related to the increase of the pedestal pressure gradient and the narrowing of the pedestal pressure width. Finally, pedestal predictive model EUROPED shows a qualitative agreement with experiment, especially for low values of the relative shift.
Acknowledgments
This work has been carried out within the framework of the EUROfusion Consortium and has received funding from the Euratom research and training programme 2014-2018 under grant agreement No 633053. The views and opinions expressed herein do not necessarily reflect those of the European Commission.
ITER is the Nuclear Facility INB no. 174. The views and opinions expressed herein do not necessarily reflect those of the ITER organization.
This research is supported by Swedish Energy Agency, under grant number 40146-1.