


Abstract
Full conversion from ohmic to runaway electron (RE) driven current was observed in the tokamak à configuration variable (TCV) following massive injection of neon through a disruption mitigation valve into a low-density limited circular plasma. Following a partial disruption, a stable 200 kA RE beam is maintained for more than 1 s. Controlled ramp-down of the RE beam with adjustable decay rate was demonstrated. Control of the beam vertical position was achieved down to a RE current of 20 kA. RE beam formation is observed in elongated plasma configurations up to κ = 1.5. A reproducible scenario for RE beam generation without loss of circulating current is of particular interest for disruption modelling applications.
Export citation and abstract BibTeX RIS

Original content from this work may be used under the terms of the Creative Commons Attribution 4.0 licence. Any further distribution of this work must maintain attribution to the author(s) and the title of the work, journal citation and DOI.
1. Introduction
Tokamak disruptions typically evacuate a large fraction of the initial plasma thermal energy [1]. However, under some circumstances, yet to be completely understood, disruptions generate beams of confined runaway electrons (REs) with energies up to the multi-MeV range. This process is of great concern for large tokamaks such as ITER, where beams of up to several MA could severely damage the first wall if confinement is suddenly lost [2, 3]. A considerable amount of present day fusion physics research is currently aiming at understanding and predicting disruptions and RE beam formation [4–18].
The tokamak à configuration variable (TCV) [19] is contributing to this effort [20–26]. With extended shaping capabilities, advanced real-time plasma control, a proven ability to sustain very low density discharges, and a wide set of diagnostics investigating fast electron physics, TCV is particularly well suited for RE experimental studies. This paper reports on the basic characteristics of the scenario dedicated to post-disruptive RE beam experiments in TCV.
A reproducible scenario for generating RE beams via massive gas injection (MGI) using the disruption mitigation valve (DMV) is established. Baselines are developed for both neon and argon MGI. This paper will focus on neon MGI. Analysis of the results with argon [21, 22] including comparison with neon will be reported elsewhere. We were, initially, surprised to observe nearly full conversion from ohmic to RE driven current during the disruption. With the ohmic coil current kept constant following the disruption, the RE beam current decreases with a decay rate in the range of a few hundred kA s−1. This rate increases with higher quantities of high-Z material in the plasma, in good agreement with theoretical predictions [27–29]. Active control of the RE current using the ohmic coil is demonstrated: both faster and slower-than-free decays can be programmed. With sufficient co-current ohmic drive, a stable RE beam current is maintained for over 1 s. For such long durations, one way to mitigate the possible dangers of RE beams is to maintain control of the beam position as its stored energy, monitored by its current, slowly decays. In TCV, control of the RE beam vertical position was achieved down to a RE current of 20 kA.
As a baseline scenario, a RE beam is observed following neon MGI in the flat-top phase of ohmically driven, circular, limited plasmas with sufficiently low density. With a core electron density ne,0 < 1 × 10¹⁹ m−3, the ohmic electric field before disruption is at least ∼20× larger than the classical (Connor-Hastie) critical field Ec = (e3
ne log Λ)/(4π 0
me
c2) [29–33], where e is the elementary charge, log Λ the Coulomb logarithm, 0 the free space permittivity, me the electron rest mass, and c the speed of light in vacuum. Consequently, a significant population of REs builds up before the MGI [33, 34]. Comparing shots in which the MGI time and pre-MGI density are varied (see section 3) indicates that the current carried by the pre-MGI runaway population, which is a seed for RE beam formation, is a more determinant factor than e.g. the value of E/Ec at MGI initiation.
0
me
c2) [29–33], where e is the elementary charge, log Λ the Coulomb logarithm, 0 the free space permittivity, me the electron rest mass, and c the speed of light in vacuum. Consequently, a significant population of REs builds up before the MGI [33, 34]. Comparing shots in which the MGI time and pre-MGI density are varied (see section 3) indicates that the current carried by the pre-MGI runaway population, which is a seed for RE beam formation, is a more determinant factor than e.g. the value of E/Ec at MGI initiation.
RE beam formation after MGI in TCV is described in section 2. We discuss a representative case in detail, where full conversion from ohmic to RE driven current is observed, followed by the unmoderated RE beam current decay where no variation of the ohmic coil current is prescribed. Further investigation into RE beam formation dynamics is reported in section 3 where the role of pre-MGI REs is established. Section 4 demonstrates control of the RE beam current and vertical position, while section 5 describes the effect of elongation on post-disruption RE dynamics in TCV. The paper concludes by discussing its contribution to understanding disruptions and RE beam formation. Full conversion from ohmic to RE current may facilitate modelling efforts [7, 10, 35–38] as MHD evolution is somewhat simplified.
2. RE beam formation via neon MGI-induced disruption in TCV
Unless otherwise specified, TCV shots reported in this paper are all based on a similar baseline scenario, illustrated here by TCV shot #52717 (shown in figure 1).

Figure 1. Time evolution of basic plasma parameters in TCV reference shot #52717. (a) Plasma current and loop voltage; (b) line-averaged density from interferometry and peak plasma density from TS; (c) ECE temperature measured at the most central frequency channel (r/a = 0.5) and peak plasma temperature from TS; and (d) hard x-ray (HXR) measurements: blind CdTe detector of the top HXR tomographic spectrometer camera and ex-vessel photomultiplier signal. Note: a sudden drop of core temperature associated with a significant rise in HXR measurements indicate the formation of a post-disruption RE beam.
Download figure:
Standard image High-resolution imageThe pre-MGI phase is characterised by a Ip = 200 kA ohmically-driven, limited, circular plasma with toroidal field BT = 1.43 T, major radius Rp = 0.88 m, and minor radius ap = 0.25 m. The peak electron density drops below ne,0 < 0.5 × 10¹⁹ m−3 and the peak electron temperature slowly decreases to Te,0 = 0.75 keV at t = 0.4 s. In these conditions, the estimated on-axis electric field is much higher than critical, with E/Ec ≃ 40 (E/ED ≃ 6%) at t = 0.4 s, generating a significant RE seed population 8 . The RE seed growth is accompanied by a drop in the loop voltage with an associated drop in the core temperature (most likely due to reduced ohmic heating) to Te,0 = 0.45 keV by the time a disruption is triggered at 0.47 s. Electron cyclotron emission (ECE) is collected along a horizontal line of sight located below the plasma axis at ZECE = 0.21 m. The radiation temperature estimated for the frequency channel corresponding to the most central location r/a = 0.5 is proportional to Thomson scattering (TS) temperatures up to t = 0.25 s. The signature of fast electrons that becomes apparent at this time increases up to the time of disruption. A sharp increase is observed at t = 0.37 s, which corresponds to a significant drop in the loop voltage probably indicating that a significant fraction of the plasma toroidal current is now carried by REs.
RE presence and population evolution are monitored by the photo multiplier tube for hard-x rays (PMTX), a scintillator–photomultiplier assembly located in a technical equipment box outside the vessel. PMTX detects photons in the hard x-ray energy range, which are typically generated by core collisional fast electron bremsstrahlung [39–42] or thick-target bremsstrahlung from electron interactions with the first wall [43]. In both cases it is estimated that the photon energy must exceed  to traverse the vessel wall and reach the PMTX detector. Since the original electron energy must be higher, and given the RE critical energy for this scenario (
 before MGI and
  in the RE beam phase), it follows that radiation detected by the PMTX under these conditions originates from REs.
Hard x-ray (HXR) emission is also accessible to two cameras of the HXR tomographic spectrometer (HXRS) system, each featuring 25 CdTe diode arrays [44]. One such camera is arranged around a horizontal axis and can be rotated so that its lines of sight lie in either a horizontal or a vertical plane. The other camera is fixed and arranged around a vertical axis with lines of sight in the poloidal plane. In each camera the last detector—refered to as the blind detector—receives no collimated emission from the vessel. Thus any signal detected on this diode must originate from a photon having traversed the camera lead shield, which also includes at least 2 cm of tungsten, with a corresponding photon energy estimated above  .
.
A DMV is located on the low-field side (R = 1.31 m) at the vertical position Z = 0.44 m, which is half-way between the plasma configuration's horizontal midplane (Zp = 0.32 m) and its uppermost position as illustrated in figure 2. Neon stored at a pressure of 7.2 bars in a 150 ml reservoir is injected through a nozzle of throat diameter d = 1 mm at t = 0.47 s with a duration of Δt = 5 ms, corresponding to approximately NNe ≃ 3.12 × 10¹⁹ neon atoms. Injection immediately initiates a strong rise in the plasma density (figure 1(b)), the line-integrated density increasing from  at t = 0.47 s to
  at t ≃ 0.5 s. TS data (see appendix

Figure 2. Evolution of the magnetic equilibrium in shot #52717 before and after MGI. The location of the DMV is indicated by a blue arrow, with a red solid line indicating the interferometry line of sight used for density measurement.
Download figure:
Standard image High-resolution imageThe ohmic drive in this particular discharge is terminated at t = 0.5 s 11 with the current in the ohmic coil programmed to remain constant thereafter (dIOH/dt = 0). The plasma current is then seen to decay at a rate of dIRE/dt ≃ 270 kA s−1, presumably due to RE particle and energy loss due to various mechanisms such as collisions with the background plasma (deuterium and neon), synchrotron emission, MHD modes, and possibly kinetic instabilities [27–29]. A small reproducible transient spike in the—externally measured—loop voltage is observed immediately after the MGI. Interestingly, it decreases below the pre-disruption value before the ohmic drive is terminated, indicating that the transition from ohmic to RE driven current is well under way. The residual loop voltage after t = 0.5 s is related to the plasma current decay dynamics: as REs slow, or are transported away from the beam, the plasma current decreases, which, in turn, induces a toroidal electric field [28, 45]. This electric field contributes to maintain, or replenish, the runaway population and illustrates a continuous conversion of magnetic to kinetic energy [46] in the dissipative evolution of the post-disruption plasma. The HXR emission and the measured line-integrated electron density decrease together with the RE current (figure 1(b)). As the current drops, the plasma shrinks (figure 2), but overall plasma position control is stable up to t ≃ 0.8 s (Ip ≃ 100 kA), at which stage the RE beam is finally lost following a vertical instability. RE beam position and current control will be further discussed in section 4.
The DMV is triggered again in some discharges to study the effect of a second high-Z MGI [21, 22, 27–29, 47], that has been shown to suppress formed RE beams on other tokamaks, e.g. DIII-D [5, 48] and ASDEX Upgrade [6, 21, 22]. Here we show one example to illustrate the effect with detailed analysis and model comparisons reported elsewhere [49]. Figure 3 shows a comparison between a single MGI discharge (#52717) and another that is programmed identically up to a second MGI (#52719). The same first injection (N1 ≃ 3.12 × 10¹⁹ Ne atoms) is used in both cases to trigger the disruption and create the RE beam. In shot #52719 the second MGI occurred Δt = 0.13 s later. As the same DMV is used for both injections, the working gas and pressure are identical (neon, 7.2 bar), with the injected gas quantities adjusted by the valve opening time. The second injection (80 ms) is 16× longer than the first (5 ms) corresponding to N2 ≃ 4.65 × 10²⁰ Ne atoms, i.e. about 15× that of the first injection 12 . As shown in all four panels of figure 3, the RE beam evolution is very similar up the second injection, further illustrating the reproducibility of this RE beam generation scenario.

Figure 3. Illustrating the effect of second neon MGI. Panels show (a) Ip plasma current, (b) Vl loop voltage, (c)  line-averaged density and (d) PMTX signal. While complete suppression of the beam was not achieved by the second MGI in shot #52719, some extra gas (indicated by the density measurement (c) and increased HXR radiation (d)) penetrated the beam and caused stronger current dissipation.
Download figure:
Standard image High-resolution imageThe current decay rate, which is proportional to the plasma effective resistivity (in runaway-dominated, post-disruption, plasmas characterized by an effective critical field  [27–29]), is
  kA s−1 (figure 3(a)) before the second injection. Following the second injection, it increases to
  kA s−1, a factor of only
  , despite
  more injected gas from the DMV. In a post-disruption plasma dominated by high-Z impurities, the RE current decay rate is characterized by the density and charge distribution of high-Z particles, but its scaling depends on the type of impurity, its charge state distribution, and the interacting electron distribution [27–29]. If we assume that the average neon ionization state in the plasma is similar before and after the second injection, then the neon particle density in the plasma is roughly proportional to the electron density (since nNe ≫ nD). The line-averaged density (figure 3(c)) does, indeed, increase by a factor
  . Further analysis of RE current decay rates following single and dual MGI, together with detailed model comparison, is out of scope of the present paper, and will be reported elsewhere [49].
3. Importance of the pre-disruption RE seed on RE beam formation
Analysis of reference shot #52717 in section 2 demonstrates a significant seed of REs before the MGI-triggered disruption. The importance of this seed is illustrated by two sets of experiments.
In shots #52717, #52743, and #52742 shown in figure 4 (left column), the target pre-MGI electron density is adjusted to values of  , respectively. The target density is typically reached by t = 0.3 s and maintained until MGI at t = 0.5 s. In all cases the ratio E/Ec > 40, with E/ED ≳ 8% before the MGI trigger, is such that significant RE generation is expected. Higher densities correspond to higher critical energies and slower RE generation rates [24, 50]. Formation of a post-disruption RE beam is observed in shots #52717 and #52743 but absent in the higher density shot #52742 (
 ).
).
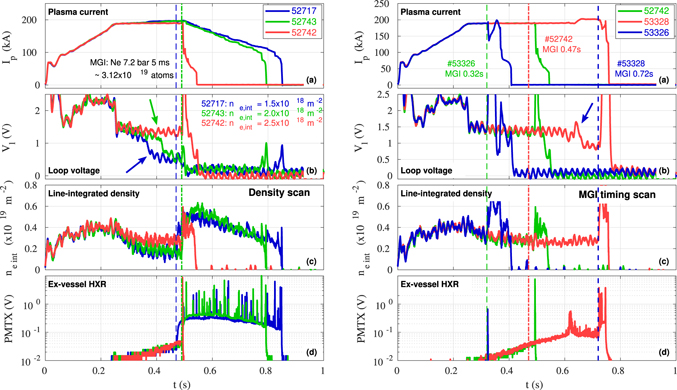
Figure 4. Importance of pre-disruption seed illustrated by comparing (left) three shots with different density evolution and (right) three shots with similar density evolution but different injection times. Panels show (a) Ip plasma current, (b) Vl loop voltage, (c)  line-integrated density and (d) PMTX signal. Seed formation is evidenced by (b) a drop of loop voltage (marked by arrows) and (d) increased PMTX signal followed by (a) a RE beam.
Download figure:
Standard image High-resolution imageSince the higher density may affect the disruption dynamics in other ways than seed formation, in second set of experiments (figure 4, right column) shots #53326, #52742 and #53328 are programmed identically except for MGI time (t = {0.32, 0.47, 0.72} s, respectively). The pre-disruption electron density is kept constant from t = 0.3 s onwards at  . In shot #53328 the PMTX signal increases continually until t = 0.6 s. Between t = 0.6 s and MGI at t = 0.72 s, the PMTX signal shows a series of spikes that appear related to sudden RE loss events. After MGI, the RE beam forms and survives for about 40 ms, where it is lost to a VDE event. In shots #53326 and #52742, MGI is triggered at an earlier time when the PMTX signal is a small fraction of #53328's pre-MGI value. No loop voltage drop is observed before the disruption, nor is a RE-beam formed following the disruption.
These experiments indicate that a strong seed of pre-disruption RE electrons is necessary for an MGI-triggered disruption to be followed by RE beam formation on TCV. In all cases where a post-disruption RE beam is observed, the pre-disruption phase is characterized by a relatively sudden, and significant, drop in the loop voltage during the flat-top phase (up to 50%). The time delay after which this drop occurs increases with density: t = 0.35 s for #52717 ( , ne,0 ≃ 0.35 × 10¹⁹ m−3), t = 0.42 s for #52743 (
 , TS core density not available), and t = 0.65 s for #53328 (
 , ne,0 ≃ 0.65 × 10¹⁹ m−3). This implies that the loop voltage drop could be related to the seed RE reaching a critical density. It can be generally inferred that a growing RE population, driving a significant fraction of the plasma current, reduces the average plasma resistivity and modifies the plasma current distribution. To completely understand the underlying dynamics, relativistic electron kinetics and plasma equilibrium evolution must be modelled self-consistently, which is not attempted in this paper.
In discharges where a loop voltage drop is not observed (#52742 and #53326) MGI-triggered disruptions do not generate a RE beam. A large spike in the PMTX signal indicates, however, that a RE seed is expelled during the TQ. RE losses may result from MHD activity mirrored by a corresponding spike in the loop voltage signal. When a pre-disruption loop voltage drop occurs, current re-distribution may modify the safety factor profile so as to reduce MHD activity during TQ such that seed REs are better confined, facilitating RE beam formation.
Figure 5 summarizes ∼80 circular (κ ⩽ 1.1) TCV discharges with MGI disruptions that investigate the conditions for which a post-disruption RE beam is formed. MGI-triggered disruptions did not generate RE beams above a core density threshold of ne,0 ≃ 1.1 × 10¹⁹ m−3. Cases below this value—where a RE beam is formed—are grouped and characterized by a pre-disruption loop voltage that is significantly lower than those without a post-disruption RE beam. This lower loop voltage could indicate a pre-disruption RE population sufficiently large to increase the plasma conductivity. On TCV, such a strong RE seed appears to play a crucial role in the formation of a post-disruption RE beam.

Figure 5. Cumulative plot illustrating the dependence of RE beam formation on pre-disruption peak electron density and RE seed formation, evidenced by the change in loop voltage. (Only near-circular discharges with 0.95 ⩽ κ ⩽ 1.1 are considered.) The marker positions indicate the values of the peak electron density (from TS measurements) and loop voltage just before MGI. Circles (⊙) represent cases where a RE beam is formed—with full conversion from ohmic to RE current—whereas crosses (×) represent cases without the formation of a post-disruption RE beam. Diagonal dashed lines indicate characteristic values of classical E/Ec [31].
Download figure:
Standard image High-resolution imageWhereas the Spitzer conductivity is only weakly sensitive to the electron density [51], RE generation is strongly dependent, through the critical field Ec [31]. This is illustrated in figure 5 where the loop voltage increases linearly with electron density for a strong RE seed, whereas such a dependence is less pronounced otherwise. Diagonal dashed lines indicate characteristic values of classical E/Ec ∝ ne [31] calculated before the MGI trigger but after the drop in Vloop. Discharges that did not produce a post-disruptive RE beam are mostly characterized by higher values of E/Ec and E/ED before the disruption. The difference results from the loop voltage drop associated with the growth of a significant pre-disruption RE current.
Based upon typical plasma parameters before the MGI (core electron temperature Te,0 < 1 keV, E/ED ≃ 6%–8% and E/Ecrit ≃ 20–40), we infer that RE seed generation is dominated by the Dreicer mechanism [52]. Hot-tail generation [38] may play a role during the TQ, whereas avalanches dominate during the RE beam dissipation phase [52]. Further modelling is required to confirm this prediction and quantify the respective contribution of the various mechanisms at play.
4. Control of the RE beam position and evolution via the ohmic drive
Once a RE beam is formed, control of its current using the central solenoid (CS) [48] is of interest for two specific purposes. First, if the vertical and radial stability of the beam can be maintained, a straightforward RE mitigation method is to ramp down the RE beam current using the CS. Second, applying a controlled level of ohmic drive (either negative or positive) provides an actuator for experimental studies (e.g. extending/reducing the duration of the RE beam) and model comparisons (e.g. for the validation of kinetic models [29]). By default, in TCV RE experiments reported here, the CS current is preprogrammed to maintain dIOH/dt = 0 following the first MGI, to observe the natural evolution of the RE beam.
As illustrated in figure 6, both increased and decreased controlled RE beam decays were achieved by applying negative or positive current variation in the CS coil, respectively. Results are compared with shot #52717 described in section 2, as a reference for the natural evolution with dIRE/dt ≃ 270 kA s−1 for dIOH/dt ≈ −0.3 kA s−1. In #52724, the decay rate increased to dIRE/dt = 420 kA s−1 with an ohmic drive of dIOH/dt ≈ −4.2 kA s−1. In #52716, a constant plasma current is prescribed and maintained for  , providing the longest-lived RE beam achieved in this TCV experimental campaign. Maintaining Ip ≃ 200 kA required a flux consumption rate of dIOH/dt ≈ 5.2 kA s−1.
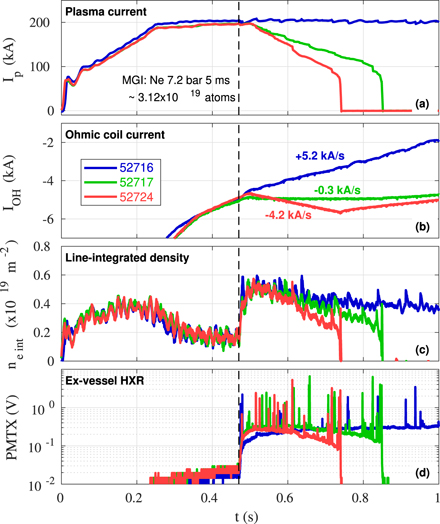
Figure 6. Illustration of RE drive/damping using the CS (ohmic drive). Panels show (a) Ip plasma current, (b) IOH CS current, (c)  line-integrated density and (d) PMTX signal. The RE beam can be fully sustained (#52716), or damped (#52724), compared to the non-driven evolution (#52717).
Download figure:
Standard image High-resolution image4.1. Control of the RE beam position
The post-disruption RE beam vertical position sometimes requires adjustment during the IRE decay. In addition, displacing the RE beam vertically can optimize diagnostic coverage and/or provide a scan of plasma profiles [25, 26].
Control of the post-disruption RE beam vertical position is demonstrated in shots #53660, #53661 and #53664 (figure 7), which are similar up to MGI at t = 1.2 s. No Ohmic drive is imposed after MGI, and all three shots' post-disruption RE beam decays at a similar rate of dIRE/dt ≃ 340 kA s−1. Shot #53660 is programmed to hold the pre-MGI vertical position Z = 0.32 m at t = 1.2 s. In shots #53661 and #53664, the vertical position is swept from an initial value of Z = 0.32 m at t = 1.2 s to a final value of Z = {0.09, 0.23} m at t = 1.45 s, respectively, after which the position is held until the beam is lost. In #53660, the beam slowly drifts upwards to Z = 0.36 m at t = 1.5 s and is then lost at IRE ≲ 80 kA. In #53661, the beam is lost earlier at t = 1.4 s for Z = 0.06 m with a RE current IRE ≃ 120 kA.

Figure 7. Control of RE beam vertical position. Panels show (a) Ip plasma current, (b) Zmag vertical position, (c)  line-integrated density and (d) PMTX signal. Displacing an existing RE beam up (#53660) or down (#53661) in the vessel is possible as long as the current remains above IRE ≳ 100 kA. Optimal position control is achieved at Z = 0.23 m (#53664) where the RE beam is position controlled until IRE ∼ 20 kA, i.e. less than 10% of the initial RE beam current, for a beam length of τRE ∼ 650 ms.
Download figure:
Standard image High-resolution imageWith the RE beam held at Z ≃ 0.23 m (shot #53664 in figure 7), vertical position control is most effective for TCV's poloidal field coils arrangement. In #53664, the plasma position is maintained at Z ≃ 0.23 m up to t = 1.85 s, for a total RE beam duration of 650 ms. The RE beam is maintained until IRE ≲ 20 kA, the programmed threshold for TCV's current quench detector, that then instigates a controlled shutdown. It remains highly possible that the RE beam could be sustained for even lower current values. Effective vertical position control, as well as mitigation of a RE beam via controlled current decay, have thus been demonstrated in TCV.
5. The effect of elongation on post-disruption RE dynamics
RE beam experiments following triggered disruptions in tokamaks are often performed using circular or low elongation configurations, from shaping limitations, or to meet vertical stability requirements. However, since high elongation is a common feature of fusion efficient configurations [53], it is essential to understand the effect of plasma elongation on RE dynamics and post-disruption RE beam formation.
An elongation scan was performed on TCV, exploiting its extensive shaping capabilities [19, 23]. The base scenario was slightly modified to circumvent difficulties encountered attempting to attain the low electron densities required for RE beam formation. Specifically, the target current is reduced to Ip = 150 kA and the vertical position is set to z = 0.23 m where TCV's vertical control performs well (see section 4).
Figure 8 illustrates the effect of elongation on RE beam generation & control with both κ and the pre-disruption density varied between shots. A moderate plasma elongation does not prevent the formation of RE beams, which is an important observation for fusion reactor design and operation. The density threshold, which is related to the size of the necessary RE seed for beam formation, does not vary significantly with the elongation. However, high elongation configuration (κ > 1.4) cases do not lead to confined RE beam formation for Ip = 150 kA plasmas even for ne,0 ≃ 0.2 × 10¹⁹ m−3 with a clear boundary for beam formation in the ne,0–κ space.

Figure 8. The effect of elongation (κ) on RE generation, scan performed with Ip = 150 kA. RE generation as a function of density and elongation. A clear boundary is observed between beam and no-beam shots.
Download figure:
Standard image High-resolution imageShots executed in subsequent experimental campaigns using different RE scenarios—i.e. with higher Ip value up to 250 kA—led to RE beam formation for elongations up to κ ≃ 1.5 in TCV [23, 49]. The RE beam was then lost during the natural RE plateau decay with Ip > 150 kA. In figure 9, MGI in shot #58661 (Ip = 150 kA, κ = 1.4) did not generate a RE beam in spite of the very low density (ne,0 ≃ 0.5 × 10¹⁹ m−3) 13 . MGI in shot #61437, with a similar elongation but a higher maximum current (Ip = 200 kA), generated a RE beam that was lost to vertical instability when the RE current had only decayed to (IRE = 170 kA). The RE beam generated in shot #61442, with both higher current and higher elongation (Ip = 250 kA, κ > 1.5), was lost at an even higher value of RE current (IRE = 230 kA) showing that TCV's RE beam vertical stability decreases with elongation and appears as the main limiting factor for RE beam generation in more elongated plasmas.

Figure 9. Illustration of the effect of elongation and current on post-disruption runaway beam control. Higher elongations require higher RE beam currents to allow vertical position control, i.e. beam stability is possible for a current that scales with elongation.
Download figure:
Standard image High-resolution image6. Summary, discussions, and outlook
In the TCV experiments dedicated to post-disruption REs, a reproducible scenario for the formation of a RE beam is established via massive neon injection into a low-density, circular, limited plasma. In the experiments reported here, full conversion from ohmic to RE driven current is observed. The formation of a post-disruption RE beam is found to depend upon a pre-disruption RE seed that is large enough to significantly increase the plasma conductivity. RE seed build-up requires a low background plasma density ne,0 < 1 × 10¹⁹ m−3, and sufficient time for the RE population to grow.
Control of the post-disruption RE current is demonstrated using the ohmic drive to either increase or decrease the decay rate as compared to its intrinsic rate obtained when ohmic drive is absent. With a stronger ohmic drive, the RE current can be maintained at the pre-disruption value Ip = 200 kA for over a second. The vertical position of the post-disruption RE beam is controlled using TCV's poloidal field coil array. At an optimal position of about Z ≃ 0.23 m, stable control of the decaying RE beam is demonstrated until the plasma current decreases to ∼20 kA, providing a successful mitigation paradigm. Additional MGI into existing RE beams leads to an increase in the current decay rate, in good agreement with recent theory predictions [29, 49].
For a given plasma current, a threshold for RE beam formation in elongated TCV plasmas is identified at κ ≃ 1.5. The limitation appear to be related to the stability and control of elongated plasmas.
TCV experiments to follow will further investigate the effect of plasma shaping (triangularity, up–down asymmetry, diverted plasma, etc) on RE beam formation and dynamics. Additional fast electron diagnostics (vertical ECE, Cerenkov detectors, measurements of synchrotron radiation) will become available and/or optimized for RE dynamics monitoring.
Global disruption evolution simulations by codes such as GO [54–57], ASTRA [58, 59] or DREAM [60] can benefit from the simplification of full conversion to RE-driven current. Conversely, further understanding of the RE dynamics and RE beam formation in this set of TCV experiments may be expected from ongoing modelling efforts, which have been initiated for each phase of the plasma evolution described in the paper text.
Although TCV's RE beam is not of the same magnitude and does not have the same potential for damage as in machines like JET and ITER, it displays a rich range of physical phenomena that are extremely pertinent to validating the models with which we hope to master the problem.
Acknowledgments
This work has been carried out within the framework of the EUROfusion Consortium, funded by the European Union via the Euratom Research and Training Programme (Grant Agreement No. 633053—EUROfusion). Views and opinions expressed are however those of the author(s) only and do not necessarily reflect those of the European Union or the European Commission. Neither the European Union nor the European Commission can be held responsible for them.
Appendix A.: Determination of the post-disruption electron temperature
The TCV TS system during the campaigns reported in this paper consisted of 22, older, four-channel, core spectrometers, 12 newer, five-channel, core spectrometers, and 12 newer, four-channel spectrometers specifically designed for pedestal analysis and thus installed on the lower lines of sights.
Determination of the electron temperature requires a measured signal above noise level in at least two adjacent spectroscopic channels. From the spectral bandwidth associated with each channel, it is thus possible to determine a range of measurable temperatures. The minimum temperature that can be measured with older and newer spectrometers is estimated to be 25 eV and 5–10 eV, respectively.
The RE experiments reported herein are with a plasma positioned in the upper half of the chamber, where the DMV port is located. In this configuration the plasma center is viewed by old core spectrometers. A systematic analysis of TS raw data shows that, for all shots presented in this paper, the signal measured on the second to fourth lower-wavelength channels is in the noise level during the post-disruption phase. It is thus be infered that the post-disruption temperature in these plasmas is below 25 eV.
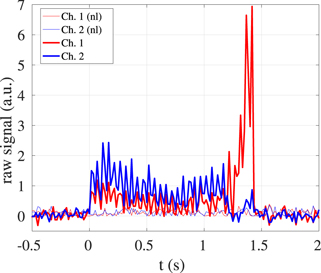
As an example, in shot #53661 the plasma was moved downwards after the disruption to probe the vertical control of the RE beam position (see section 4). Here, the descending RE beam intersected the uppermost line of the newer five-channel spectrometer array, more specifically polychromator #50. The intersection point between the TS line and the laser approaches the RE beam center as the beam moves downwards. In figure A1, the uppermost line of sight from the five-channel spectrometer array and the plasma position at t = 1.4 s are shown.

Figure A1. TCV coverage by the TS system for the shots reported in this paper. The uppermost line of sight from the five-channel spectrometer array is highlighted. The plasma position for shot #53661 at t = 1.4 s is also indicated.
Download figure:
Standard image High-resolution imageFigure A2 plots the signal measured in the second channel of the illuminated five-channel spectrometer, which increases above noise level from about t = 1.3 s until the RE beam collapse at t = 1.45 s, where a temperature of 6 ± 1 eV is estimated from the signal ratio between channels 2/1. As the plasma, limited on the inside wall, is small in the later stage of the RE beam, TS measurement points along the laser line are located outboard of the plasma center, where the electron temperature may be higher. In conclusion, we can estimate that the core electron temperature during TCV RE shots is somewhere between 6 eV and 25 eV.
Figure A2. Raw data measured by the TS polychrometer in TCV shot #53661 as a function of time. The two higher-wavelength (lower-energy) channels are shown, along with the noise level measured by the same detectors just before the laser pulse.
Download figure:
Standard image High-resolution image
Appendix B.: List of shots included in compilation figures
Figure 5 was compiled using data from the following TCV discharges: #52711, #52712, #52716, #52717, #52718, #52719, #52720, #52721, #52722, #52723, #52724, #52725, #52737, #52738, #52739, #52740, #52741, #52742, #52743, #53323, #53325, #53327, #53328, #53329, #53330, #53331, #53332, #53333, #53394, #53395, #53396, #53652, #53653, #53655, #53656, #53657, #53658, #53659, #53660, #53661, #53664, #53724, #53726, #53729, #57778, #57838, #57839, #58077, #58113, #58143, #58144, #58146, #58153, #58541, #58542, #58543, #58544, #58545, #58546, #58551, #58552, #58554, #58555, #58556, #58559, #58560, #58562, #58563, #58564, #58565, #58568, #58569, #58570, #58653, #58654, #58664, #58665, #58666, #58667, #58668.
Figures 8 was compiled using data from the following TCV discharges: #58113, #58146, #58545, #58546, #58551, #58552, #58554, #58558, #58559, #58560, #58562, #58563, #58564, #58565, #58566, #58567, #58568, #58569, #58570, #58655, #58656, #58657, #58658, #58659, #58661, #58662, #58663.
Footnotes
- 8
The Dreicer field ED = Ec(mc2/Te) characterizes the value of the electric field above which thermal electrons with kinetic energy Te will run away. Note that in this paper the electric field E is calculated from the loop voltage measured by external coils, whereas Ec and ED are derived from core TS measurements. Thus E/Ec and E/ED are meaningful ratios only when evaluated after a steady period of several current redistribution times when the toroidal loop voltage is nearly uniform.
- 9
Understanding that the post-disruption plasma is probably non-thermal at first.
- 10
Negative voltage on the HXRS measurement results from baseline correction applied when the signal intermittently reaches saturation level.
- 11
In a dedicated scan, the time delay between MGI and dIOH/dt → 0 was varied from −10 to +30 ms. No difference in RE beam formation and dynamics was identified.
- 12
The amount injected is not directly proportional to the opening time due to the buildup of the pressure wave.
- 13
During the pre-MGI phase shot #58661 enters a slideaway regime characterised by an extremely low loop voltage Vl < 0.5 V and RE energies that do not register due to the PMTX HXR energy threshold.