


Abstract
COMPASS addressed several physical processes that may explain the behaviour of important phenomena. This paper presents results related to the main fields of COMPASS research obtained in the recent two years, including studies of turbulence, L–H transition, plasma material interaction, runaway electron, and disruption physics:
Tomographic reconstruction of the edge/SOL turbulence observed by a fast visible camera allowed to visualize turbulent structures without perturbing the plasma.
Dependence of the power threshold on the X-point height was studied and related role of radial electric field in the edge/SOL plasma was identified.
The effect of high-field-side error fields on the L–H transition was investigated in order to assess the influence of the central solenoid misalignment and the possibility to compensate these error fields by low-field-side coils.
Results of fast measurements of electron temperature during ELMs show the ELM peak values at the divertor are around 80% of the initial temperature at the pedestal.
Liquid metals were used for the first time as plasma facing material in ELMy H-mode in the tokamak divertor. Good power handling capability was observed for heat fluxes up to 12 MW m−2 and no direct droplet ejection was observed.
Partial detachment regime was achieved by impurity seeding in the divertor. The evolution of the heat flux footprint at the outer target was studied.
Runaway electrons were studied using new unique systems—impact calorimetry, carbon pellet injection technique, wide variety of magnetic perturbations. Radial feedback control was imposed on the beam.
Forces during plasma disruptions were monitored by a number of new diagnostics for vacuum vessel (VV) motion in order to contribute to the scaling laws of sideways disruption forces for ITER.
Current flows towards the divertor tiles, incl. possible short-circuiting through PFCs, were investigated during the VDE experiments. The results support ATEC model and improve understanding of disruption loads.
Export citation and abstract BibTeX RIS

Original content from this work may be used under the terms of the Creative Commons Attribution 4.0 licence. Any further distribution of this work must maintain attribution to the author(s) and the title of the work, journal citation and DOI.
1. Introduction
The COMPASS tokamak was operated in the Institute of Plasma Physics of the Czech Academy of Sciences since 2009 and it was shut down for disassembly in August 2021. COMPASS was one of few devices with an ITER-like plasma shape. Its flexibility, extensive set of diagnostics, and neutral beam injection (NBI) heating contributed in closing the gaps of key issues in fusion research in support of ITER and DEMO, such as edge and scrape-off layer (SOL) physics, the L–H transition, runaway electrons and disruption studies, plasma-wall interaction. Thanks to its size and versatility, the COMPASS tokamak wasvery effective for testing new ideas and concepts in the area of plasma control and diagnostics development, which were then implemented on larger devices. The main COMPASS parameters are shown in the table 1.
Table 1. Main parameters of the COMPASS tokamak, operated by the Institute of Plasma Physics of the Czech Academy of Sciences (IPP Prague).
| Major radius | R = 0.56 m |
| Minor radius | a = 0.23 m |
| Toroidal magnetic field | BT = 0.9–1.7 T |
| Plasma current | Up to IP = 350 kA |
| Pulse duration | <500 ms |
| Line averaged electron density | Up to ne = 1.2 × 10²⁰ m−3 |
COMPASS can be operated with plasmas in single null divertor configuration and also in inner wall limited configuration with elliptical or circular cross-sections. It is equipped with two NBI heating systems that can deliver each up to 0.4 MW power in neutral particles accelerated to 40 keV energy to the plasma and it can achieve both ohmic and NBI assisted H-modes [1]. Typical cross-section and evolution of an NBI assisted ELMy H-mode discharge on COMPASS is shown in figure 1. Top view of the COMPASS tokamak in figure 2 shows the layout of the two NBI heating beam lines and key diagnostic systems.
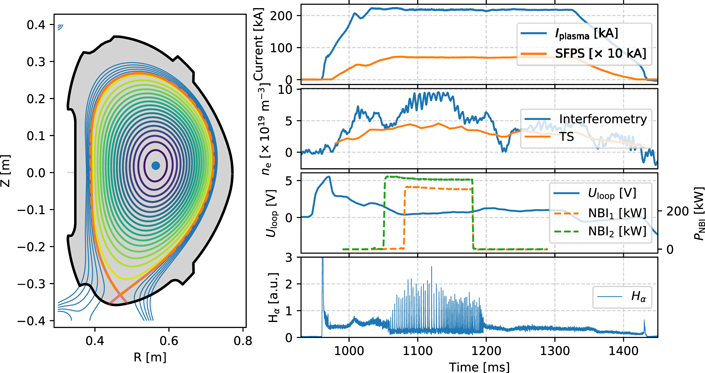
Figure 1. Example of a COMPASS H-mode discharge (#18252). (Left) Poloidal cross-section of the plasma (at t = 1200 ms). (Right) Discharge evolution showing the H-mode with ELMs during the interval from 1060 ms till 1190 ms; the panels show from top to bottom: (a) plasma current and current to the shaping coils; (b) plasma density as measured by the interferometer and by the Thomson scattering; (c) loop voltage and the heating beams' power; (d) plasma radiation in the visible spectra and the Hα line radiation.
Download figure:
Standard image High-resolution image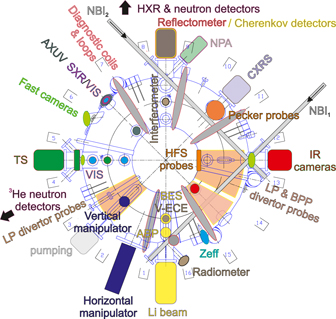
Figure 2. Top view of the COMPASS VV: the grey lines NBI1 and NBI2 denote the two beam lines of the NBI heating systems. Location of the key diagnostic systems is marked at the relevant ports, incl. the diagnostic labels.
Download figure:
Standard image High-resolution imageThe plasma shape in COMPASS is similar to the ITER tokamak, regardless of the size difference. This similarity allows to address some of the key design challenges of ITER as well as its future scientific applications arising from the European research roadmap to the realisation of fusion energy (fusion roadmap) [2] within EUROfusion. Research on COMPASS is therefore focussed on areas of high-temperature fusion plasma physics where it can produce unique results thanks to its parameters and diagnostic equipment. The main areas of research are:
- Edge, SOL, and divertor plasma physics.
- L–H transition physics and H-mode studies.
- Heat flux and power exhaust, plasma–materials interaction.
- Plasma instabilities physics.
- Tokamak core plasma.
- Runaway electrons.
- Disruption studies.
- Basic plasma physics.
COMPASS has been in a full scientific exploitation throughout the recent two years. Next to the internal IPP Prague programme, COMPASS was providing an open access to a wide community of users and also focussed on education in physics of high-temperature magnetized plasma.
2. Edge and SOL plasma: tomographic reconstruction of the edge turbulence and structure tracking using a single visible camera
A popular way of diagnosing tokamak edge plasmas is to use fast cameras, sensitive in the visible part of the spectrum, that provides information on the interaction of the neutral gas, naturally present in the SOL due to recycling or gas injection, and the plasma. However, interpreting the data obtained with a single camera is not straightforward. The camera image is 2D, while the observed objects (filaments, plasma shape) are 3D, resulting in the lack of one dimension to fully describe the problem. In addition, the neutral density being rather low, the observed objects are also transparent, meaning that the camera signal is line-integrated along the line-of-sight paths of each pixel.
To overcome these problems, a commonly used solution for turbulent structures observation consists of imaging the injection of neutral gas in a 2D poloidal plane. This technique, better known as gas-puff imaging, directly provides intersections of filaments (structures elongated along the field lines) with the poloidal plane, i.e. blobs, allowing then to infer their properties, such as position, velocities, size in this plane. Another advantage of gas-puff imaging is that the gas injection enhances the light emission allowing cameras to record at lower exposure and, therefore, at higher frame rate. However, the data interpretation requires caution as the injected gas also perturbs the local observed turbulence and is not strictly injected in a 2D plane, resulting in a structure deformation due to the projection along the toroidal direction [3].
Another possibility to retrieve a 2D poloidal section without using any gas injection would be to use several camera fields of view and perform tomographic inversion, similarly to what is done with bolometers or soft x-rays detectors. However, maximising the chances of a successful tomographic reconstruction would require as perpendicular as possible lines of sight, which can be quite problematic for filament observations, for instance, as these structures are elongated along the field lines, while being narrow in the cross-field direction. In that particular cross-field observation case, the signal of a camera pixel related to a given filament would be hardly distinguishable compared to the background emissions due to line integration and the inversion would not be possible.
Based on those pros and cons, another solution was considered and developed at the IPP Prague. First initiated by Nguyen van Yen on ToreSupra [4], the technique consists of finding a symmetry in the system that would reduce the observed object to its cross section in the 2D poloidal plane and then performing tomographic inversion of the camera images. In that case, no gas injection is required, hence no perturbations, as the symmetry is inherent to the observed object and a single camera can be used. Depending on the physical observation, different symmetries can be considered. In [5], helicoidal symmetry, i.e. constant emissivity along field lines, was assumed, suitable for filament/turbulent observations, but toroidal symmetry can also be envisaged in case of structures with slowly varying emissivity along magnetic flux surfaces, e.g. plasma shape observation. Once the symmetry is chosen, it is possible to discretize the real space (the poloidal plane) and build a matrix, often called geometrical or transfer matrix, here K, that maps the plasma emissivity S0 in the poloidal plane to the camera plane or image I0 by the following formula

The next step is to retrieve the plasma emissivity by inverting the matrix K. However, they are several reasons for which K cannot be simply inverted (noise, reflections, line-integrated data) and one needs to use regularization methods to solve equation (1). At IPP Prague, two algorithms are used: the biorthogonal vector decomposition, presented in [5], also called wavelet-vaguelette decomposition in [4], and the minimum Fisher regularization (MFR) [6]. The former algorithm has an advantage over more classical regularization algorithms, like the MFR one, as it does not depend on any a priori parameters or smoothing and only requires to properly choose an orthonormal basis in the poloidal plane to perform the inversion. In [5], it is shown that the algorithm performs well even with the simplest orthonormal basis, where each vector is a node (a pixel or rectangle) of the plane, though using a wavelet basis, like in [4], would probably help reducing the noise and make the inversion more robust. An example of tomographic inversion using the biorthogonal vector decomposition algorithm on COMPASS camera data observing turbulent structures is presented in figure 3. The reader may refer to [5] for more details on the experimental setup. The structures can be followed every 3.7 μs period of the Photron camera. The positive blobs (presented in yellow in the figure are structures radiating above the median level, calculated over 10 images, while the negative holes (in blue) radiate less than the median level. It can be seen in figure 3 that one blob and one hole experience an outward radial and downward poloidal movement. At some given radial position, the blobs stretch and vanish, which may indicate the location of a shear layer. It is clear from figure 3 that the output of the tomographic technique is very similar to what could be observed with gas-puff imaging, while with this technique no exterior perturbation is introduced.
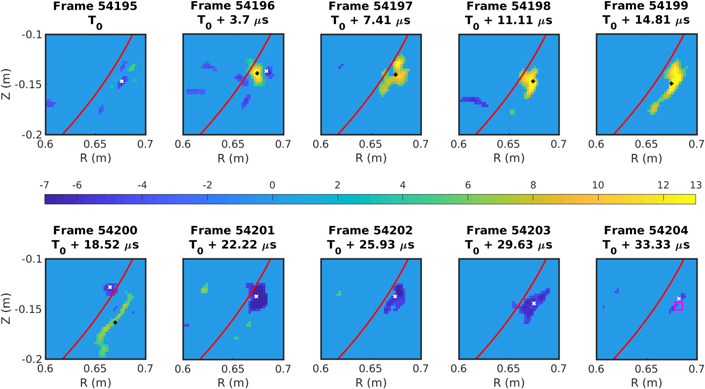
Figure 3. Reconstructed poloidal planes at toroidal angle of 55° for ten frames taken from the discharge #15487 around T0 ∼ 1150 ms. The black (+) and white (×) crosses indicate the centre of mass of positive and negative structures, respectively, automatically detected and tracked by the TRACK software. The red line indicates the position of the separatrix obtained from EFIT reconstruction. The pink rectangle corresponds to the zone chosen to obtain next figure. Reproduced courtesy of IAEA. Figure from [5]. © EURATOM 2019.
Download figure:
Standard image High-resolution imageLast but not least, thanks to the collaboration of the IPP Prague with the University of Lorraine (Nancy, France), which is in close collaboration with the French APREX-solutions startup [7] (developer of the TRACK software, able to detect and track camera events), it has been possible to individually track single structure movements and obtain their poloidal and radial velocities. In figure 4, the histograms of both these velocities obtained in the pink rectangle region in figure 3 (see the bottom-right corner image) and after analysing 10 000 reconstructed images are shown. Both histograms have large velocity extents, with even negative values (upwards and inwards propagation), showing the complexity of the turbulence in the SOL and the importance of individually following single structure movements to properly and statistically render their motion.
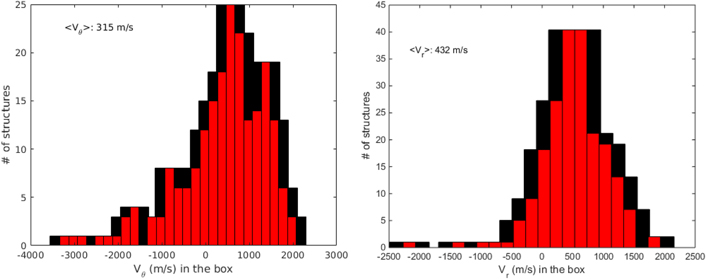
Figure 4. Radial and poloidal velocity distributions (left and right, respectively) calculated with TRACK in the small region delimited by the pink rectangle in figure 3. The step of the red colour distribution is 200 m s−1, while the black bars represent the broadening of the distribution assuming a systematic one-pixel error detection of the structures (±650 m s−1). The average radial and poloidal velocities are also indicated on the picture. Reproduced courtesy of IAEA. Figure from [5]. © EURATOM 2019.
Download figure:
Standard image High-resolution image3. L–H transition
Extensive sets of experiments have been performed in order to study the L–H transition. Main new findings were obtained in characterization of the power threshold dependence on the X-point height above the divertor, as well as in the observations of the effect of controlled HFS error field (EF) on the L–H transition.
3.1. Dependence of the L–H power threshold on the X-point height
The dependence of the L–H power threshold on the X-point height above the divertor PLH(|X-div|) was analysed in the framework of causal graphical modelling. This motivated the separation (conditioning) of transitions into those with q95 ∼ 3 and those with higher or lower q95 and also the normalization (counterfactual reasoning) of PLH to a common reference density in order to block confounding effects. The results as presented in [8, 9] show a clear linear trend where the PLH can be reduced by 30% by lowering the X-point height above the divertor. While the trend with |X-div| is similar for all the discharges, those with q95 ∼ 3 have a base value of PLH larger by 30%, which might be related to the presence of intrinsic EFs.
Simultaneous measurements of the radial electric field Er (using radially reciprocating ball-pen probes (BPPs) measuring a floating potential close to the true plasma potential [10] in the SOL and inside the separatrix shows that Er increases (in absolute value), both upstream and downstream and inside the separatrix, with decreasing X-point height. This is qualitatively consistent with transport modelling in [11] and also consistent with the idea that the consequent change in the E × B shearing rate could be responsible for the change of PLH. These results have been presented in [8, 9] and the details will be presented in a follow-up publication.
3.2. Effect of controlled HFS error field on the L–H transition
The effect of controlled HFS EF on the L–H transition was studied in detail, utilizing the unique COMPASS HFS 3D coils. Using these coils, a displacement of the central solenoid was simulated, while different sets of coils were used to assess the error field correction (EFC) from the LFS and top/bottom of the vessel, which is of high importance for ITER, having in mind the detrimental effects of HFS EF observed on NSTX-U recently [12]. The LFS EFC was sufficient to suppress the core resonant component of the HFS EF [13] and prevent the locked modes that were otherwise induced by HFS EF in ohmic as well as H-mode discharges. However, the LFS EFC was not able to completely prevent the disruptions during the L–H transition in presence of HFS EF, only to reduce the probability that such a disruption occurs [14]. Hence it was demonstrated that the residual EF after correcting the core resonant component of HFS EF can still have a significant impact on the tokamak performance especially during the transient phases such as the L–H transition. In a following study in DIII-D, this disruptive effect of a residual EF was observed also in the case where both the EF and the EFC were generated from LFS by two separate sets of coils, while it was suppressed in the case where a third separate set of coils was used to further optimize the residual EF to form a so-called quasi-symmetric magnetic perturbation [15]. The details of the investigation of the mechanism inducing the disruptions during the L–H transition in presence of the residual EFs in COMPASS is a subject of a separate publication.
4. Edge localized mode (ELM) filaments in the scrape-off layer
A systematic measurement [16] of the edge localized mode (ELM) electron temperature was performed on the COMPASS divertor with a high temporal resolution (in the order of 1 μs) within the range (Te,div < 400 eV), using a recently built system of BPPs and roof-top shaped Langmuir probes (LPs) located in divertor [17]. The aim of this work was to perform dedicated enough fast measurements with well resolved ELM filaments at divertor in order to calculate the ratio ℜ between divertor (Te,div) and corresponding pre-ELM pedestal (Te,ped) electron temperatures, obtained by a high-resolution Thomson scattering system, ℜ = Te,div/Te,ped. For each ELM, we report the peak value of the electron temperature at different radial positions on the outer divertor; see e.g. figure 5. This profile was then fitted using the function (equation (2)) in [18], to obtain a representative maximum, Te,div,max, with an estimate of its error bar. In the particular case of the ELM plotted in figure 5, Te,div,max = 271 ± 23 eV, Te,ped = 300 ± 10 eV leading to ratio ℜ = 0.90 ± 0.08. This example shows that the maximum of the ELM electron temperature on the divertor can be close to the pedestal temperature. We have analysed 125 single ELM events within 45 H-mode discharges with plasma parameters ranging from 1.1 < BT (T) < 1.4; 220 < IP (kA) < 300; 2.5 < ne (*1019 m−3) < 10; with and without NBI heating. The resulting values of the divertor Te,div,max and pedestal Te,ped electron temperatures are shown in figure 6. Most points are found to be with ratio ℜ below 1. We have also found that the ratio ℜ has no clear dependence on the line averaged density ne, the toroidal magnetic field BT, the plasma current IP or on the relative ELM energy ΔW/W (W is the total pre-ELM plasma energy). Thus, an average value was calculated using all ELM events as ℜ = 0.82 ± 0.13. The light blue area with black lines represents the theoretical prediction of the ratio ℜ from the free-streaming kinetic model (FSM) [19, 20]. The FSM describes the propagation of initially Gaussian distributed ELM plasma particles into an empty SOL and in its simplest form predicts 2/3 < ℜ < 1. It is seen in figure 6 that the majority of all measurements as well as the averaged value fit to the FSM prediction. Good agreement between the FSM and the experiments is connected to the low collisionality of the outer SOL in COMPASS, where inelastic processes are negligible during the ELM. In summary, ELM filament-resolved electron temperature measurements on COMPASS point to a low energy transfer from electrons to ions and therefore suggests no significant enhancement of the ELM ion energy and physical sputtering, contrary to observations at JET [21, 22].
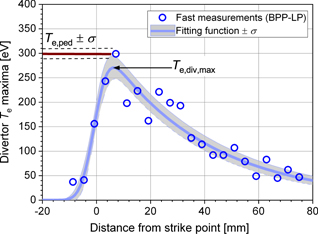
Figure 5. Example of an outboard radial profile of Te peak (maxima) values obtained during a single ELM event (NBI assisted H-mode #18235) using fast measurements (BPP-LP). Reproduced from [16]. © EURATOM 2020. CC BY 4.0.
Download figure:
Standard image High-resolution image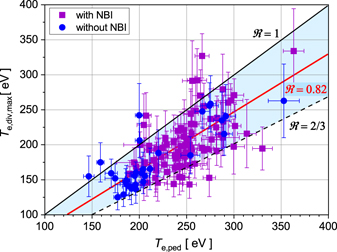
Figure 6. Comparison of the ELM electron temperature maximum on the divertor to the corresponding pedestal temperature in 125 ELM events with a final averaged ratio ℜ = 0.82. The black lines show the maximum and minimum values predicted by the FSM. Reproduced from [16]. © EURATOM 2020. CC BY 4.0.
Download figure:
Standard image High-resolution image5. Plasma–material interaction
5.1. Liquid metal divertor (LMD) experiments
Liquid metals are considered as an alternative to conventional metallic PFC with the main advantages of avoiding melting of leading edges, cracking or material properties deterioration subsequent to neutron irradiation. However, this solution comes with other issues which still need to be assessed, e.g. resilience to transients, tritium retention or metal evaporation [23]. Most of these are investigated experimentally in COMPASS for the first time under ELMy H-mode conditions in a tokamak divertor [24]. The technology used in these experiments is the capillary porous system (CPS) where the liquid metal is impregnated in a metallic mesh, made of Mo wires (with Ø = 100 μm and a pore radius of 75 μm in our case), and confined against MHD effects by capillary forces. Two specially designed CPS based LMD modules, one filled with pure Li and one with a LiSn alloy, composed of 73% of Sn, were installed in the COMPASS divertor in two separate experiments. One module was inserted at a time under the inner-strike point using a manipulator allowing vertical movements towards the plasma on a shot-to-shot basis. The top surface of each module has a cylindrical shape so that the incident angle of the magnetic field lines with the surface, and therefore the deposited perpendicular heat flux (qdep), increase gradually with insertion into plasma from 1.5° for zLMD = 0 to 48° for zLMD = 7.5 mm.
The Li module was exposed to 18 L-mode and 6 ELMy H-mode discharges and has successfully handled perpendicular heat fluxes up to qdep = 12 MW m−2 with no liquid Li droplets directly ejected from the CPS mesh surface (IR camera + fast visible cameras) and no deterioration of the Mo mesh. However, some Li droplets were observed to be moving across the module top surface in correlation with the strike-point movement. Kelvin-Helmholtz instabilities were ruled out because j × B forces are by orders of magnitude weaker than the surface tension. A possible explanation is the presence of a solid layer of oxidized Li visible in some areas of the CPS mesh top surface by IR camera (different emissivity). Visible spectroscopy lines in direct view of the LMD module show that the neutral lithium Li I (λ = 670.8 nm) is very well localized in space on the mesh. Fast visible cameras show that a red cloud corresponding to neutral lithium surrounds the module within ∼2–3 cm around the wetted area (compare to the distance between the two strike lines ∼6 cm), see figure 7. In L-mode and in between ELMs in H-mode, only the red cloud is visible on the cameras. During ELMs, a green plume corresponding to 1 time ionized lithium Li II (λ = 548 nm) is seen in both upstream and downstream directions leaving the LMD module for several tens of cm, followed by a blue colour that could be interpreted either as 2 times ionized lithium Li III (λ = 449 nm) or other Li II emission lines (at λ = 427 nm or λ = 431 nm) as seen in figure 7 with no perturbation of the plasma discharges.
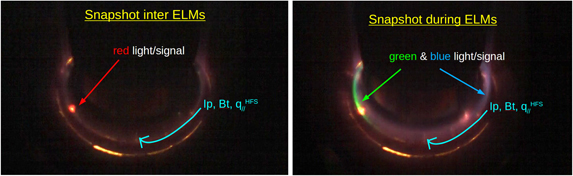
Figure 7. Snapshots from a fast visible camera viewing COMPASS divertor with the Li LMD module at 8 kfps & 40 μs exposure during H-mode discharge #19800 (zLMD = 3 mm, qdep = 11 MW m−2) representative of what is observed both in L-mode and in between ELMs (left) and when an ELM strikes (right). Reproduced from [24]. CC BY-NC-ND 4.0.
Download figure:
Standard image High-resolution imageNo vapour shielding was observed but this is consistent with the maximum surface temperature of the Li LMD module being less than 450 °C, estimated by forward thermal modelling [25]. In order to achive the vapour shielding with pure lithium, the surface temperature needs to exceed 750 °C so that there is enough evaporated lithium atoms to radiate all the incoming deuterium plasma heat flux, given by the radiative model in [25].
In order to get more insight on the lithium evaporation, re-deposition and transport in the vicinity of the target, a dedicated kinetic modelling via the 1D particle-in-cell Monte Carlo code BIT1 is performed [25]. Simulations predict that the radiating neutral lithium cloud has a radius of λmfp ∼ 6 cm. We indeed observe a Li vapour red cloud with comparable radius 2–5 cm (see figure 7). PIC simulation results also indicate that the Li ionization front is located well above both the Li+ gyro-radius (∼30 μm) and the magnetic presheath (<1 mm), leading to negligibly small prompt Li re-deposition Rprompt ∼ 0 in the COMPASS conditions, allowing the parallel transport of Li ions along the field lines. Post-mortem analysis of collecting samples installed in the machine during the experiment shows that Li was deposited all over the tokamak chamber, with maximum concentration on the samples in the closest vicinity of the LMD module (±30 cm), both upstream and downstream, consistent with camera observations [26].
The LiSn module was exposed in total to 25 ELMy H-mode discharges with a relative ELM energy ∼3% and local peak energy fluence at the module ɛELM = 15 kJ m−2. Under these conditions, the LiSn module showed good power exhaust capabilities by successfully handling average, perpendicular heat fluxes up to qdep = 12 MW m−2 with no droplets ejected from the CPS mesh surface at all (IR camera + fast visible cameras) and no deterioration of the Mo mesh nor the plasma performances. The LiSn LMD module surface temperature measured by IR camera reached 950 °C at the end of the discharges with maximum insertion (zLMD = 2.5 mm), which is below 1300 °C the temperature at which Sn is expected to evaporate, and with each ELM contributing to ∆TELM ∼ 45 °C. It should be noted that higher temperature was achieved with this module thanks to lower heat conductivity of its ceramic bulk, while the Li module bulk was fully metallic (Mo). Post-mortem inspection confirms the good status of the LiSn CPS mesh with absolutely no damage. As for the Li experiment, fast visible cameras show a red cloud corresponding to neutral lithium (Li0) around the LMD module over ∼2–3 cm around the wetted area, as well as the green plume (Li1+). No clear evidence of Sn is observed by the cameras, nor by visible spectroscopy. However, it has to be noted that our spectroscopy system was not optimized for Sn line detection that requires a low detection threshold. SOL profiles measured by the horizontal reciprocating probe do not show any difference when the LiSn module is inserted in the plasma or retracted in parking position (zLMD = −2 mm). Radiation in the core plasma (SXR and tomography reconstruction by AXUV) is also identical with or without the LiSn module inserted into the plasma. Therefore, it can be concluded that there is no Sn in COMPASS core and SOL plasmas operating with the CPS based LMD module filled with liquid LiSn and in ELMy H-mode conditions.
5.2. Impurity seeding in divertor
Several experimental campaigns were devoted to study the effect of seeded impurities in the divertor of COMPASS tokamak. The main aim of these experiments was to achieve a regime of partial detachment and to study the evolution of heat flux footprint at the outer target by means of combined system of BPPs and LPs in the divertor array [17] and IR thermography [27]. Initial experiments involved nitrogen seeding in L-mode discharges [28], where substantial reduction of ratio of downstream and upstream pressure was achieved, indicating the regime of partial detachment. Thanks to the unique spatial and temporal resolution of the divertor heat flux measurements, two novel methods of characterizing the footprint shape were developed. The probe measurements also allowed for development of real-time control system, which regulated the influx of nitrogen to achieve the desired level of divertor heat flux [29].
These experiments were later complemented by discharges with identical parameters but reversed direction of magnetic field and plasma current. Despite the fact that nitrogen was seeded from the same location and the plasma cross-section was identical, the distribution and evolution of radiation caused by the presence of nitrogen was distinctly different. This was clearly visible on colour fast camera system RIS [30], as shown in figure 8. Injection of nitrogen in forward field (FF) resulted in formation of radiative cloud in the vicinity of the X-point, however in case of reversed fields (RFs) the radiation was localised at the HFS SOL, moving gradually upwards during the discharge. In this configuration, stable detached discharges could not be achieved. Such dramatic difference in the properties of these discharges points to the role of drifts in the SOL of COMPASS. This topic will be addressed in future by means of modelling in SOLPS-ITER code.
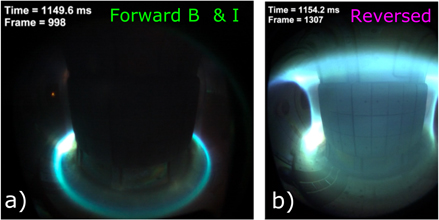
Figure 8. Fast camera image of nitrogen radiation in experiments with forward (a) and reversed (b) direction of toroidal magnetic field and plasma current. In the FF, the seeded nitrogen creates a radiation mantle in the vicinity of the X-point, while in the RF, the seeded gas spreads along the HFS to the top of the VV. In the latter case, a stable detached discharge cannot be achieved.
Download figure:
Standard image High-resolution imageMeasurements of the combined probe array reveal important differences in profiles of electron temperature Te, ion saturation current Isat and parallel heat flux q|| at the outer target as shown in figure 9. In attached conditions (prior to the impurity injection) the profile of Isat is significantly broader for RF than in FF, while the opposite is true for Te profiles. While q|| profiles manifest a similar decay length in both configurations, the spreading of the profile is higher for RF configuration, leading to a reduction of the peak heat flux by 30%. The seeding allows for a similar reduction of q|| in both configurations.
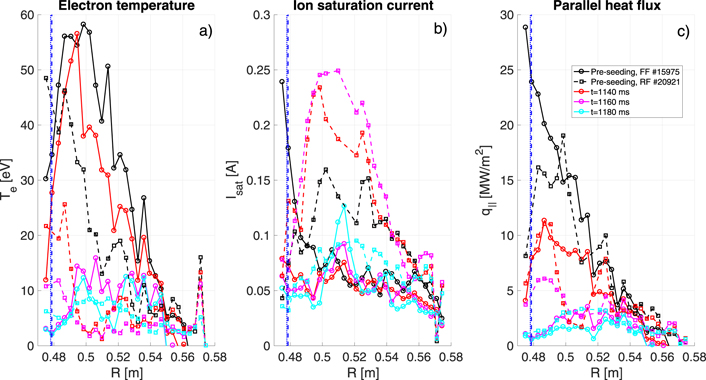
Figure 9. Profiles of electron temperature (a), ion saturation current (b) and parallel heat flux (c) for the FF configuration (#15975, solid lines) and RF configuration (#20921, dashed lines) measured by combined probe array at the outer target. Vertical blue lines indicate the position of the outer strike point. Prior the impurity injection the Isat profile is significantly broader for RF, while the Te profile is broader in FF. The q|| profiles manifest a similar decay length in both configurations, the spreading of the profile is higher for RF configuration, leading to a reduction of the peak heat flux by 30%.
Download figure:
Standard image High-resolution imageAnother experimental campaign attempted to employ argon and neon as seeded impurities. Since these elements are heavier than nitrogen, they tend to radiate mostly in the confined region and as such allowed us to explore the scenarios relevant to European DEMO, where a large fraction of power will have to be radiated inside the separatrix [31]. Stable L-mode discharges were achieved [32] and surprisingly, the methods of heat flux footprint characterization developed for nitrogen in [28] proved to be applicable also in these discharges.
6. Run-away electrons (REs) physics
Runaway electrons (REs) [33] represent one of the major concerns for future fusion devices, ITER and beyond, since the uncontrolled localized RE losses can compromise the integrity of the of the in-vessel components and further tokamak operation. Runaway electrons can emerge within a tokamak plasma either at low density, during the discharge start-up phase [34] or as a result of rapid disruptive plasma termination, associated with sudden cooling causing a significant electric field induction.
Both experimental and modelling efforts contributed significantly to the understanding of crucial topics, such as alternative or more efficient mitigation methods [35–37] or even termination of the RE beam [38]. The physics of RE interaction with mitigation species and materials, loss mechanisms, transport, interaction with naturally present or artificially created magnetic perturbations, and the RE impact on plasma-facing components was addressed in recent dedicated experimental campaigns in COMPASS [39–41]. The improved knowledge of RE behaviour was applied in the worldwide unique RE radial feedback control algorithm [42] and advanced beam detection with an extended set of dedicated diagnostic systems [43–45].
COMPASS configuration (ITER-like plasma shape) and the recently commissioned electron cyclotron emission (V-ECE) heterodyne radiometer [43, 44] have been successfully used for monitoring of the early phase of the RE population in the plasma and supported with modelling effort. The presence of RE was detected around 20 ms earlier than with HXR NaI(Tl) detector and HXR/photoneutron shielded composite scintillator [44]. An early seed detection might play a crucial role in mitigation strategies in future devices. Preliminary results showed a strong correlation of the V-ECE signal with bursts detected by the magnetic diagnostic. Besides V-ECE, novel semiconductor pixel detectors [45] measuring the bremsstrahlung caused by RE radiation losses and several types of x-ray cameras with pinhole optics and fast readout sensitive to low energies (tens–hundreds of keV) were built in-house to measure time evolution of the low-energy part of RE distribution function. Radiation losses corresponding to RE with higher energies (hundreds of keV–tens of MeV) were detected by a set of HXR NaI(Tl), shielded photoneutrons detectors and scintillators. Such measurements provided important information about the dynamics of RE radiation losses in the presence of gas and solid-state mitigation materials, one of the main studied RE topics at the COMPASS tokamak. For this purpose, the room temperature solid state pellet injector (RTSP) was borrowed from the ASDEX Upgrade tokamak. After initial characterization and modification of the pellet injector [46], the pellet injection system and newly designed gas handling system were successfully installed at the COMPASS tokamak (figure 10). The RTSP was used for investigation of RE generation and mitigation by graphite pellet injection (2 mm length × 1.5 mm diameter). Effect of pellet injection on dynamics of RE beams was clearly observed and interaction of runaway electrons with pellets was captured in detail by fast cameras.
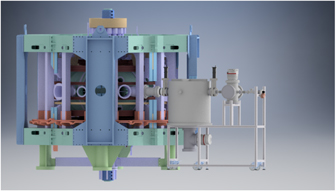
Figure 10. Visualization of the vacuum system designed for RTSP and its connection to the COMPASS tokamak. Two expansion vacuum tanks with a set of pipes, valves for the gas handling system together with the port plug and vacuum stand are shown by the light grey colour in the right part of the figure. The COMPASS tokamak with green and blue support structure and violet toroidal field coils is depicted in the left part.
Download figure:
Standard image High-resolution imageThe most important part of the research on the RE losses in the presence of gas mitigation material was to study the effect of the deuterium flushing which became one of the most studied topics in recent years at European and US tokamaks since it might cause the significant decrease of the average RE energy [38]. This has been confirmed in COMPASS experiments [39] as shown in figure 11.
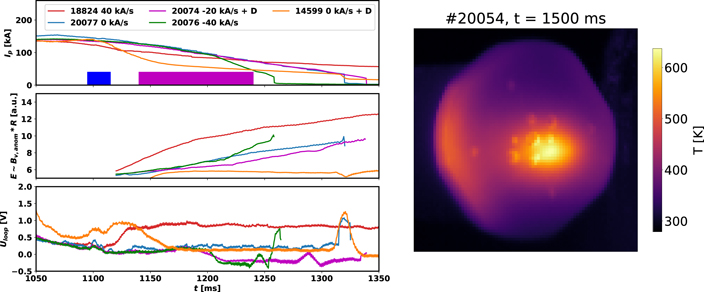
Figure 11. (Left) Effect of the deuterium flushing and of the loop voltage on the RE average energy and the RE current decay rate. The blue and pink time slots correspond to the time windows when the valve in the divertor region was open for the Ar injection (5.1018 m−3) and when the valve at the LFS midplane was open for D2 injection. The level of loop voltage is primarily given by a time derivative of current in the central solenoid (notes in the upper panel). (Right) IR camera image of the final termination of the RE beam at the calorimetry head after the Ar injection. The RE beam was intentionally drifting towards the calorimetry head (LFS) from time 1420 ms.
Download figure:
Standard image High-resolution imageThe last, but not least diagnostic system assembled to deliver the new insights into the RE impact on plasma-facing components under various conditions was the novel calorimetry head able to measure the temperature evolution of the various parts of the calorimetry head during the RE phase and after its termination. It was designed as a graphite LFS protection limiter equipped with up to 10 resistive temperature sensors. Its surface temperature was simultaneously measured during the duration of plasma discharge by the IR camera (120 frames per second) covering wavelength range 7.5–13 μm and a good agreement with results obtained by resistive sensors was found. The time evolution of the size and position of surface area affected by the direct RE impact was determined from the IR camera measurements (see figure 11). The calorimetry head successfully measured the heat loads on the protection limiter caused by the RE beam in more than 250 discharges, where the effects of various mitigation strategies and RE control techniques were studied. The average RE energy was spread in the range from several hundreds of Joules up to 15 kJ. RE radial position control and the type of injected mitigation gas had the strongest influence on the deposited RE energy. In the case of active radial position control, the average impact energy was 40% lower than in the case when RE were drifting and terminating on LFS. The increase of the final RE impact (larger average energy) was detected with larger loop voltage responsible for the RE acceleration.
Mentioned radial stability of the relativistic RE beam and the role of RE energy was studied. Based on these relations, a new attitude to the RE beam position control was successfully tested [42]. The detection of radial position of the plasma or RE beam in COMPASS is based on signals from four flux loops situated above and below midplane at the HFS and the LFS. The actuators consist of two circuits—slow (equilibrium component) and fast (compensation of fast radial instabilities) [47]. The modification described here is related to the slow actuator circuit—primarily it is tuned to follow the Grad–Shafranov equation and thus the dominant controller equation component is the term proportional to the plasma current. However, for RE beam this approach proved to be unstable and an additional dependence on RE energy was identified. The relation between RE beam average energy, radial position and required vertical field proved to be linear so the control can be secured just by changing the balance between the role of the plasma current and radial position error in the controller. However, in future external diagnostics of RE beam energy based on e.g. radiation of the runaway electrons can be also implemented [48]. Besides systematic surveys of the effects of the massive gas injection and impurity seeding, the effect of externally applied resonant magnetic perturbation (RMP) on the RE dynamics was addressed [39, 49, 50]. The configuration of external RMP coils with strongest effect on the RE deconfinement was identified and investigated also by numerical methods. For this purpose, a new full orbit particle tracking code taking into account radiation damping and 3D perturbed magnetic field induced by external coils was developed and used for examination of level of stochasticity and the level of radial RE transport in the selected experimental data, figure 12. Mentioned simplified particle traces solves the relativistic equation of motion and considers radiation losses that are represented by radiation reaction force in the Landau–Lifshitz representation [51], while no collisions were taken into account.

Figure 12. Full orbit particle tracking with the in-house developed code. The left figure corresponds to 5 MeV RE with Larmor radius 0.72–0.75 cm and pitch angle 0.9 w/o artificially generated perturbations. The right figure corresponds to a 5 MeV particle with the pitch angle 0.9 with RMP coils on (n = 1 and the delta phi = 0 degrees) where δBRMP/BT was 1 × 10⁻³. The simulations were made for the n = 1 off-midplane ΔΦ = 0°.
Download figure:
Standard image High-resolution imageThe toroidal modelling of RE losses due to 3D perturbed magnetic fields by the REORBIT module recently implemented into the resistive MHD code MARS-F was performed and confirmed the experimental observations [50]. Simulations detected fast RE losses within 10 μs and showed that the particles of lower energy (preferable energy range <7 MeV) were lost only for RMP configurations when the plasma response to externally imposed perturbation was the strongest. The REORBIT simulations showed large losses (∼90%) of RE with larger energy (∼25 MeV) in COMPASS due to the finite drift orbit width effect, which occurs (at a slightly lower fraction) even in the absence of the artificially generated magnetic perturbations. The RE transport model in presence of natural magnetic perturbations based on fractional diffusion theory was developed and a qualitative comparison with experiments was successfully made [52]. Theoretical predictions for the RE density evolution according to the fractional diffusion model showed some qualitative agreement with experimental measurements of HXR emission. Further studies to make the comparison more quantitative are ongoing. Among mentioned theoretical and modelling efforts, an analytical expression for the rate at which the radiation reaction prevails over the electric accelerating force and the electron therefore leaves the RE mode was derived [53]. The radiation reaction is the drag force due to the radiation emitted by the runaway electron under acceleration. It is given by a formula with two limiting cases, the first one associates radiation with the change of the electron velocity magnitude and the second one associates radiation with the change of the velocity direction. The presence of significant MHD activity during the flat-top phase of many RE discharges offers the right experimental conditions for study of magnetic islands intrinsic rotation. A systematic study of magnetic island rotation velocity was performed and the experimental results were compared with theoretical predictions [54].
During the last dedicated RE campaign (Nov–Dec 2020) various types of instabilities that can be excited or driven by REs [36, 55] with certain energy were studied with a set of four antennas, jointly with similar experiments performed at the Frascati Tokamak Upgrade (FTU) [56]. Two loop antennas (11 × 11 cm) placed in the midplane radial ports opposite to each other and two external antennas (twin loop and a logarithmic antenna) localized in front of the vacuum windows of ports with in-vessel antennas were acquiring signal with tunable sampling frequency from several hundreds of MHz up to 12.5 GHz. The experimental setup allowed the identification of kinetic instabilities, such as low-frequency whistler waves as well as the launching of low power 0.5 GHz waves into an RE populated low-density plasma in order to test possible interaction of RE with an RF signal injected at a frequency expected to be congruous with the instabilities. Electromagnetic waves, mostly in the 0.1–2.5 GHz range, were observed during the RE quiescent scenario or directly after the Ne injection. Under certain conditions, in the presence of detected instabilities, an uncontrolled release of REs was identified by a set of HXR detectors.
7. Disruptions studies
7.1. Sideways forces on the wall during plasma disruptions
The disruption experiments on COMPASS actively contributed to the scaling laws of sideways disruption forces for ITER. A number of new diagnostics for VV motion monitoring during plasma disruptions has been installed. They include micro-electro-mechanical systems (MEMS) accelerometers, displacement sensors and a fast camera. The radial vessel motion was measured by accelerometers placed at four orthogonal locations in the equatorial plane: flanges on the north, east, south and west ports highlighted in figures 11(a) and (b) by dark blue colour. The MEMS accelerometers are found to be almost insensitive to the electromagnetic transients (in contrast to the piezoelectric ones), which makes them appropriate for disruption studies. In addition, the same west and east ports were instrumented by the gauges registering the radial displacement. The fast camera on the east port recorded the horizontal and vertical motion.
During a dedicated vertical displacement events (VDEs) campaign, when the same disruption scenario was repeated many times, it was noticed that the mechanical vessel response was almost identical for different shots. This observation lead to the hypothesis that the sideways force on COMPASS might be caused not by the developing of the plasma kink, as usually believed, but rather by the vessel asymmetry, which is primarily due to the up–down symmetric elongated ports located in the south and south-west direction (see figures 11(a) and (b)).
To test this idea a dedicated modelling effort with the CarMa0NL code [57] that solves the evolutionary equilibrium of axisymmetric plasma in the presence of three-dimensional volumetric conductors has been performed [58]. It was found that the sideways force related to the vessel non-uniformity can be as high as 3 kN (for the mesh shown in figure 13(c)), which is 17% of the maximum vertical force for the same disruption. Moreover, the direction of the calculated force (west-northwest) is close to the direction of the measured acceleration (north-west). This proves that the wall asymmetry plays an important role in the dynamics of the sideways force on COMPASS.
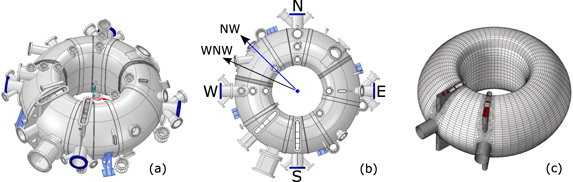
Figure 13. Side (a) and top (b) views of the COMPASS tokamak VV with supports (light blue) and port extensions. The accelerometers are installed on the flanges highlighted by dark blue colour. Hexahedral mesh with elongated port extensions and internal ribs (red elements) used for 2D-plasma CarMa0NL modelling (c).
Download figure:
Standard image High-resolution imageTo deduce disruption forces from the measured vessel acceleration and displacement a detailed mechanical modelling is necessary. This will be the focus of future studies that aim to calculate and distinguish the sideways force amplitudes related to the plasma and wall asymmetries.
7.2. Vertical displacement experiments
Two specially instrumented divertor tiles were installed at COMPASS in order to investigate direct current flows during disruptions and validate ATEC model [59]. Dedicated VDE experiments were performed to determine whether part of the VV eddy current is transferred to divertor tiles and flows in the toroidal direction through the gaps between tiles (resulting in a net sideway force) [60]. Each tile consists of several segments insulated from the VV and the current flow to the segment is measured by Rogowski coils located outside of the VV (figure 14). At the start of plasma wall contact significant currents flows were measured. It was observed that the current flow magnitude is up to 4 times different between toroidally neighbouring segments. This asymmetry exhibits dependence on IP and BT directions. This leads to a hypothesis that there might be a short-circuit through the gaps between the divertor tiles, allowing significant part of the eddy current to flow there. However, tiles' misalignment and possible shadowing of segments surface should be considered before further conclusions. A revised tiles design was proposed to eliminate ambiguity in data analysis (figure 14, right).

Figure 14. (Left) Two special divertor tiles toroidally separated by 135° used for the VDE studies are depicted as floating tile #1 and #2; the location of sets of the relevant magnetic sensors is shown in yellow: 3 poloidal arrays of Mirnov coils, separated toroidally and marked as MC_A, MC_B, and MC_C, internal partial Rogowski coil (IPR), and Rogowski coil. (Centre) Picture of the segmented floating divertor tiles with marked low-field-side (LFS) and high-field-side (HFS) orientation. The study focuses on the toroidally split segments. (Right) Picture of revised tiles that include 3 pairs of split segments.
Download figure:
Standard image High-resolution image
VDE experiments were accompanied by measurements of IP at 5 toroidal positions and of poloidal and toroidal vessel currents (along with their poloidal distribution). In addition to this halo current density was measured by LPs in grounded mode [17]. The latter measurements were used to investigate the limitation of the halo current density by ion saturation current. The observed effect was included in simulations of COMPASS VDEs with a self-consistent model for halo currents including neutrals and sheath boundary conditions [61].
8. Conclusions and outlook
This paper provides an overview of the main topics addressed and results obtains in the COMPASS tokamak at the IPP Prague throughout the recent two years till the 28th IAEA FEC Conference (May 2021). The key findings in the individual areas are in particular:
- The tomographic reconstruction of single fast visible camera data allowed observation of blobs and holes in the edge and SOL plasma and demonstrated the complexity of the turbulence in SOL. The turbulent structures were detected and followed by a new code named TRACK which enabled new statistics studies of the turbulence behaviour, e.g. the radial and poloidal velocity distributions were derived.
- The height of the X-point above the divertor has been shown to have a significant impact on the access to H-mode and on the radial electric field Er shear. Lower X-point heights lead to L–H transitions at lower loss power and higher Er shear.
- The HFS EF, which can occur in ITER e.g. due to central solenoid displacement, was demonstrated to have a disruptive effect during transient phases such as the L–H transition even in case they are corrected by one set of error field correction coils (EFCCs) (such as the LFS EFCC in ITER).
- The ELM electron temperatures measured at the plasma facing components in the divertor are found to be around 80% of the initial pre-ELM value of the temperature at the pedestal. Our results imply a negligible energy transfer from the electrons to the ions during the ELM instability, and therefore no associated increase of the ion power loads on the divertor.
- The two CPS based modules, filled by liquid Li and LiSn alloy, respectively, showed good power handling capability in both L- and H-mode plasmas under an average perpendicular heat flux of 12 MW m−2 and with ELMs with a relative energy ∼3% and a local peak energy fluence at the module ɛELM = 15 kJ m−2. The good power handling capability was achieved despite no vapour shielding was achieved due to too low temperature of both modules. Importantly, neither a direct ejection of liquid metal droplets was observed for both metals, nor Sn was observed in COMPASS core and SOL plasmas.
- Nitrogen seeding in L-mode discharges showed that a substantial reduction of the ratio of the downstream and upstream pressure was achieved, indicating the regime of partial detachment. Difference in the properties of the discharges with standard and reversed direction of magnetic field and plasma current points to the role of drifts in the SOL of COMPASS, which will be addressed by SOL plasma modelling.
- The studies of the runaway electron beam generation and its subsequent mitigation benefited from installation of several special diagnostics and mitigation systems like the RE impact calorimetry head and RTSP and also modified radial position control schemes based on the betatron physics. The measured impact energies of the runaway electron beams were up to 15 kJ which is in agreement with the estimates based on betatron-like radial position control. Furthermore, a unique set of measurements of the RE interaction with high frequency waves was obtained and it is now analysed. These experimental efforts were also accompanied by modelling of RE transport in perturbed fields.
- The disruption experiments suggested that the sideways force on COMPASS might be caused by the vessel asymmetry, primarily due to the elongated ports. The modelling found that the sideways force related to the vessel non-uniformity can be as high as 3 kN (17% of the maximum vertical force).
- Experiments on the VDEs provided experimental evidence that toroidal vessel currents might flow through the gaps between PFCs, which is consistent with ATEC model predictions. Using the divertor LP measurements, we have shown that the ion saturation current might limit the halo current. These observations have significant implications on estimation of electromagnetic forces acting on the VV.
In addition, a separate paper at the 28th IAEA FEC was dedicated to more details in COMPASS detachment studies [32].
Recently, the final COMPASS experimental campaign was completed, the COMPASS tokamak was shut down in August 2021, and its disassembly has started. In parallel, preparations for the construction of the COMPASS Upgrade tokamak [62] proceeded through the final design phase and the COMPASS Upgrade related analysis, like the modelling of disruption forces [63] and of the NBI heating [64] were also presented at the 28th IAEA FEC. Therefore, the COMPASS experimental hall and related infrastructure is being evacuated at present and the experimental hall will modified to accommodate the new COMPASS Upgrade tokamak.
The analysis of the existing COMPASS experimental data, as well as modelling effort targeted on better understanding of different physical processes will continue further with the principal focus on the main presented topics.
Acknowledgments
This work was supported by Czech Science Foundation projects GA19-15229S and GA18-02482S and co-funded by MEYS project LM2018117. This work has been carried out within the framework of the project COMPASS-U: Tokamak for cutting-edge fusion research (No. CZ.02.1.01/0.0/0.0/16_019/0000768) and co-funded from European structural and investment funds. This work has been co-funded by the ITER Organization under contract IO/20/CT43-2104. ITER is the Nuclear Facility INB No. 174. The views and opinions expressed herein do not necessarily reflect those of the ITER Organization.
Footnotes
- *
In the future we will refer to the author list of the paper as the COMPASS Team.