
Abstract
The electrical properties and activation energy of epoxy/graphite flakes (GFs) micro-composite with different content of GFs (0.0625–1 wt%) were studied for electrical properties using Novocontrol Alpha Analyser (10−2 Hz—107 Hz). GFs sizes ranged from (100 nm to 10 μm). The analysis was performed by scanning electron microscopy (SEM), x-ray photoelectron spectroscopy (XPS), visible spectrum reflectance spectra (VIS) spectra, and Fourier Transform Infrared spectra (FTIR) spectroscopy. Increasing GFs content caused multiple changes in electrical characteristics. At 0.0625 wt%, all electrical properties noticeably increased. But at 0.125 to 0.25 wt%, immobilized nanolayers were formed leading to decreased permittivity, dielectric loss (tan(δ)), quality factor (Q-factor), capacitance, conductivity, and figure of merit (F-factor). At 0.25 wt%, the epoxy microcomposite had lower permittivity, tan(δ), conductivity, and capacitance compared with unfilled epoxy. With 0.5 wt% of GFs, signified the percolation threshold, initiating a rise in permittivity, conductivity, capacitance, and tan(δ), accompanied by the closer proximity of grain boundaries, facilitating the formation of conductive channels. At a concentration of 1 wt% of GFs, the establishment of continuous interfacial conductive pathways resulted in a remarkable augmentation of all dielectric properties. The Cole-Cole analysis has been employed to investigate variations in epoxy/GFs microcomposites based on concentration levels.
Export citation and abstract BibTeX RIS

Original content from this work may be used under the terms of the Creative Commons Attribution 4.0 licence. Any further distribution of this work must maintain attribution to the author(s) and the title of the work, journal citation and DOI.
1. Introduction
Epoxy microcomposite is a material that consists of epoxy resin combined with micro-sized filler particles, the purpose of incorporating these filler particles into the epoxy resin is to modify the material's properties, such as electrical conductivity, mechanical strength, thermal conductivity, and other characteristics depending on the specific application [1–3]. Due to its unique properties, which include strength, ease of construction, lightweight, unique processability, and comparatively low cost [3], epoxy resin is one of the most widely used active components in a variety of technological applications. However, their inadequate mechanical, electrical, and thermal characteristics can prevent them from being used to their maximum potential. The sensitive epoxy qualities can be altered with the addition of a second component (nano/microparticles) [2]. Epoxy-based carbon additives such as carbon nanotubes, carbon black, graphene, and graphite flakes have attracted considerable attention due to their typically high electrical conductivity and good mechanical properties, and become electrically conductive when the filler concentration exceeds a critical concentration [4]. Epoxy/carbon nanocomposites are used in many modern applications such as sodium-ion batteries and fuel cells and in both cases, the filler concentration is at least 80% [5, 6]. However, there are other applications for epoxy/carbon nanocomposites when the filler concentration is less than 15%, such as overcurrent and overtemperature protection of electrical circuits, supercapacitors, and biosensors [7, 8]. Therefore, it is necessary to study the percolation threshold of fillers to understand the changes in electrical properties in epoxy/carbon compounds and their derivatives. GFs exhibit significant potential as a nano/microfiller due to their relatively large size which plays an important role in interfacial charge, high strength, excellent thermal, electrical conductivities, and cost-effectiveness compared to its alternatives like graphite nanoparticles and graphite nanotubes [8, 9].
When a dielectric material is placed in contact with an external electric field, its response is subject to four different polarisation mechanisms: dipolar, atomic, electronic, and interfacial polarisation. In polymers with dipolar groups, the mechanism of orientation of dipolar side groups or dipolar segments corresponds to Debye relaxation polarisation [10]. The dielectric properties of composites depend largely on several factors, including the nature of the filler/matrix interface, the surface area of the filler, and the inherent conductivity of the filler [8]. At low electric field frequencies, free charges accumulate at the filler/matrix interfaces due to the difference in electrical conductivity in such composites; this is called interfacial polarization. The dielectric behaviour is governed by Maxwell–Wagner (MW) interfacial polarisation when one component has a higher electrical conductivity than the other [11, 12]. Above the percolation threshold at which the transition between insulation and electrical conductivity can be observed, the dielectric response of MW materials is additionally affected by the electron conduction process [8].
GFs exhibit significant potential as a nano/microfiller due to their large size which plays an important role in interfacial charge, high strength, excellent thermal and electrical conductivities, and cost-effectiveness compared to alternatives like graphite nanoparticles and graphite nanotubes [8, 9]. Several literatures have studied composite materials based on epoxy/graphite composite or their functional analogues. For example, Maletić et al investigated the dielectric properties of composites derived from bisphenol-A-epoxy resin loaded with varying concentrations of glass fibre (5%, 6%, 10%, and 15% wt) [8]. Song et al achieved improved thermal conductivities in epoxy/graphene nanocomposites by incorporating 10 wt% of functionalized graphene flakes [12]. Kim et al discovered anisotropic tensile modulus and strength in epoxy nanocomposites with graphite oriented along the AC electric field direction [13]. Stankovich et al demonstrated electrical percolation in polystyrene with as little as 0.1 vol.% of graphene [14]. Others [7, 15] have found that polymers based on graphene foam and graphene oxide (GO) can significantly enhance electrical properties, even at low epoxy concentrations.
The aim of this work is to study epoxy resin as a matrix material, filled with GFs at a maximum concentration of 1%. To understand how the low concentration of GFs affects the electrical properties and to achieve a percolation threshold of less than 1% by weight of GFs concentration to achieve high conductivity of the epoxy composite with minimal filler. Moreover, this work studied the effect of low concentration on the activation energy at room temperature.
2. Sample preparation
The even distribution of the filler within the polymer matrix is a fundamental challenge in sample preparation. Previous literature has presented different methods for sample preparation [8, 16–18]. However, we have chosen the method that we believe to be the most suitable, ensuring the effective dispersion of the microfiller within the epoxy. Epoxylite® E478 (E-478), sourced from Elantas (Wessel, Germany) was used. High-purity graphite flakes (99.5%) with sizes ranging from 100 nm to 10 μm were obtained from Sigma-Aldrich, USA. Different concentrations of GFs were added to E-478: 0.0625 wt%, 0.125 wt%, 0.25 wt%, 0.5 wt%, and 1 wt%. The epoxy/GFs microcomposite samples were prepared as shown in figure 1. Initially, epoxy viscosity was reduced by heating 4 g of epoxy resin at 60 °C for 30 min. GFs were then added to the epoxy, manually stirred for 10 min, and dispersed further using an ultrasonic bath for 4 h to ensure even distribution. The mixture was poured into a high-temperature-resistant silicone mold and underwent two curing phases: first, at 80 °C for 8 h to eliminate air bubbles, and then annealed at 160 °C for two hours to solidify [19, 20]. The sample thickness was approximately 500 μm.

Figure 1. The method employed to create epoxy/GFs microcomposite samples.
Download figure:
Standard image High-resolution image3. Characterization
This section covers various characteristic analyses employed to confirm the successful production of epoxy/GFs microcomposite.
3.1. Scanning electron microscopy (SEM)
SEM micrographs were obtained using a MIRA-TESCAN SEM. Figure 2 shows SEM micrographs of the unfilled epoxy, epoxy/microsphere composite and graphite flakes. For this characterisation, the samples were coated with 30 nm of gold and the energy of the primary beam was set to 5 keV. As a detector, the secondary electron detector was used.
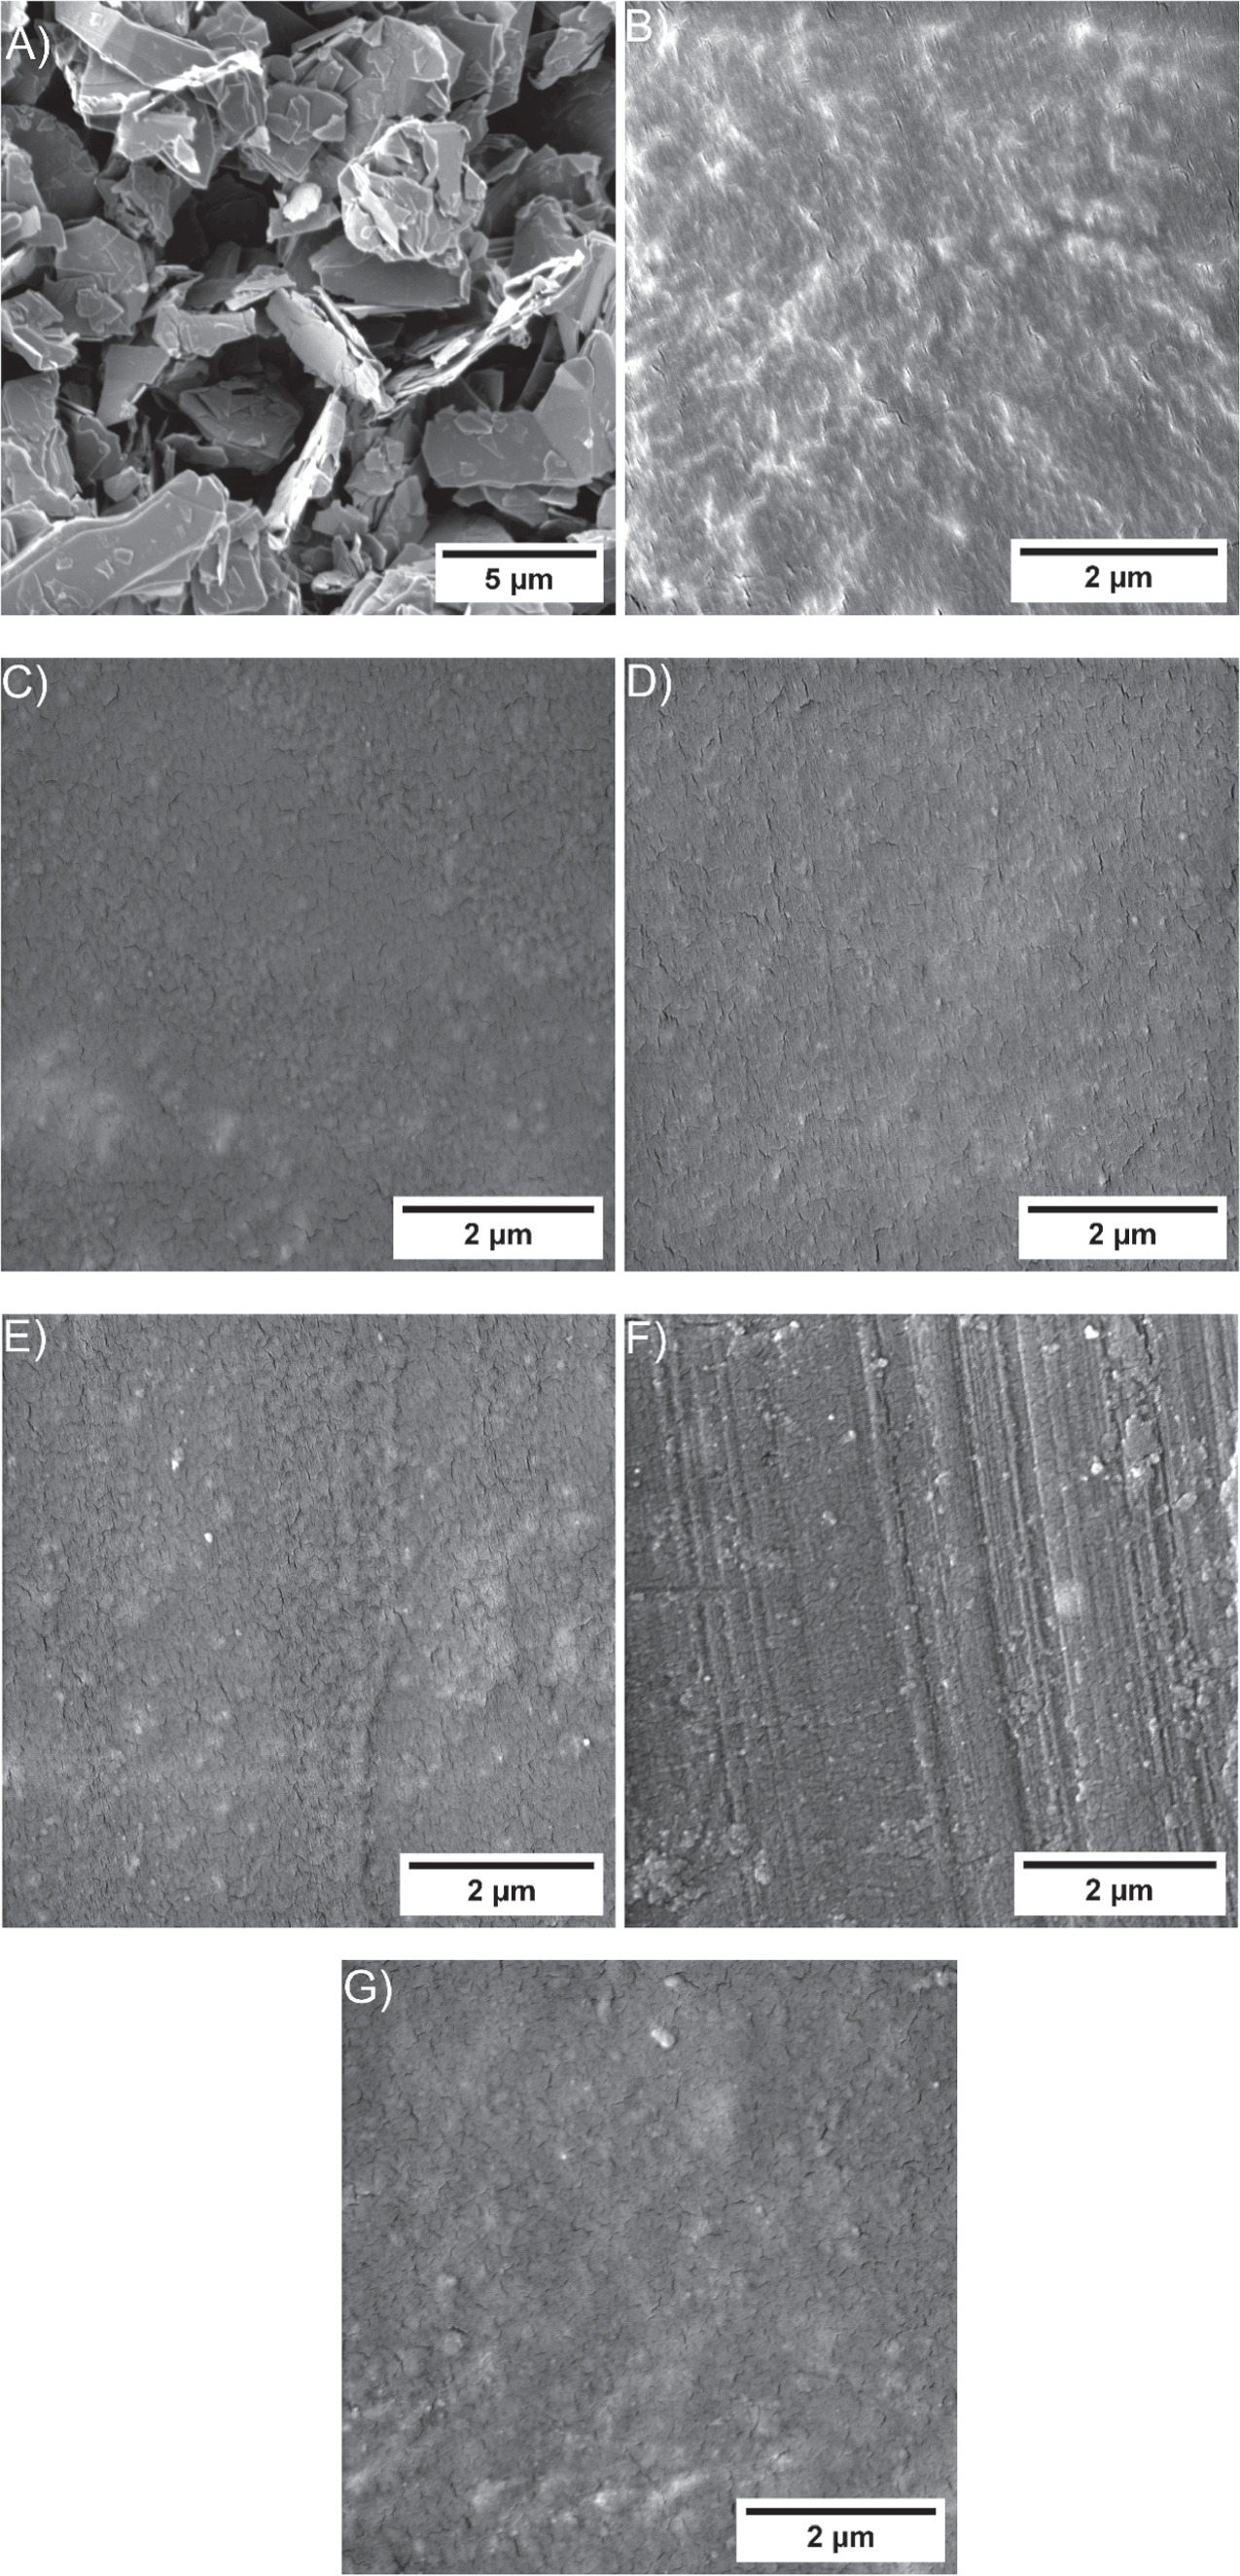
Figure 2. SEM micrographs were taken for (A) Graphite flakes microparticles. (B) Unfilled epoxy. (C) Epoxy/0.0625 wt% of GFs. (D) Epoxy/0.125 wt% of GFs. E) Epoxy/0.25 wt% of GFs. (F) Epoxy/0.5 wt% of GFs. (G) Epoxy/1 wt% of GFs.
Download figure:
Standard image High-resolution image3.2. XPS spectra
x-ray photoelectron (XPS) spectroscopy analyses of unfilled epoxy resins are displayed in figure 3. The XPS spectra were acquired using the (AXIS Supra x-ray photoelectron spectrometer system from KRATOS Analytical Ltd, Manchester, UK). CasaXPS software was utilized to accurately determine the composition of the functional groups of the carbon atoms.

Figure 3. The XPS analysis for the unfilled epoxy resin.
Download figure:
Standard image High-resolution imageFigure 3 illustrates that the chemical composition of the epoxy resin consists primarily of carbon (79.46%) and oxygen (17.81%), with a small amount of silicon (0.87%), nitrogen (1.31%), and a small amount of chlorine (0.52%). It should be noted that nitrogen and chlorine are the components of the amine hardener used in the resin [21]. As shown in figure 3, the unfilled epoxy spectrum shows that Si 2p has two main peaks with FWHM values of 1.47 eV at 98.5 eV and 1.27 eV at 99.4 eV [21]. These peaks are associated with CH2-SiO3, and SiOH, respectively. The silicon layer is formed on the surface of the hardened epoxy after the curing process to protect the polymer. The O 1s peak associated with O-Si bonds in SiO2 appears at 528.15 eV. When the O 1s spectra are deconvoluted, a second peak with an FWHM value of 1.51 eV at 529 eV is attributed to the O-C and O-H bonds present in the epoxy backbone. In addition, the C 1s spectrum has been divided into three main peaks. The C-C or C-H group is associated with the first C 1s peak, which is located at 284 eV [22]. The second peak, which is associated with the C atoms in the C-O-C and C-O-H groups, is located at 285.51 eV. The third peak in the C 1s spectrum at 288.22 eV can be attributed to the presence of a C=O double bond [21, 22]. The N 1s spectrum is divided into four main peaks, N-H at 395.47 eV attributed to triamine. N-C at 398, N-Si at 400, and N-Cl at eV 393. The N 1s peak indicates crosslinking between the epoxy and amine monomers due to the solidification process.
3.3. Spectrophotometry
Photoluminescence spectroscopy covers a wide spectral range from 450 to 750 nm within the visible spectrum (VIS) as shown in figure 4. These results were obtained using an Ocean Optics JAZ 3-channel UV–vis Optical Spectrometer. It can be seen that as the particulate metal concentration increases, the reflectance peak at 550 nm decreases. To ensure as much information as possible about the optimal dispersion of the carbon flakes throughout the matrix, measurements were made at several different points within a single sample, and nearly identical readings were obtained. Conversely, as the filler concentration increases, the peaks associated with the absorbance at 580 and 665 nm increase. This result is noteworthy as it indicates that the filler within the epoxy has been distributed in an orderly fashion, resulting in the epoxy composite exhibiting black body properties.
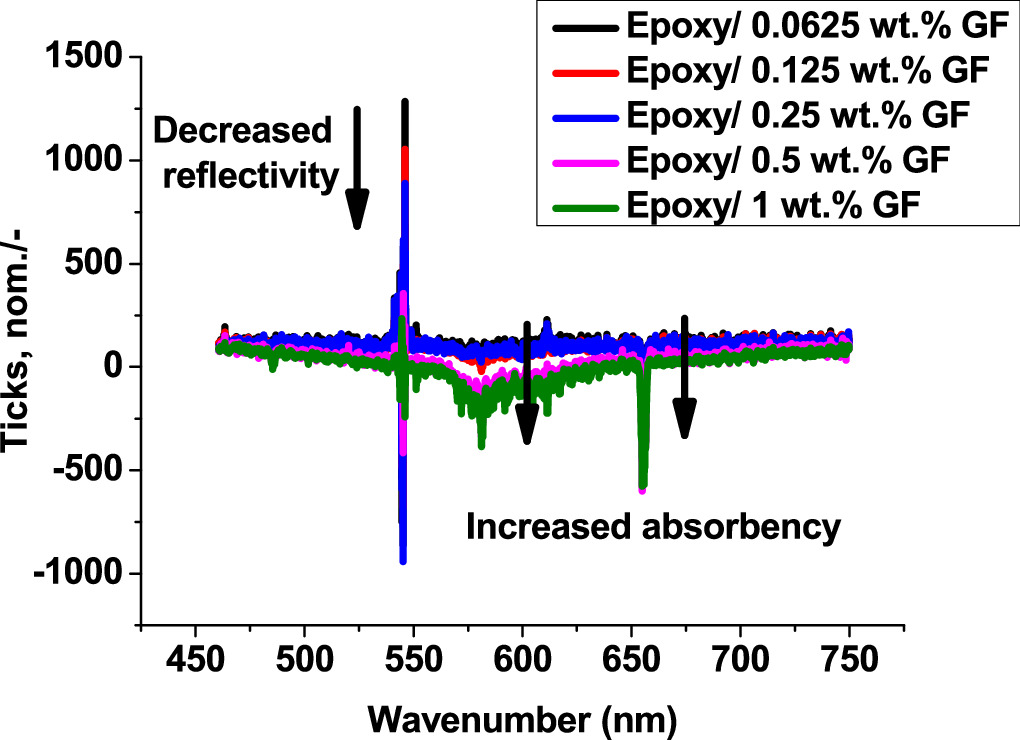
Figure 4. Reflectance measurement from supercontinuum laser irradiation.
Download figure:
Standard image High-resolution image3.4. FTIR spectra
Figure 5 shows FTIR spectra of unfilled epoxy and epoxy/GFs microspheres/epoxy filter. The ranges of transmittance spectrum are detailed in table 1. Transmittance spectra of the samples were obtained using an FTIR Vertex 70v (Bruker, USA). The transmittance spectrum of epoxy/GFs microcomposites, featuring a distinct band at 1224 cm−1 assigned to the bending of CH groups, confirms that the graphitic surface is predominantly devoid of functional groups originating from the surfactant [8]. Additionally, the bands at 2957 and 2875 cm−1 assigned to the –CH2 and –CH3 stretching vibration modes of aromatic and aliphatic chains, respectively. Furthermore, the band observed at 3065 cm−1 is assigned to the C–H stretching mode of the epoxide group [8, 17]. The peak at 1382 cm−1 can be assigned to the stretching of CO and bending of OH groups, indicative of the presence of oxygen-containing functional groups. However, the band at 1017 cm−1 is associated with COC in epoxy groups [8, 17, 22]. The faint bands at 1670 cm−1 indicate the presence of amine N-H functional groups. Additionally, the peaks at 1105 and 1560 cm−1 signify the existence of imide C–N bonds [23]. The band at 830 cm−1 is ascribed to the out-of-plane bending of the H-C = vibration present in maleimide rings [17, 22, 24, 25]. Furthermore, the bands situated at 570 cm−1 and 465 cm−1 are assigned to the out-of-plane transmittance of C–H in aromatic rings and Cl-C [21, 24], respectively. The broad band spanning from 3000 to 3600 cm−1 signifies stretching vibrations attributed to the presence of hydroxyl groups(O–H).
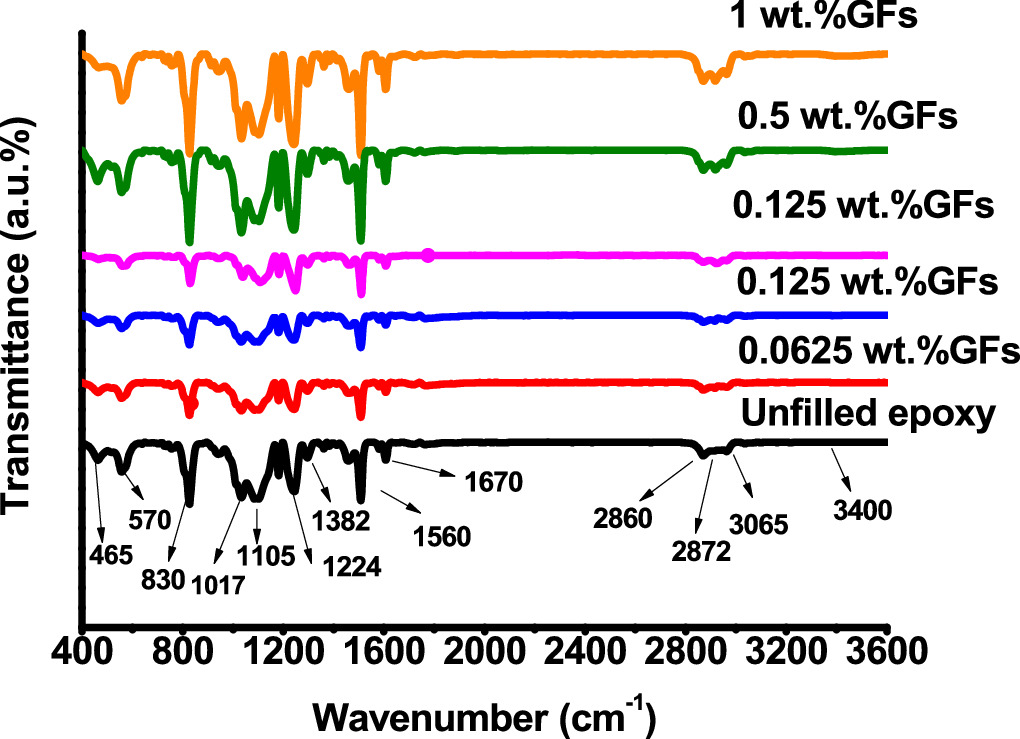
Figure 5. FTIR spectra of unfilled epoxy and epoxy/GFs.
Download figure:
Standard image High-resolution imageTable 1. Band assignments of FTIR spectrum.
| Wavenumber (cm–1) | Assignments |
|---|---|
| 465 | Cl-C stretching terminal |
| 570 | C–H out-of-plane transmittance of aromatic rings |
| 830 | C-H out-of-plane bending in maleimide rings |
| 1017 | COC in epoxide groups |
| 1224 | CH groups |
| 1382 | CO and OH stretching |
| 1105 and 1560 | Imide C–N bonds |
| 1670 | N-H functional groups of amine |
| 2957 and 2875 | –CH2 and –CH3 stretching modes of aromatic and aliphatic chains |
| 3065 | C–H stretching mode of the epoxide group |
| 3400 | Si-O and OH stretching |
4. Results
This section presents the findings pertaining to the dielectric properties of the epoxy/GFs microcomposite and discusses them sequentially.
4.1. Permittivity and tan(δ)
Dielectric measurements were carried out using the Quatro cryosystem from Novocontrol Technologies GmbH & Co. KG, Germany, equipped with the Novocontrol Alpha-A analyzer. The measurements were taken over a wide frequency range from  Hz to
Hz to  Hz. The recorded experimental data was analyzed using the Havriliak–Negami (HN) theory, a well-established method for describing the dielectric properties and relaxation behaviour of materials in the frequency domain. The HN equation for complex permittivity is a commonly used function in this context and can be expressed as follows [17, 26–28]:

where  is the complex permittivity,
  is the angular frequency, ε' and ε'' are the real and imaginary parts of permittivity, respectively.
  stands for the optical permittivity, and
  is the static permittivity. The α describes the flatness or width of the maximum, while β represents the skewness or asymmetry of the complex dielectric permittivity. α and β, have values within the ranges of 0 < α ≤ 1 and β
 where they indicate how the distribution of relaxation times has changed. ω represents the angular frequency, and
  is the relaxation time, indicating the position of the relaxation maximum on the horizontal axis. The expression for ε´(ω) can be written as follows [28, 29]:

The dielectric loss factor, denoted as tan(δ), measures the energy dissipation of a dielectric material when exposed to an electric field. The determination of tan(δ) for a capacitor with two plates separated by an epoxy/GFs microcomposite is given as follows [27, 28]:

Figures 6(a) and (b) show the differences in permittivity  and tan(δ) for unfilled epoxy and epoxy/GFs microcomposite at different concentrations of GFs. As shown in figure 6(a), the ε' behaviour for all epoxy/GFs microcomposite samples can be explained by space charge polarization [30]. At frequencies exceeding 103 Hz, permittivity is determined by the number of orientable dipoles and their ability to correspond to the applied electric field [8, 17, 31–33]. At lower frequencies, the dielectric constant increases because all the free dipolar functional groups in the epoxy chains can be effectively orientated. However, at high frequencies, the larger dipolar groups become less influential on the dielectric constant because they are unable to align at the same rate as the low frequencies. Thus, at higher frequencies, the dielectric constant of the epoxy system continuously decreases [8, 17, 18, 31–33]. This change in dielectric constant is consistent with Koop's theory and Maxwell Wagner's theory [34–36]. According to the theory, when epoxy/GFs microcomposites are placed in an electric field, the mobile electrons drift towards the grain boundary and get accumulated in the well due to high resistance at grain boundaries consequently, this process results in interfacial polarization [8, 17, 18, 34–36].
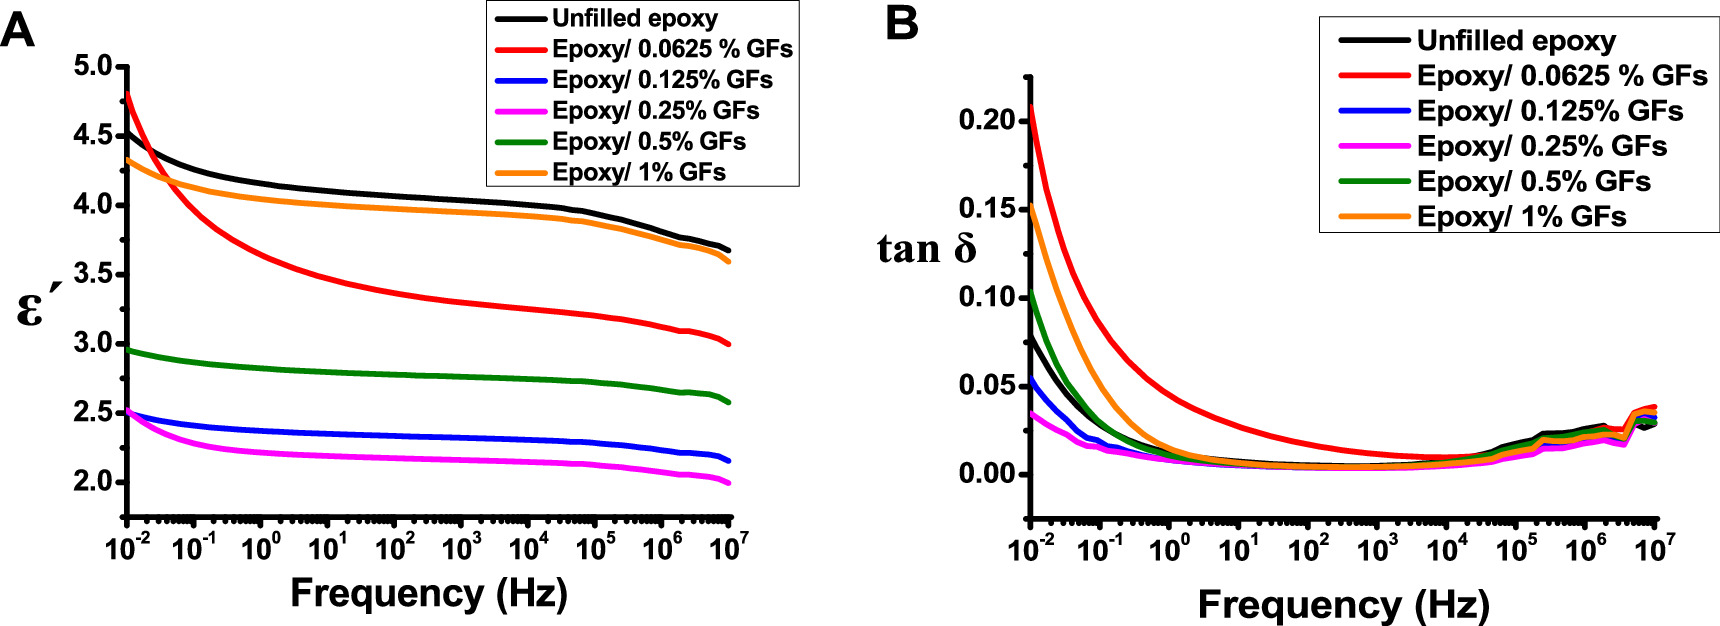
Figure 6. The changes in A) ε´, and B) tan(δ) with respect to frequency.
Download figure:
Standard image High-resolution imageBased on the information in figure 6(a), the incorporation of GFs possessing active dangling bonds on their surface resulted in different changes depending on the concentration of GFs. The addition of 0.0625 wt% GFs to epoxy resulted in the creation of readily polarizable bonds when subjected to an electric field, resulting in a higher permittivity compared to unfilled epoxy [33]. However, when the GFs content was 0.125 wt% and 0.25 wt%, the permittivity significantly decreased due to interfacial polarization, also known as the Maxwell–Wagner–Sillars (MWS) effect. This phenomenon occurs due to the accumulation of charges at interfaces in heterogeneous media with varying dielectric properties and conductivity [37, 38]. However, as the content of GFs increases in epoxy, an interaction between GFs and polar groups in the epoxy leads to the formation of immobilized nanolayers, which limits the mobility of the epoxy chains, causing a reduction in permittivity [17, 21, 27]. Even at 0.25 wt% of GFs content, it remained below the percolation threshold. At this point, grain boundaries began to come closer, which meant they were not in complete contact. In these conditions, the polarisation of a single GFs might affect the orientations of nearby dipoles. This increases the number of immobilized nanolayers, leading to a decrease in average polarisation and permittivity [32, 37].
As the GFs concentration increased to 0.5 wt%, An increase in permittivity was observed, indicating that the grain boundaries began to touch and conductive pathways began to form. This phenomenon can be explained using percolation theory [27, 39]. The dielectric permittivity of epoxy/GF microcomposite can be written as follows [27, 39]:

where  is the relative permittivity,
  is the permittivity of the matrix, S is the critical exponent,
  and
and  are the volume fraction of the GFs, and the percolation threshold, respectively. As expected, the dielectric properties of the epoxy microcomposite show a typical percolation transition behaviour as the mass fraction of GFs in the epoxy matrix increases. The approximate percolation threshold for the epoxy/GF microcomposite is near 0.5 wt%. Due to the conductive pathways at 1 wt% GFs samples permittivity climbed to a value close to the unfilled epoxy permittivity value. This contributes to increasing polarization and increasing conductivity simultaneously [40, 41].
Figure 6(b) illustrates the behaviour of tan(δ) in both unfilled and epoxy/GFs microcomposite samples. It is evident from figure 6(b) that tan(δ) exhibits elevated values in the low-frequency range, particularly below 10° Hz, for all samples except for epoxy with 0.0625 wt% GFs, which shows this behaviour below 104 Hz. However, as the frequency increased beyond 100 Hz, tan(δ) decreased rapidly. The presence of GFs at a concentration of 0.0625 wt% results in an increased heterogeneity within the epoxy composite, leading to the generation of free charges and a subsequent rise in tan(δ) [18]. Conversely, at concentrations of 0.125 wt% and 0.25 wt% GFs, a notable decrease is observed in tan(δ). This decline in tan(δ) values can be attributed to the creation of immobilized nanolayers. In contrast, when GFs concentrations reach 0.5 wt% and 1 wt%, electrical pathways are formed within the epoxy matrix, leading to an increase in tan(δ), particularly near the percolation threshold. Furthermore, the β-relaxation property of the pure epoxy resin dominates the fluctuations in the frequency range of 106 Hz [17, 40].
4.2. Q- factor
The Q factor of a capacitor quantifies its efficiency in managing energy losses, as shown in figure 7. In the context of an AC system, the Q factor expresses the ratio of energy stored within the capacitor to the energy dissipated as thermal losses through the equivalent series resistance [18]. An ideal capacitor has an infinite Q value, indicating that no energy is lost during energy storage. The Q factor of a material can be represented by [18]:

From figure 7, it is evident that the maximum Q-factor for all samples falls within the range of 103 Hz, except the epoxy/0.0625 wt% GFs microcomposite sample, where it occurs at 104 Hz. Notably, when compared to unfilled epoxy at 103 Hz, the Q-factor of the epoxy/0.0625 wt% GFs microcomposite is approximately half. In contrast, the Q-factor is roughly more than double for the epoxy/0.25 wt% GFs microcomposite. Additionally, the efficiency factor of the epoxy microcomposite at the percolation threshold is approximately 0.75 higher. This result recommended the use of Epoxy/ GFs microcomposite for the design of solar cells and fuel cells.

Figure 7. Q-factor respect to frequency for epoxy/GFs microcomposites.
Download figure:
Standard image High-resolution image4.3. Cole-cole plot
The Cole–Cole diagram, originally introduced by K S Cole and R H Cole [40], serves as a valuable tool for examining the frequency-dependent behaviour of complex permittivity in dielectric materials. This diagram represents a graphical plot of the real (ε') and imaginary (ε'') components of complex permittivity against the frequency parameter, as depicted in figure 8. Moreover, researchers have widely adopted Cole–Cole plots to characterize various materials and composites, including dielectric mixtures [40] and ferrite films [42]. The Cole–Cole model can be derived from the fundamental Debye model [33–35], which provides a normalized representation of complex permittivity ε(ω) based on a single characteristic relaxation time. This model serves as a foundational basis for understanding the behaviour of dielectric materials [43, 44].

The distribution parameter α serves as a key descriptor for quantifying the extent of the relaxation time distribution in the interval of 0 to 1. When α equals zero, the Cole–Cole model simplifies to the Debye model. In contrast, α values greater than zero signify that the relaxation process is dispersed across a broad spectrum of frequencies [44].
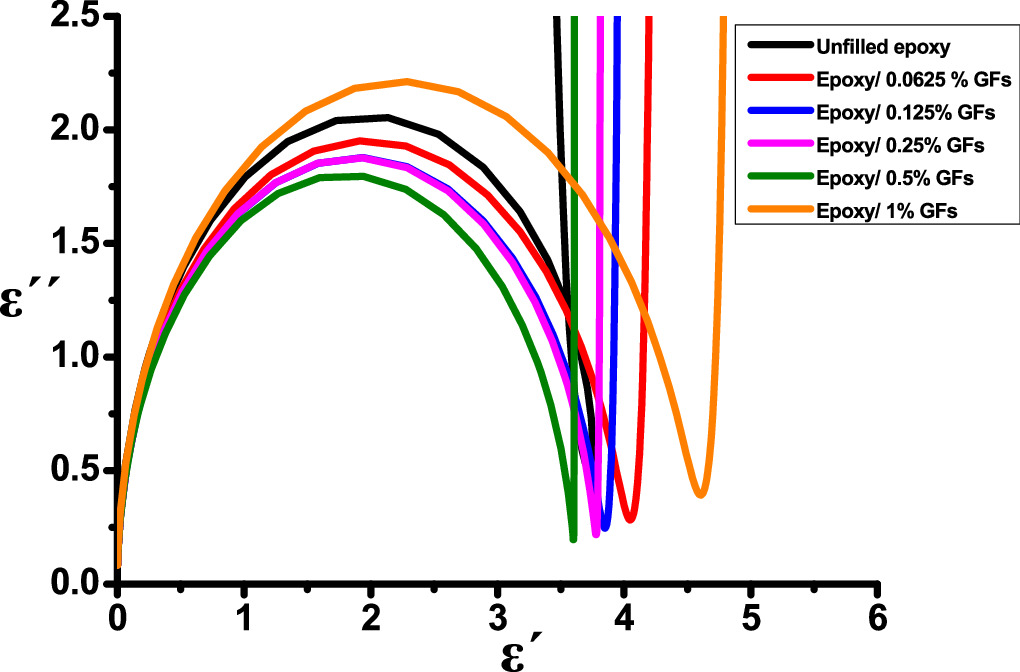
Figure 8. Cole-Cole plot for epoxy/GFs microcomposite.
Download figure:
Standard image High-resolution imageThe findings in figure 8 reveal distorted semicircular patterns with dispersed relaxation times and non-Debye behaviour. In the complex permittivity plot (ε´(ω) versus ε''(ω)), it is observed that the low-frequency region is significantly affected for materials exhibiting high DC conductivity [39]. The semicircular shape corresponds to the bulk relaxation process and indicates the presence of a capacitive component. Following the semicircle, there is a linear increase in all epoxy nanocomposite samples. This linear segment is attributed to electrode polarization occurring at the interface between the sample and the electrodes, where the material's conductivity experiences an increase [45]. As depicted in figure 8, it is evident that the conductivity of all samples experiences a noticeable increase at frequencies below 103 Hz, which aligns with the findings obtained in the previous section, specifically in the tan(δ) part.
4.4. Capacitance
The permittivity of the material is a measure of its ability to store energy indicating how much electric flux it can retain or concentrate. Mathematically, permittivity is defined as the ratio of a material's capacitance (CM ) to the capacitance of free space (C0), as expressed below [17].

where ðÂÂ0 represents the permittivity of free space, d denotes the distance between the electrodes, and A stands for the electrode's surface area. The examination of capacitance response to frequency variations depicted in figure 9, reveals a clear dependency on the capacitance of the epoxy/ GFs microcomposite. It is important to emphasize that all samples of the epoxy/GFs microcomposite exhibit a capacitance higher than that of the unfilled epoxy. Moreover, The capacitance values at concentrations of 0.0625 wt% increased to the highest value compared to other samples. At 0.125 wt%, and 0.25 wt% GFs continue to decrease due to the enhanced permittivity. In contrast, at concentrations of 0.5 wt% and 1 wt% GFs, the capacitance values increased. These observations align with the findings related to permittivity discussed in section 4.1.

Figure 9. Variation of capacitance as a function of frequency.
Download figure:
Standard image High-resolution image4.5. Electrical conductivity, activation energy and frequency exponent
Dielectric conductivity encompasses the cumulative impact of all dissipative phenomena, which may encompass conductivity resulting from the motion of charge carriers and is linked to energy dissipation associated with the frequency-dependent nature of ε [46]. The total electric conductivity ( ) can be determined through the application of Jonscher's power law [18].

where  is the direct current conductivity, while
  is the alternating current conductivity, B is a constant, and S is the frequency exponent. Figure 10 shows the differences in electrical conductivity of the epoxy/GFs microcomposite as a function of frequency.
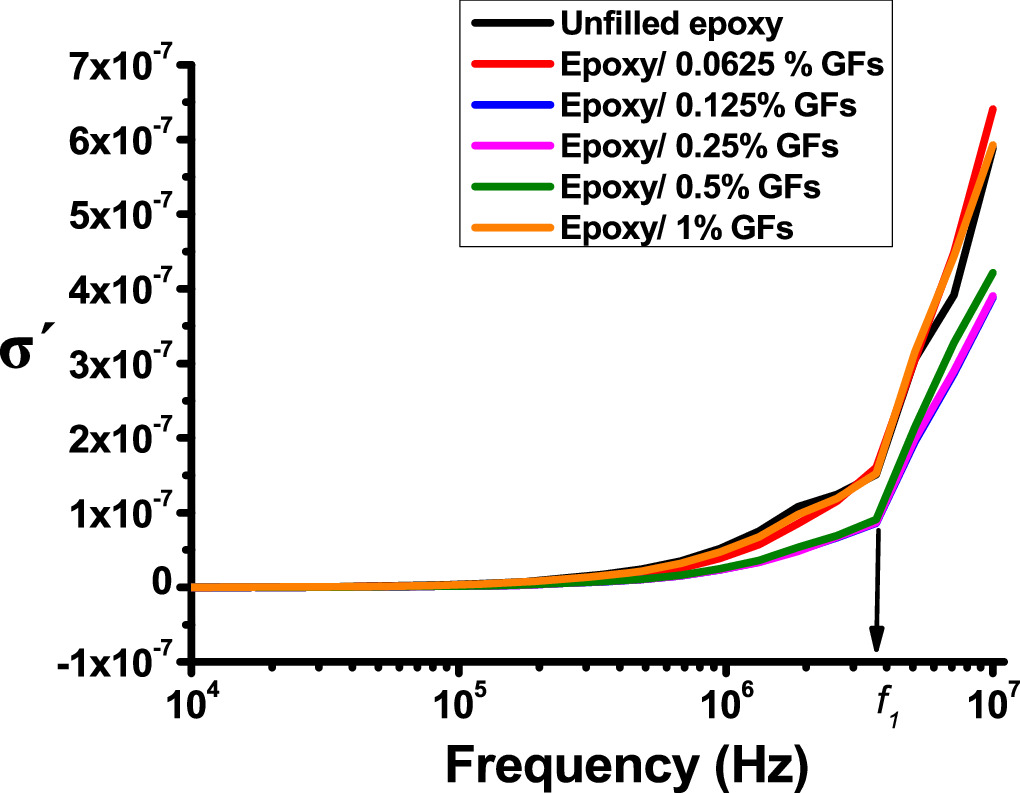
Figure 10. Displays the fluctuations in conductivity as a function of frequency.
Download figure:
Standard image High-resolution imageIt can be shown in figure 10 that for the real part of the conductivity (σ'), The value of σ' shows small differences at low frequencies and large improvements at higher frequencies. It undergoes a small increase with frequency up to 105 Hz, followed by a large increase as the threshold frequency, denoted by "f1". According to Koop's theory, the lower σ' value at the low-frequencies range can be attributed to the presence of low conductivity grains, while the higher σ' higher frequencies are associated with high conductivity grains [34]. The displacement of charge carriers diminishes as the frequency increases, and beyond 105 Hz, σ' conforms to the formula: σac ∼ ωs, where 0 ≤ s ≤ 1, indicating hopping conductivity [8, 51–54]. The numerical value  assumes the extremes of 0 and 1 for ideal ionic-type crystals and ideal Debye-type crystals, respectively. Furthermore, the increase in frequency not only imparts energy to charge carriers but also facilitates the release of charge carriers that were previously trapped in deep energy states [18, 47]. This process of hopping and liberation of charge carriers may lead to an augmentation in charge density and, consequently, an increase in conductivity [18, 47, 48].
In a broader context, the conductivity observations represented in figure 10 are consistent with the results shown in section 4.1 with respect to tan(δ). Notably, the epoxy composite containing 0.0625 wt% GFs demonstrate the highest levels of electrical conductivity. This can be attributed to an augmentation of space charge within the sample. As the concentration of GFs increased to 0.125% and 0.25 wt% a decrease in conductivity was observed. This decrease is primarily due to the development of immobilised nanolayers that restrict the movement of space charges and the epoxy chain. At the critical filtration threshold of 0.5 wt% of GFs, a clear increase in conductivity can be observed. This phenomenon is attributed to the proximity of graphite flake particles to each other, which promotes the formation of conductive pathways. At a GF concentration of 1 wt%, the electrical conductivity is significantly higher, surpassing that of unfilled epoxy.
Based on the data in figure 10, it is evident that for all epoxy/GFs microcomposites, the conductivity does not follow a linear trend at f1. When the frequency f < f1, the electrical conductivity exhibits independent of frequency. This behaviour is indicative of  where it maintains a relatively constant level of conductivity since electrons predominantly navigate intricate transition pathways within fully established percolation channels between the electrodes [17]. In the high-frequency domain, specifically when
  >
>  the conductivity experiences a linear rise in conjunction with increasing frequency. This behaviour is indicative of
  signifying that the conduction mechanism in this frequency range is attributed to well-localized hopping and/or reorientation motion [49, 50].
A critical parameter to investigate is the activation energy, representing the energy required for an ion to surpass the energy barrier for a successful jump. The activation energy value is determined through the application of the Arrhenius equation [51, 52].


where  is the activation energy,
  is the pre-exponential factor, In our current study, focused on activation energy at room temperature, we will analyze activation energy in terms of
  To facilitate the calculation and comparison process, we will adopt a simplified assumption, considering
  as 1 S cm−1,
  is Boltzmann constant (8.6173303
  10–5 eV K−1), and T is the absolute temperature.
To find the S values, a correlation between  versus
  was graphed [51]. The slope of the resulting line represents the anticipated S value. Figure 11(a) shows the effect of the filler concentration on the activation energy values. Figure 11(b) depicts the S values, whereas figure 11(c) presents the correlation between the S values and the filler concentration. Moreover, table 2 further provides details on the activation energy and S values corresponding to varying filler concentrations.

Figure 11. (A) The effect of the filler concentration on the activation energy values. (B) the S values. (C) correlation between the S values and the filler concentration.
Download figure:
Standard image High-resolution imageTable 2. The activation energy and S values correspond to varying filler concentrations.
| sample |
|

| S |
|---|---|---|---|
| Unfilled epoxy |

| 0.876 | 0.977 |
| Epoxy/0.0625 wt% GFs |

| 0.850 | 0.891 |
| Epoxy/0.125 wt% GFs |

| 0.901 | 0.992 |
| Epoxy/0.25 wt% GFs |

| 0.909 | 0.996 |
| Epoxy/0.5 wt% GFs |

| 0.894 | 0.940 |
| Epoxy/ 1 wt% GFs |

| 0.874 | 0.923 |
It is evident that there is a similarity in the variations observed for both the activation energy and S values as the filler concentration increases. Evidently, a reduction in activation energy and S values are apparent at 0.0625 wt% GFs owing to the escalation in space charges. Conversely, an augmentation in activation energy and S are noted at concentrations of 0.125 wt% GFs and 0.25 wt% GFs, attributed to constraints on charge mobility arising from the formation of immobilized nano-layers. Subsequently, a significant decline in activation energy occurs at concentrations of 0.5 wt% GFs and 1 wt% GFs, indicative and S of the development of conductive channels. This behaviour aligns with findings reported in various literature sources [53]. which indicates an enhancement in electronic jumps between localized states [54]. Furthermore, the S comparison reveals that the AC conduction process may be attributed to overlapping polaron tunnelling. This phenomenon describes the tunnelling of polarons characterized by a significant overlap of the polaron distortion clouds [51, 55].
4.6. F- factor
The F-factor is a term used to denote the ratio between the real part of the conductivity (σ') and the real part of the permittivity (ε'). The term is frequently used in the field of electrical or dielectric properties to define the interrelationship between these two parameters. This ratio plays a pivotal role in characterising the electrical properties of materials, and their ability to conduct electric currents, which is a good guide for use in solar cell design as it represents the relaxation time and indicates the time required for excess free carriers to dissipate in materials. Figure 12 shows the variations in the F-factor of the epoxy/micro-deposition composite as a function of frequency The F-factor is calculated as follows [56]:

Figure 11 shows that the frequency factor F stays constant at frequencies below 105 Hz. At a frequency above 105 Hz, the F-factor increased for all composite samples compared to unfilled epoxy. In addition, the epoxy/0.0625 wt% sample of GFs had the highest F-factor value, attributed to the presence of free charges. The immobilised nanolayers reduce the F-factor of the samples epoxy/0.125 and 0.25 wt%. Furthermore, the creation of conductive pathways in the 1 wt% GFs sample results in a substantial tenfold increase in the F-factor. These findings offer support for the potential application of epoxy/GFs microcomposites in solar cells and fuel cells.

Figure 12. F-factor respect to frequency epoxy/GFS microcomposites.
Download figure:
Standard image High-resolution image
5. Conclusions
This study of the electrical properties of epoxy/GFs with a concentration of less than 1% was presented to understand the changes in dielectric properties, the formation of conductive channels and the effect of low concentration on the activation energy at room temperature. complex permittivity analysis revealed that the introduction of GFs had a significant impact on the dielectric properties of the composites. At 0.0625 wt% GFs increased the permittivity mainly due to the formation of easily polarisable bonds under the influence of the electric field. However, at 0.125% and 0.25% wt%, interfacial polarisation effects became prominent, resulting in a significant decrease in permittivity. The critical percolation threshold was observed at 0.5 wt% GFs. A decrease in activation energy occurred at 0.0625 wt% GFs due to the formation of space charges. The activation energy increased at concentrations of 0.125 wt% GFs and 0.25 wt% GFs due to the formation of stable nanolayers. This was followed by a significant decrease in activation energy at concentrations of 0.5 wt% GFs and 1 wt% GFs due to the formation of conductive channels.
The results of this work are a basis for future investigations. Future studies will delve deeper into the effects of temperature on the electrical properties of epoxy nanocomposites. In addition, we intend to extend our research to other nanoparticles, including carbon fibres and carbon nanotubes, and evaluate their effect on the electrical properties of epoxy nanocomposites.
Acknowledgments
Czech Nano Lab project LM2023051 funded by MEYS CR is gratefully acknowledged for the financial support of the measurements/sample fabrication at CEITEC Nano Research Infrastructure. We also acknowledge the Czech Academy of Sciences (RVO:68081731) for providing the laboratory infrastructure. The authors would like to acknowledge the support of the Deanship of Scientific Research of Mu'tah University through research projects #664/2022 and #452/2021. We acknowledge Internal Grant Agency of Brno University of Technology, grant No. FEKT-S-23-8228 for providing the laboratory infrastructure.
Data availability statement
All data that support the findings of this study are included within the article (and any supplementary files).