
Metal Nanoparticles with Antimicrobial Properties: The Toxicity Response in Mouse Mesenchymal Stem Cells
 , , ,
, , ,
Abstract
:1. Introduction
2. Materials and Methods
2.1. MSC Cell Culture
2.2. Concentration Selection and Nanoparticle Characterization
2.2.1. WST-1 and Exposure Scheme
2.2.2. Sample Preparation and Dynamic Light Scattering (DLS)
2.2.3. Transmission Electron Microscopy
2.3. ROS Production and Lipid Peroxidation
2.4. DNA Alterations
2.4.1. Comet Assay
2.4.2. Micronucleus Assay
2.5. Cell Cycle Alterations and Apoptosis
2.5.1. Cell Cycle
2.5.2. Gene Expression Bax/Bcl-2
3. Results
3.1. The Characterization of Nanoparticles and the Identification of Optimal Test Doses of NP (WST-1, DLS, TEM)
3.1.1. WST-1
3.1.2. DLS
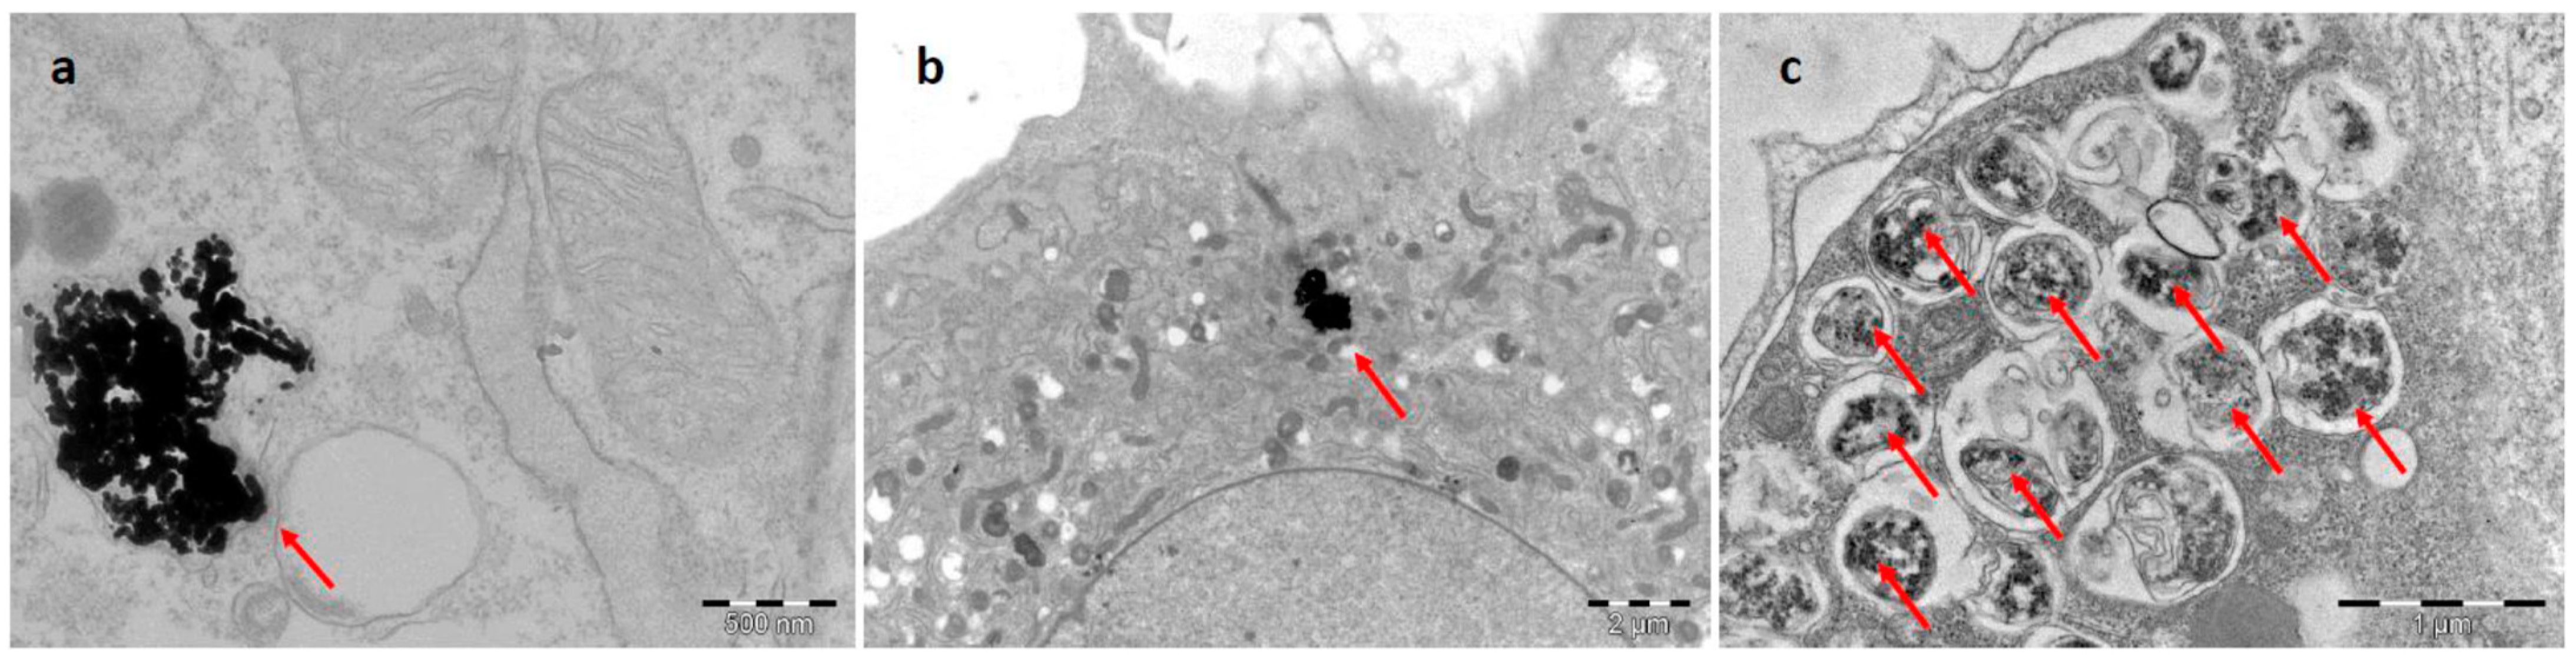
3.1.3. TEM
3.2. Oxidative Stress-Related Response
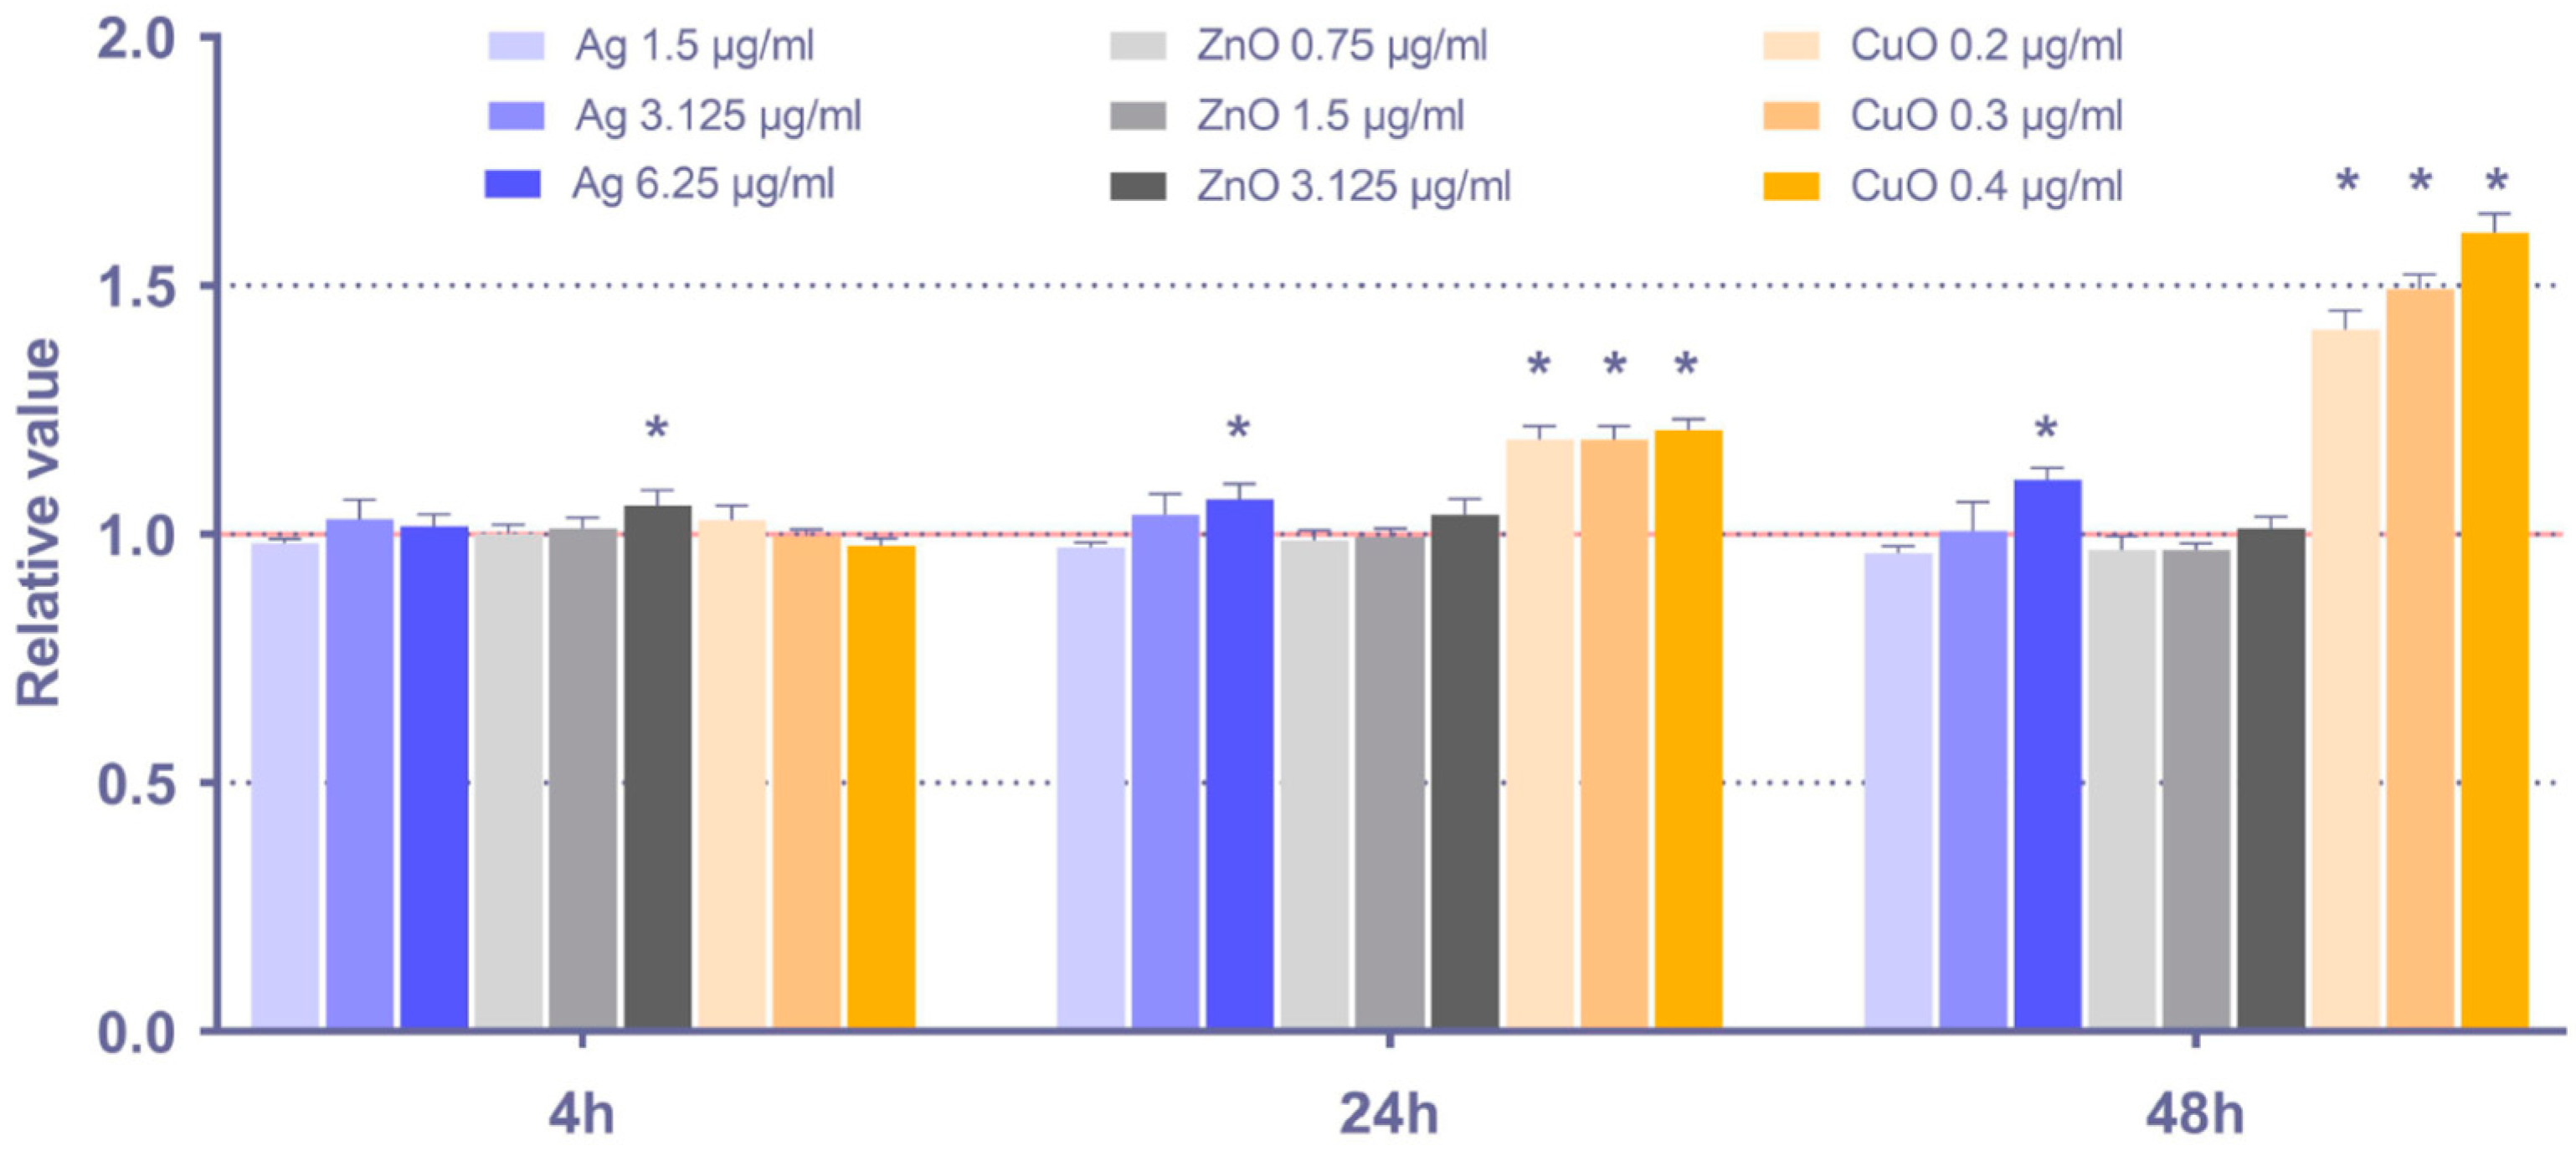
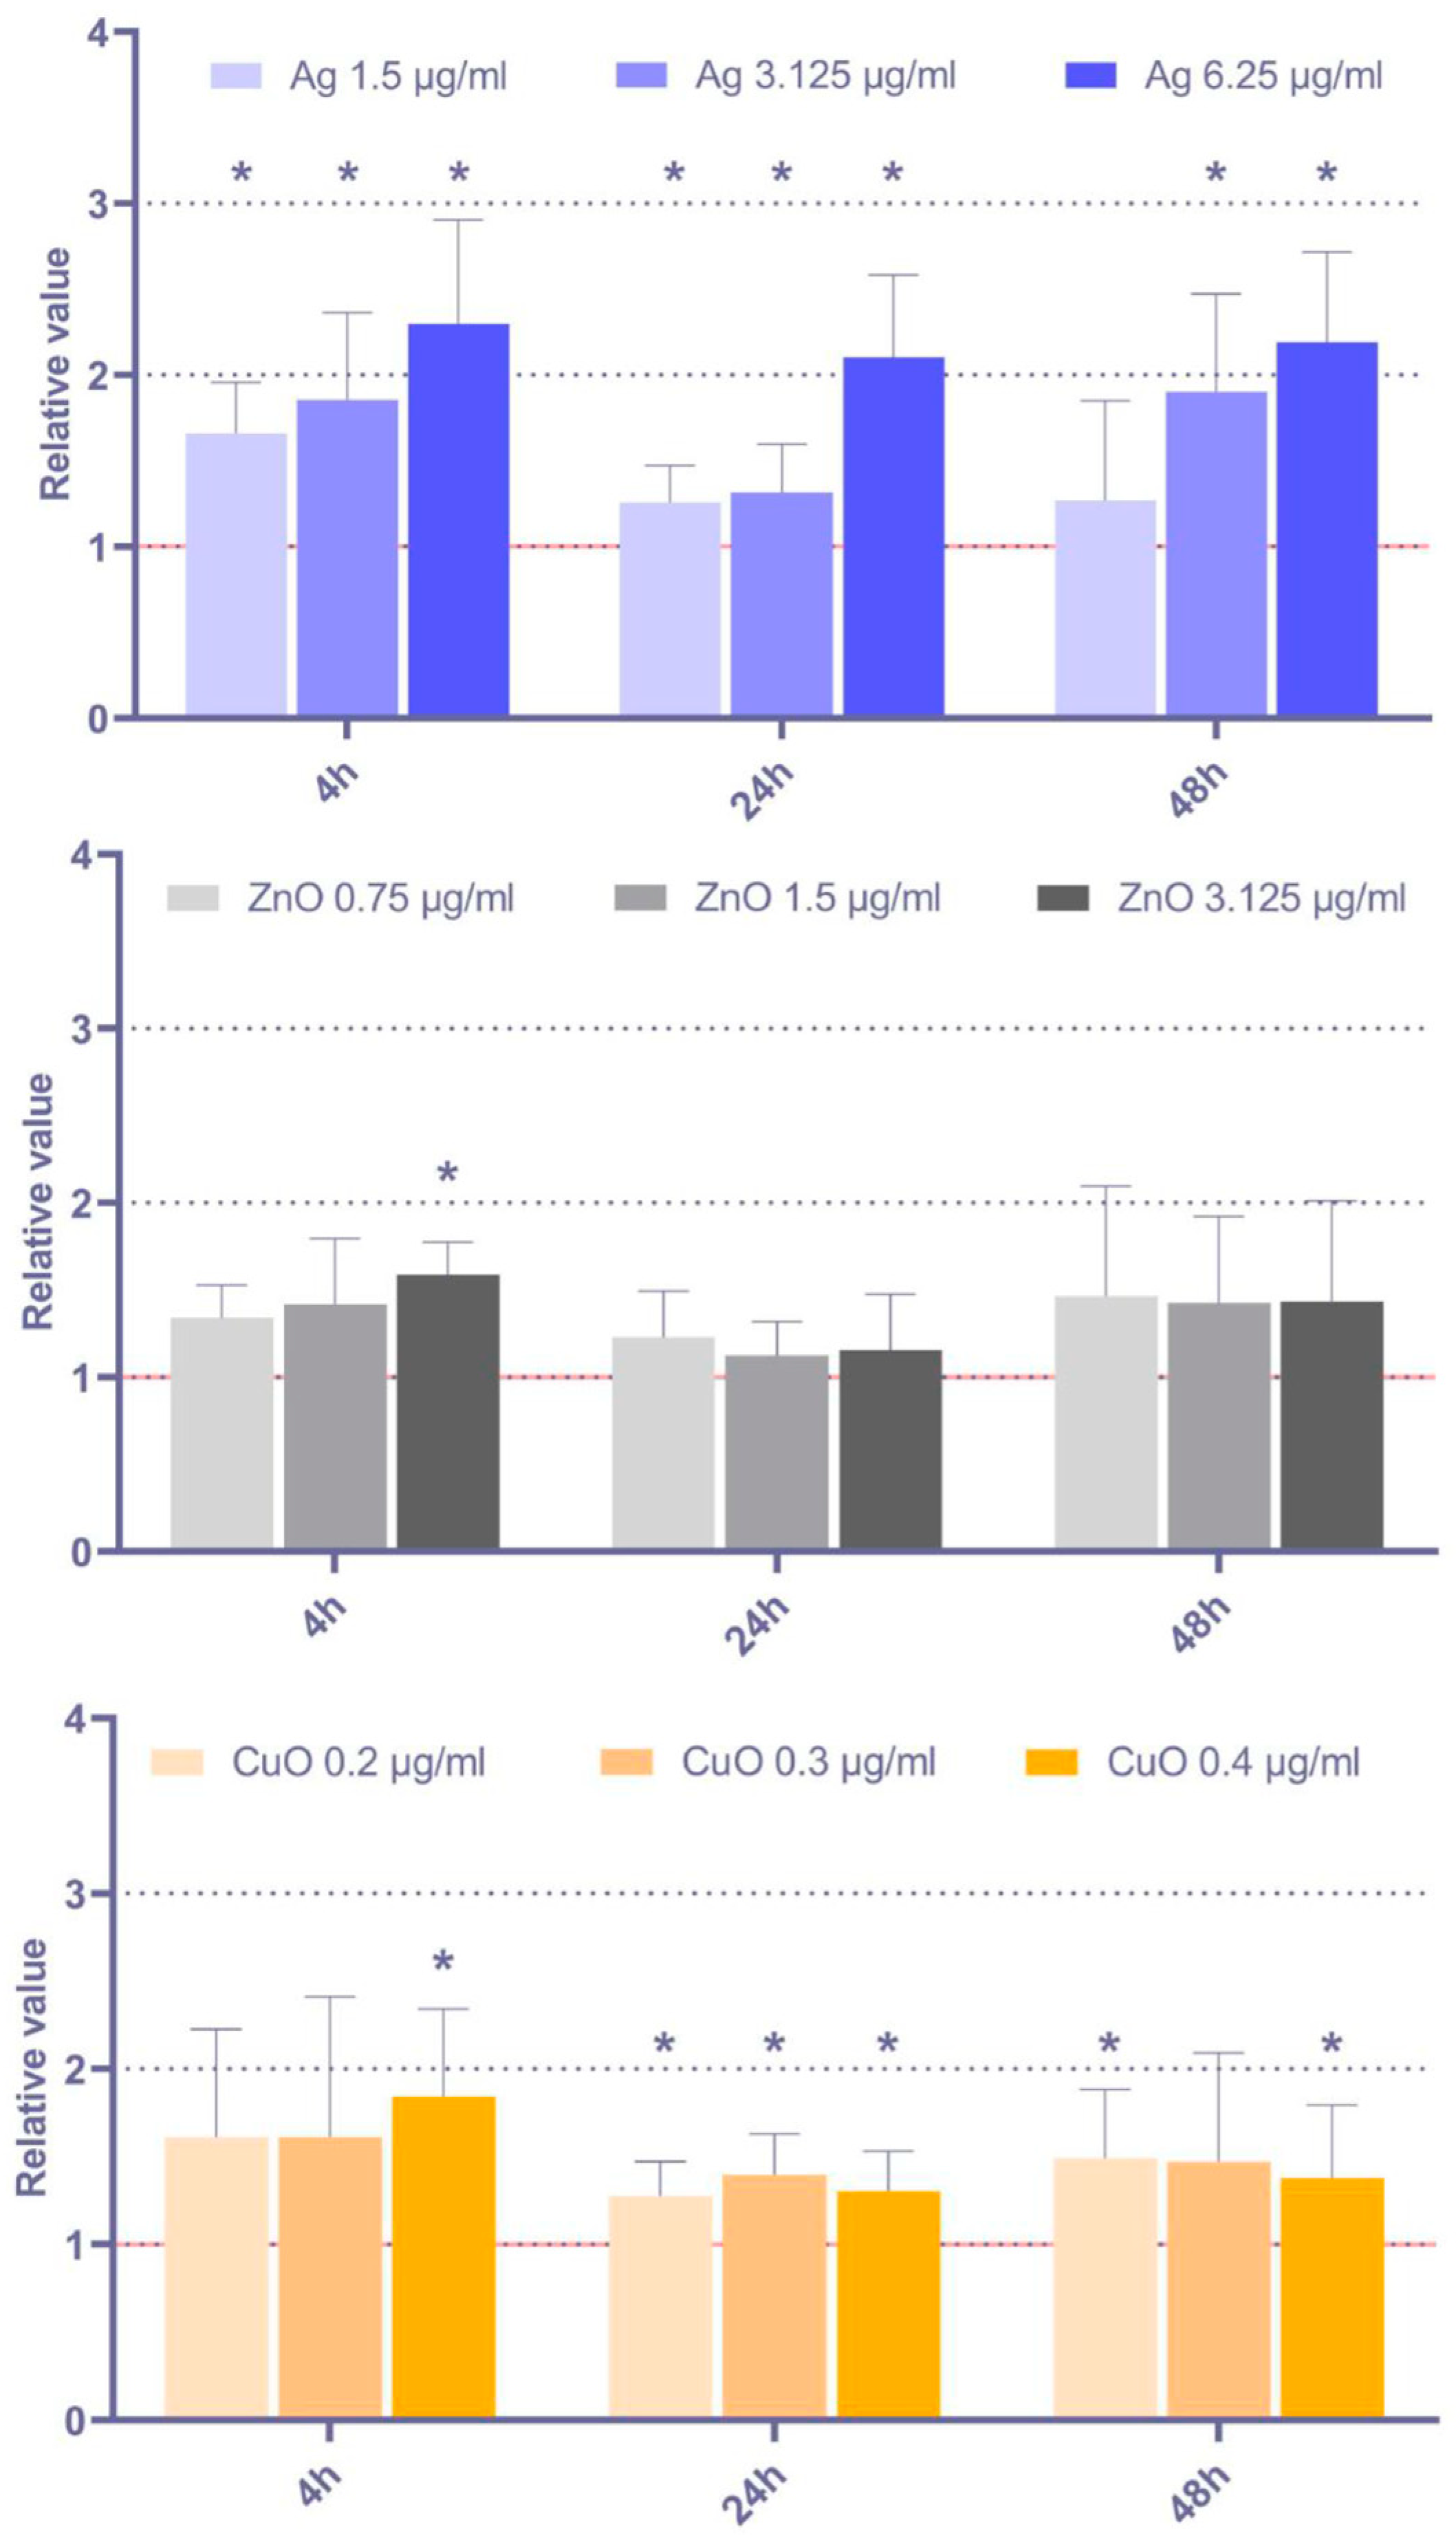
3.2.1. ROS Production
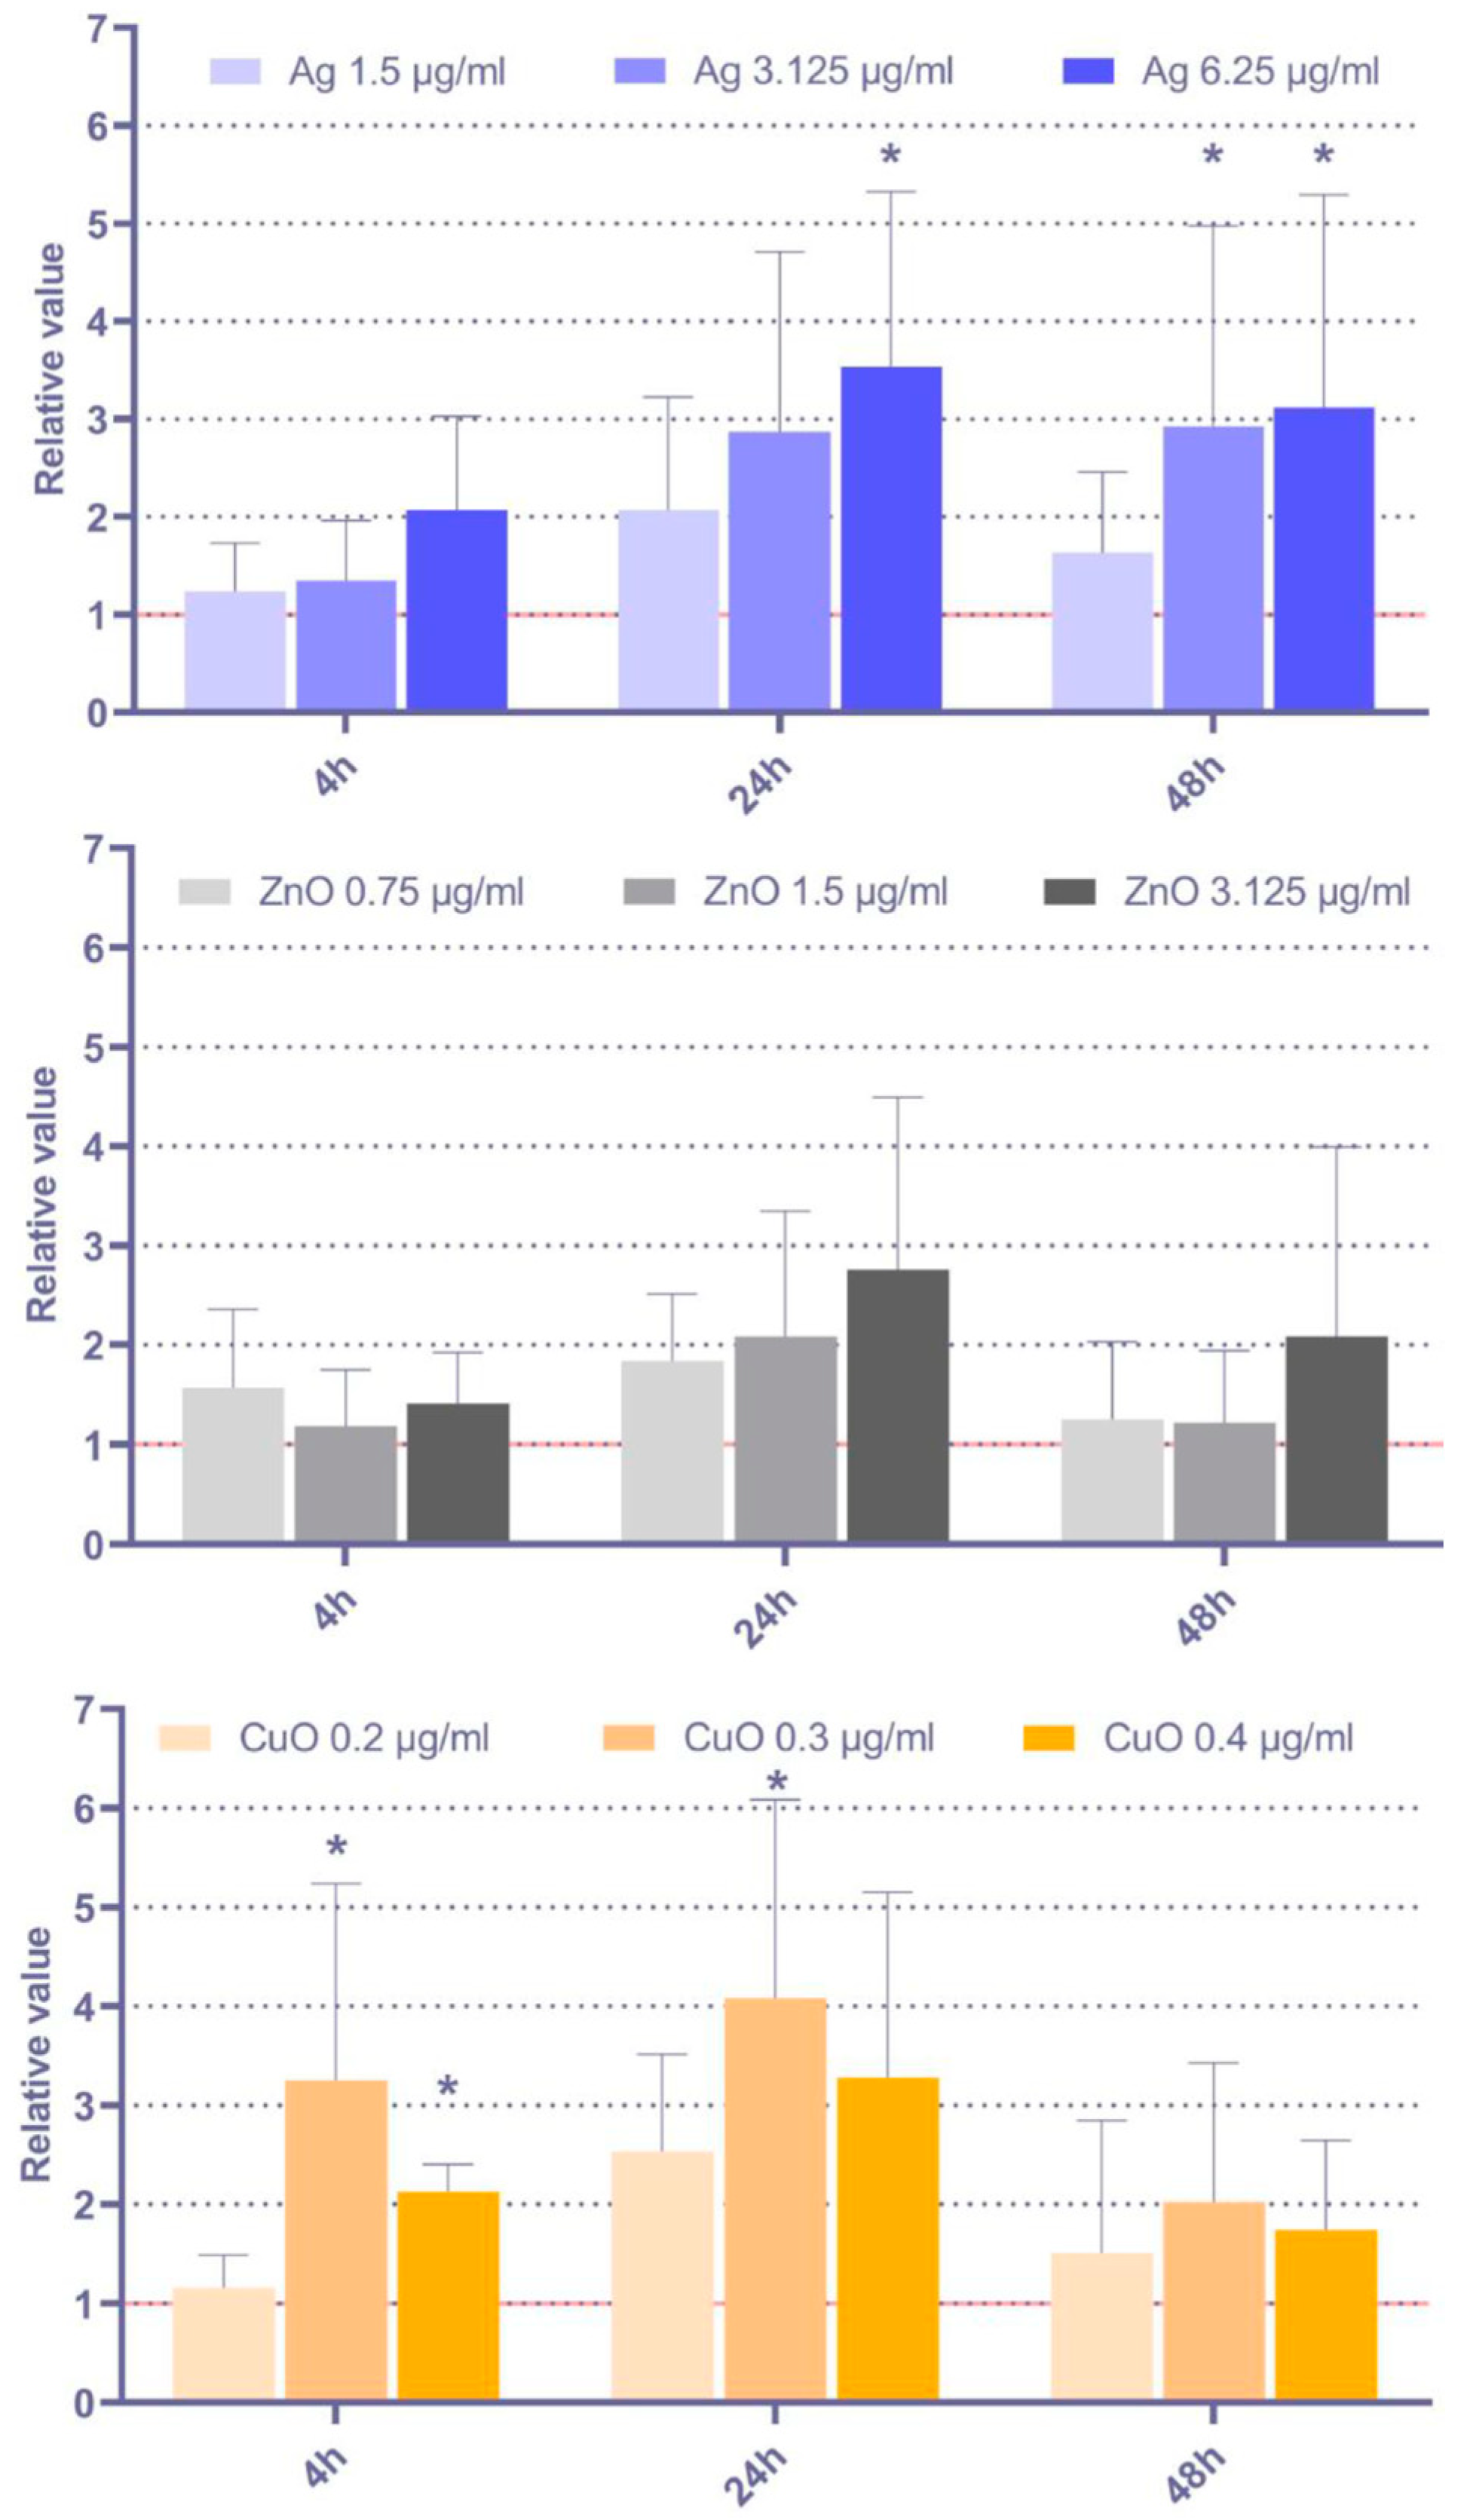
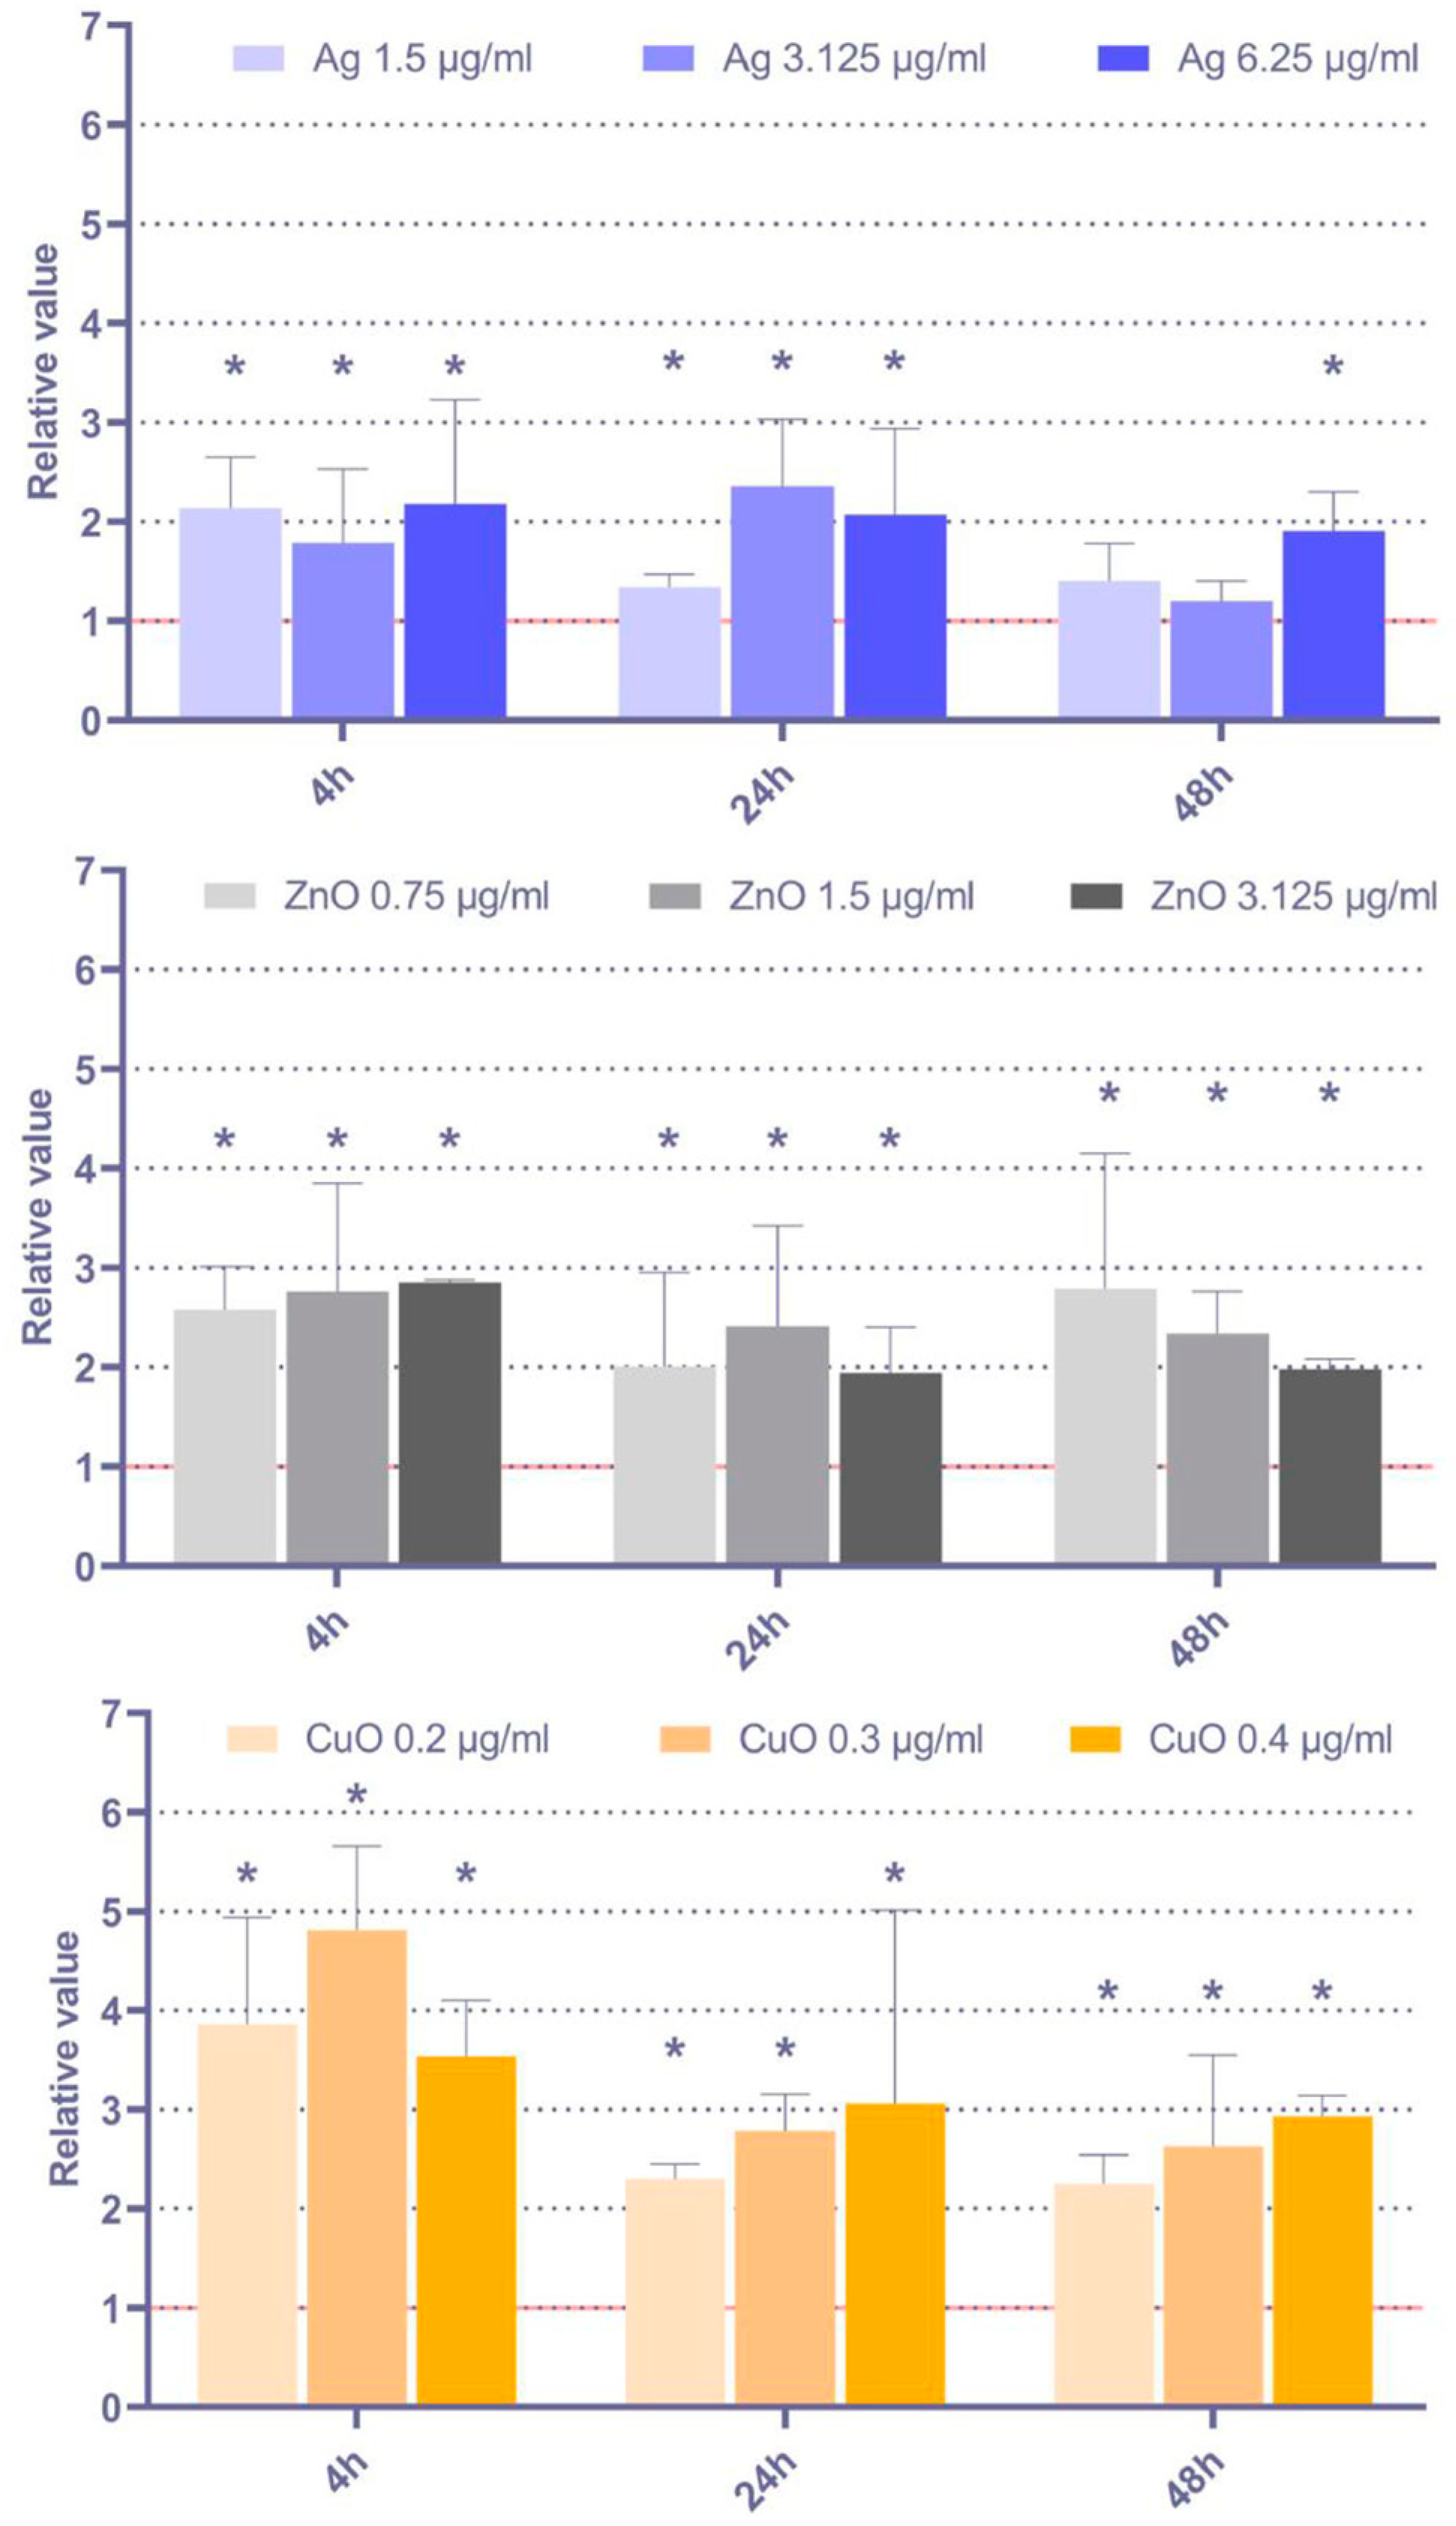
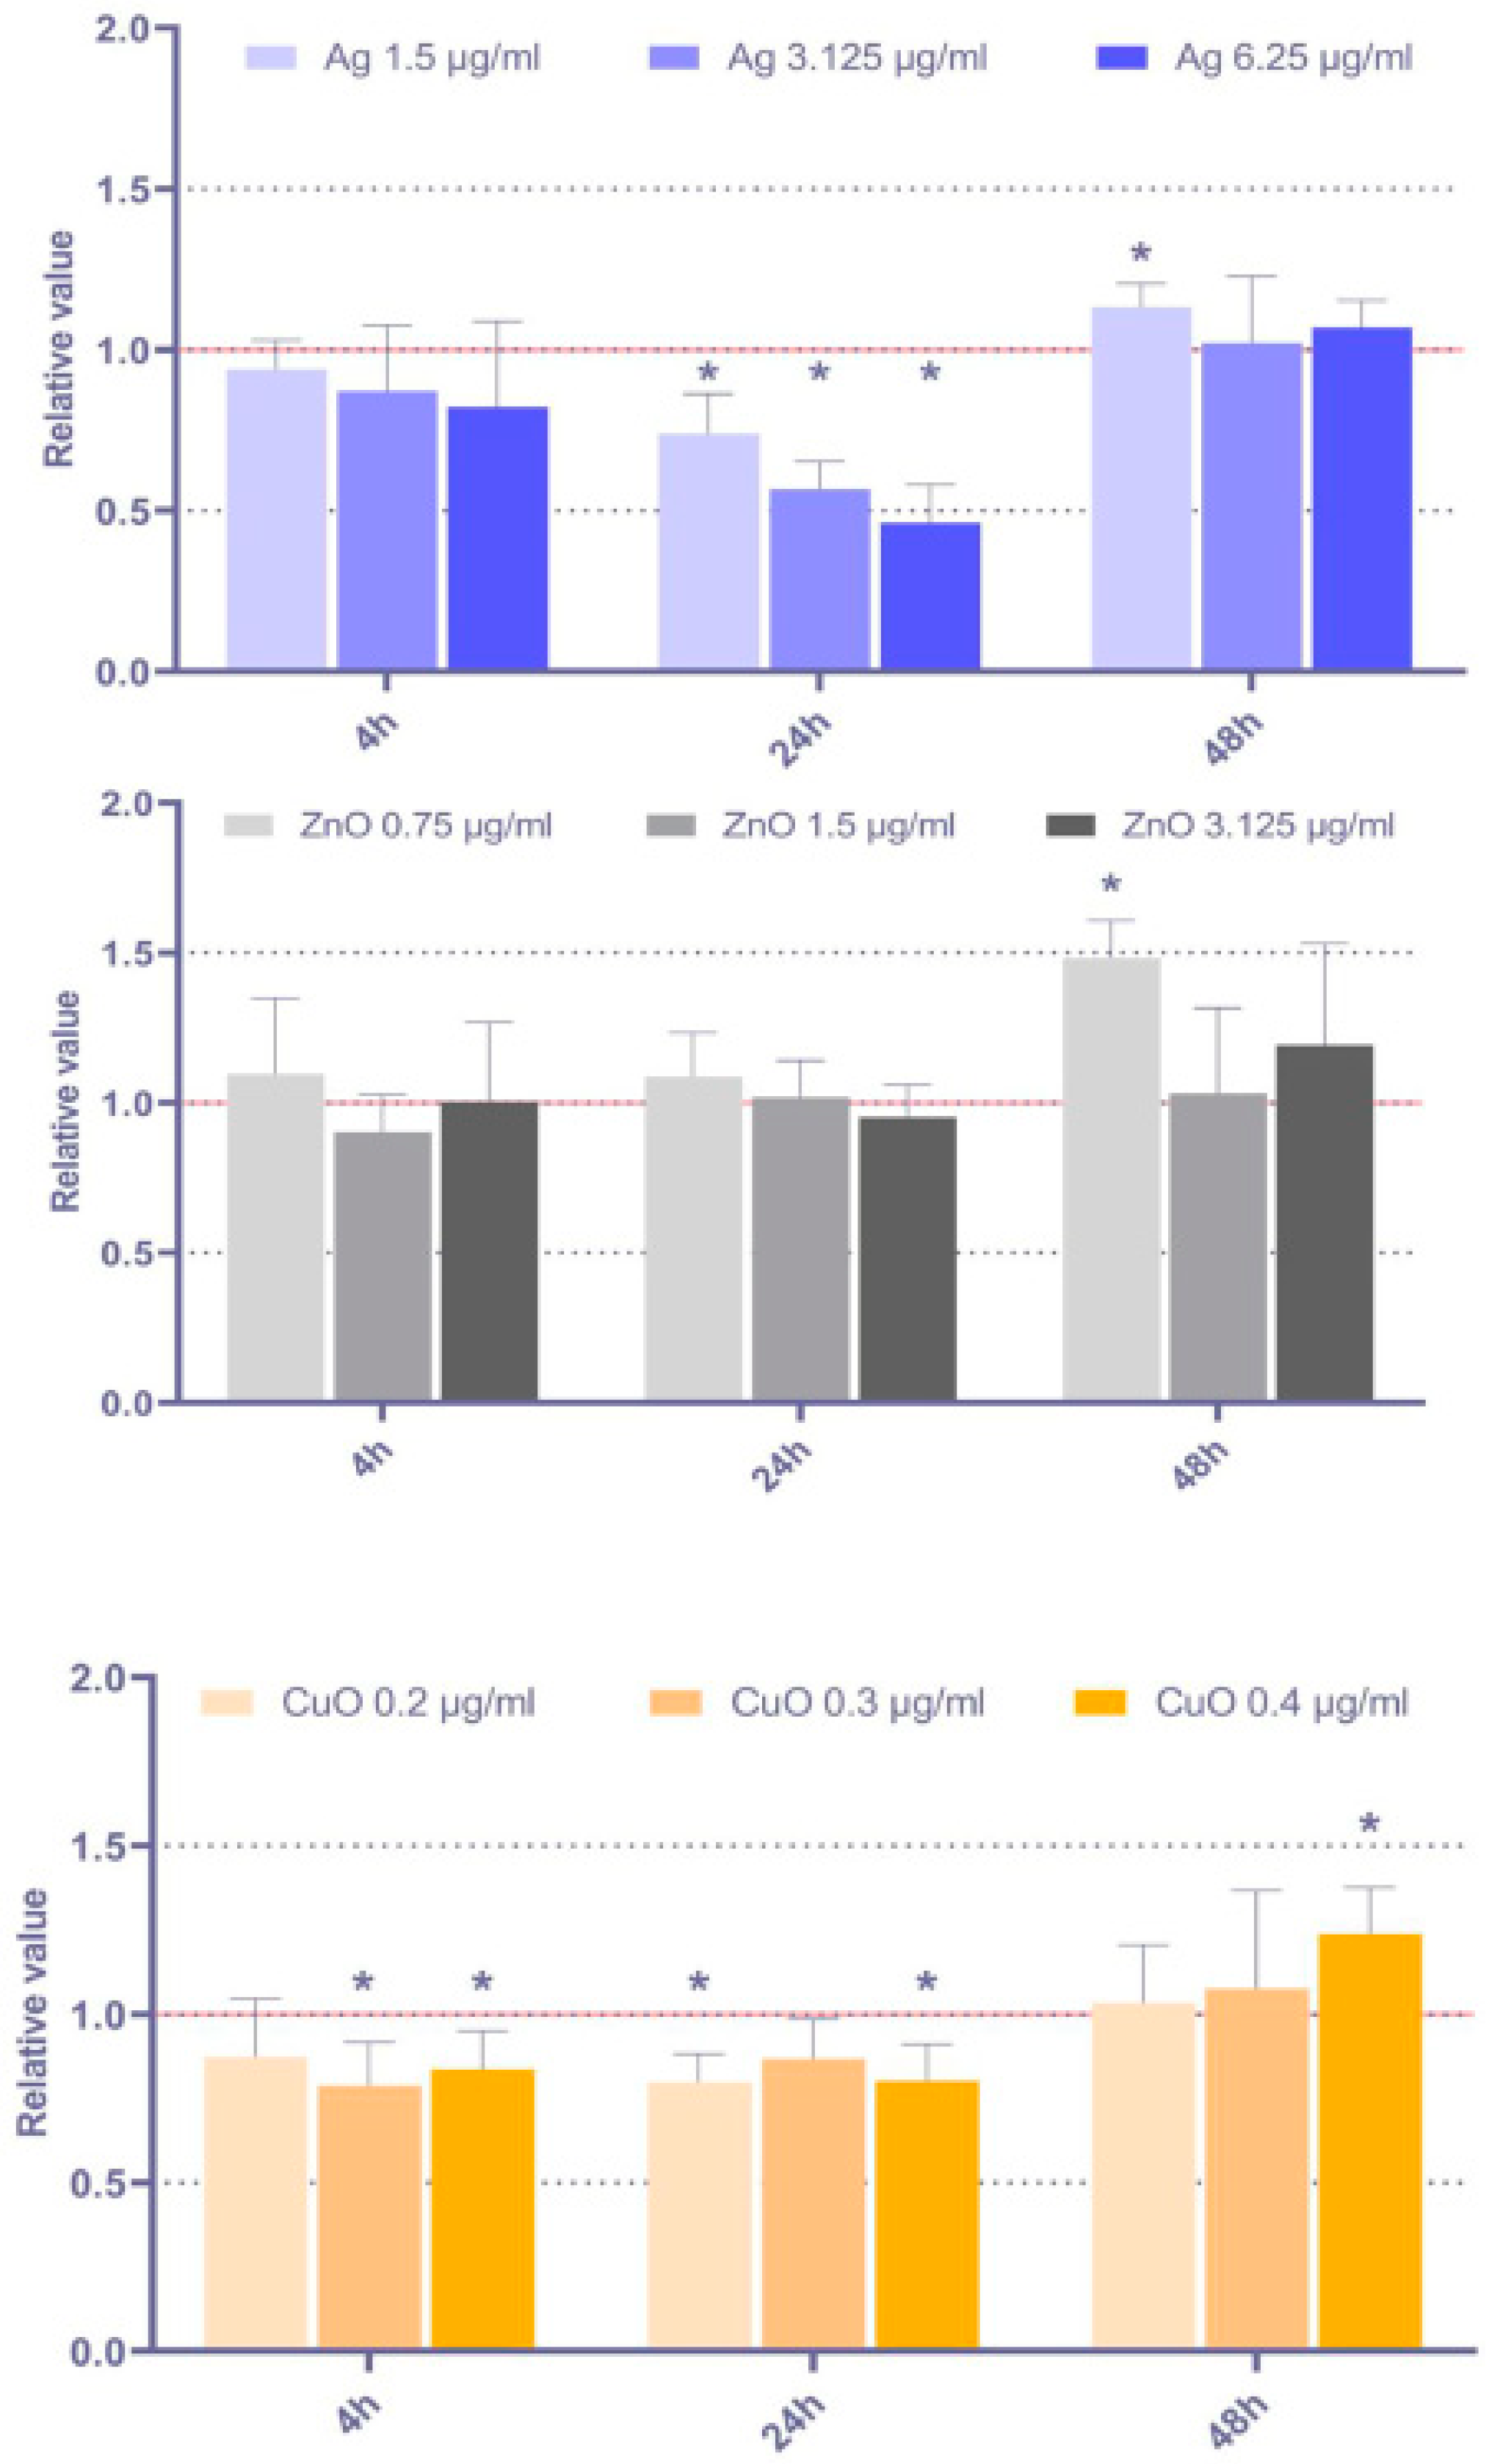
3.2.2. Oxidative DNA Damage
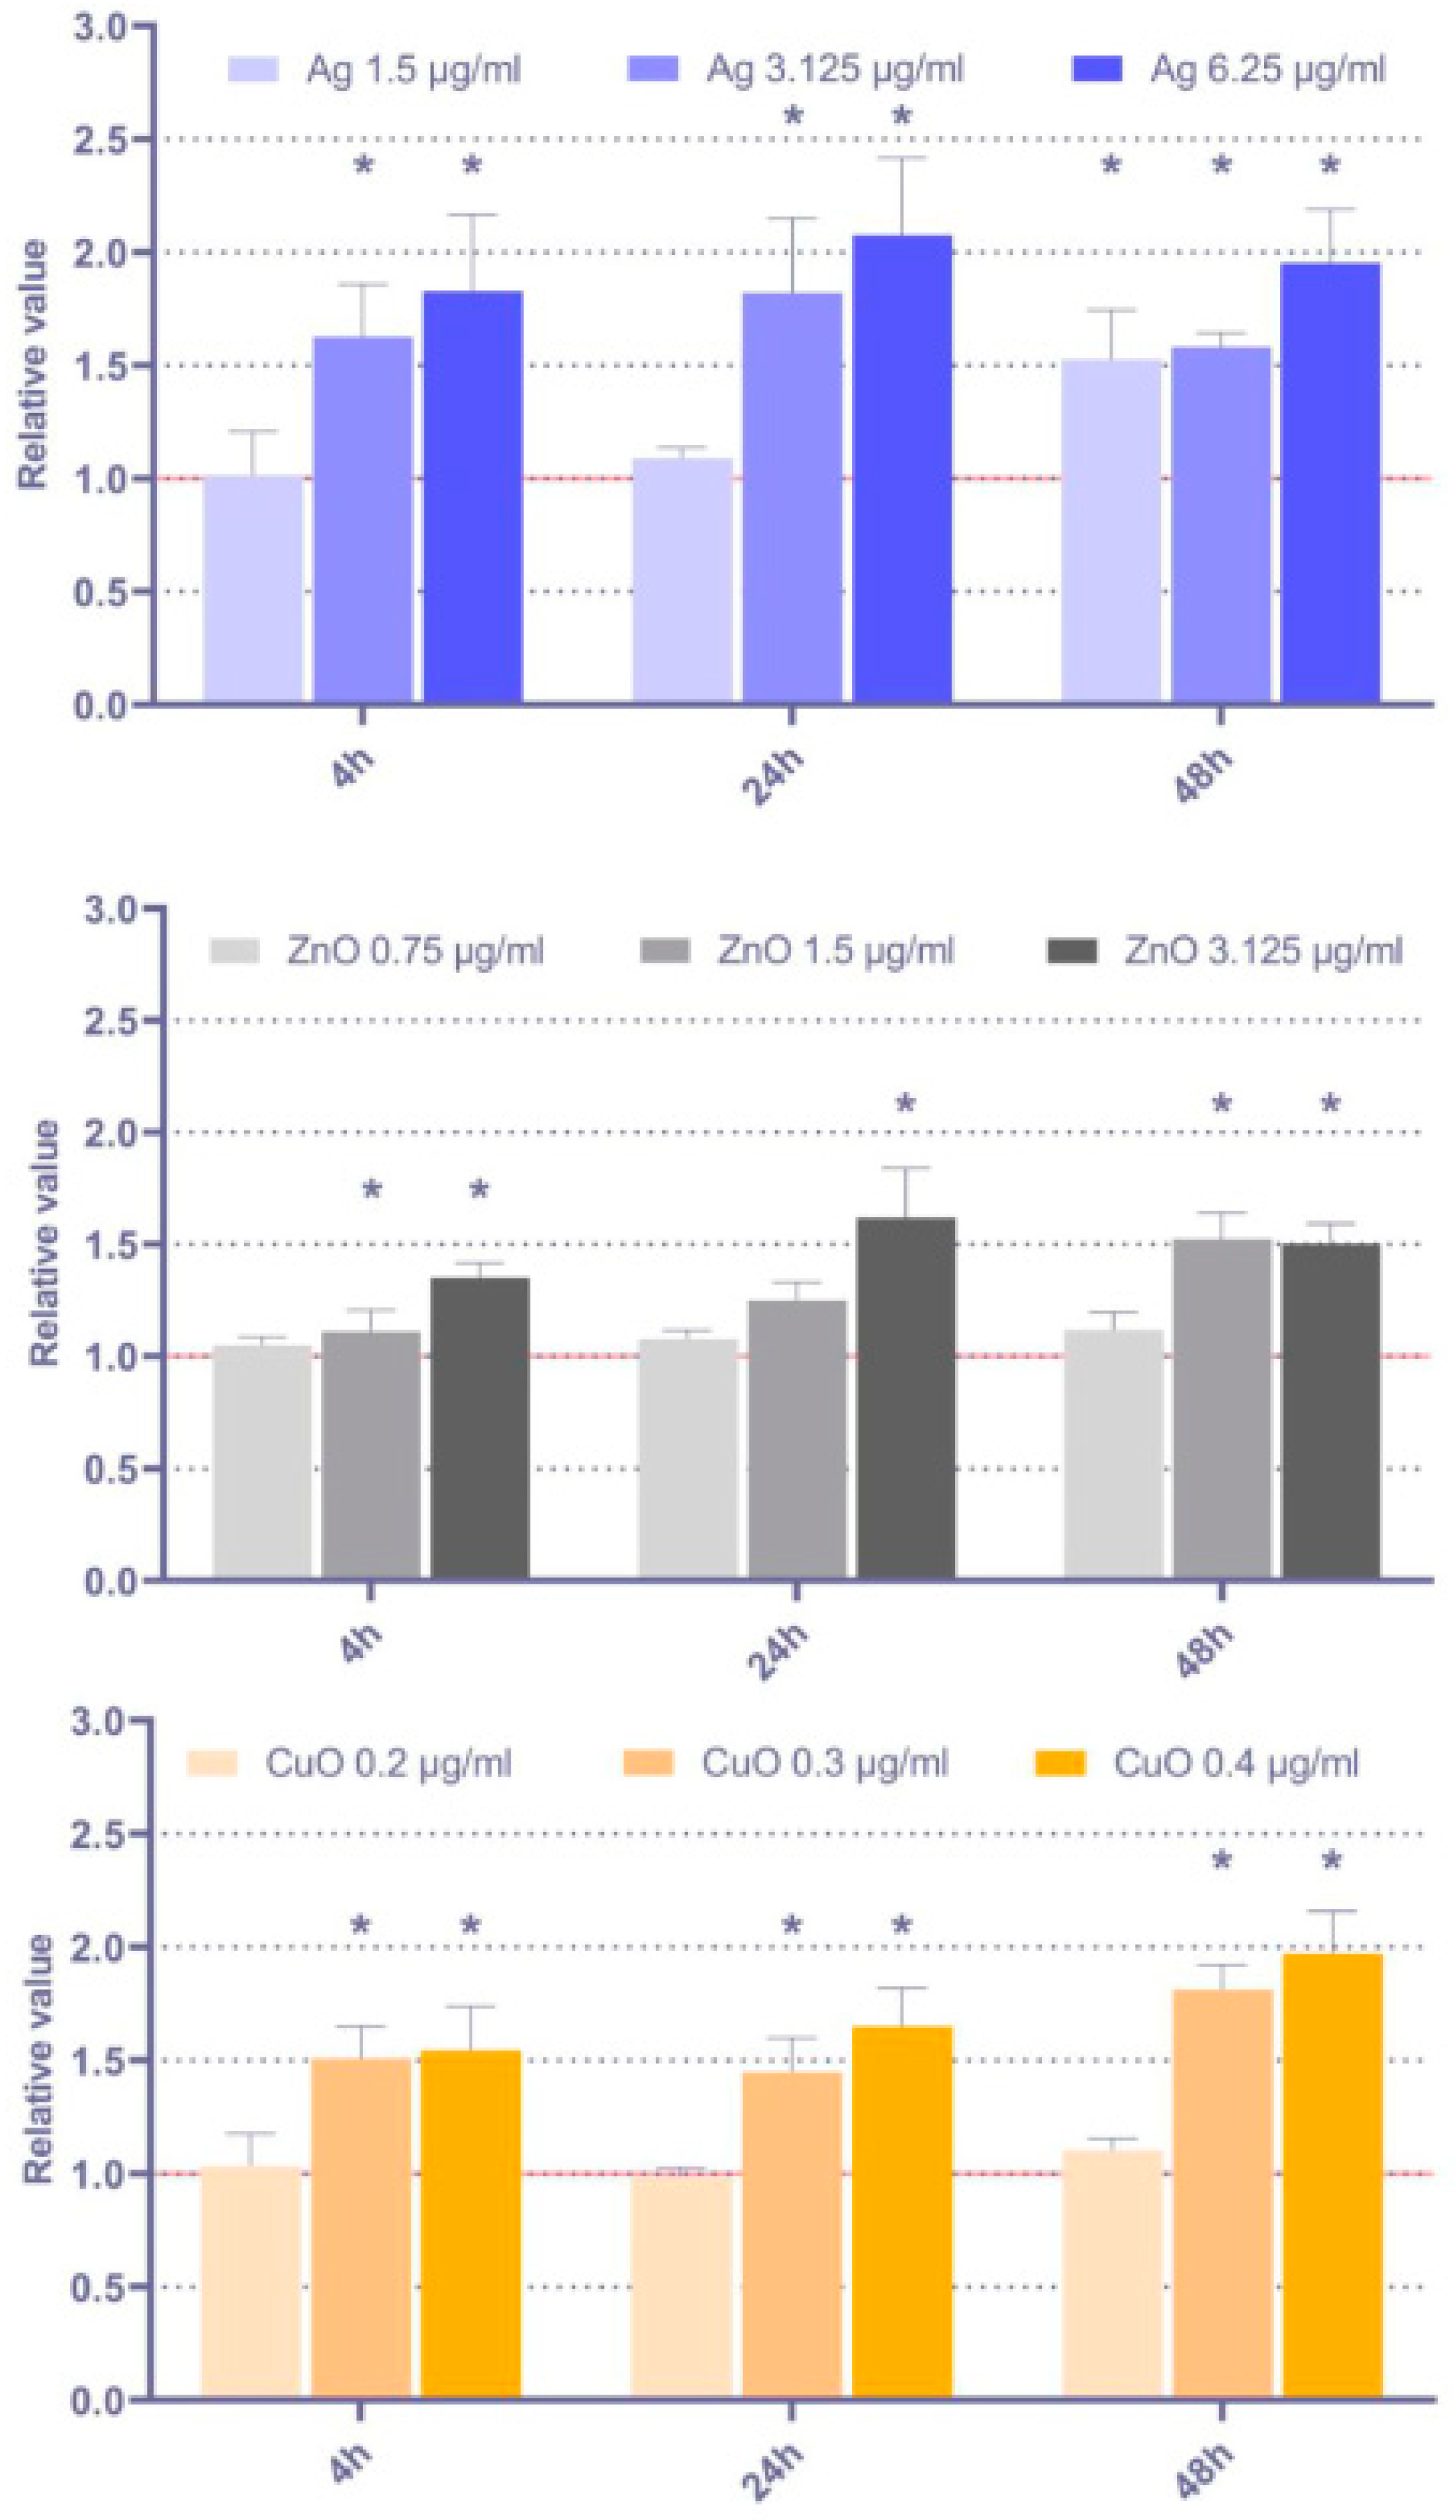
3.2.3. Lipid Peroxidation
3.3. DNA Damage
3.3.1. The Induction of DNA Strand Breaks
3.3.2. Micronuclei Formation
3.4. Cell Cycle Alterations and Apoptosis
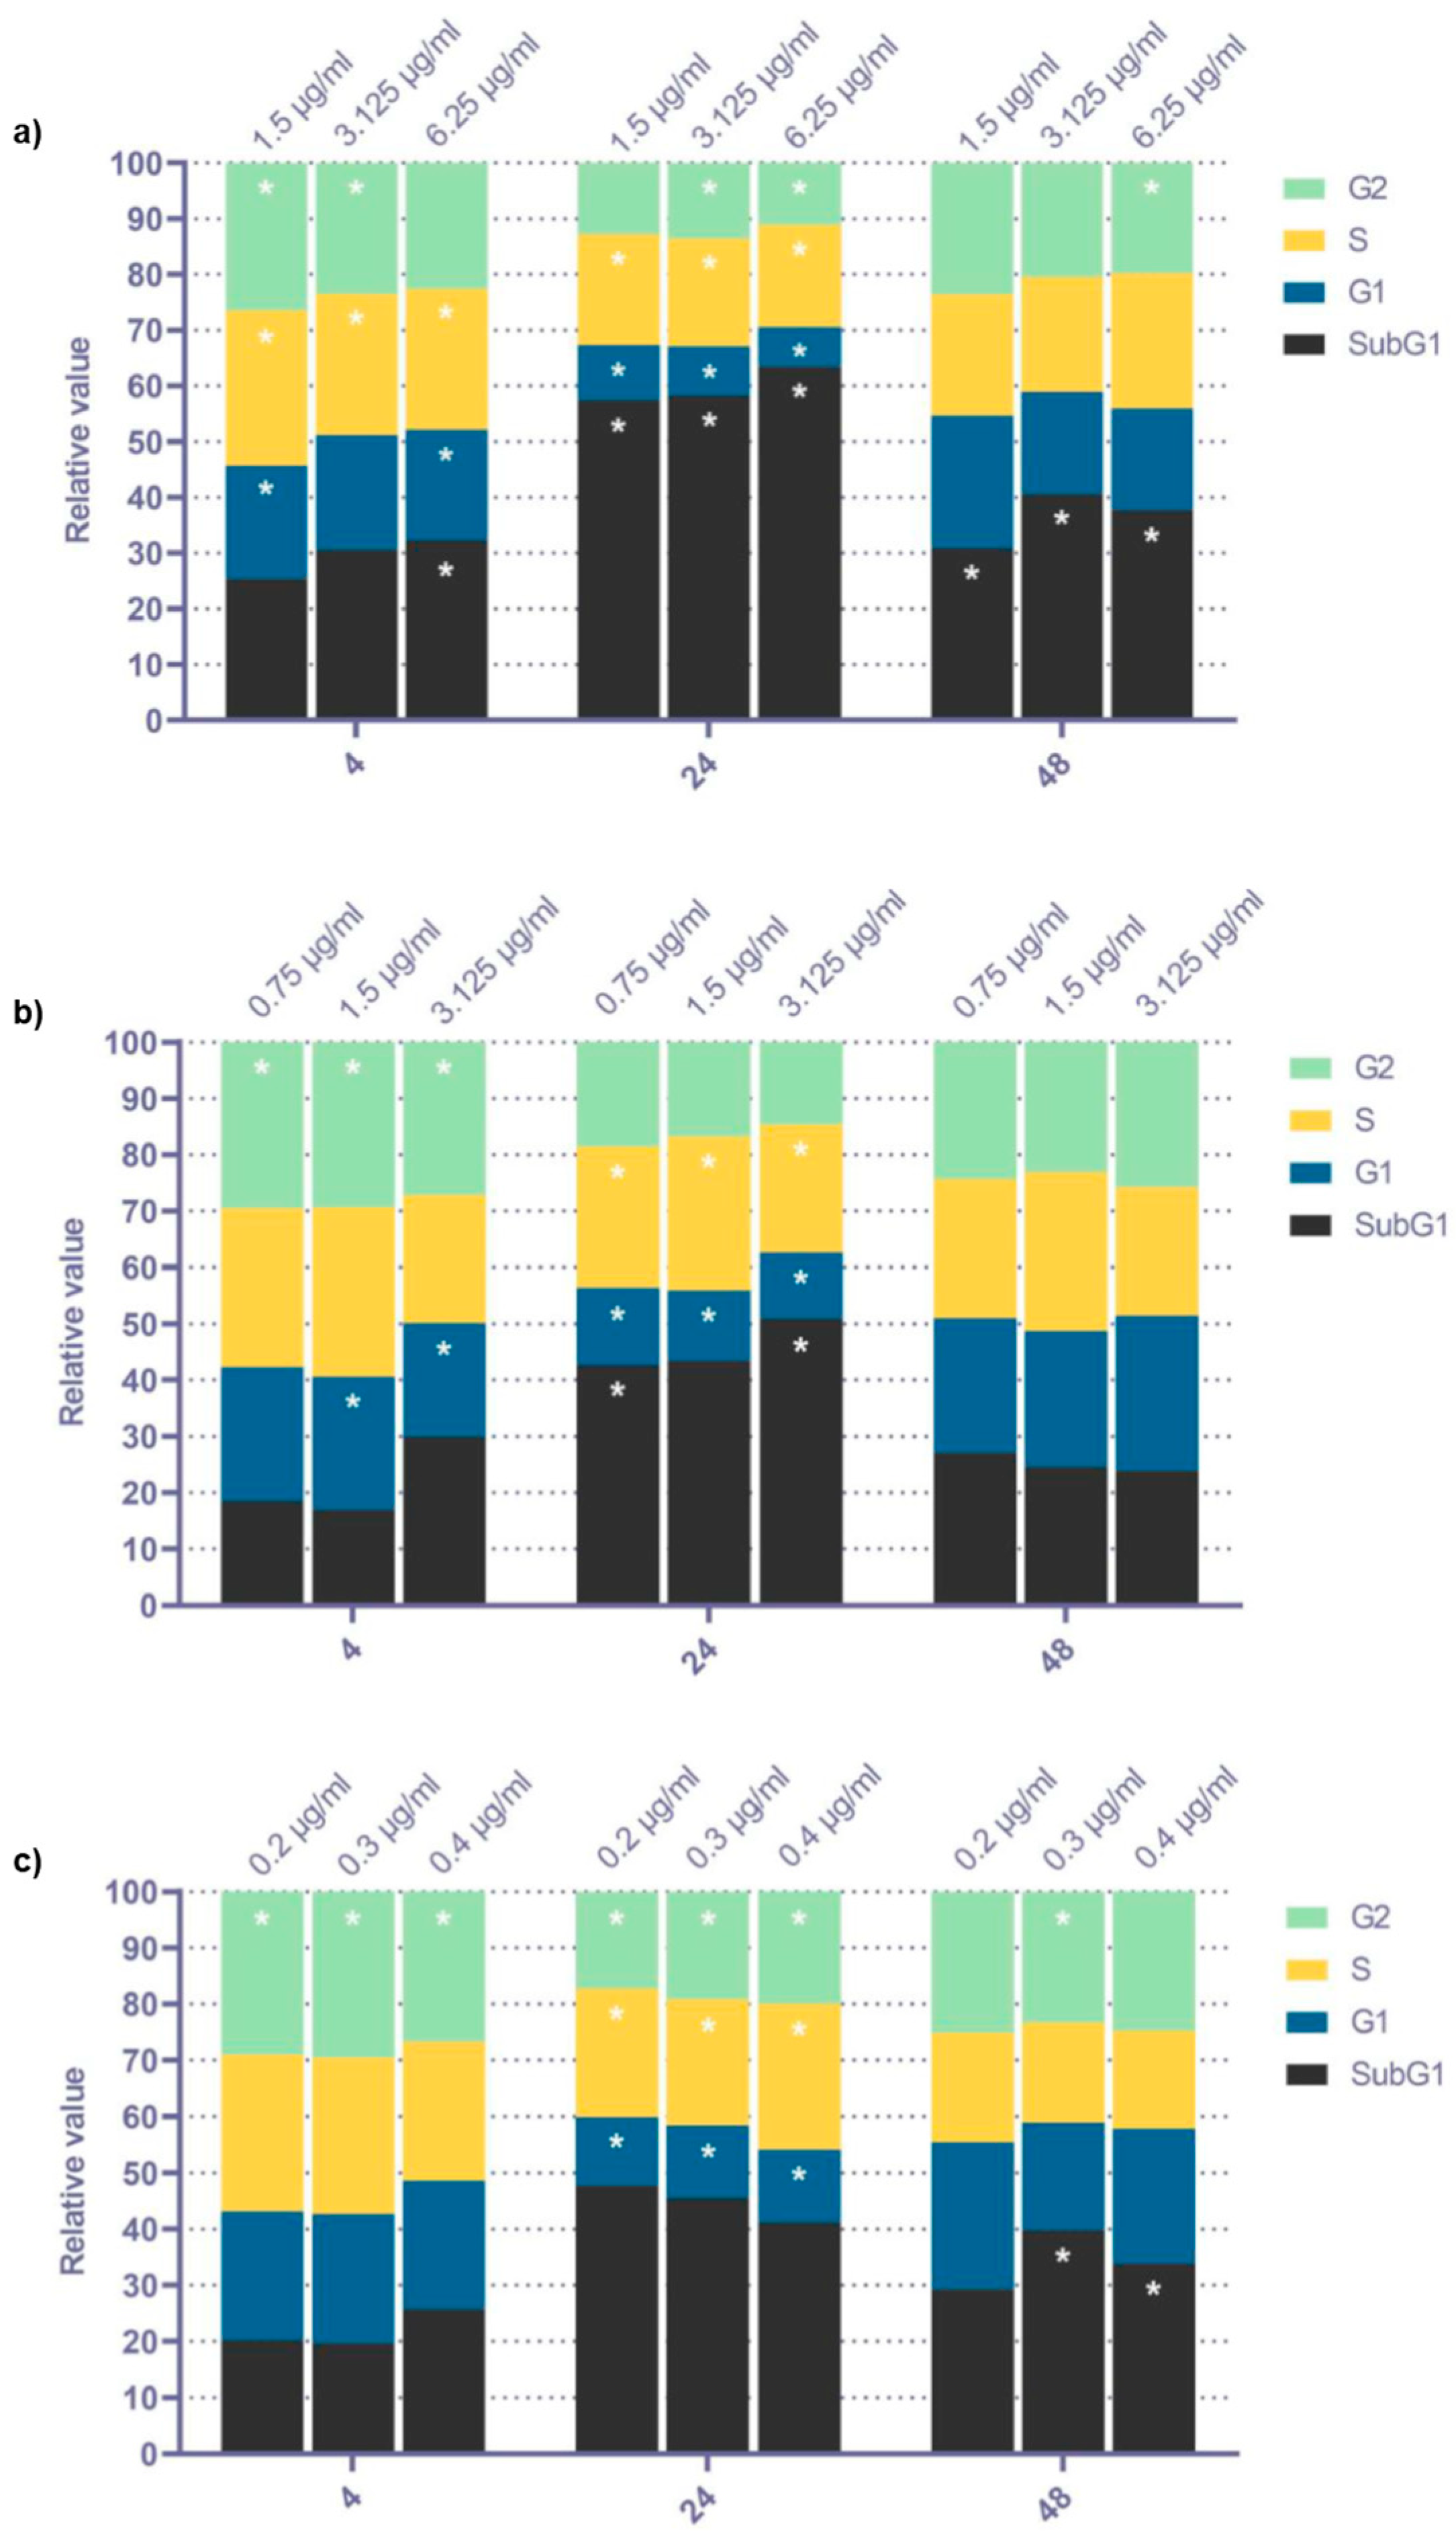
3.4.1. Cell Cycle Analysis
3.4.2. Sensitivity to Apoptosis Induction
4. Discussion
5. Conclusions
Supplementary Materials
Author Contributions
Funding
Institutional Review Board Statement
Informed Consent Statement
Data Availability Statement
Conflicts of Interest
Abbreviations
| DLS | dynamic light scattering |
| IsoP | 15-F2t-isoprostane |
| MSC | mesenchymal stem cells |
| NP | nanoparticle(s) |
| ROS | reactive oxygen species |
| TEM | transmission electron microscopy |
References
- McIntyre, R.A. Common Nano-Materials and Their Use in Real World Applications. Sci. Prog. 2012, 95, 1–22. [Google Scholar] [CrossRef] [PubMed]
- Beyth, N.; Houri-Haddad, Y.; Domb, A.; Khan, W.; Hazan, R. Alternative Antimicrobial Approach: Nano-Antimicrobial Materials. Evid.-Based Complement. Altern. Med. 2015, 2015, 246012. [Google Scholar] [CrossRef] [PubMed] [Green Version]
- Oyarzun-Ampuero, F.; Vidal, A.; Concha, M.; Morales, J.; Orellana, S.; Moreno-Villoslada, I. Nanoparticles for the Treatment of Wounds. Curr. Pharm. Des. 2015, 21, 4329–4341. [Google Scholar] [CrossRef] [Green Version]
- Ajdary, M.; Moosavi, M.A.; Rahmati, M.; Falahati, M.; Mahboubi, M.; Mandegary, A.; Jangjoo, S.; Mohammadinejad, R.; Varma, R.S. Health Concerns of Various Nanoparticles: A Review of Their in Vitro and in Vivo Toxicity. Nanomaterials 2018, 8, 634. [Google Scholar] [CrossRef] [PubMed] [Green Version]
- Abdal Dayem, A.; Lee, S.B.; Cho, S.-G. The Impact of Metallic Nanoparticles on Stem Cell Proliferation and Differentiation. Nanomaterials 2018, 8, 761. [Google Scholar] [CrossRef] [PubMed] [Green Version]
- Zhou, X.; Yuan, L.; Wu, C.; Chen, C.; Luo, G.; Deng, J.; Mao, Z. Recent review of the effect of nanomaterials on stem cells. RSC Adv. 2018, 8, 17656–17676. [Google Scholar] [CrossRef]
- Bacakova, L.; Zarubova, J.; Travnickova, M.; Musilkova, J.; Pajorova, J.; Slepicka, P.; Kasalkova, N.S.; Svorcik, V.; Kolska, Z.; Motarjemi, H.; et al. Stem cells: Their source, potency and use in regenerative therapies with focus on adipose-derived stem cells—A review. Biotechnol. Adv. 2018, 36, 1111–1126. [Google Scholar] [CrossRef]
- Abumaree, M.; Al Jumah, M.; Pace, R.A.; Kalionis, B. Immunosuppressive Properties of Mesenchymal Stem Cells. Stem Cell Rev. Rep. 2011, 8, 375–392. [Google Scholar] [CrossRef]
- English, K. Mechanisms of mesenchymal stromal cell immunomodulation. Immunol. Cell Biol. 2012, 91, 19–26. [Google Scholar] [CrossRef] [Green Version]
- Holan, V.; Hermankova, B.; Bohacova, P.; Kossl, J.; Chudickova, M.; Hajkova, M.; Krulova, M.; Zajicova, A.; Javorkova, E. Distinct Immunoregulatory Mechanisms in Mesenchymal Stem Cells: Role of the Cytokine Environment. Stem Cell Rev. Rep. 2016, 12, 654–663. [Google Scholar] [CrossRef]
- Sánchez-López, E.; Gomes, D.; Esteruelas, G.; Bonilla, L.; Lopez-Machado, A.L.; Galindo, R.; Cano, A.; Espina, M.; Ettcheto, M.; Camins, A.; et al. Metal-Based Nanoparticles as Antimicrobial Agents: An Overview. Nanomaterials 2020, 10, 292. [Google Scholar] [CrossRef] [Green Version]
- Helmlinger, J.; Sengstock, C.; Groß-Heitfeld, C.; Mayer, C.; Schildhauer, T.A.; Köller, M.; Epple, M. Silver nanoparticles with different size and shape: Equal cytotoxicity, but different antibacterial effects. RSC Adv. 2016, 6, 18490–18501. [Google Scholar] [CrossRef] [Green Version]
- Breisch, M.; Grasmik, V.; Loza, K.; Pappert, K.; Rostek, A.; Ziegler, N.; Ludwig, A.; Heggen, M.; Epple, M.; Tiller, J.C.; et al. Bimetallic silver–platinum nanoparticles with combined osteo-promotive and antimicrobial activity. Nanotechnology 2019, 30, 305101. [Google Scholar] [CrossRef]
- Wan, R.; Chu, S.; Wang, X.; Lei, L.; Tang, H.; Hu, G.; Dong, L.; Li, D.; Gu, H. Study on the osteogenesis of rat mesenchymal stem cells and the long-term antibacterial activity of Staphylococcus epidermidis on the surface of silver-rich TiN /Ag modified titanium alloy. J. Biomed. Mater. Res. Part B Appl. Biomater. 2020, 108, 3008–3021. [Google Scholar] [CrossRef]
- Cioffi, N.; Torsi, L.; Ditaranto, N.; Tantillo, G.; Ghibelli, L.; Sabbatini, L.; Bleve-Zacheo, T.; D’Alessio, M.; Zambonin, P.G.; Traversa, E. Copper Nanoparticle/Polymer Composites with Antifungal and Bacteriostatic Properties. Chem. Mater. 2005, 17, 5255–5262. [Google Scholar] [CrossRef]
- Ren, G.; Hu, D.; Cheng, E.W.; Vargas-Reus, M.A.; Reip, P.; Allaker, R.P. Characterisation of copper oxide nanoparticles for antimicrobial applications. Int. J. Antimicrob. Agents 2009, 33, 587–590. [Google Scholar] [CrossRef]
- Gunawan, C.; Teoh, W.Y.; Marquis, C.; Amal, R. Cytotoxic Origin of Copper(II) Oxide Nanoparticles: Comparative Studies with Micron-Sized Particles, Leachate, and Metal Salts. ACS Nano 2011, 5, 7214–7225. [Google Scholar] [CrossRef] [PubMed]
- Limbach, L.K.; Wick, P.; Manser, P.; Grass, R.N.; Bruinink, A.; Stark, W.J. Exposure of Engineered Nanoparticles to Human Lung Epithelial Cells: Influence of Chemical Composition and Catalytic Activity on Oxidative Stress. Environ. Sci. Technol. 2007, 41, 4158–4163. [Google Scholar] [CrossRef]
- Karlsson, H.L.; Cronholm, P.; Gustafsson, J.; Möller, L. Copper Oxide Nanoparticles Are Highly Toxic: A Comparison between Metal Oxide Nanoparticles and Carbon Nanotubes. Chem. Res. Toxicol. 2008, 21, 1726–1732. [Google Scholar] [CrossRef]
- Murgia, A.; Mancuso, L.; Manis, C.; Caboni, P.; Cao, G. GC-MS metabolomics analysis of mesenchymal stem cells treated with copper oxide nanoparticles. Toxicol. Mech. Methods 2016, 26, 611–619. [Google Scholar] [CrossRef]
- Fahmy, B.; Cormier, S.A. Copper oxide nanoparticles induce oxidative stress and cytotoxicity in airway epithelial cells. Toxicol. Vitr. 2009, 23, 1365–1371. [Google Scholar] [CrossRef] [PubMed] [Green Version]
- Siddiqui, M.; Alhadlaq, H.; Ahmad, J.; Al-Khedhairy, A.; Musarrat, J.; Ahamed, M. Copper Oxide Nanoparticles Induced Mitochondria Mediated Apoptosis in Human Hepatocarcinoma Cells. PLoS ONE 2013, 8, e69534. [Google Scholar] [CrossRef] [PubMed] [Green Version]
- Le Blanc, K. Mesenchymal stromal cells: Tissue repair and immune modulation. Cytotherapy 2006, 8, 559–561. [Google Scholar] [CrossRef] [PubMed]
- Sasaki, M.; Abe, R.; Fujita, Y.; Ando, S.; Inokuma, D.; Shimizu, H. Mesenchymal Stem Cells Are Recruited into Wounded Skin and Contribute to Wound Repair by Transdifferentiation into Multiple Skin Cell Type. J. Immunol. 2008, 180, 2581–2587. [Google Scholar] [CrossRef] [Green Version]
- Politano, A.D.; Campbell, K.T.; Rosenberger, L.H.; Sawyer, R.G. Use of Silver in the Prevention and Treatment of Infections: Silver Review. Surg. Infect. 2013, 14, 8–20. [Google Scholar] [CrossRef] [Green Version]
- Kumar, R.; Umar, A.; Kumar, G.; Nalwa, H.S. Antimicrobial properties of ZnO nanomaterials: A review. Ceram. Int. 2017, 43, 3940–3961. [Google Scholar] [CrossRef]
- Altoé, L.S.; Alves, R.S.; Sarandy, M.M.; Morais-Santos, M.; Novaes, R.D.; Gonçalves, R.V. Does antibiotic use accelerate or retard cutaneous repair? A systematic review in animal models. PLoS ONE 2019, 14, e0223511. [Google Scholar] [CrossRef]
- Matsumoto, H.; Wada, T.; Fukunaga, K.; Yoshihiro, S.; Matsuyama, H.; Naito, K. Bax to Bcl-2 Ratio and Ki-67 Index are Useful Predictors of Neoadjuvant Chemoradiation Therapy in Bladder Cancer. Jpn. J. Clin. Oncol. 2004, 34, 124–130. [Google Scholar] [CrossRef] [Green Version]
- Echalar, B.; Dostalova, D.; Palacka, K.; Javorkova, E.; Hermankova, B.; Cervena, T.; Zajicova, A.; Holan, V.; Rossner, P. Effects of antimicrobial metal nanoparticles on characteristics and function properties of mouse mesenchymal stem cells. Toxicol. Vitr. 2023, 87, 105536. [Google Scholar] [CrossRef]
- Porubska, B.; Vasek, D.; Somova, V.; Hajkova, M.; Hlaviznova, M.; Tlapakova, T.; Holan, V.; Krulova, M. Sertoli Cells Possess Immunomodulatory Properties and the Ability of Mitochondrial Transfer Similar to Mesenchymal Stromal Cells. Stem Cell Rev. Rep. 2021, 17, 1905–1916. [Google Scholar] [CrossRef]
- Jensen, K.A. The NANOGENOTOX Dispersion Protocol for NANoREG; National Research Centre for the Working Environment: Copenhagen, Denmark, 2014. [Google Scholar]
- Hanzalova, K.; Rossner, P.; Sram, R.J. Oxidative damage induced by carcinogenic polycyclic aromatic hydrocarbons and organic extracts from urban air particulate matter. Mutat. Res. Toxicol. Environ. Mutagen. 2010, 696, 114–121. [Google Scholar] [CrossRef]
- Rossner, P.; Libalova, H.; Vrbova, K.; Cervena, T.; Rossnerova, A.; Elzeinova, F.; Milcova, A.; Novakova, Z.; Topinka, J. Genotoxicant exposure, activation of the aryl hydrocarbon receptor, and lipid peroxidation in cultured human alveolar type II A549 cells. Mutat. Res. Toxicol. Environ. Mutagen. 2020, 853, 503173. [Google Scholar] [CrossRef]
- Novotna, B.; Topinka, J.; Solansky, I.; Chvatalova, I.; Lnenickova, Z.; Sram, R.J. Impact of air pollution and genotype variability on DNA damage in Prague policemen. Toxicol. Lett. 2007, 172, 37–47. [Google Scholar] [CrossRef]
- Livak, K.J.; Schmittgen, T.D. Analysis of relative gene expression data using real-time quantitative PCR and the 2−ΔΔCT Method. Methods 2001, 25, 402–408. [Google Scholar] [CrossRef]
- Worldwide, M.I. Dynamic Light Scattering: Common Terms Define; Inform white paper; Malwern Instruments Limited: Malvern, UK, 2011. [Google Scholar]
- Holan, V.; Trosan, P.; Cejka, C.; Javorkova, E.; Zajicova, A.; Hermankova, B.; Chudickova, M.; Cejkova, J. A Comparative Study of the Therapeutic Potential of Mesenchymal Stem Cells and Limbal Epithelial Stem Cells for Ocular Surface Reconstruction: MSCs and LSCs for Ocular Surface Reconstruction. STEM CELLS Transl. Med. 2015, 4, 1052–1063. [Google Scholar] [CrossRef]
- Magdolenova, Z.; Collins, A.; Kumar, A.; Dhawan, A.; Stone, V.; Dusinska, M. Mechanisms of genotoxicity. A review of in vitro and in vivo studies with engineered nanoparticles. Nanotoxicology 2014, 8, 233–278. [Google Scholar] [CrossRef]
- Poetsch, A.R. The genomics of oxidative DNA damage, repair, and resulting mutagenesis. Comput. Struct. Biotechnol. J. 2020, 18, 207–219. [Google Scholar] [CrossRef]
- Sengstock, C.; Diendorf, J.; Epple, M.; Schildhauer, T.A.; Köller, M. Effect of silver nanoparticles on human mesenchymal stem cell differentiation. Beilstein J. Nanotechnol. 2014, 5, 2058–2069. [Google Scholar] [CrossRef] [Green Version]
- Hackenberg, S.; Scherzed, A.; Kessler, M.; Hummel, S.; Technau, A.; Froelich, K.; Ginzkey, C.; Koehler, C.; Hagen, R.; Kleinsasser, N. Silver nanoparticles: Evaluation of DNA damage, toxicity and functional impairment in human mesenchymal stem cells. Toxicol. Lett. 2011, 201, 27–33. [Google Scholar] [CrossRef]
- Liu, X.; He, W.; Fang, Z.; Kienzle, A.; Feng, Q. Influence of Silver Nanoparticles on Osteogenic Differentiation of Human Mesenchymal Stem Cells. J. Biomed. Nanotechnol. 2014, 10, 1277–1285. [Google Scholar] [CrossRef]
- Zhang, R.; Lee, P.; Lui, V.C.H.; Chen, Y.; Liu, X.; Lok, C.N.; To, M.; Yeung, K.; Wong, K.K. Silver nanoparticles promote osteogenesis of mesenchymal stem cells and improve bone fracture healing in osteogenesis mechanism mouse model. Nanomed. Nanotechnol. Biol. Med. 2015, 11, 1949–1959. [Google Scholar] [CrossRef] [PubMed]
- Pérez-Díaz, M.A.; Silva-Bermudez, P.; Jiménez-López, B.; Martínez-López, V.; Melgarejo-Ramírez, Y.; Brena-Molina, A.; Ibarra, C.; Baeza, I.; Martínez-Pardo, M.E.; Reyes-Frías, M.L.; et al. Silver-pig skin nanocomposites and mesenchymal stem cells: Suitable antibiofilm cellular dressings for wound healing. J. Nanobiotechnology 2018, 16, 2. [Google Scholar] [CrossRef] [Green Version]
- Patil, S.; Singh, N. Antibacterial silk fibroin scaffolds with green synthesized silver nanoparticles for osteoblast proliferation and human mesenchymal stem cell differentiation. Colloids Surf. B Biointerfaces 2018, 176, 150–155. [Google Scholar] [CrossRef] [PubMed]
- Tian, J.; Wong, K.K.; Ho, C.M.; Lok, C.N.; Yu, W.Y.; Che, C.M.; Cliu, J.F.; Tam, P.K. Topical delivery of silver nanoparticles promotes wound healing. ChemMedChem 2007, 2, 129–136. [Google Scholar] [CrossRef] [PubMed]
- Paterson, T.E.; Shi, R.; Tian, J.; Harrison, C.J.; Mendes, M.D.S.; Hatton, P.V.; Li, Z.; Ortega, I. Electrospun Scaffolds Containing Silver-Doped Hydroxyapatite with Antimicrobial Properties for Applications in Orthopedic and Dental Bone Surgery. J. Funct. Biomater. 2020, 11, 58. [Google Scholar] [CrossRef]
- Mancuso, L.; Cao, G. Acute toxicity test of CuO nanoparticles using human mesenchymal stem cells. Toxicol. Mech. Methods 2014, 24, 449–454. [Google Scholar] [CrossRef]
- Zhang, W.; Jiang, P.; Chen, W.; Zheng, B.; Mao, Z.; Antipov, A.; Correia, M.; Larsen, E.H.; Gao, C. Genotoxicity of Copper Oxide Nanoparticles with Different Surface Chemistry on Rat Bone Marrow Mesenchymal Stem Cells. J. Nanosci. Nanotechnol. 2016, 16, 5489–5497. [Google Scholar] [CrossRef]
- Rodríguez, J.P.; Ríos, S.; González, M. Modulation of the proliferation and differentiation of human mesenchymal stem cells by copper. J. Cell. Biochem. 2002, 85, 92–100. [Google Scholar] [CrossRef]
- Syama, S.; Sreekanth, P.J.; Varma, H.K.; Mohanan, P.V. Zinc oxide nanoparticles induced oxidative stress in mouse bone marrow mesenchymal stem cells. Toxicol. Mech. Methods 2014, 24, 644–653. [Google Scholar] [CrossRef]
- Ickrath, P.; Wagner, M.; Scherzad, A.; Gehrke, T.; Burghartz, M.; Hagen, R.; Radeloff, K.; Kleinsasser, N.; Hackenberg, S. Time-Dependent Toxic and Genotoxic Effects of Zinc Oxide Nanoparticles after Long-Term and Repetitive Exposure to Human Mesenchymal Stem Cells. Int. J. Environ. Res. Public Health 2017, 14, 1590. [Google Scholar] [CrossRef] [Green Version]
- Milne, G.L.; Dai, Q.; Roberts, L.J. The isoprostanes—25 years later. Biochim. Biophys. Acta (BBA)-Mol. Cell Biol. Lipids 2015, 1851, 433–445. [Google Scholar] [CrossRef] [PubMed] [Green Version]
- Šulinskienė, J.; Bernotienė, R.; Baranauskienė, D.; Naginienė, R.; Stanevičienė, I.; Kašauskas, A.; Ivanov, L. Effect of Zinc on the Oxidative Stress Biomarkers in the Brain of Nickel-Treated Mice. Oxidative Med. Cell. Longev. 2019, 2019, 8549727. [Google Scholar] [CrossRef] [PubMed] [Green Version]
- Plesca, D.; Mazumder, S.; Almasan, A. Chapter 6 DNA Damage Response and Apoptosis. In Methods in Enzymology; Elsevier: Amsterdam, The Netherlands, 2008; Volume 446, pp. 107–122. [Google Scholar] [CrossRef] [Green Version]
- Alavi, M.; Nokhodchi, A. An overview on antimicrobial and wound healing properties of ZnO nanobiofilms, hydrogels, and bionanocomposites based on cellulose, chitosan, and alginate polymers. Carbohydr. Polym. 2019, 227, 115349. [Google Scholar] [CrossRef] [PubMed]


| Gene | Forward Primer | Reverse Primer |
|---|---|---|
| Bax | GTGAGCGGCTGCTTGTCT | GGTCCCGAAGTAGGAGAGGA |
| Bcl-2 | AGTACCTGAACCGGCATCTG | GGGGCCATATAGTTCCACAAA |
| GAPDH | AGAACATCATCCCTGCATCC | ACATTGGGGGTAGGAACAC |
| T0 | T4 | T24 | T48 | |||||
|---|---|---|---|---|---|---|---|---|
| Z-Average (d.nm) | SD | Z-Average (d.nm) | SD | Z-Average (d.nm) | SD | Z-Average (d.nm) | SD | |
| Ag NP batch | 187.02 | 16.64 | N/A | N/A | N/A | N/A | N/A | N/A |
| Ag NP 1.5 µg/mL (DMEM + 10% FBS) | 86.45 | 55.57 | 93.99 | 45.77 | 64.30 | 36.63 | 61.24 | 53.07 |
| Ag NP 3.125 µg/mL (DMEM + 10% FBS) | 115.94 | 37.37 | 122.20 | 18.28 | 111.87 | 47.83 | 101.14 | 34.47 |
| Ag NP 6.25 µg/mL (DMEM + 10% FBS) | 147.07 | 22.22 | 166.60 | 16.01 | 176.28 | 32.43 | 252.58 | 33.61 |
| T0 | T4 | T24 | T48 | |||||
| PDI | SD | PDI | SD | PDI | SD | PDI | SD | |
| Ag NP batch | 0.47 | 0.06 | N/A | N/A | N/A | N/A | N/A | N/A |
| Ag NP 1.5 µg/mL (DMEM + 10% FBS) | 0.66 | 0.23 | 0.60 | 0.18 | 0.64 | 0.17 | 0.63 | 0.15 |
| Ag NP 3.125 µg/mL (DMEM + 10% FBS) | 0.60 | 0.16 | 0.71 | 0.11 | 0.70 | 0.16 | 0.70 | 0.15 |
| Ag NP 6.25 µg/mL (DMEM + 10% FBS) | 0.61 | 0.14 | 0.64 | 0.10 | 0.59 | 0.17 | 0.69 | 0.17 |
| T0 | T4 | T24 | T48 | |||||
|---|---|---|---|---|---|---|---|---|
| Z-Average (d.nm) | SD | Z-Average (d.nm) | SD | Z-Average (d.nm) | SD | Z-Average (d.nm) | SD | |
| ZnO NP batch | 329.11 | 41.50 | N/A | N/A | N/A | N/A | N/A | N/A |
| ZnO NP 0.75 µg/mL (DMEM + 10% FBS) | 20.36 | 0.32 | 19.80 | 0.18 | 18.10 | 0.34 | 15.87 | 0.18 |
| ZnO NP 1.5 µg/mL (DMEM + 10% FBS) | 23.40 | 1.11 | 20.26 | 0.47 | 17.73 | 0.53 | 15.81 | 0.40 |
| ZnO NP 3.125 µg/mL (DMEM + 10% FBS) | 20.72 | 0.53 | 20.71 | 0.48 | 17.89 | 0.43 | 15.86 | 0.31 |
| T0 | T4 | T24 | T48 | |||||
| PDI | SD | PDI | SD | PDI | SD | PDI | SD | |
| ZnO NP batch | 0.12 | 0.03 | N/A | N/A | N/A | N/A | N/A | N/A |
| ZnO NP 0.75 µg/mL (DMEM + 10% FBS) | 0.52 | 0.01 | 0.50 | 0.00 | 0.47 | 0.02 | 0.45 | 0.01 |
| ZnO NP 1.5 µg/mL (DMEM + 10% FBS) | 0.51 | 0.04 | 0.50 | 0.02 | 0.48 | 0.01 | 0.44 | 0.02 |
| ZnO NP 3.125 µg/mL (DMEM + 10% FBS) | 0.51 | 0.01 | 0.51 | 0.03 | 0.48 | 0.02 | 0.44 | 0.01 |
| T0 | T4 | T24 | T48 | |||||
|---|---|---|---|---|---|---|---|---|
| Z-Average (d.nm) | SD | Z-Average (d.nm) | SD | Z-Average (d.nm) | SD | Z-Average (d.nm) | SD | |
| CuO NP batch | 340.99 | 5.21 | N/A | N/A | N/A | N/A | N/A | N/A |
| CuO NP 0.2 µg/mL (DMEM + 10% FBS) | 26.76 | 7.62 | 22.91 | 0.58 | 19.40 | 0.38 | 17.88 | 0.42 |
| CuO NP 0.3 µg/mL (DMEM + 10% FBS) | 48.27 | 4.76 | 24.32 | 0.97 | 19.79 | 0.30 | 18.58 | 0.16 |
| CuO NP 0.4 µg/mL (DMEM + 10% FBS) | 36.01 | 15.45 | 27.92 | 6.39 | 26.47 | 3.16 | 18.56 | 0.37 |
| T0 | T4 | T24 | T48 | |||||
| PDI | SD | PDI | SD | PDI | SD | PDI | SD | |
| CuO NP batch | 0.22 | 0.02 | N/A | N/A | N/A | N/A | N/A | N/A |
| CuO NP 0.2 µg/mL (DMEM + 10% FBS) | 0.58 | 0.14 | 0.61 | 0.08 | 0.50 | 0.01 | 0.48 | 0.02 |
| CuO NP 0.3 µg/mL (DMEM + 10% FBS) | 0.66 | 0.10 | 0.71 | 0.02 | 0.51 | 0.03 | 0.48 | 0.00 |
| CuO NP 0.4 µg/mL (DMEM + 10% FBS) | 0.69 | 0.26 | 0.71 | 0.15 | 0.77 | 0.04 | 0.48 | 0.01 |
Disclaimer/Publisher’s Note: The statements, opinions and data contained in all publications are solely those of the individual author(s) and contributor(s) and not of MDPI and/or the editor(s). MDPI and/or the editor(s) disclaim responsibility for any injury to people or property resulting from any ideas, methods, instructions or products referred to in the content. |
© 2023 by the authors. Licensee MDPI, Basel, Switzerland. This article is an open access article distributed under the terms and conditions of the Creative Commons Attribution (CC BY) license (https://creativecommons.org/licenses/by/4.0/).
Share and Cite
Rossner, P., Jr.; Cervena, T.; Echalar, B.; Palacka, K.; Milcova, A.; Novakova, Z.; Sima, M.; Simova, Z.; Vankova, J.; Holan, V. Metal Nanoparticles with Antimicrobial Properties: The Toxicity Response in Mouse Mesenchymal Stem Cells. Toxics 2023, 11, 253. https://doi.org/10.3390/toxics11030253
Rossner P Jr., Cervena T, Echalar B, Palacka K, Milcova A, Novakova Z, Sima M, Simova Z, Vankova J, Holan V. Metal Nanoparticles with Antimicrobial Properties: The Toxicity Response in Mouse Mesenchymal Stem Cells. Toxics. 2023; 11(3):253. https://doi.org/10.3390/toxics11030253
Chicago/Turabian StyleRossner, Pavel, Jr., Tereza Cervena, Barbora Echalar, Katerina Palacka, Alena Milcova, Zuzana Novakova, Michal Sima, Zuzana Simova, Jolana Vankova, and Vladimir Holan. 2023. "Metal Nanoparticles with Antimicrobial Properties: The Toxicity Response in Mouse Mesenchymal Stem Cells" Toxics 11, no. 3: 253. https://doi.org/10.3390/toxics11030253