Article

One-Dimensional Photonic Crystals with Different Termination Layer Thicknesses and Very Narrow Bloch Surface Wave and Guided Wave Based Resonances for Sensing Applications

1
Institute of Scientific Instruments of the Czech Academy of Sciences, Kralovopolska 147, 612 64 Brno, Czech Republic
2
Department of Physics, Technical University Ostrava, 17. Listopadu 2172/15, 708 00 Ostrava-Poruba, Czech Republic
*
Authors to whom correspondence should be addressed.
Photonics 2022, 9(8), 561; https://doi.org/10.3390/photonics9080561
Submission received: 4 July 2022 / Revised: 6 August 2022 / Accepted: 8 August 2022 / Published: 10 August 2022
(This article belongs to the Special Issue Photonic Crystals: Physics and Devices)

Abstract

:
We demonstrate an efficient sensing of both gaseous and aqueous analytes utilizing Bloch surface waves (BSWs) and guided waves (GWs) excited on a truncated one-dimensional photonic crystal (1DPhC) composed of six TiO 2 /SiO 2 bilayers with a termination layer of TiO 2 . For the gaseous analytes, we show that 1DPhC can support the GW excited by an s-polarized wave and the theoretical shift of the resonance wavelength is linear for small changes in the analyte refractive index (RI), giving a constant RI sensitivity of 87 nm per RI unit (RIU). In addition, for the aqueous analytes, the GW excited by s-polarized and BSW by p-polarized waves can be resolved and exploited for sensing applications. We compare two designed and realized 1DPhCs with termination layer thicknesses of 60 nm and 50 nm, respectively, and show experimentally the differences in their very narrow reflectance and phase responses. An RI sensitivity and figure of merit as high as 544.3 nm/RIU and 303 RIU 1 , respectively, are obtained for the smaller thickness when both s- and p-polarized BSWs are excited. This is the first demonstration of both very deep BSW-based resonances in two orthogonal polarizations and a very narrow resonance in one of them.

1. Introduction

One-dimensional photonic crystals (1DPhCs) are structures with a periodic modulation of refractive index (RI) in one spatial dimension. There is an analogy between the propagation of photons in a 1DPhC and the propagation of electrons in a periodic potential of a crystal lattice, and so the concept of band gaps can be adopted [1]. The photonic band gap determines the range of wavelengths of light that cannot propagate through the infinite 1DPhC. In practice, only the truncated 1DPhC can be prepared, which can be represented by a multilayer dielectric structure (MDS), referred to as a Bragg reflector. Within the range of wavelengths corresponding to the photonic band gap, the Bragg reflectors are highly reflective, but they can also guide waves on their surface—the Bloch surface waves (BSWs).
For the excitation of the BSWs, a coupling device has to be used to fulfill the phase-matching condition since the tangential component of the wave vector of the BSWs lies beyond a free space light line. A common way is to use the total internal reflection in a glass prism in the Kretschmann configuration that is widely used to excite the surface plasmon resonance (SPR) [2]. The BSWs show up as a dip in the reflectance spectrum, similar to the SPR, and they also can be exploited in sensing applications. However, contrary to the SPR, narrower resonance dips are related to the BSW since the MDS is composed of low-loss dielectrics, and both s- and p-polarized waves can be used for the BSW excitation. Moreover, the photonic band gap position and width depend on the MDS geometry and materials, and thus can be varied by the fabrication of the MDS so that ultra-large omnidirectional photonic band gaps are possible [3]. The sensors based on the BSWs often use not only a wavelength [4,5,6,7,8,9,10,11], but also angular [5,11,12,13,14] interrogations. Importantly, sensors utilizing a phase detection have also been demonstrated [15,16,17,18].
In this paper, we demonstrate an efficient sensing of both gaseous and aqueous analytes utilizing a MDS composed of 6 TiO 2 /SiO 2 bilayers with a termination layer of TiO 2 . For the gaseous analyte, we show that the proposed structure can support a guided wave (GW) excited by an s-polarized wave. The GW is accompanied by a reflectance minimum (a dip), which theoretically shifts linearly with small changes in the analyte RI. For the designed and realized 1DPhC and aqueous analytes, the BSWs excited by both s and p-polarized waves can be resolved and utilized for sensing applications. We study the effect of the termination layer thickness on the sensor response by a direct comparison of two MDSs differing only by the termination layer thicknesses. The sensor performance is evaluated in terms of the RI sensitivity and also figure of merit (FOM). We show that the MDS with a termination layer thickness of 50 nm shows both higher sensitivity and FOM than the MDS with a termination layer thickness of 60 nm. In addition, one of the MDSs demonstrates for the first time not only very deep BSW-based resonances in two orthogonal polarizations, but also a very narrow resonance in a single polarization.

2. Materials and Methods

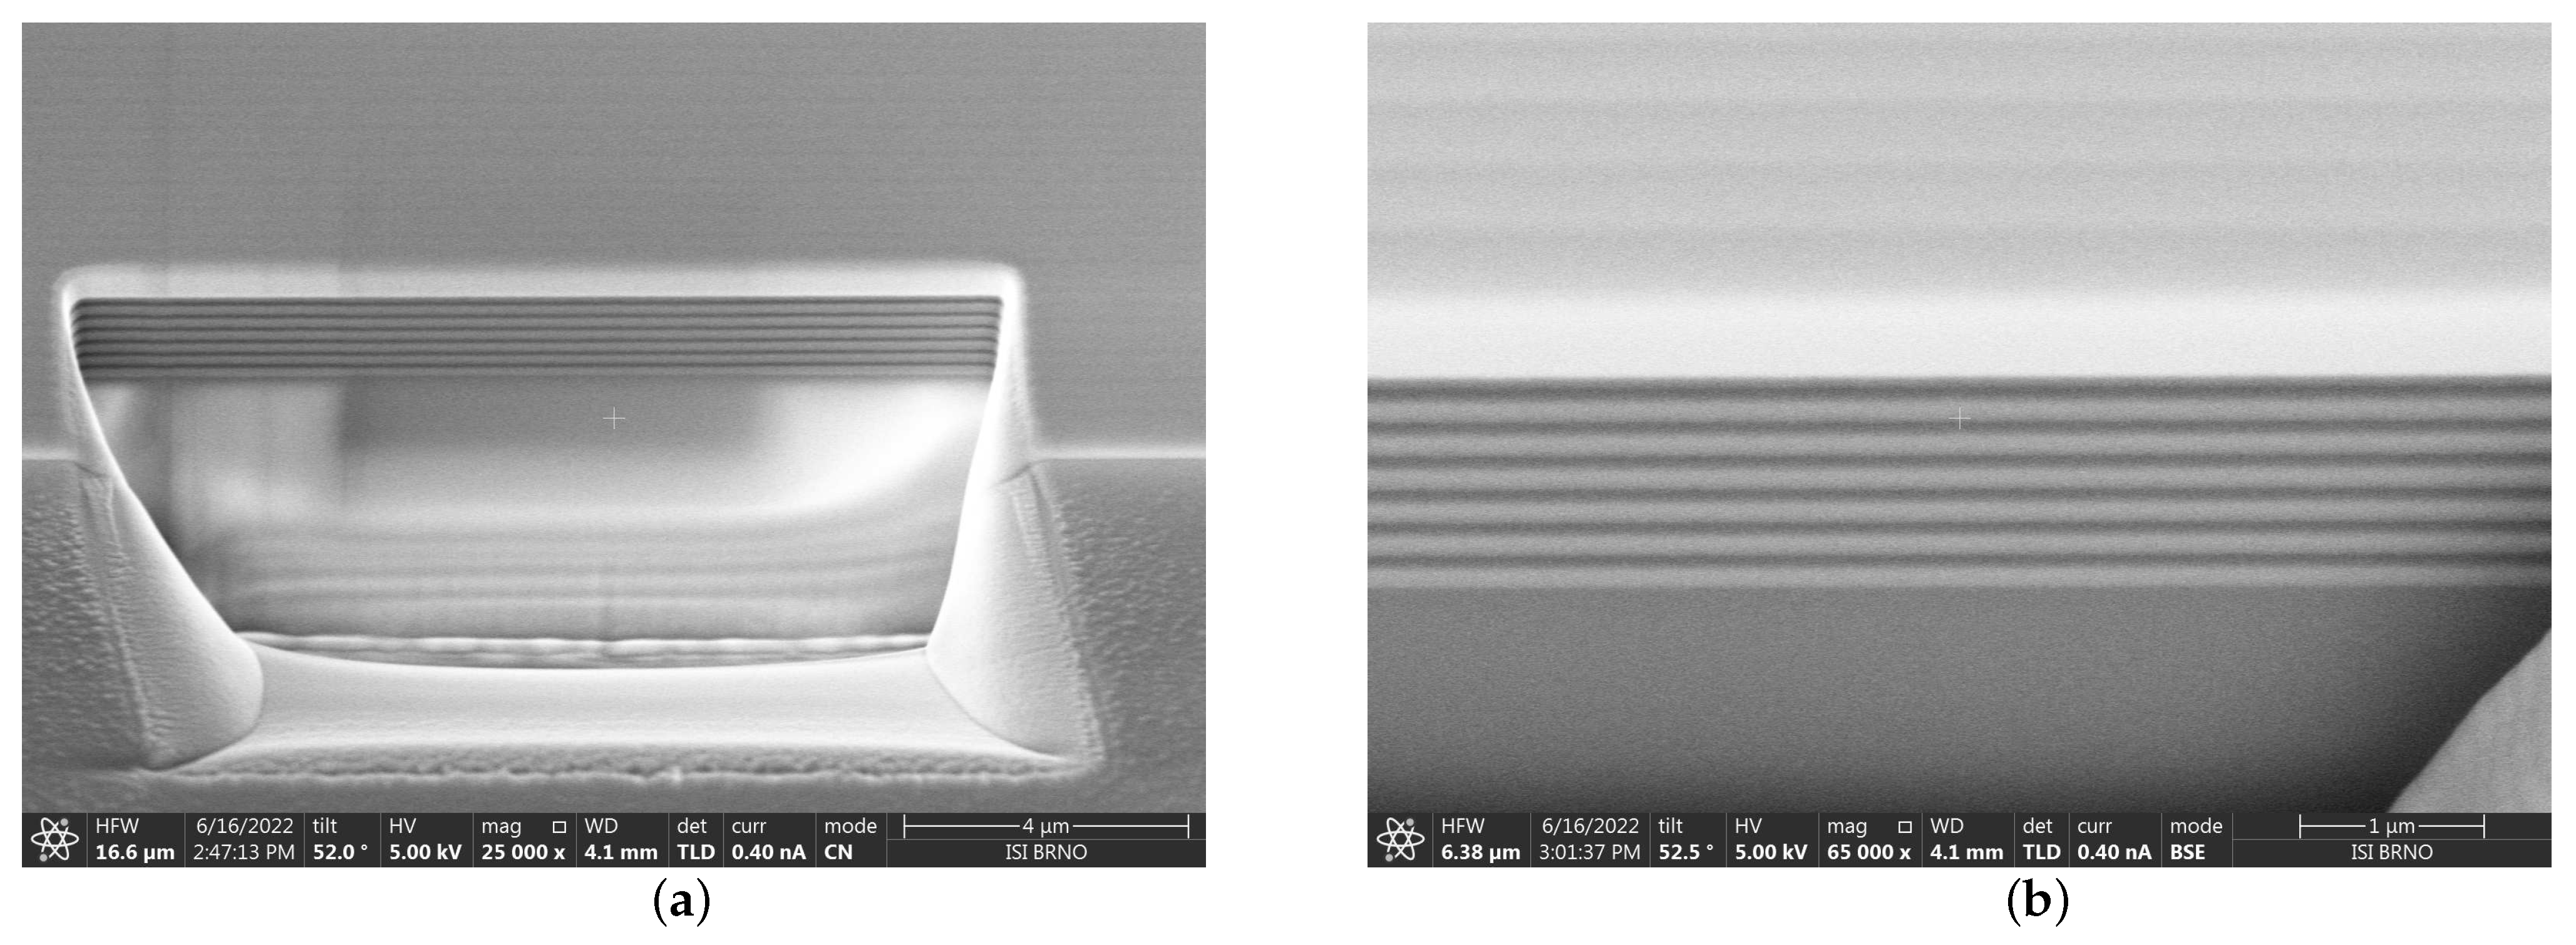
2.1. Structures under Study

A truncated 1DPhC can be represented by a stack of alternating dielectric layers. For the purpose of this study, two MDSs were prepared, each composed of six TiO 2 /SiO 2 bilayers with a termination layer of TiO 2 . The 1DPhC was inspected by a scanning electron microscope (DualBeam FIB-SEM Helios G4, Thermo Fisher Scientific, Waltham, MA, USA) with images shown in Figure 1. The MDSs differ only in the thickness of the termination layer, which is 60 nm in the first case (MDS 60 ) and 50 nm in the second case (MDS 50 ). The thicknesses of all other TiO 2 and SiO 2 layers are t TiO 2 = 100 nm and t SiO 2 = 85 nm, respectively, giving the spatial period Λ = t TiO 2 + t SiO 2 = 185 nm. Both MDSs were prepared on a glass substrate by a method of electron beam evaporation; the process is described in detail elsewhere [19].

2.2. Experiment

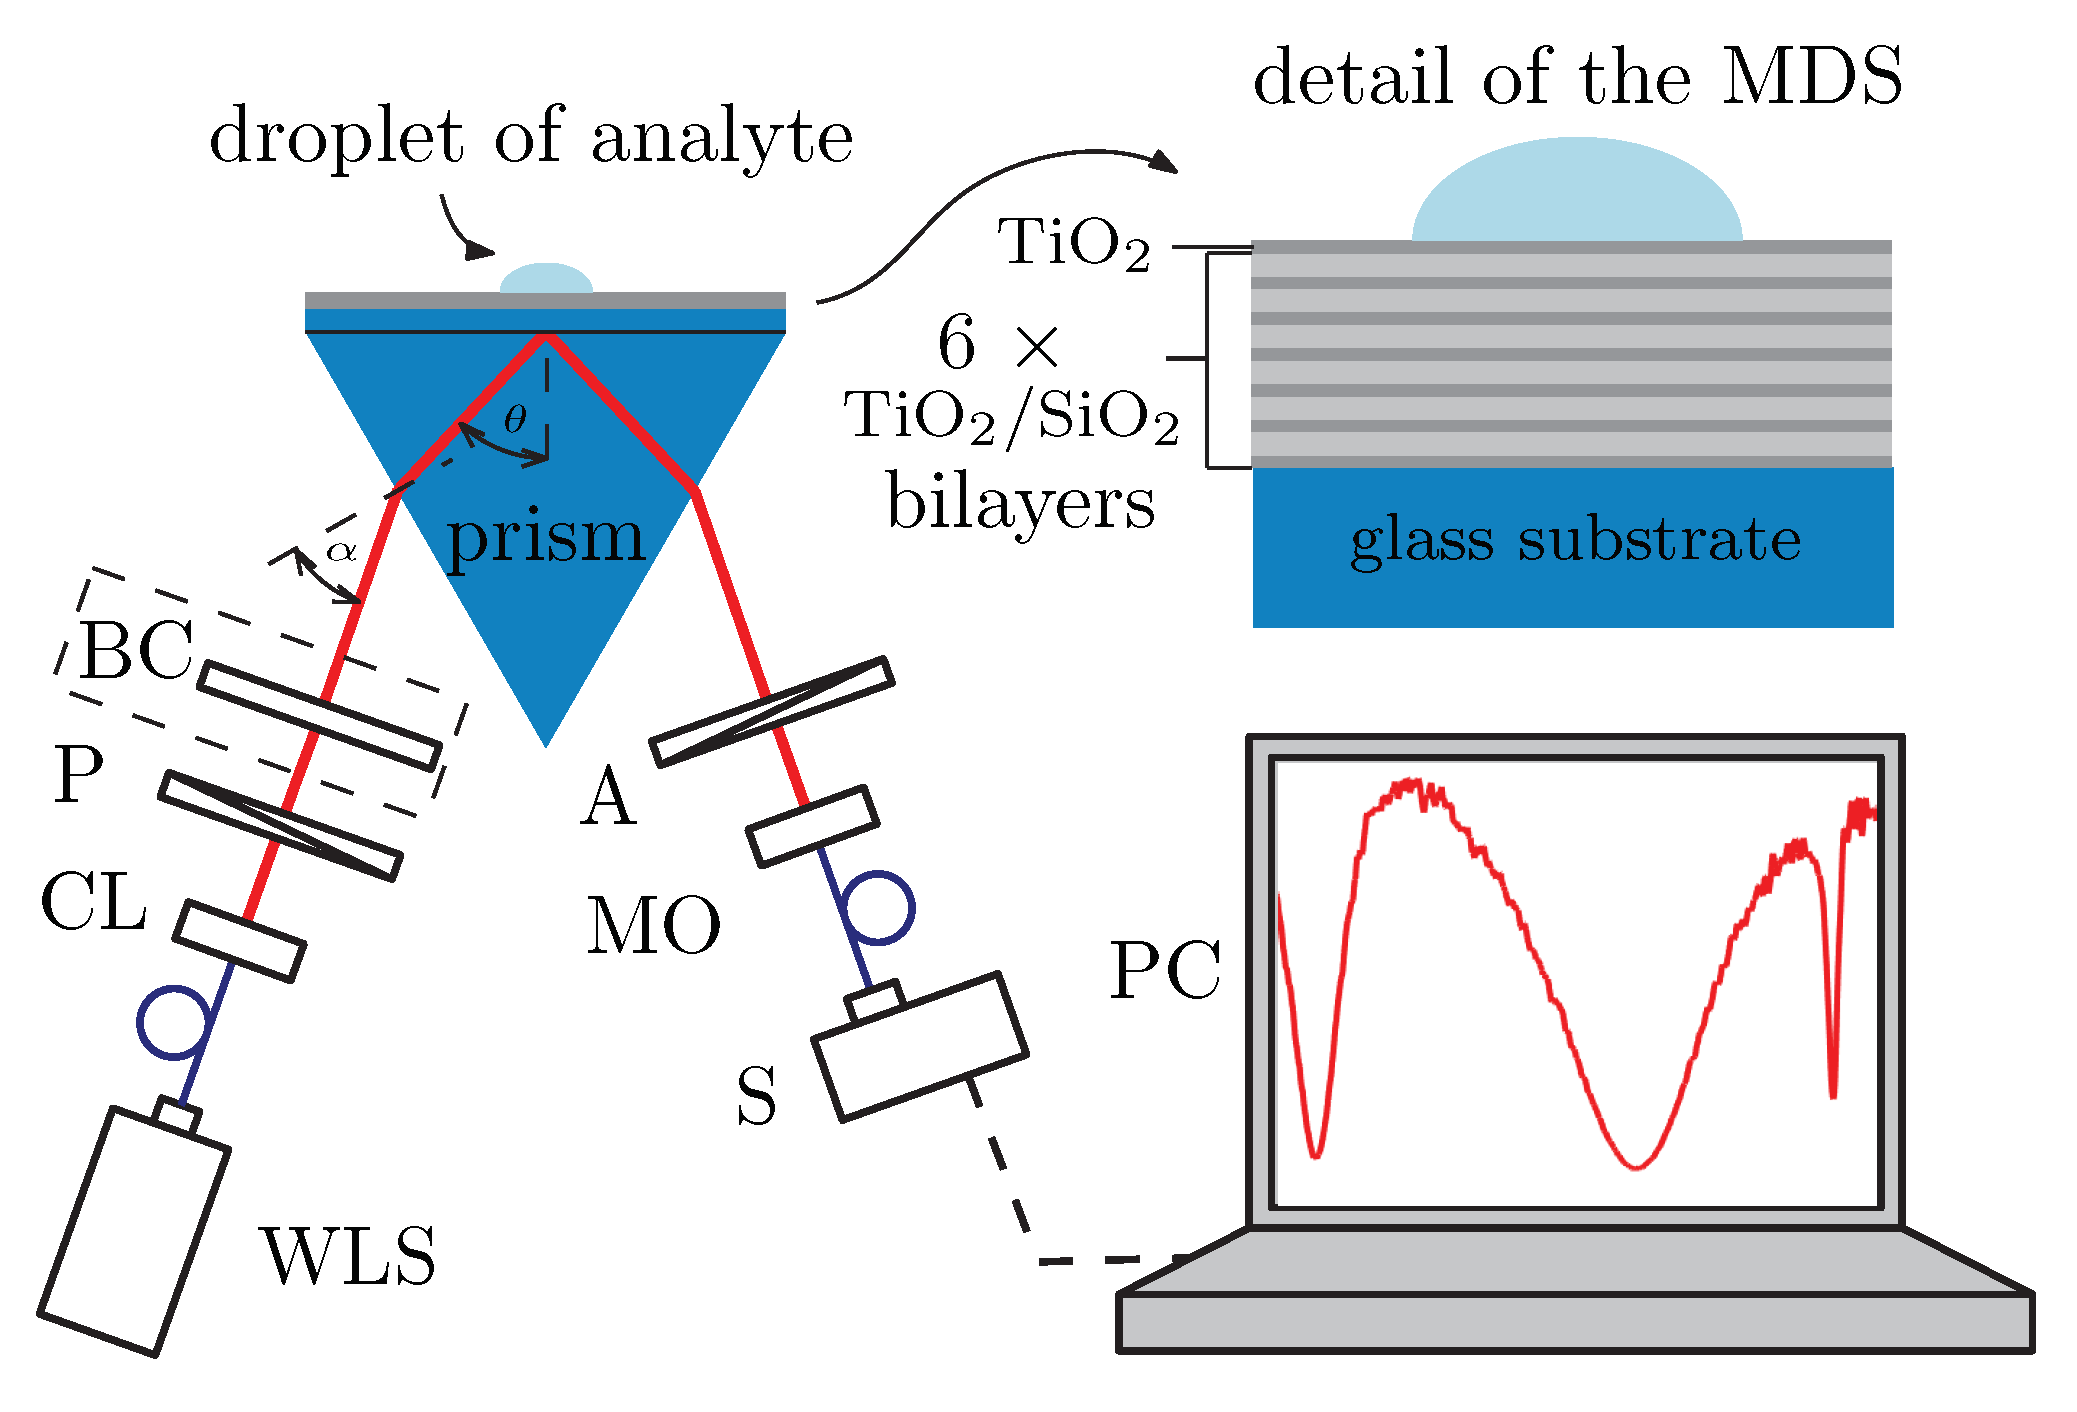
2.2.1. Experimental Setup

We performed two kinds of experiments with the prepared MDSs. First, we measured interference reflectance R 45 ( λ ) in the experimental setup shown in Figure 2. During the measurements, one of the MDSs on the glass substrate was attached to a BK7 glass prism (Ealing, Inc., Scotts Valley, CA, USA) using index matching oil (Cargille, n D = 1.516). Using a white light source (halogen lamp HL-2000, Ocean Optics, Orlando, FL, USA), a light beam was generated and then coupled into an optical fiber and transmitted to a collimating lens. The collimated beam then passed through a linear polarizer (LPVIS050, Thorlabs, Newton, NJ, USA) oriented by the angle γ P = 45 ° with respect to the plane of incidence and reached the air/prism interface at outer angle of incidence α . The inner angle of incidence θ is given by relation θ ( λ ) = 60 ° sin 1 [ sin α / n B K 7 ( λ ) ] , where n B K 7 ( λ ) is the wavelength-dependent RI of the glass prism. After reflection from the MDS, the beam passed through a linear analyzer (LPVIS050, Thorlabs, Newton, NJ, USA) oriented by the angle γ A = ± 45 ° with respect to the plane of incidence and it was coupled to a read optical fiber (M15L02, Thorlabs, Newton, NJ, USA) by a microscope objective. As a detector, a compact spectrometer (USB4000, Ocean Optics, Orlando, FL, USA) was used.
A recorded interference spectrum then followed the equation [9]
R ± 45 ( λ ) = 1 4 { R s ( λ ) + R p ( λ ) + 2 R s ( λ ) R p ( λ ) cos [ Δ ( λ ) + δ ± ] } ,
where R s ( λ ) and R p ( λ ) are the spectral reflectances of s- and p-polarized light waves, respectively, Δ ( λ ) is a phase change between them due to the BSW or GW excitation, and δ ± is a phase term related to the orientation of the analyzer ( δ + = 0 for γ A = 45 ° and δ = π for γ A = 45 ° ). This technique exploits the phase properties of BSWs and GWs to pronounce the related reflectance dips. All measured spectra were normalized with respect to the reflectance R p ( λ ) measured for air.
Second, we measured an optical phase shift ϕ ( λ ) using a spectral interferometric technique. In the measurement, a birefringence quartz prism of thickness 6 mm was included in the experimental setup, which caused an additional phase difference Δ B C ( λ ) between s- and p-polarized waves. As a result, a spectral interferogram (a channeled spectrum) consisting of fringes could be resolved. Two such interferograms were recorded to determine the phase shift ϕ ( λ ) . One for the case when the BSW or GW was generated, given by the overall phase Φ ( λ ) = Δ B C ( λ ) + Δ ( λ ) , including the phase contributions of both the birefringence crystal and BSW or GW, and second for the case when the waves were not generated, given by Φ R ( λ ) = Δ B C ( λ ) + Δ R ( λ ) , where Δ R ( λ ) is a reference phase term. The reference interferogram was obtained in the setup, not including the MDS. Both interferograms were processed by a windowed Fourier transform [18] to obtain the overall phases Φ ( λ ) and Φ R ( λ ) , and then the phase shift ϕ ( λ ) = Φ ( λ ) Φ R ( λ ) was calculated.

2.2.2. Analytes

We performed measurement for room air (temperature t = 22 °C, relative humidity RH = 30 % ) to show a possibility of the sensing of low RI analytes. The effect of temperature changes is not considered, even if it is interesting from the point of view of the thermal stability of the sensor [20,21]. Next, we prepared six aqueous solutions of NaCl with various RIs n D in a range of 1.3331–1.3599, corresponding to NaCl concentration ranging from 0 weight percents (wt%) to approximately 10 wt%. The RI was measured with refractometer AR200 (Reichert, New York, NY, USA) at sodium D line ( λ D = 589 nm) at the room temperature.

2.3. Theoretical Analysis

Measurements are accompanied by the theoretical analysis. The reflectance was calculated by a transfer matrix method (TMM) [22], and we included the following dispersion relation for TiO 2 and SiO 2 layers [19]
n 2 ( λ ) = A + B λ 2 λ 2 C 2 ,
where A, B and C are constants with values A = 2.7655 , B = 2.2 , C = 0.26524 μ m and A = 1.34836 , B = 0.756 , C = 0.10683 μ m for TiO 2 and SiO 2 , respectively, and λ is wavelength in μ m. Approximate extinction coefficients of TiO 2 and SiO 2 , k T i O 2 = 0.0016 and k S i O 2 = 0.00034 were included in the calculations.
Dispersion of the water is expressed by the Sellmeier formula [23]
n w 2 ( λ ) = 1 + n = 1 4 D i λ 2 λ 2 E i ,
where D i and λ i are constants with values D 1 = 5.684027565 × 10 1 , D 2 = 1.726177391 × 10 1 , D 3 = 2.086189578 × 10 2 , D 4 = 1.130748688 × 10 1 , E 1 = 5.101829712 × 10 3 μ m 2 , E 2 = 1.821153936 × 10 2 μ m 2 , E 3 = 2.620722293 × 10 2 μ m 2 and E 4 = 1.069792721 × 10 2 μ m 2 (valid for temperature of 20°).
Both the substrate and the prism are made of BK7 glass, and its dispersion is described by the Sellmeier formula [24]
n BK 7 2 ( λ ) = 1 + n = 1 3 F i λ 2 λ 2 G i ,
where E i and λ i are constants with values F 1 = 1.03961212 , F 2 = 0.231792344 , F 3 = 1.01046945 , G 1 = 6.00069867 × 10 3 μ m 2 , G 2 = 2.00179144 × 10 2 μ m 2 , G 3 = 1.03560653 × 10 2 μ m 2 . Finally, we used the RI of air n a i r = 1 .

3. Results

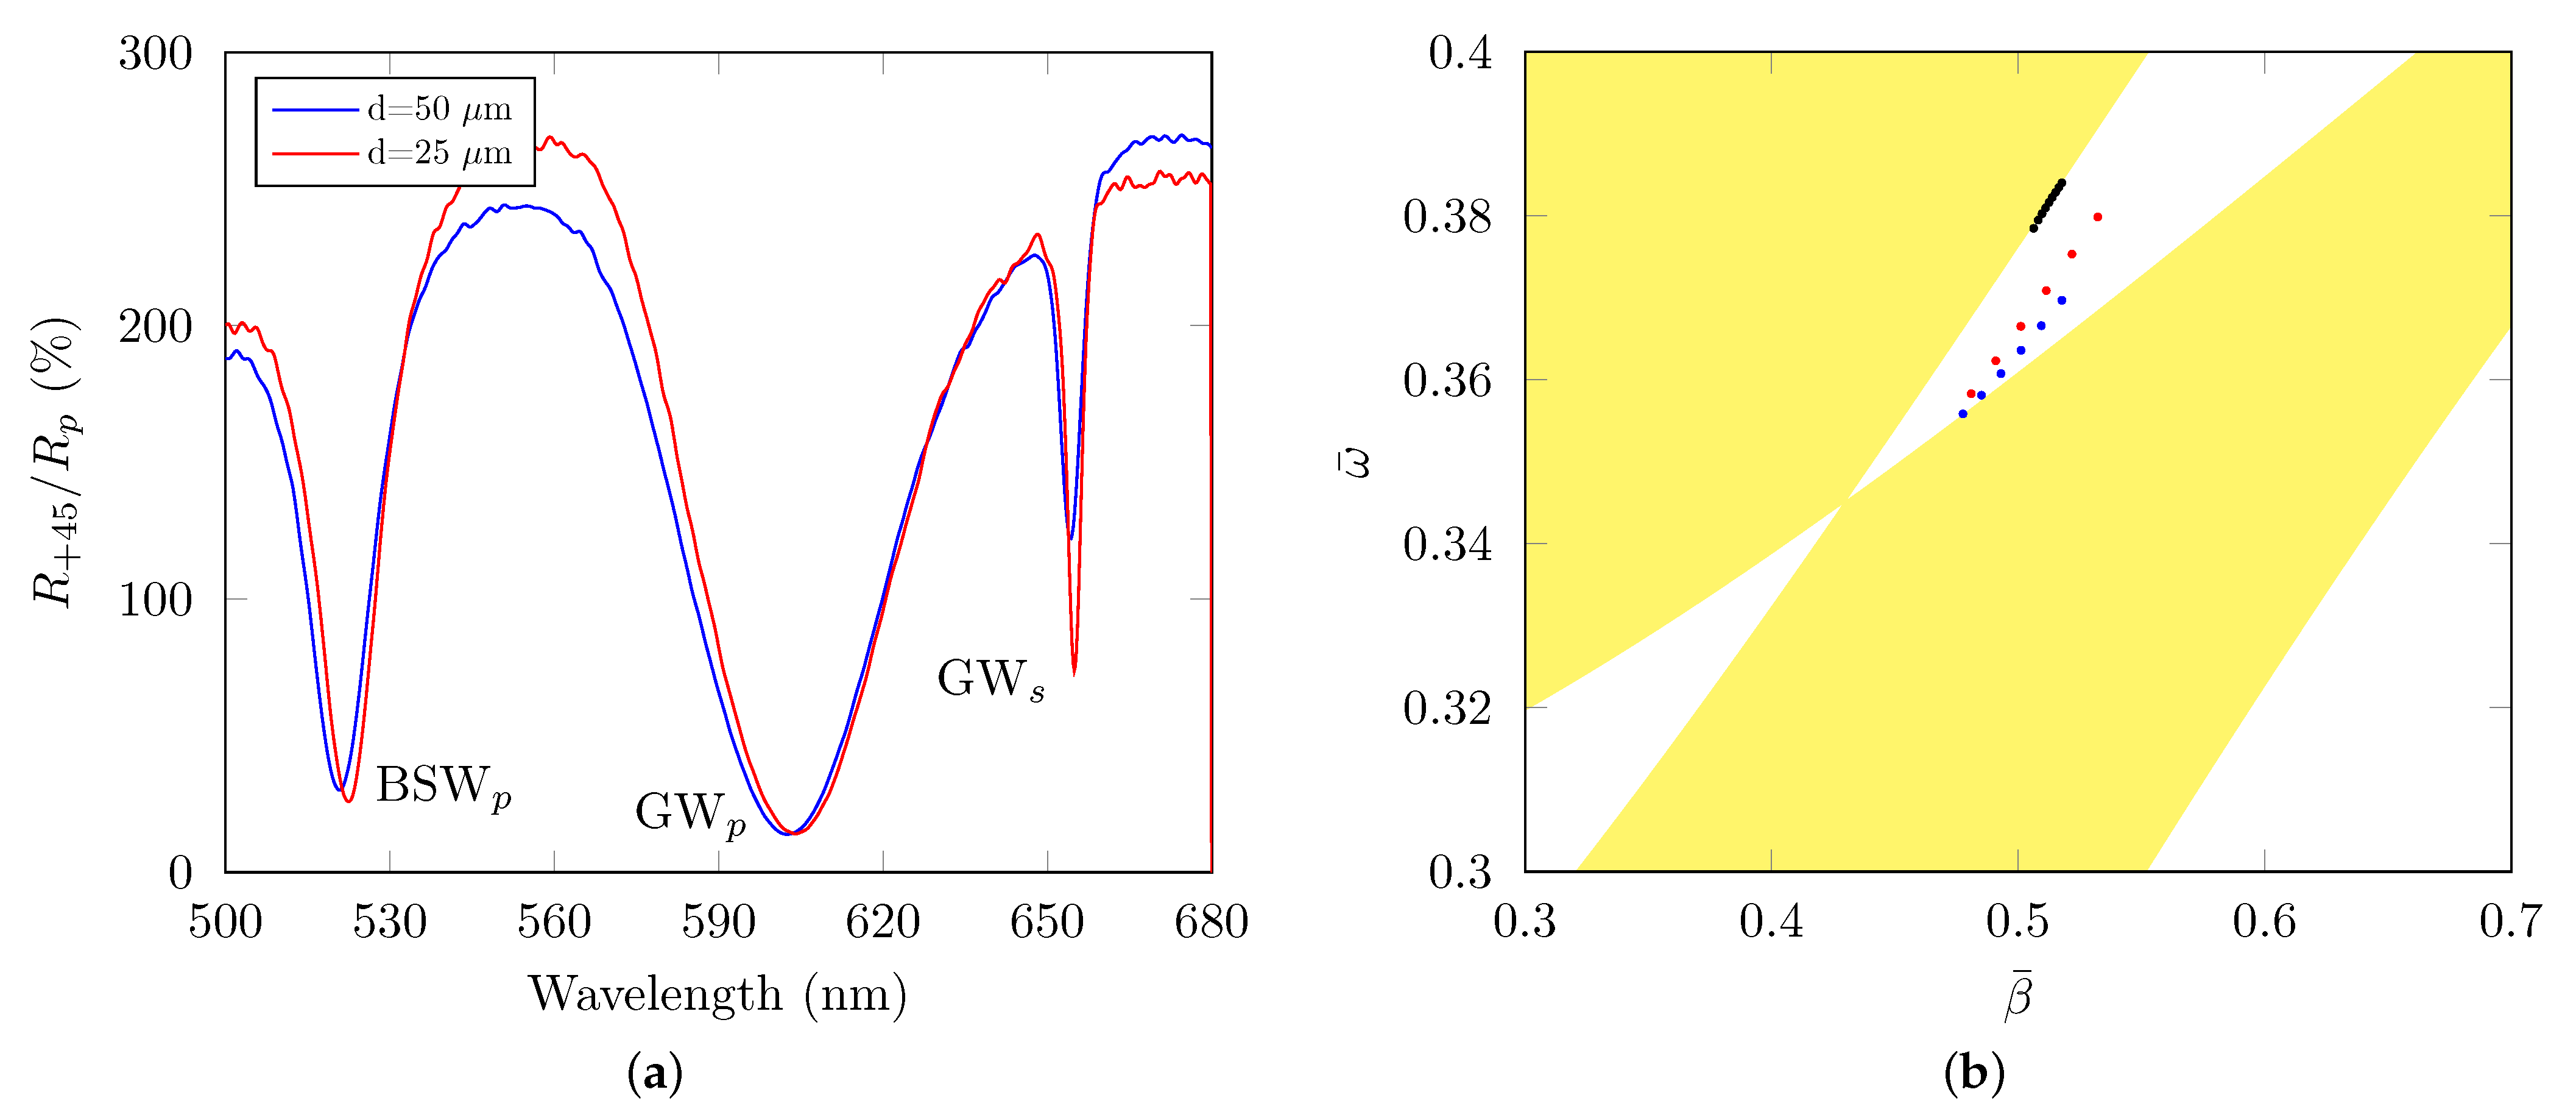
3.1. Reflectances for Air and Water

First, we measured the reflectance ratio R 45 ( λ ) / R p ( λ ) for the MDS 60 , as shown in Figure 3a by the dashed line. In the same figure, we also show the theoretical reflectance ratio for different analyte RIs in a range of 1–1.01 and for the angle of incidence θ = 45.5 ° , when the reflectances R s ( λ ) and R p ( λ ) and the phase difference Δ ( λ ) are calculated using the transfer matrix method [18].
Analyzing the theoretical results, both reflectance minima correspond to the guided waves. The narrow one at a wavelength of around 725 nm shifts linearly with the RI and is excited by an s-polarized wave. We support this by a band structure of an infinite 1DPhC composed of TiO 2 /SiO 2 bilayers shown in Figure 3b. The band structure determination is based on solving an eigenvalue problem [1], giving the dependence of the angular frequency ω on the propagation constant β . We use the reduced quantities ω ¯ = ω c Λ 2 π and β ¯ = β Λ 2 π and included the dispersion relations and thicknesses of the thin layers specified in the previous section. The yellow regions represent the allowed bands of frequencies, while the white regions represent the photonic band gaps. The black dots located out of the photonic band gap denote the position of the reflectance dips determined for an angle of incidence θ ranging from 43 to 48°, thus confirming that the appropriate wave is the GW. The dip positions are obtained for a structure containing 100 bilayers of TiO 2 /SiO 2 and including no termination layer. Moreover, we compute an optical field distribution [22] within the MDS 60 , and it is shown in Figure 4a. The field intensity grows with distance from the substrate and it has its maximum value near the MDS/analyte interface. The shape of the field envelope in the crystal, which differs from the exponential one, is due to the GW [25].
By tracing the dip positions (the resonance wavelengths), we obtain a linear dependence on the RI, as shown in Figure 4b. The sensor response can be characterized in terms of the RI sensitivity defined as
S n = δ λ R δ n ,
where δ λ R is change in the resonance wavelength and δ n is change in the RI of the analyte. In this case, a constant value of 87 nm per RI unit (RIU) is reached. Next, we introduce figure of merit ( FOM ), which is a parameter that takes into account also a width of the resonance dip and is defined as
FOM = D S n FWHM ,
where FWHM is full width at half maximum of the resonance dip and D is its depth. In this case, for FWHM = 5.3 nm and D = 0.96 , FOM has a value of 15.7 RIU 1 .

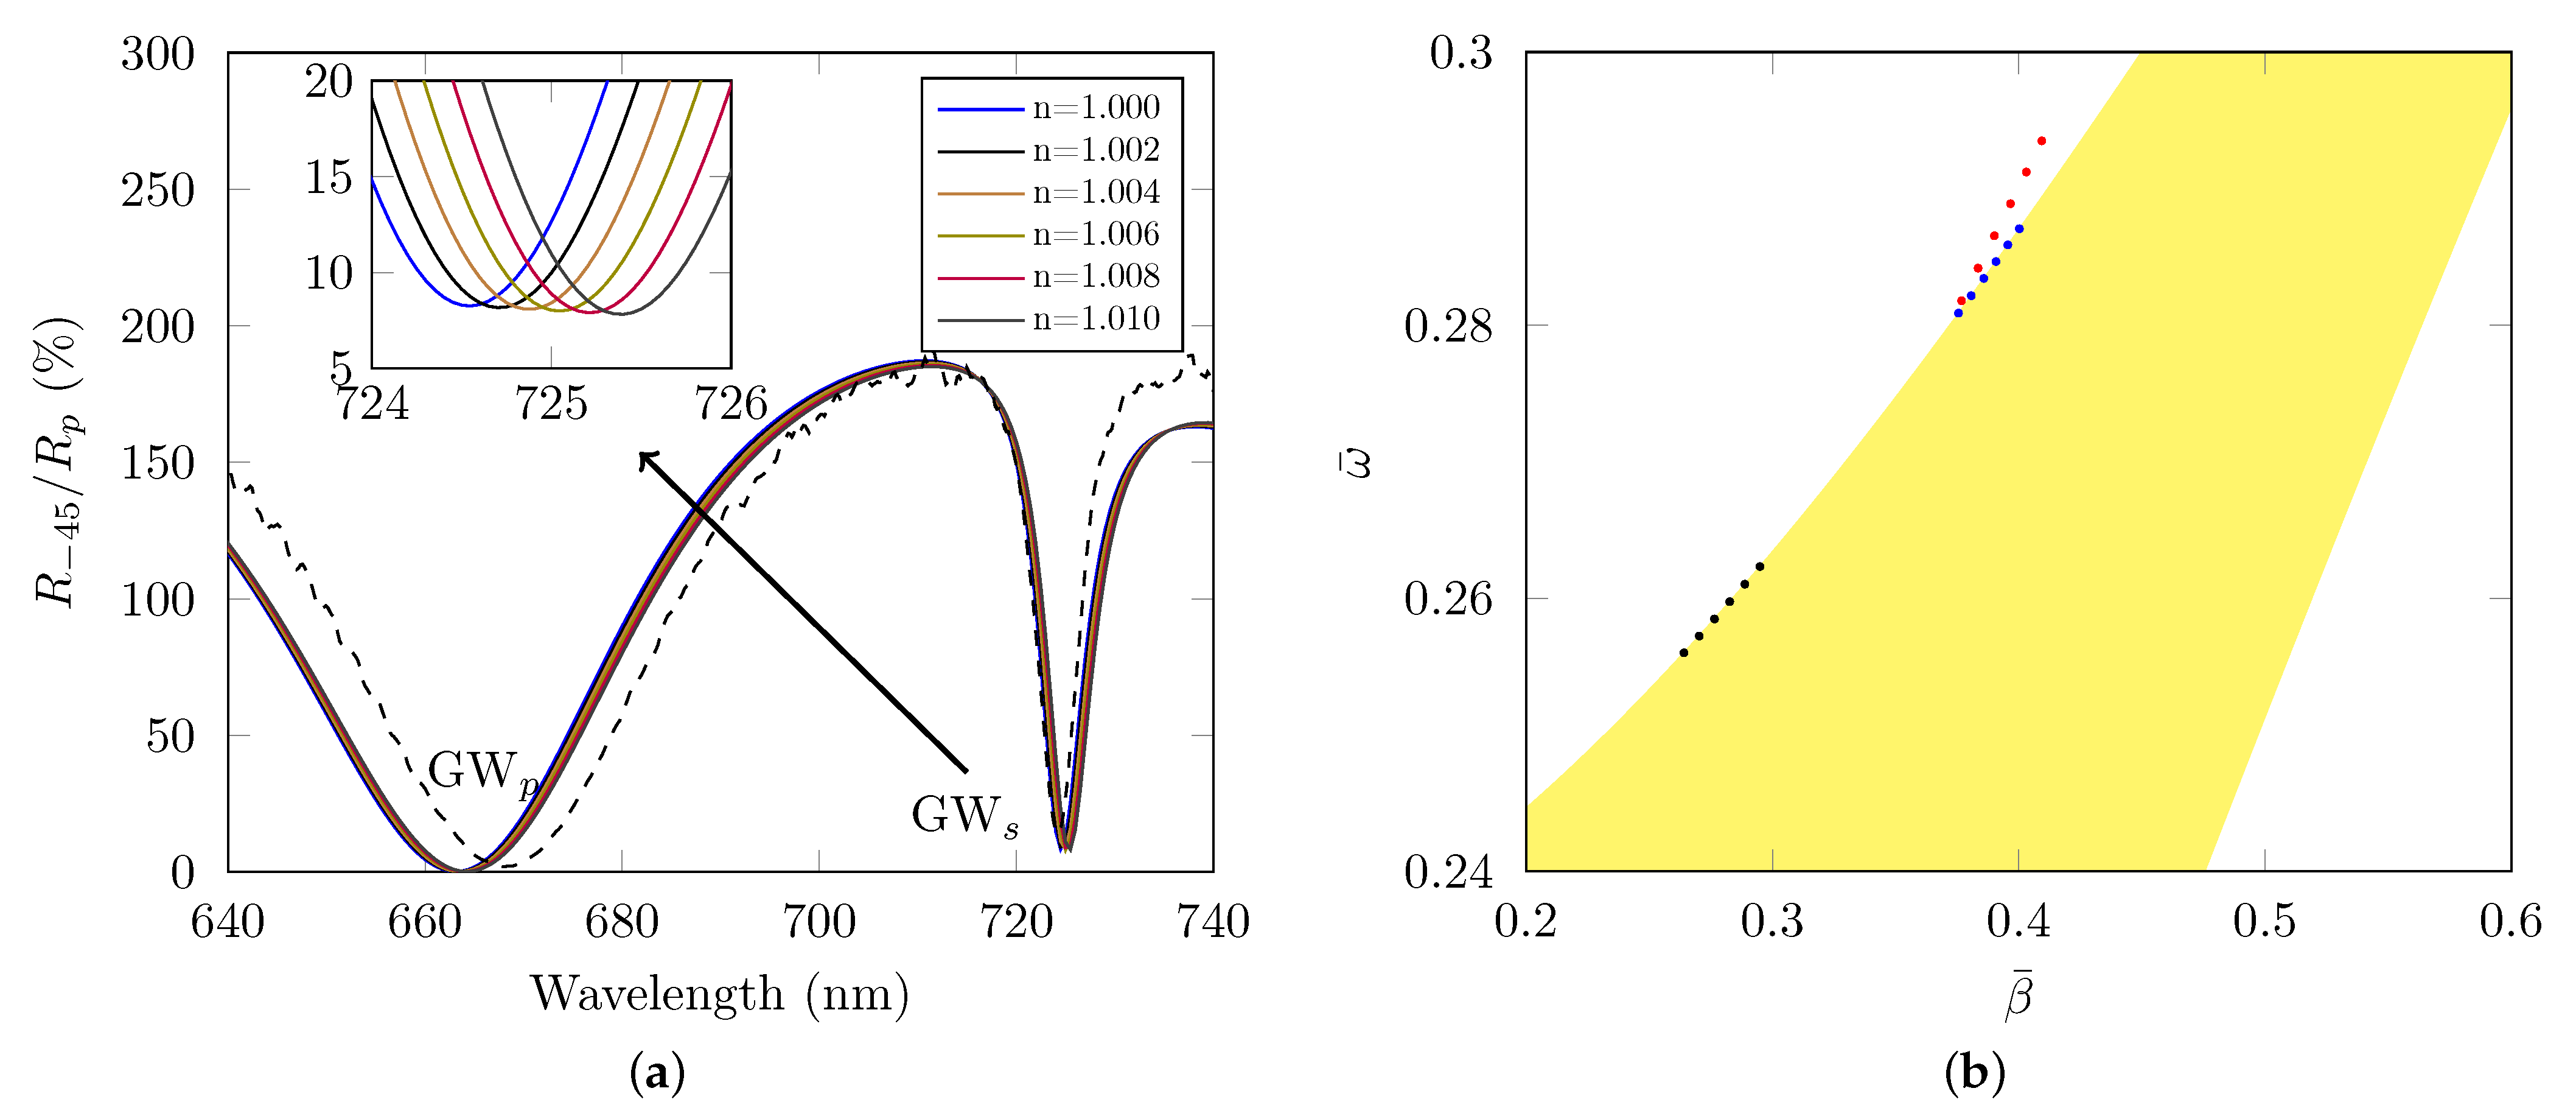
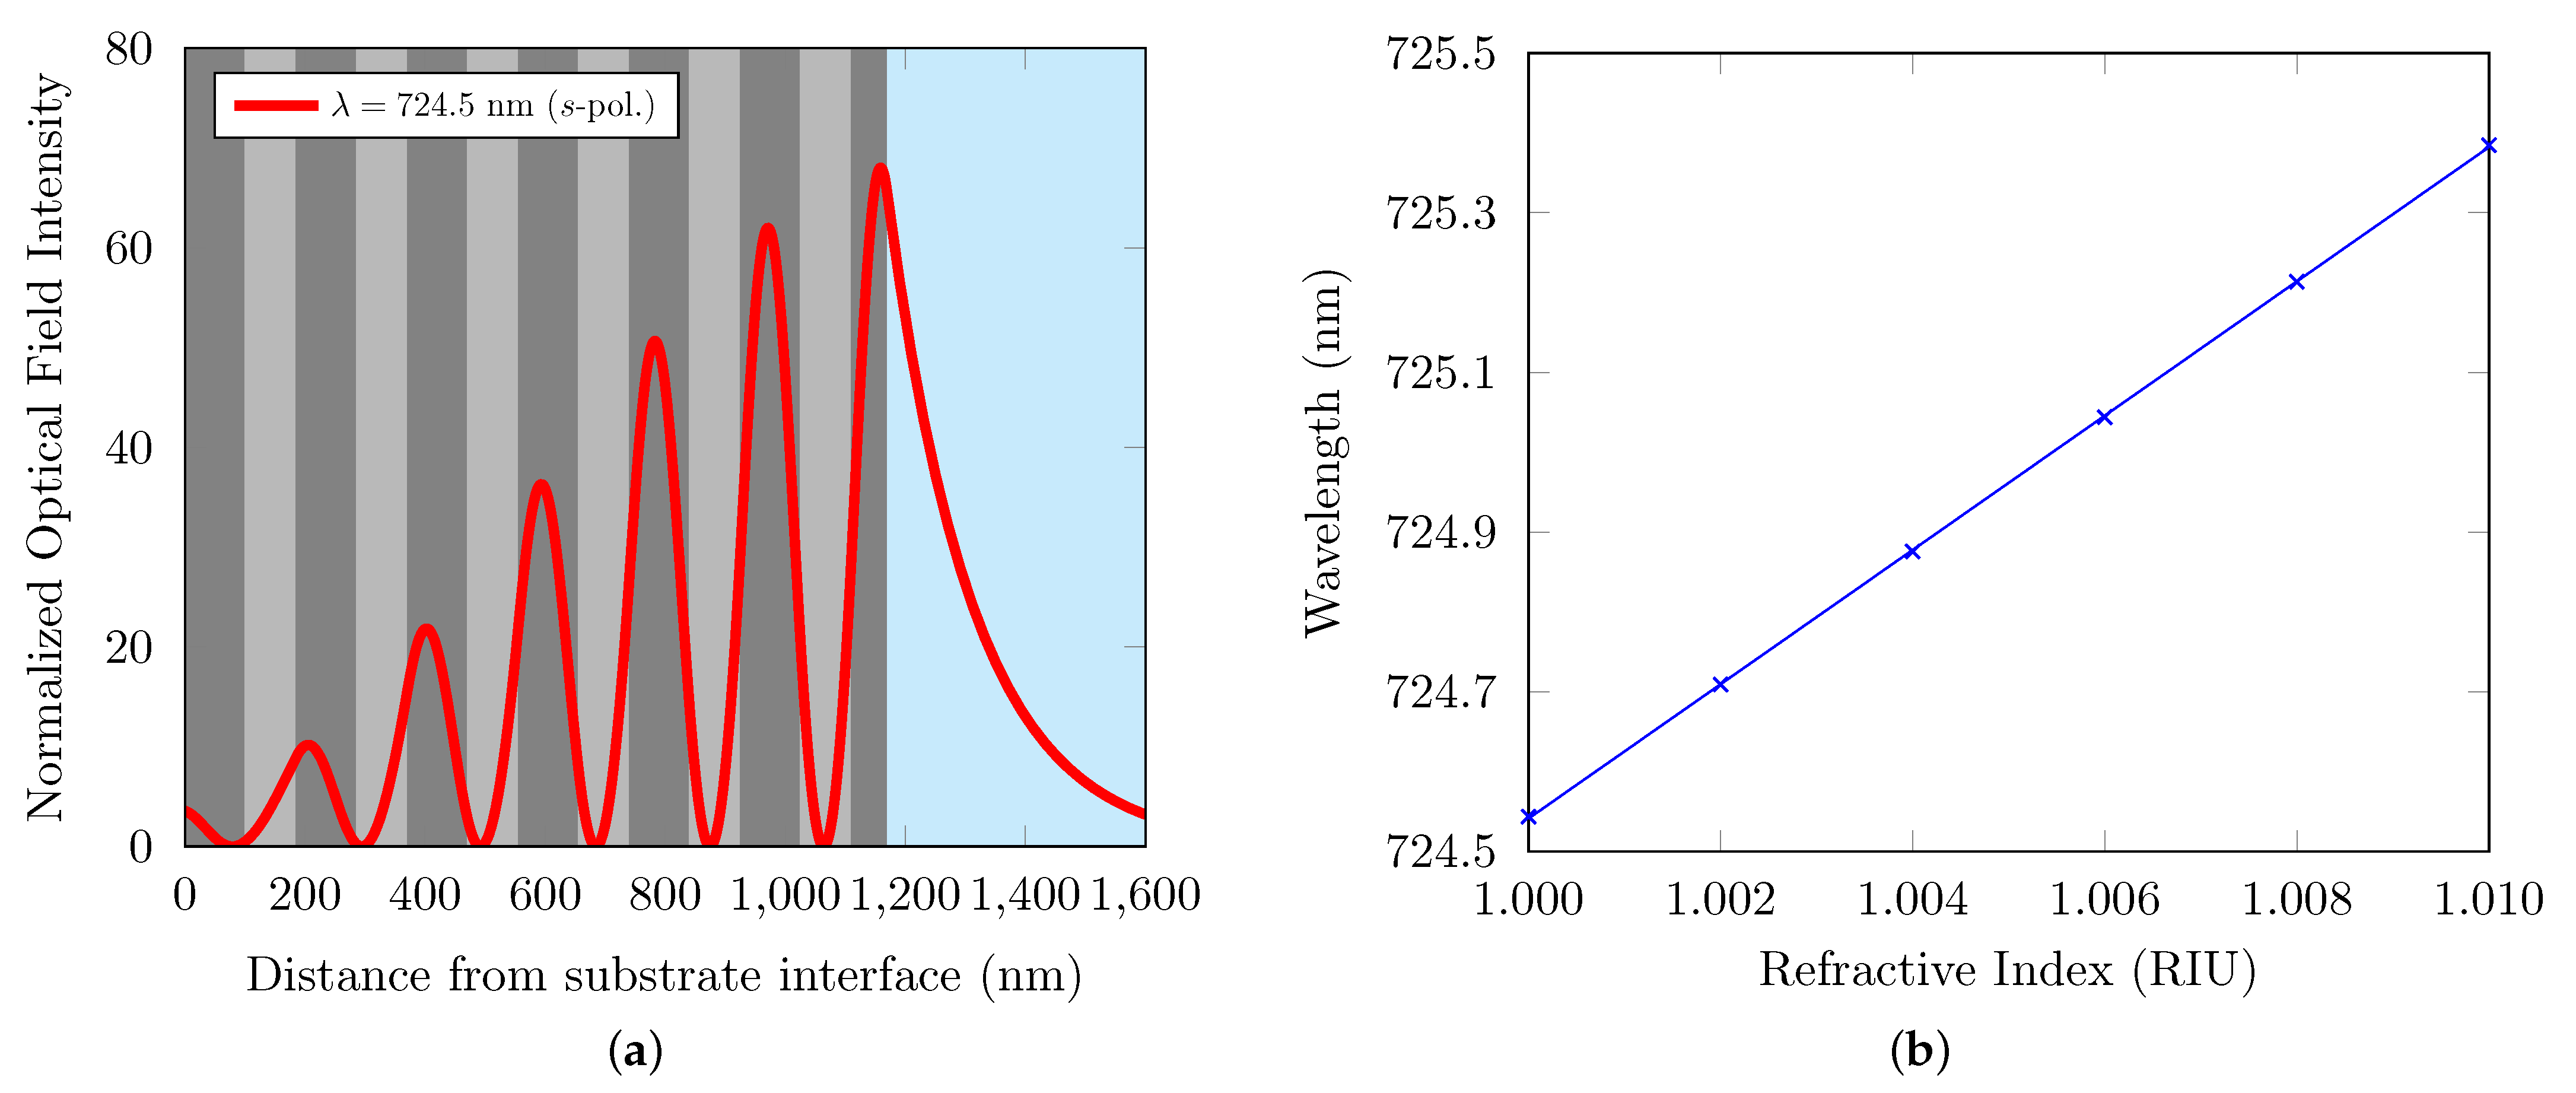
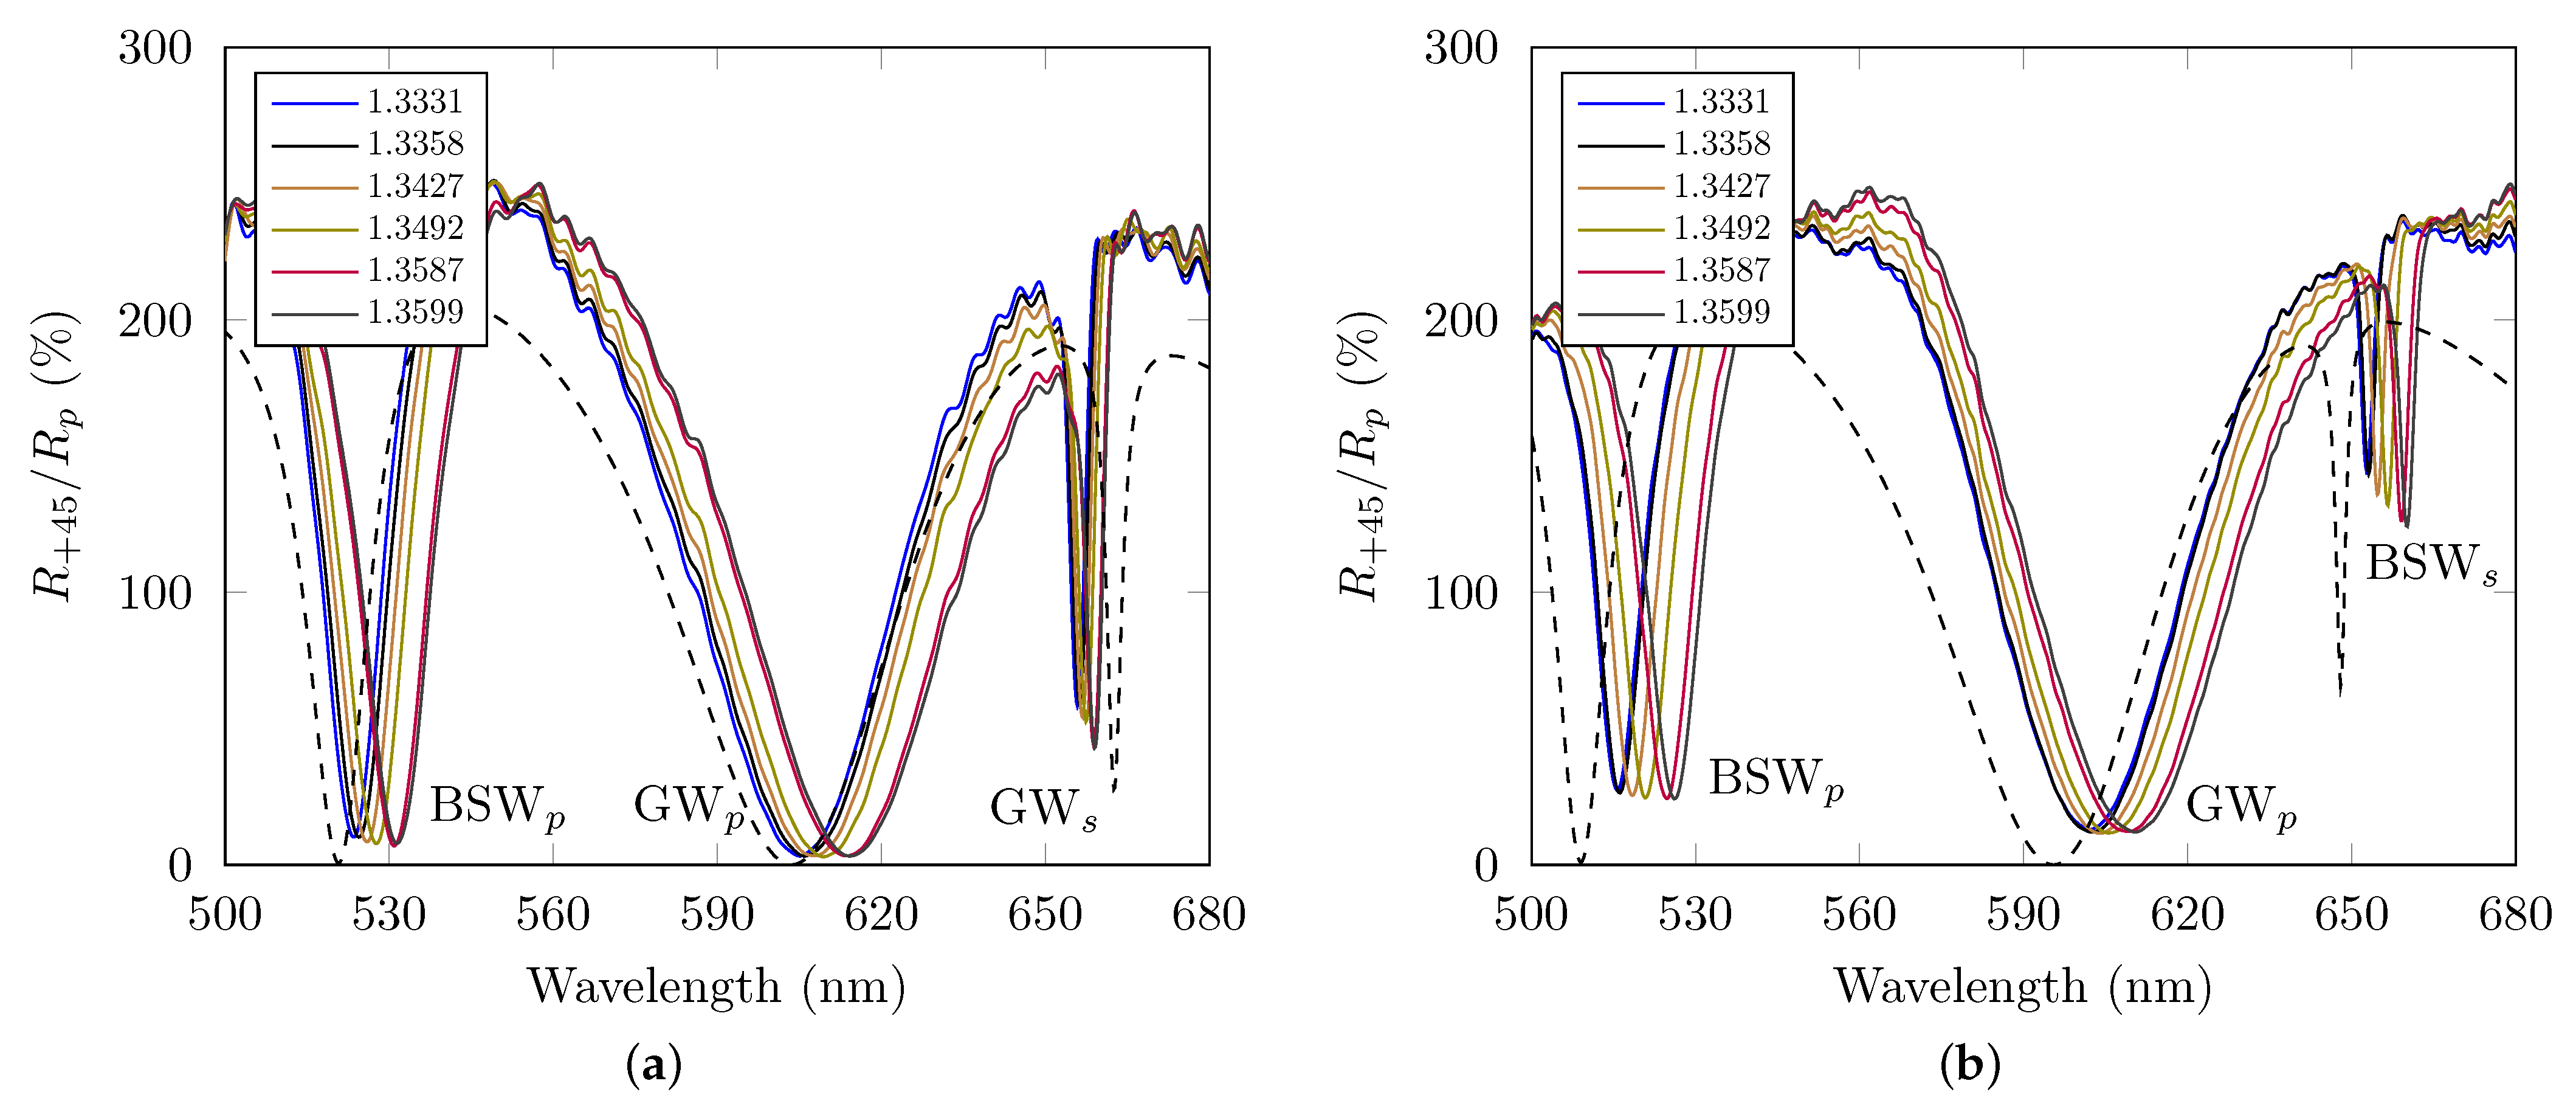
3.2. Water and Aqueous Analytes

It is very well known that an entrance slit width of a spectrometer affects the spectral resolution. Since the resonance dip related to the GW can be very narrow, it can be sometimes problematic to resolve it if the entrance slit is not sufficiently narrow. The resolution of the fiber-optic spectrometers is given by the effective width of the light beam from a core of the read optical fiber [26]. As an example, we used two read optical fibers with core diameters of 25 μ m and 50 μ m, respectively, to show the difference in the recorded reflectance ratio R + 45 ( λ ) / R p ( λ ) for water. As can be seen from Figure 5a, the narrowest dip at a wavelength of approximately 660 nm is almost twice deeper when the fiber with the 25 μ m core diameter is used.
Analyzing the obtained reflectance ratio, one of three resolved dips can be associated with the BSW (labeled as BSW p ), and it is excited by a p-polarized wave at a wavelength of approximately 518 nm (for a given angle of incidence), and the remaining two resolved dips can be associated with s-polarized waves. In the band structure for the s-polarized wave shown in Figure 3b, blue dots out of the photonic band gap represent the guided states for water as the analyte. We can extend our considerations following an approach presented in [27], including also the effect of the termination layer. In the case of the termination layer thickness of 50 nm, the red dots located inside the photonic band gap are obtained. Similarly, for a p-polarized wave, we computed the band structure shown in Figure 5b and the reflectance dip positions are depicted by black dots for a multilayer consisting of 450 bilayers. In the case when the termination layer is included in the calculations, blue dots and red dots are obtained for thicknesses of 60 nm and 50 nm in the MDSs, respectively. All the obtained states are located within the photonic band gap.

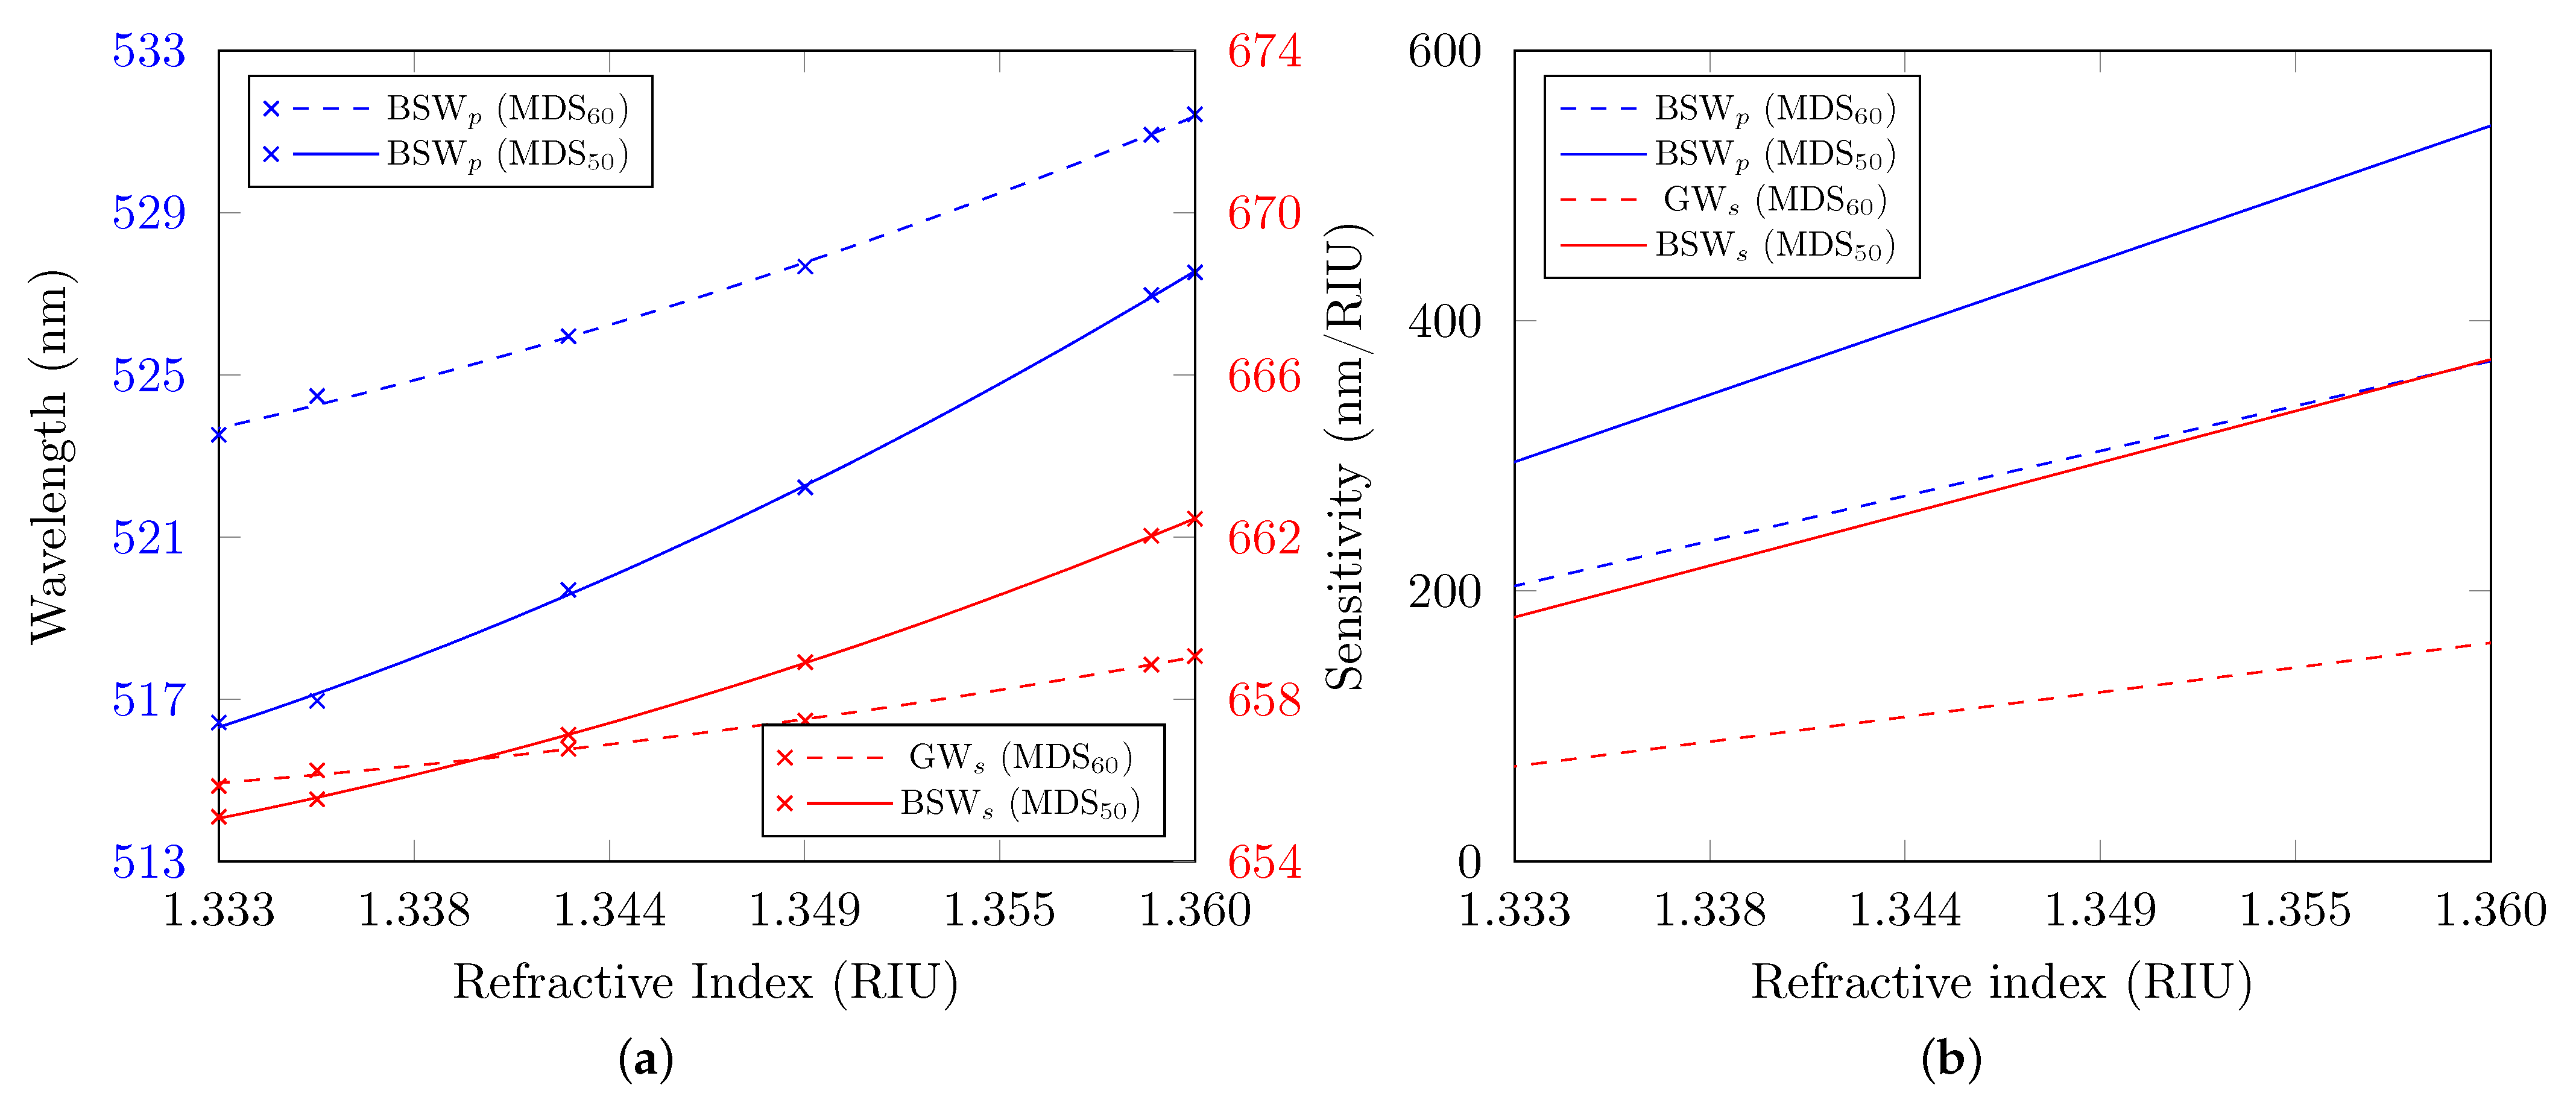
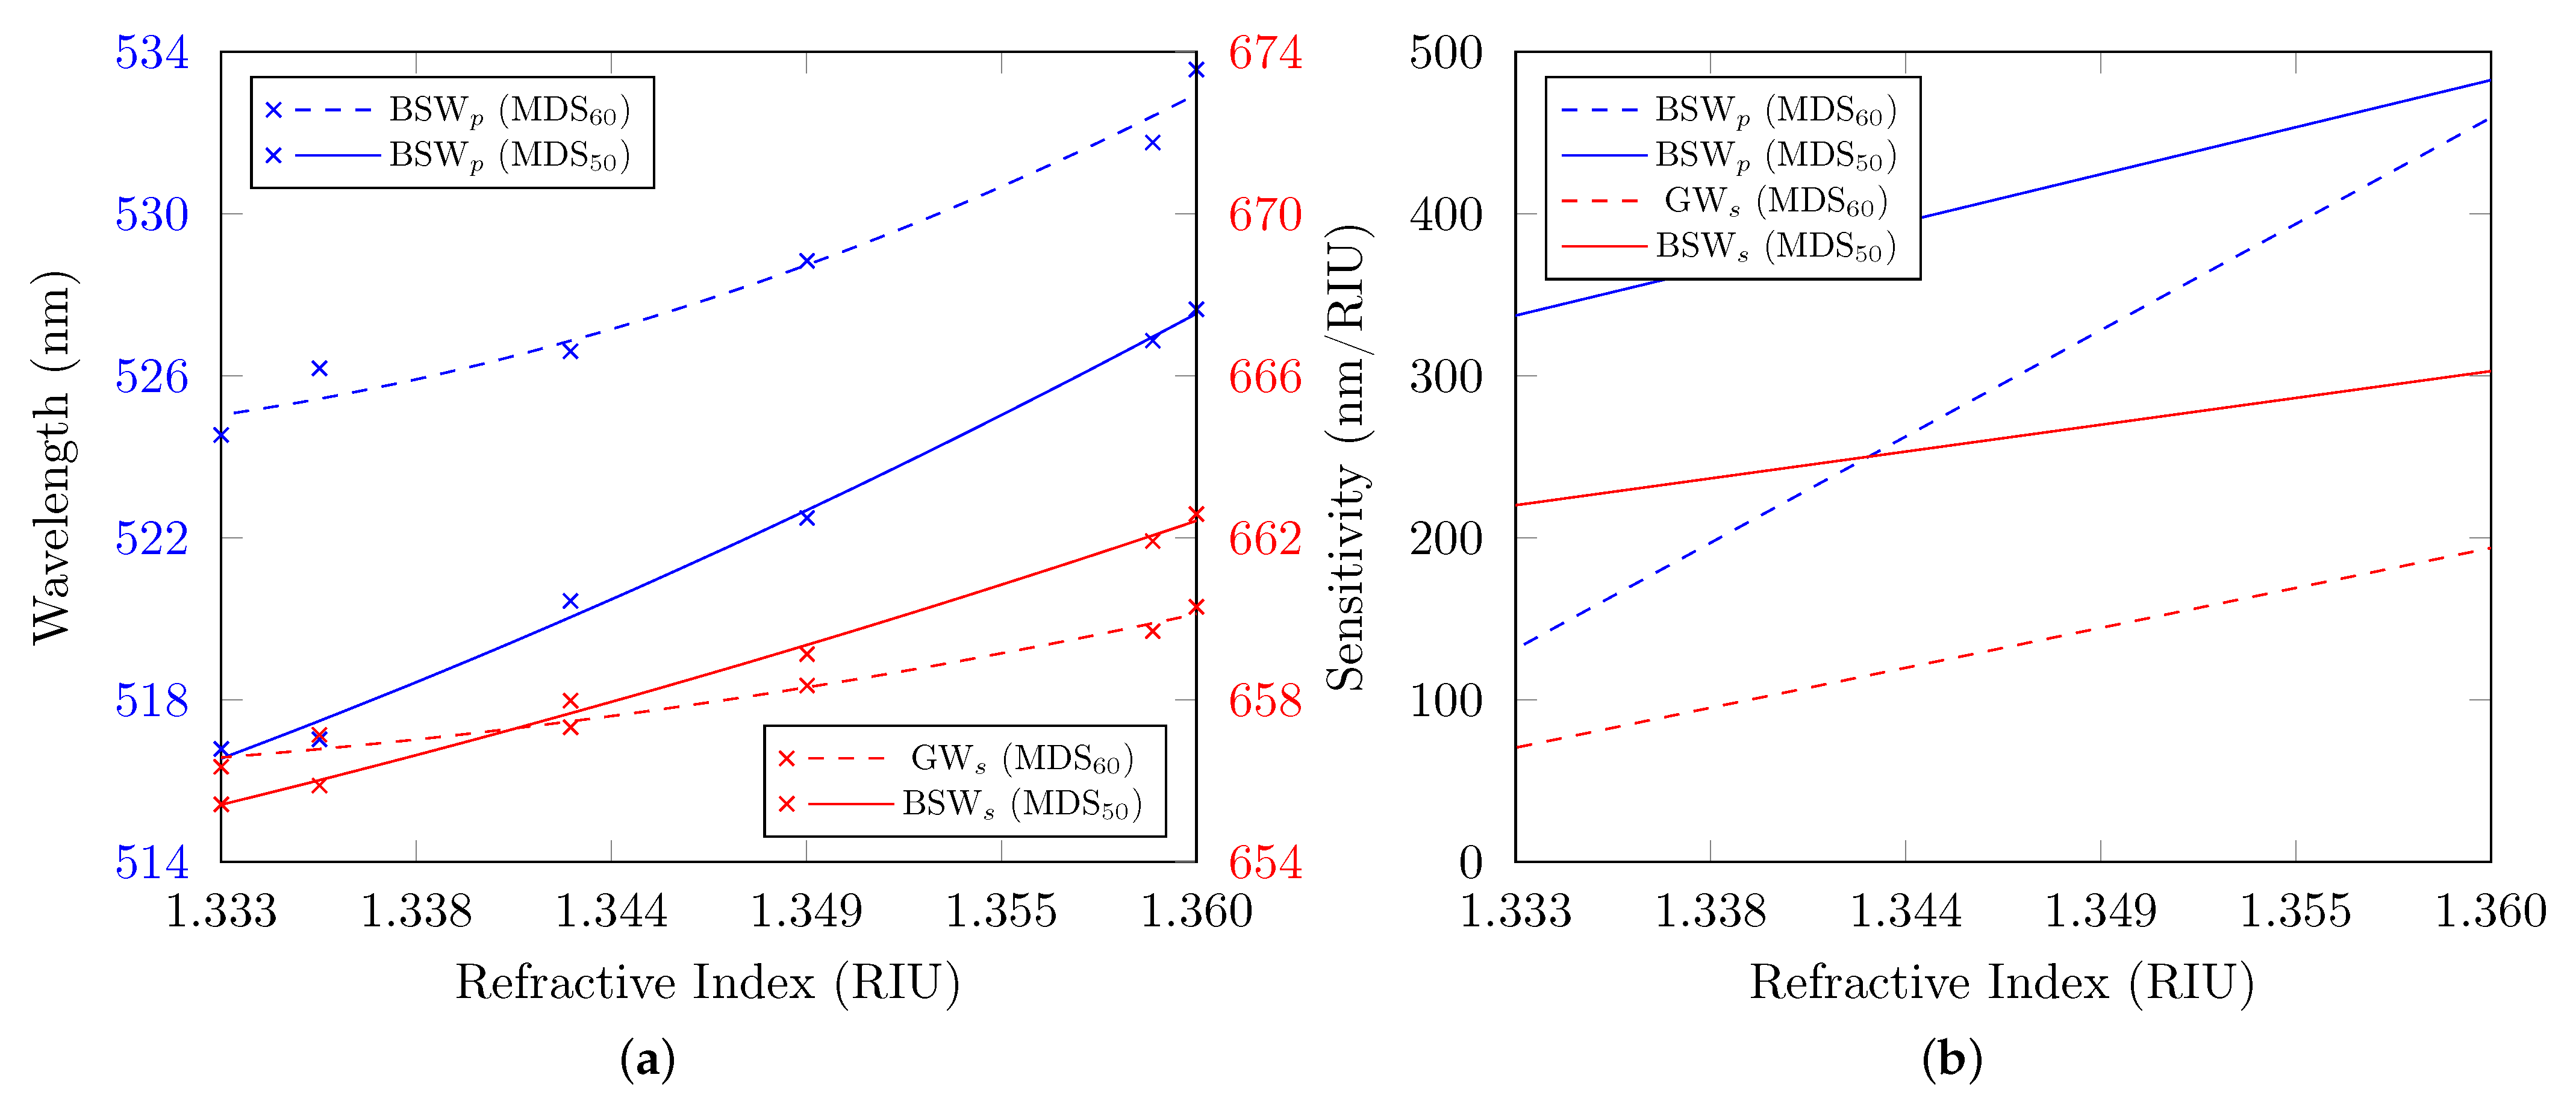
3.3. Termination Layers with Thicknesses of 60 nm and 50 nm

In this section, we compare the two prepared MDSs in their sensing abilities related to aqueous analytes. In Figure 6a,b, the measured reflectance ratios R + 45 ( λ ) / R p ( λ ) are shown for MDS 60 and MDS 50 , respectively, for different RIs of the analyte. It can be seen that the reflectance dips related to both s- and p-polarized waves (BSW or GW) are deeper for the MDS 60 , but their shift with RI change is smaller than in the case of MDS 50 .
The theoretical results obtained for pure water with the RI n = 1.333 are shown by the dashed lines. For the reflectance dip wavelengths, we calculated the optical intensity distributions within the MDSs, as shown in Figure 7a,b. They clearly illustrate the substantially enhanced optical field with an exponential tail for the MDS 50 than for the MDS 60 , and thus increased penetration depth of the field in the analyte. The discrepancy between the theoretical and experimental reflectances can be attributed to the variable thicknesses of all TiO 2 and SiO 2 layers in the real MDS as illustrated for a different MDS in a previous paper [10].
In Figure 8a, we show the resonance wavelength of both waves as a function of the RI for both structures. In the case of BSW p , the wavelength shift is about 7.9 nm for MDS 60 nm and about 11.1 nm for MDS 50 . In the case of the GWs in s polarization, the wavelength shift is about 3.3 nm for MDS 60 nm and about 7.3 nm for MDS 50 when the GW is transformed into the BSW.
A direct comparison of sensitivities to the RI is shown in Figure 8b. The sensitivities change linearly with the RI, and they are higher for MDS 50 than for MDS 60 in the whole RI range. The sensitivity can be further enhanced by decreasing the termination layer thickness, but this is accompanied by the dip depth decrease [19] and thus a smaller FOM increase. A summary of the sensor performance parameters is presented in Table 1.
Comparing the results with the available ones [4,16,19,28,29,30], the resonance depths obtained are the greatest; however, the sensitivities are smaller than those for a single polarization [4,16,28], or for both polarizations [19], including also sensors employing fibers [29] and operated in a near infrared spectral region. The sensitivities are close to those for sensors employing a D-shaped optical fiber [30].

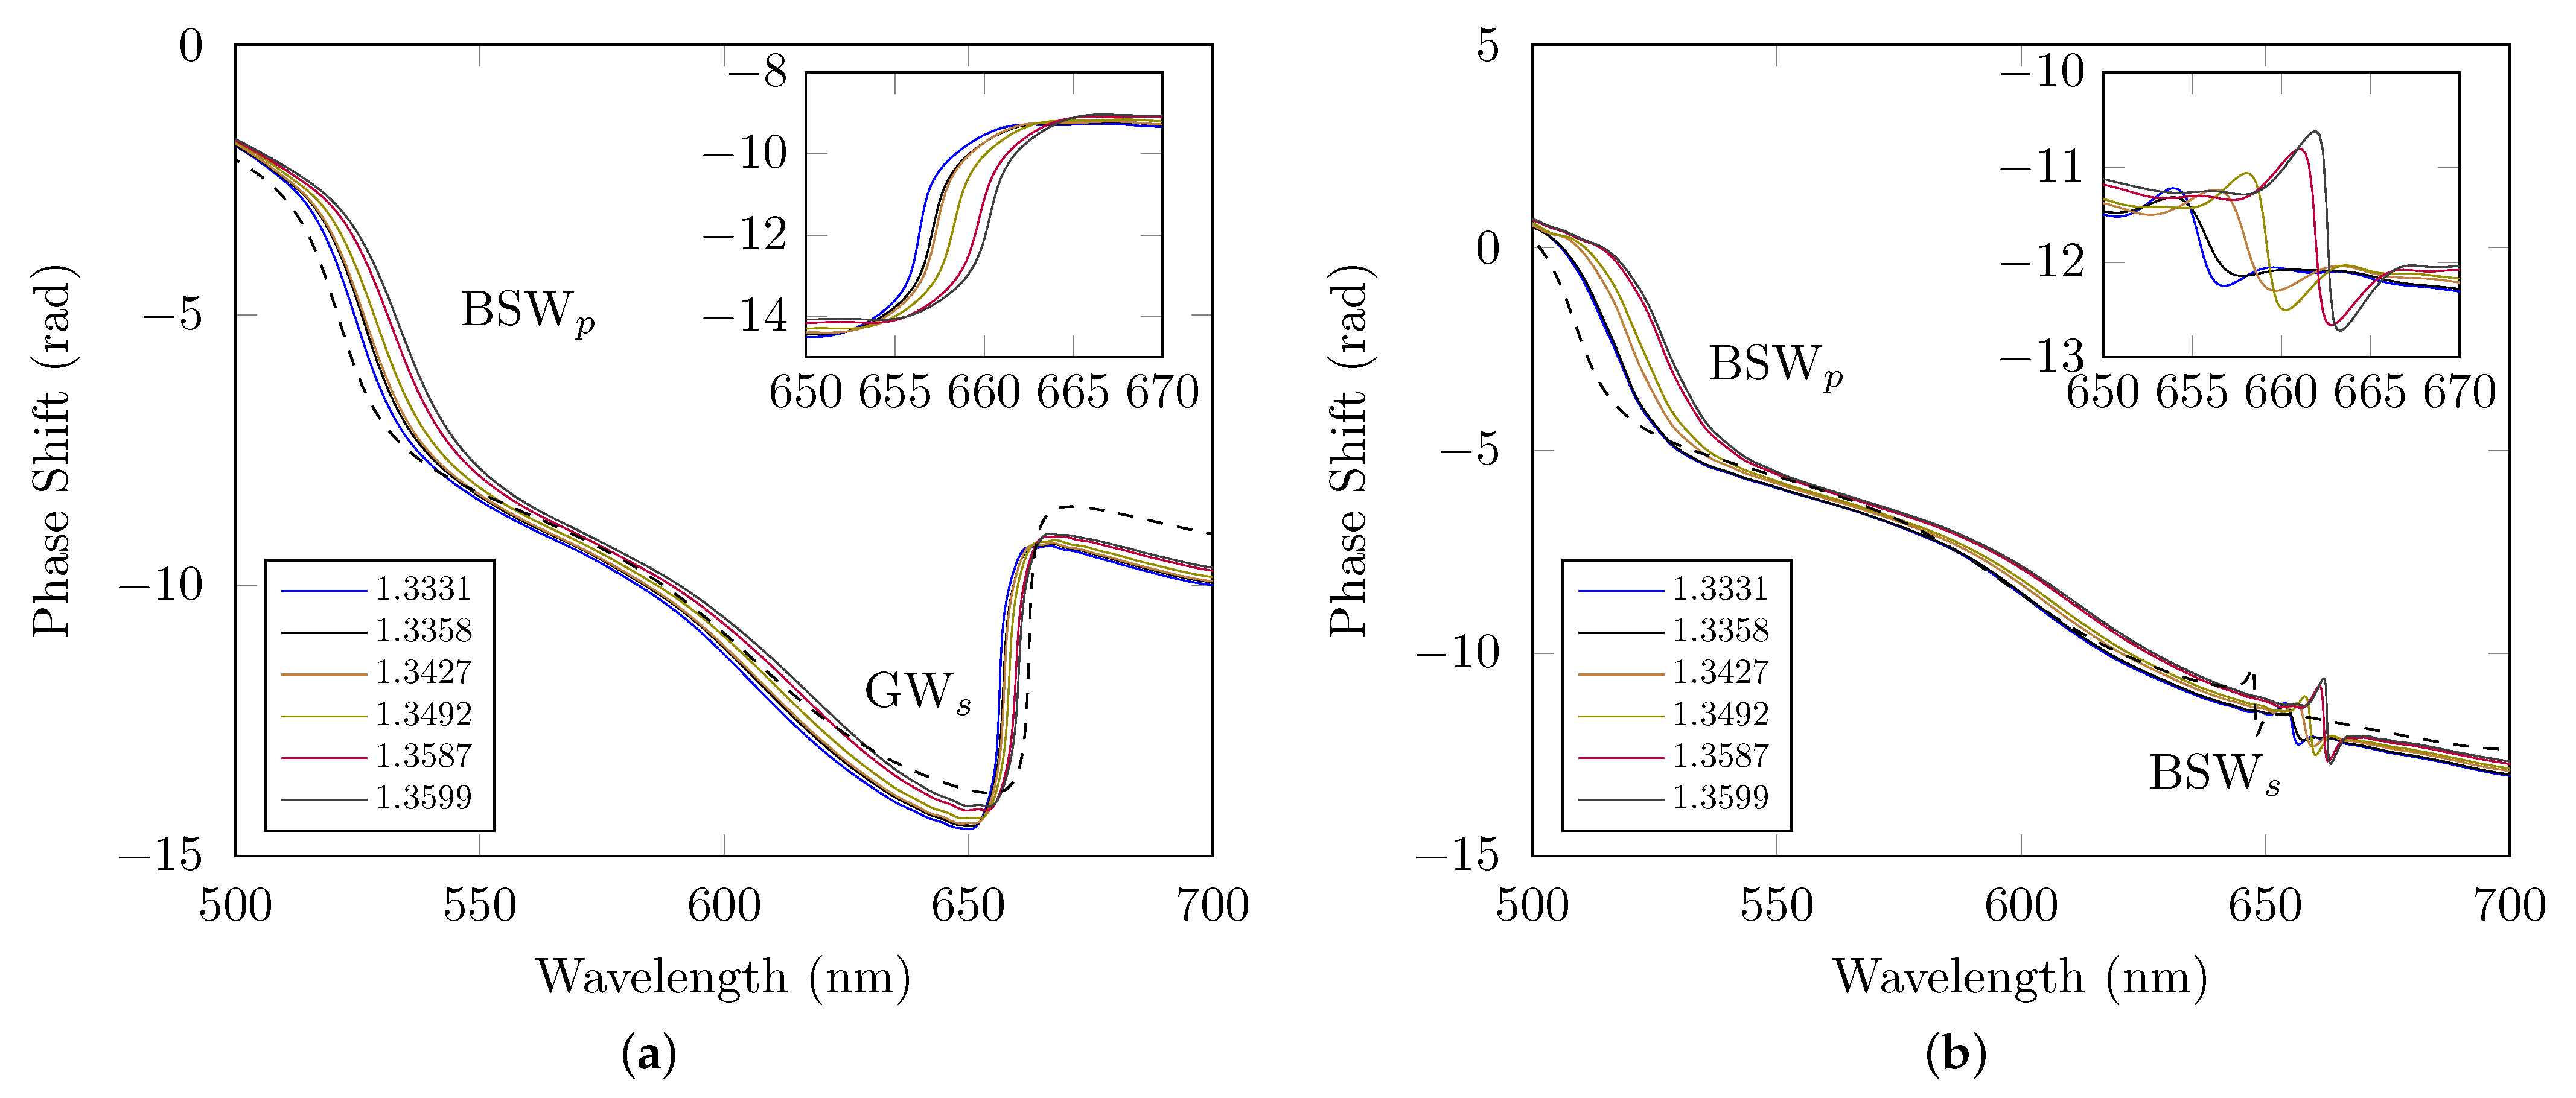
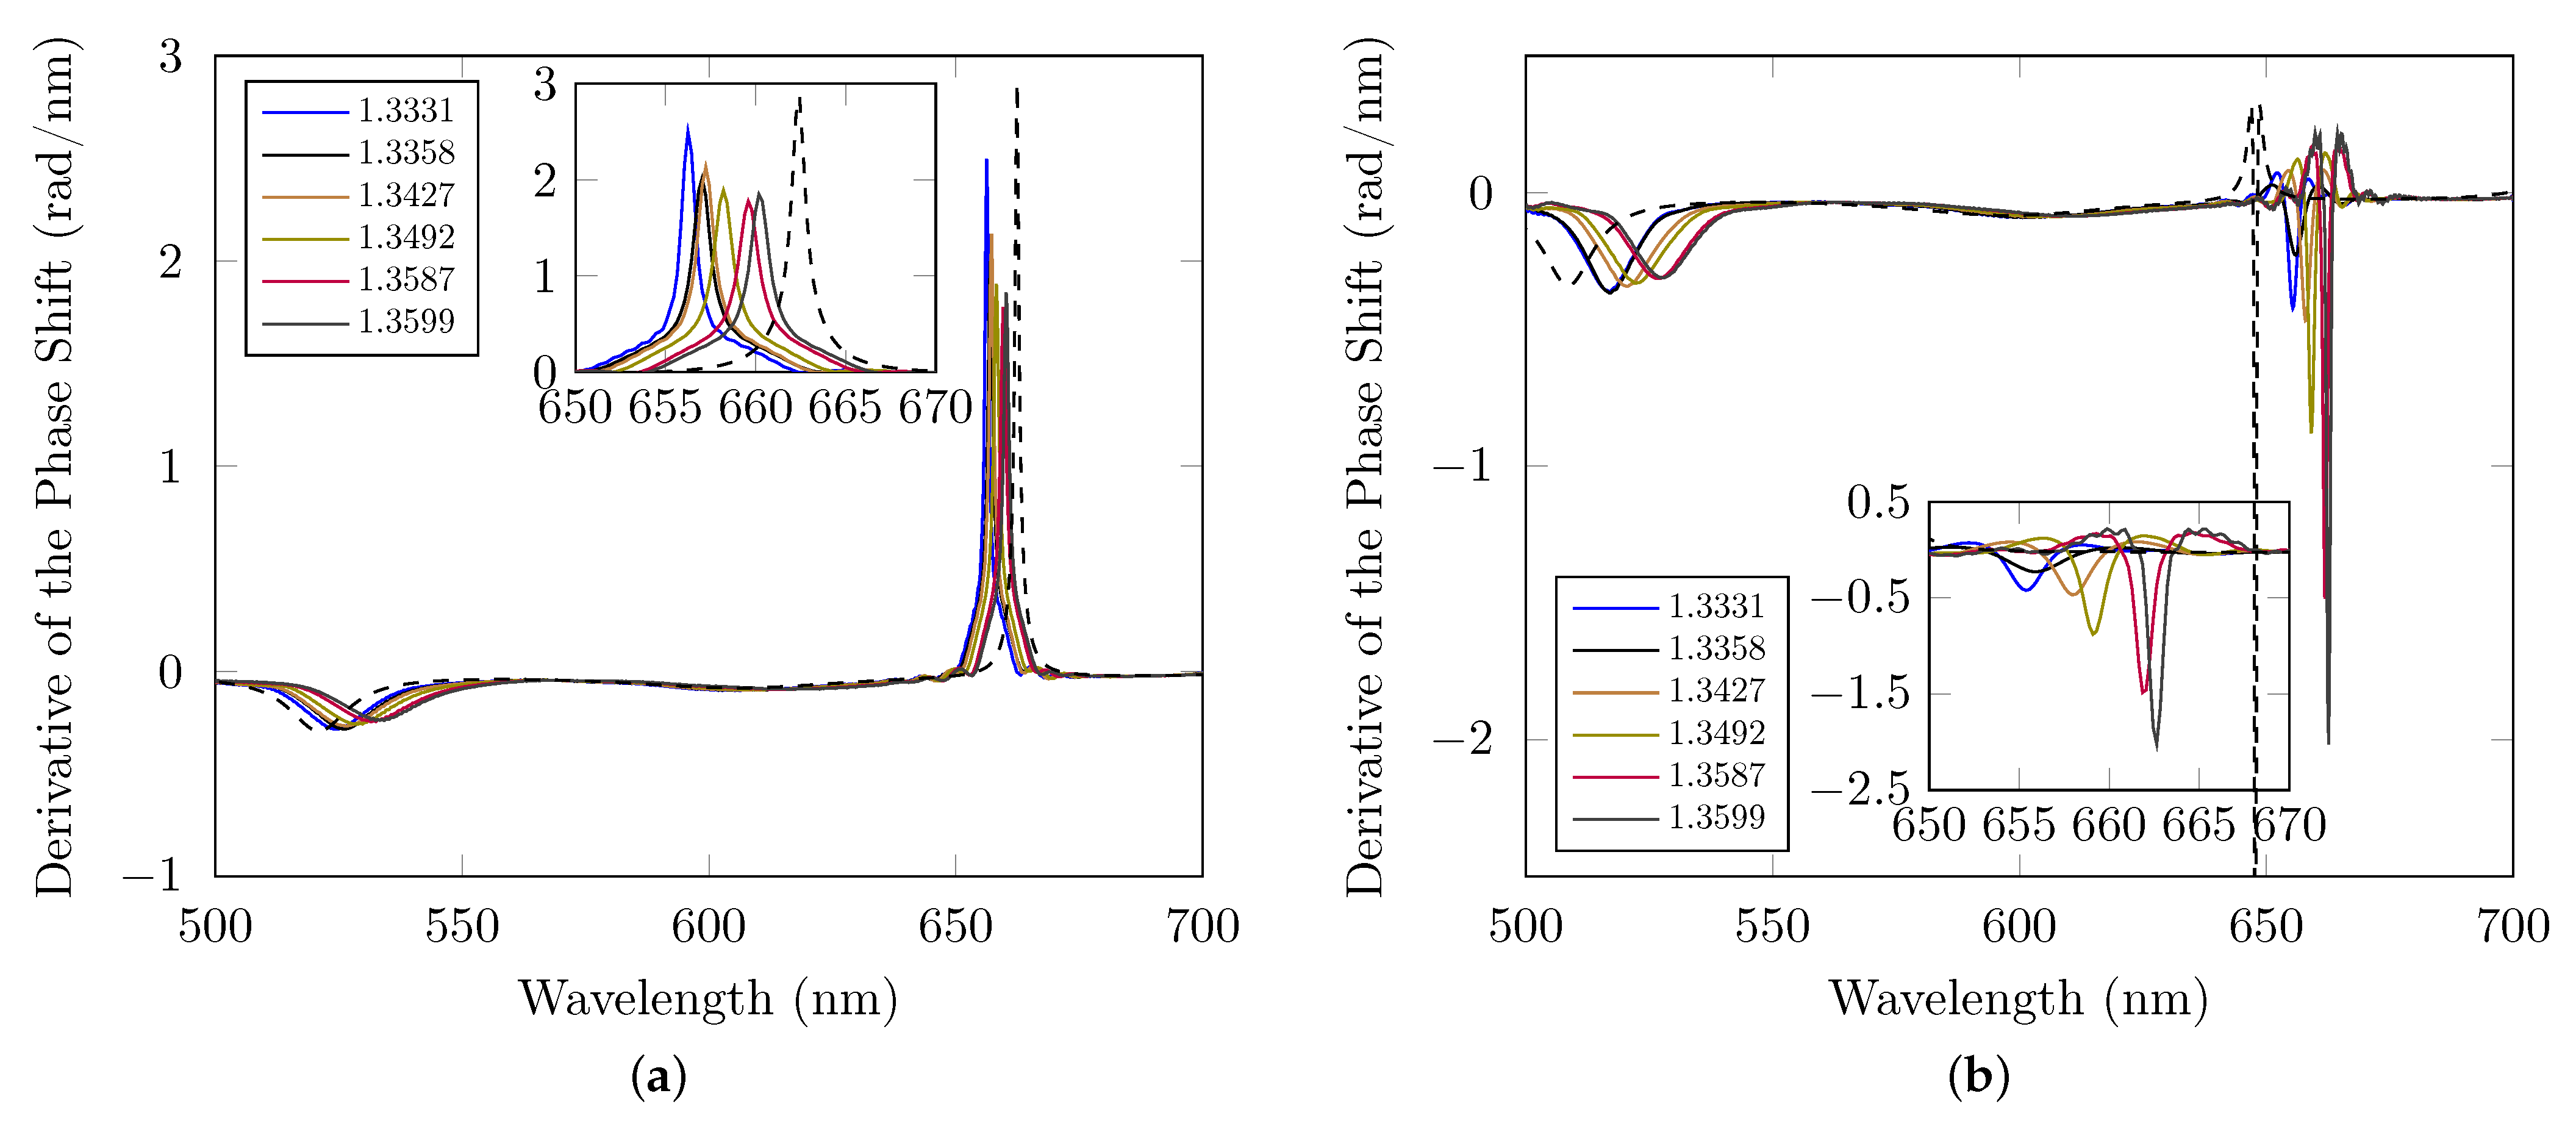
3.4. Phase Responses

In this section, we analyze the experimental phase responses of both MDSs. As for the other resonance phenomena, such as a SPR [31,32], an abrupt phase change is related to the BSWs [16], and it can be exploited for sensing applications. In Figure 9a,b, the phase shifts measured for both MDS 60 and MDS 50 are shown. While the phase shifts due to the BSW p are similar in both cases, the phase shifts due to the s-polarized waves are substantially different, both in magnitude and sign of its change. Moreover, while a slope of the phase shift due to the s-polarized GW is similar for every RI in the case of the MDS 60 , it varies in the case of MDS 50 , when the GW is transformed into the BSW. It is interesting to note that a similar behavior is revealed for a SPR phase response of a simple structure when the thickness of a gold layer is changed [31,32]. In the same figures, we show by dashed lines the theoretical phase Δ ( λ ) obtained using TMM.
In Figure 10a,b, derivatives of the phase shifts are shown for MDS 60 and MDS 50 , respectively. The derivative peak position can be traced as the RI changes, similar to tracing the reflectance dip.
In Figure 11a, we show the wavelengths related to the derivative peaks of wave in both polarizations as functions of the RI for both structures. In the case of BSW p , the wavelength shift is about 9 nm for MDS 60 nm and about 10.9 nm for MDS 50 . In the case of the s-polarized GW, the wavelength shift is about 3.9 nm for MDS 60 nm and about 7.1 nm for MDS 50 , when the GW is transformed into the BSW. Sensitivities to the RI are compared in Figure 11b. As in the case of reflectance, the sensitivities linearly increase with the RI and are higher for the MDS 50 than for the MDS 60 in the whole RI range. Sensitivities obtained in the phase measurements are summarized in Table 2.
The FOM of 303 RIU 1 belongs to values that are close to those of other BSW-based sensors [4,19], but are not accessible by the SPR-based sensors [33].

4. Conclusions

In this paper, we demonstrated an efficient way of sensing of gaseous and aqueous analytes utilizing a MDS composed of six TiO 2 /SiO 2 bilayers with a termination layer of TiO 2 . We showed that for air, the GW can be excited by an s-polarized wave in the given wavelength range and we used a technique based on interference of reflected polarized waves to resolve the reflectance dips with their maximum depth. Theoretical analysis shows that the GW responses are with a linear shift of the resonance wavelength to small changes in the RI of the analyte, giving a constant RI sensitivity of 87 nm/RIU and FOM of 15.7 RIU 1 .
We performed experiments for analytes of aqueous solution of NaCl with the RI n D in a range of 1.3331–1.3599, and we resolved resonance reflectance dips for BSWs excited by both s- and p-polarized waves for a specific MDS. We revealed very narrow reflectance dips whose widths can be affected by a limiting resolving power of a spectrometer. By a direct comparison of very narrow reflectance and phase responses for two designed and realized MDSs differing only in thicknesses of the termination layers, we showed that both RI sensitivity and FOM , which reach 544.3 nm/RIU and 303 RIU 1 , respectively, are higher for the case of MDS 50 , thus making the structure more suitable for sensing applications.
Thus, we demonstrated not only very deep BSW-based resonances in two orthogonal polarizations, but also a very narrow resonance in a single polarization. Designs and realizations can be extended to MDSs supporting BSWs, which are characterized by a superior sensitivity and FOM, representing an effective alternative to other optical sensors. Moreover, based on the most recent theoretical results [34], phase response measurements can be extended using a setup not including a coupling prism.

Author Contributions

Conceptualization, R.K. and P.H.; methodology, R.K. and P.H.; software, R.K. and P.H.; validation, R.K. and P.H.; formal analysis, R.K. and P.H.; investigation, T.F., R.K., P.H., P.P. and J.S.; resources, R.K. and P.H.; data curation, R.K. and P.H.; writing—original draft preparation, R.K.; writing—review and editing, T.F, R.K., P.H.,P.P and J.S.; visualization, R.K. and P.H.; supervision, P.H.; project administration, T.F. and P.H.; funding acquisition, T.F. All authors have read and agreed to the published version of the manuscript.

Funding

This research was funded by the institutional support RVO:68081731, by student grant system through project SP2022/25, and by project Support for Science and Research in the Moravia-Silesia Region 2020 (RRC/02/2020).

Institutional Review Board Statement

Not applicable.

Informed Consent Statement

Not applicable.

Data Availability Statement

Not applicable.

Acknowledgments

The authors would like to thank F. Mika from Institute of Scientific Instruments of the CAS for providing the SEM images of the 1DPhC.

Conflicts of Interest

The authors declare no conflict of interest.

References

  1. Yeh, P. Optical Waves in Layered Media; John Wiley and Sons: Hoboken, NJ, USA, 2005. [Google Scholar]
  2. Raether, H. Surface Plasmons on Smooth and Rough Surfaces and on Gratings; Springer: New York, NY, USA, 1988. [Google Scholar]
  3. Wu, F.; Lyu, K.; Hu, S.; Yao, M.; Xiao, S. Ultra-large omnidirectional photonic band gaps in one-dimensional ternary photonic crystals composed of plasma, dielectric and hyperbolic metamaterial. Opt. Mater. 2021, 111, 110680. [Google Scholar] [CrossRef]
  4. Giorgis, F.; Descrovi, E.; Summonte, C.; Dominici, L.; Michelotti, F. Experimental determination of the sensitivity of Bloch Surface Waves based sensors. Opt. Express 2010, 18, 8087–8093. [Google Scholar] [CrossRef] [PubMed]
  5. Farmer, A.; Friedli, A.C.; Wright, S.M.; Robertson, W.M. Biosensing using surface electromagnetic waves in photonic band gap multilayers. Sens. Actuators B Chem. 2012, 173, 79–84. [Google Scholar] [CrossRef]
  6. Kong, W.; Zheng, Z.; Wan, Y.; Li, S.; Liu, J. High-sensitivity sensing based on intensity-interrogated Bloch surface wave sensors. Sens. Actuators B Chem. 2014, 193, 467–471. [Google Scholar] [CrossRef]
  7. Deng, C.Z.; Ho, Y.L.; Lee, Y.C.; Wang, Z.; Tai, Y.H.; Zyskowski, M.; Daiguji, H.; Delaunay, J.J. Two-pair multilayer Bloch surface wave platform in the near- and mid-infrared regions. Appl. Phys. Lett. 2019, 115, 091102. [Google Scholar] [CrossRef]
  8. Gan, S.; Wang, H.; Liang, J.; Dai, X.; Xiang, Y. Ultra-Sensitive Refractive Index Sensors Based on Bloch Surface Waves with Transition Metal Dichalcogenides. IEEE Sens. J. 2019, 19, 8675–8680. [Google Scholar] [CrossRef]
  9. Gryga, M.; Ciprian, D.; Hlubina, P. Sensing concept based on Bloch surface waves and wavelength interrogation. Opt. Lett. 2020, 45, 1096–1099. [Google Scholar] [CrossRef]
  10. Gryga, M.; Ciprian, D.; Hlubina, P. Bloch surface wave resonance based sensors as an alternative to surface plasmon resonance sensors. Sensors 2020, 20, 5119. [Google Scholar] [CrossRef]
  11. Goyal, A.K.; Pal, S. Design analysis of Bloch surface wave based sensor for haemoglobin concentration measurement. Appl. Nanosci. 2020, 10, 3639–3647. [Google Scholar] [CrossRef]
  12. Guillermain, E.; Lysenko, V.; Orobtchouk, R.; Benyattou, T.; Roux, S.; Pillonnet, A.; Perriat, P. Bragg surface wave device based on porous silicon and its application for sensing. Appl. Phys. Lett. 2007, 90, 241116. [Google Scholar] [CrossRef]
  13. Kang, X.B.; Wen, L.; Wang, Z.G. Design of guided Bloch surface wave resonance bio-sensors with high sensitivity. Opt. Commun. 2017, 383, 531–536. [Google Scholar] [CrossRef]
  14. Kovalevich, T.; Belharet, D.; Robert, L.; Ulliac, G.; Kim, M.S.; Herzig, H.P.; Grosjean, T.; Bernal, M.P. Bloch surface waves at the telecommunicationwavelength with Lithium Niobate as top layer for integrated optics. Appl. Opt. 2019, 58, 1757–1762. [Google Scholar] [CrossRef] [PubMed] [Green Version]
  15. Sinibaldi, A.; Rizzo, R.; Figliozzi, G.; Descrovi, E.; Danz, N.; Munzert, P.; Anopchenko, A.; Michelotti, F. A full ellipsometric approach to optical sensing with Bloch surface waves on photonic crystals. Opt. Express 2013, 21, 23331–23344. [Google Scholar] [CrossRef] [PubMed]
  16. Li, Y.; Yang, T.; Song, S.; Pang, Z.; Du, G. Phase properties of Bloch surface waves and their sensing applications. Appl. Phys. Lett. 2013, 103, 041116. [Google Scholar] [CrossRef]
  17. Li, Y.; Yang, T.; Pang, Z.; Du, G.; Song, S. Phase-sensitive Bloch surface wave sensor based on variable angle spectroscopic ellipsometry. Opt. Express 2014, 22, 21403–21410. [Google Scholar] [CrossRef]
  18. Kaňok, R.; Hlubina, P.; Gembalová, L.; Ciprian, D. Efficient Optical Sensing Based on Phase Shift of Waves Supported by a One-Dimensional Photonic Crystal. Sensors 2021, 21, 6535. [Google Scholar] [CrossRef]
  19. Hlubina, P.; Gryga, M.; Ciprian, D.; Pokorny, P.; Gembalova, L.; Sobota, J. High performance liquid analyte sensing based on Bloch surface wave resonances in the spectral domain. Opt. Laser Technol. 2022, 145, 107492. [Google Scholar] [CrossRef]
  20. Chen, Y.H.; Shi, W.H.; Feng, L.; Xu, X.Y.; Shang-Guan, M.Y. Study on simultaneous sensing of gas concentration and temperature in one-dimensional photonic crystal. Superlattices Microstruct. 2019, 131, 53–58. [Google Scholar] [CrossRef]
  21. Goyal, A.K.; Kumar, A.; Massoud, Y. Thermal Stability Analysis of Surface Wave Assisted Bio-Photonic Sensor. Photonics 2022, 9, 324. [Google Scholar] [CrossRef]
  22. Pettersson, L.A.A.; Roman, L.S.; Inganäs, O. Modeling photocurrent action spectra of photovoltaic devices based on organic thin films. J. Appl. Phys. 1999, 86, 487–496. [Google Scholar] [CrossRef]
  23. Daimon, M.; Masumura, A. Measurement of the refractive index of distilled water from the near-infrared region to the ultraviolet region. Appl. Opt. 2007, 46, 3811–3820. [Google Scholar] [CrossRef] [PubMed]
  24. Polyanskiy, M.N. Refractive Index Database. Available online: http://refractiveindex.info (accessed on 1 July 2022).
  25. Sinibaldi, A.; Descrovi, E.; Giorgis, F.; Dominici, L.; Ballarini, M.; Mandracci, P.; Danz, N.; Michelotti, F. Hydrogenated amorphous silicon nitride photonic crystals for improved-performance surface electromagnetic wave biosensors. Biomed. Opt. Express 2012, 3, 2405–2410. [Google Scholar] [CrossRef] [PubMed] [Green Version]
  26. Hlubina, P. Dispersive spectral-domain two-beam interference analysed by a fibre-optic spectrometer. J. Mod. Opt. 2004, 51, 537–547. [Google Scholar] [CrossRef]
  27. Dubey, R.; Barakat, E.; Häyrinen, M.; Roussey, M.; Honkanen, S.K.; Kuittinen, M.; Herzig, H.P. Experimental investigation of the propagation properties of bloch surface waves on dielectric multilayer platforms. J. Eur. Opt. Soc. 2017, 13, 5. [Google Scholar] [CrossRef] [Green Version]
  28. Guo, Y.; Ye, J.Y.; Divin, C.; Huang, B.; Thomas, T.P.; Baker, J.R.; Norris, T.B. Real-time biomolecular binding detection using a sensitive photonic crystal biosensor. Anal. Chem. 2010, 82, 211–5218. [Google Scholar] [CrossRef] [Green Version]
  29. Gonzalez-Valencia, E.; Herrera, R.A.; Torres, P. Bloch surface wave resonance in photonic crystal fibers: Towards ultra-wide range refractive index sensors. Opt. Express 2019, 27, 8236–8545. [Google Scholar] [CrossRef]
  30. Gonzalez-Valencia, E.; Villar, I.D.; Torres, P. Novel Bloch wave excitation platform based on few-layer photonic crystal deposited on D-shaped optical fiber. Sci. Rep. 2021, 11, 11266. [Google Scholar] [CrossRef]
  31. Wan, X.Y.D.; Yan, Z. Simulation and analysis of surface plasmon resonance biosensor based on phase detection. Sens. Actuators B Chem. 2003, 91, 285–290. [Google Scholar]
  32. Zhang, C.; Wang, R.; Min, C.; Zhu, S.; Yuan, X.C. Experimental approach to the microscopic phase-sensitive surface plasmon resonance biosensor. Appl. Phys. Lett. 2013, 102, 011114. [Google Scholar] [CrossRef]
  33. Xu, Y.; Bai, P.; Zhou, X.; Akimov, Y.; Png, C.E.; Ang, L.K.; Knoll, W.; Wu, L. Optical Refractive Index Sensors with Plasmonic and Photonic Structures: Promising and Inconvenient Truth. Adv. Opt. Mater. 2019, 7, 1801433. [Google Scholar] [CrossRef]
  34. Wu, F.; Liu, D.; Li, Y.; Li, H. Ultra-sensitive refractive index sensing enabled by a dramatic ellipsometric phase change at the band edge in a one-dimensional photonic crystal. Opt. Express 2022, 30, 29030–29043. [Google Scholar] [CrossRef]
Figure 1. SEM images of the 1DPhC with overall (a) and detail (b) views.
Photonics 09 00561 g001
Figure 2. Experimental setup: a MDS in the Kretschmann configuration; white light source (WLS), collimating lens (CL), polarizer (P), birefringence crystal (BC), analyzer (A), microscope objective (MO), spectrometer (S), personal computer (PC), optical fibers (shown as blue lines).
Photonics 09 00561 g002
Figure 3. (a) Theoretical reflectance ratio R 45 ( λ ) / R p ( λ ) as a function of wavelength for different RIs of the analyte and the angle of incidence θ = 45.5 °   ( α 22 ° ). Experimental result for air is shown by the dashed line. (b) Band structure of the 1DPhC for s-polarized wave with dots corresponding to the GWs for air (black) and water (blue), and the surface waves for water (red).
Photonics 09 00561 g003
Figure 4. (a) Normalized optical field distribution of s-polarized wave in the MDS 60 for air with the RI n = 1 and the angle of incidence θ = 45.5 ° ( α 22 ° ). (b) Resonance wavelength as a function of analyte RI.
Photonics 09 00561 g004
Figure 5. (a) Comparison of spectra recorded by the spectrometer employing a read optical fiber of two different core diameters d. (b) Band structure of the 1DPhC for p-polarized wave. Black dots correspond to a multilayer consisting of 450 bilayers, blue and red dots to the MDS including the termination layer with thickness of 60 nm and 50 nm, respectively.
Photonics 09 00561 g005
Figure 6. Experimental reflectance ratio R 45 ( λ ) / R p ( λ ) as a function of wavelength for different RIs of the analyte: MDS 60 (a) and MDS 50 (b). The dashed lines are the theoretical results for water.
Photonics 09 00561 g006
Figure 7. Normalized optical field distribution in MDS at different wavelengths for water and angle of incidence θ = 64 ° ( α 6 °): MDS 60 (a) and MDS 50 (b).
Photonics 09 00561 g007
Figure 8. Dependencies of resonance wavelength (a) and RI sensitivity (b) on RI.
Photonics 09 00561 g008
Figure 9. Phase shift as a function of wavelength for different RIs of the analyte: MDS 60 (a) and MDS 50 (b). The dashed lines are the theoretical functions.
Photonics 09 00561 g009
Figure 10. Derivative of the phase shift as a function of wavelength for MDS 60 (a) and MDS 50 (b). The dashed lines are the theoretical functions.
Photonics 09 00561 g010
Figure 11. Dependencies of resonance wavelength (a) and RI sensitivity (b) on RI.
Photonics 09 00561 g011
Table 1. Sensor performance parameters resulting from the reflectance measurements.
Sensor Parameters for Aqueous Analytes
StructureMDS 60 MDS 50
WaveBSW p GW s BSW p BSW s
S (nm/RIU)203.8–370.270.3–161.7295.5–544.3180.7–371.4
FWHM (nm)13.32.7102
D0.960.780.960.44
FOM (RIU 1 )9.2–26.720.3–52.128.4–52.339.8–81.7
Table 2. Sensor performance parameters resulting from the phase measurements.
Sensor Parameters for Aqueous Analytes
StructureMDS 60 MDS 50
WaveBSW p GW s BSW p BSW s
S (nm/RIU)131.4–459.070.5–193.7337.2–482.5220.1–302.9
FWHM (nm)41121–2.1
FOM (RIU 1 )32.85–114.7575.5–193.728.0–40.2104.8–302.9
Publisher’s Note: MDPI stays neutral with regard to jurisdictional claims in published maps and institutional affiliations.

