
Investigation of Low-Frequency Phenomena within Flow Pattern in Standard Mixing Vessel Induced by Pitched Blade Impeller


1
ENEXPro, Ltd., 158 00 Praha, Czech Republic
2
Institute of Thermomechanics AS CR, 182 00 Praha, Czech Republic
3
Department of Power System Engineering, Faculty of Mechanical Engineering, University of West Bohemia, 306 14 Plzeň, Czech Republic
*
Authors to whom correspondence should be addressed.
Processes 2021, 9(3), 545; https://doi.org/10.3390/pr9030545
Submission received: 20 February 2021
/
Revised: 15 March 2021
/
Accepted: 16 March 2021
/
Published: 19 March 2021
(This article belongs to the Special Issue Advances in the Chemical Mixing Process)
Abstract
:An experimental study on the flow pattern dynamics in a standard mixing vessel with radial baffles filled with water and induced by a pitched blade impeller pumping downward is presented. Investigation is mainly focused on detection and analysis of quasi-periodical or periodical low-frequency phenomenon connected with time- and length-scales considerably exceeding the Blade Passage Frequency (hereinafter BPF) and common turbulent eddies. This phenomenon, which is expressed as large-scale mean-flow variations, is generally known as flow Macro-Instability (hereinafter MI). It could break-down just below the liquid surface, or it crashes to the liquid surface and causes its Macro-Swelling (hereinafter MS). Our investigation was based on classical two-dimensional (2D) Particle Image Velocimetry (hereinafter PIV) measurement within 3 selected vertical planes in the vessel and subsequent analysis of the velocity field. The dominant frequencies evaluated in the selected points and overall analysis of the quasi-periodical macro-flow pattern behavior is to be shown. Identification of the quasi-periodical substructures appeared within the flow pattern was performed using the Oscillation Pattern Decomposition (hereinafter OPD) method. Observation of the macro-flow patterns confirmed presence of the macro-flow structures detected within flow pattern at the identical mixing pilot plant setup by previous investigations of the MIs phenomenon, i.e., the primary circulation loop and strong impeller discharge jet located in the lower vessel segment and the strong ascending wall current at the baffle, which break-down below the surface very often. A further important contribution of the presented work is the investigation of both flow pattern within the baffles vicinity and in the middle of the sector far from the baffle, showing a significant difference. Low-frequency periodical (or quasi-periodical) behavior of the investigated macro-structures was qualitatively confirmed by the presented results and it was quantified using the velocity dominant frequencies evaluation, as noted below. This frequency analysis brings insight into the supposed and detected interconnections between dynamics of the adjacent flow structures. Detected different flow patterns within the main plane near the baffles and in the inclined plane reveal a strong influence of the baffle presence to the local vertical flow, especially within the upper part of the vessel. Quite a different flow pattern appears tangentially in front of and behind the baffle, where a wake is revealed, indicating significant influence of the baffle on the local tangential flow. The new findings represent a contribution to better understanding the physical phenomena behind the standard mixing process.
1. Introduction
The presented contribution deals with an experimental investigation of the flow pattern dynamics in a standard mixing vessel with radial baffles filled with water at room temperature and induced by a pitched blade impeller pumping downward. There is a hypothesis on the existence of so-called macro-instabilities (MIs) in such flows characterized by the frequencies order of magnitude lower than any other flow phenomenon present, such as the impeller blade frequency or frequency associated with vortices created by the Kelvin-Helmholz instability of shear layers [1]. The hypothesis of the role of macro-instabilities in the mixing process was formulated by the authors of Reference [2]. This phenomenon has non-negligible influence on mixing effectivity and due to its proven force effect as well on the dynamics load of the whole mixing device (vessel including baffles, shaft, and impeller). Therefore, the detailed knowledge of this phenomena can help to optimize positioning of the application (injection) of mixed phase for a purpose of faster dispersion as well as to optimize design of all parts of the mixing devices with respect to mixing time, energy savings and total load minimization. It is obvious that all of these aspects contribute to lowering of mixing expenses (which, globally, reach up to several million dollars yearly). There are both experimental [1,2,3,4,5] and mathematical studies in the literature. The mathematical modelling typically uses the turbulence modelling approach [6], but recently, there are attempts to apply the direct numerical simulation technique [7].
The time-resolved Particle Image Velocimetry (hereinafter PIV) method is the natural choice for the applied experimental technique, as we need to study both topology and dynamics of the flow. Several examples of application of this method on mixing process could be found in the literature, e.g., References [4,5,8].
The results of the presented measurements and subsequent analysis confirmed the existence of and provided more details on the macro-dynamic flow behavior, which was identified and described in previous publications [2,3,6,8,9,10,11,12,13,14,15,16]. This overall macro-flow pattern behavior can be described as follows:
The dominant structure in the lower part of the vessel is the so-called primary circulation loop (hereinafter PCL) induced by the impeller discharge jet and it manifests a quasi-periodical behavior, a single cycle consists of:
- (a)
- PCL generation phase.
- (b)
- Growing phase of the PCL with chaotic flow inside the core.
- (c)
- Oscillation of the developed PCL.
- (d)
- Disintegration of the upper part of the PCL followed by the chaotic flow domination within the whole lower part of the vessel. It was shown that the PCL can reach up to approximately 2/3 of the height of the liquid column.
The other significant structure here is obviously the impeller discharge jet itself, whose intensity alternates from pure induction of the PCL to impinging the vessel bottom or wall depending on the system geometry.
It was observed that this jet induces the Macro-Vortex (hereinafter MV) at the middle bottom of the vessel with opposite circulation relative to the PCL.
Concerning the upper part of the vessel, there is dominant quasi-periodical manifestation of intensive vertical wall ascent current adjacent (connected) to the outer side of primary circulation.
The structure generated after the separation of this ascent current from primary circulation was identified as so-called Flow Macro-Formation (FMF) [2]. This FMF moves predominantly vertically upward towards the liquid surface and then behaves two-fold. Either it can be disintegrated just below the liquid surface or it crashes to the liquid surface, causing its macro-swelling (hereinafter MS). Eventually, generated FMF can form a macro-vortex (whether with clockwise or with counterclockwise rotation) with similar behavior.
Previous works reported that this MS manifested itself exclusively within the baffle area, respectively tangentially to the front of baffle regarding the impeller direction revolution [1,12].
In the upper part close to the middle of the vessel, the impeller liquid suction is dominating, and therefore, there is manifestation of the downward current subsequently connecting to the inner side of the PCL.
The main goal of this work is to prove, specify and possibly extend the MIs hypothesis and evaluate dominant frequencies and other characteristics of the quasi-periodical behavior of the above-described macro-structures. It is well-known that the flow-field within the mixing vessel consists of a broad spectrum of eddies from the size of primary circulation of the agitated batch down to the micro-scale dissipation vortices reaching the Kolmogorov scale of turbulence [17]. Our investigation is mainly focused on detection and analysis of quasi-periodical and/or periodical low-frequency structures, which are characterized by the time- and length-scales considerably exceeding those connected with the Blade Passage Frequency (BPF) and common turbulent eddies. This phenomenon is known as flow Macro-Instability (MI) and its large-scale mean-flow variations may affect the structural integrity of the mixing process and even the vessel itself. The former studies of MI were based on various experimental techniques, such as the simple visualization of the flow inside the vessel or liquid surface, Laser Doppler Anemometry point measurements, profile measurement using PIV, dynamic force detection by moving target, computer fluid dynamics simulation of flow, tracking particle method, or pressure measurements using various transducers [2,9,10,11,12]. Depending on the method used, only specific manifestation of this phenomenon was addressed: macro-swelling of liquid surface, change of complex flow pattern, force effect on internals (baffles), or pressure effect on the bottom and the wall of the vessel, etc.
2. Experimental Setup and Methods
The experiments were carried out in the Laboratory of Turbulent Shear Flows, Institute of Thermomechanics, Czech Academy of Sciences. The Pitch Blade Turbine (hereinafter PBT) mixing device was used.
2.1. Vessel Model
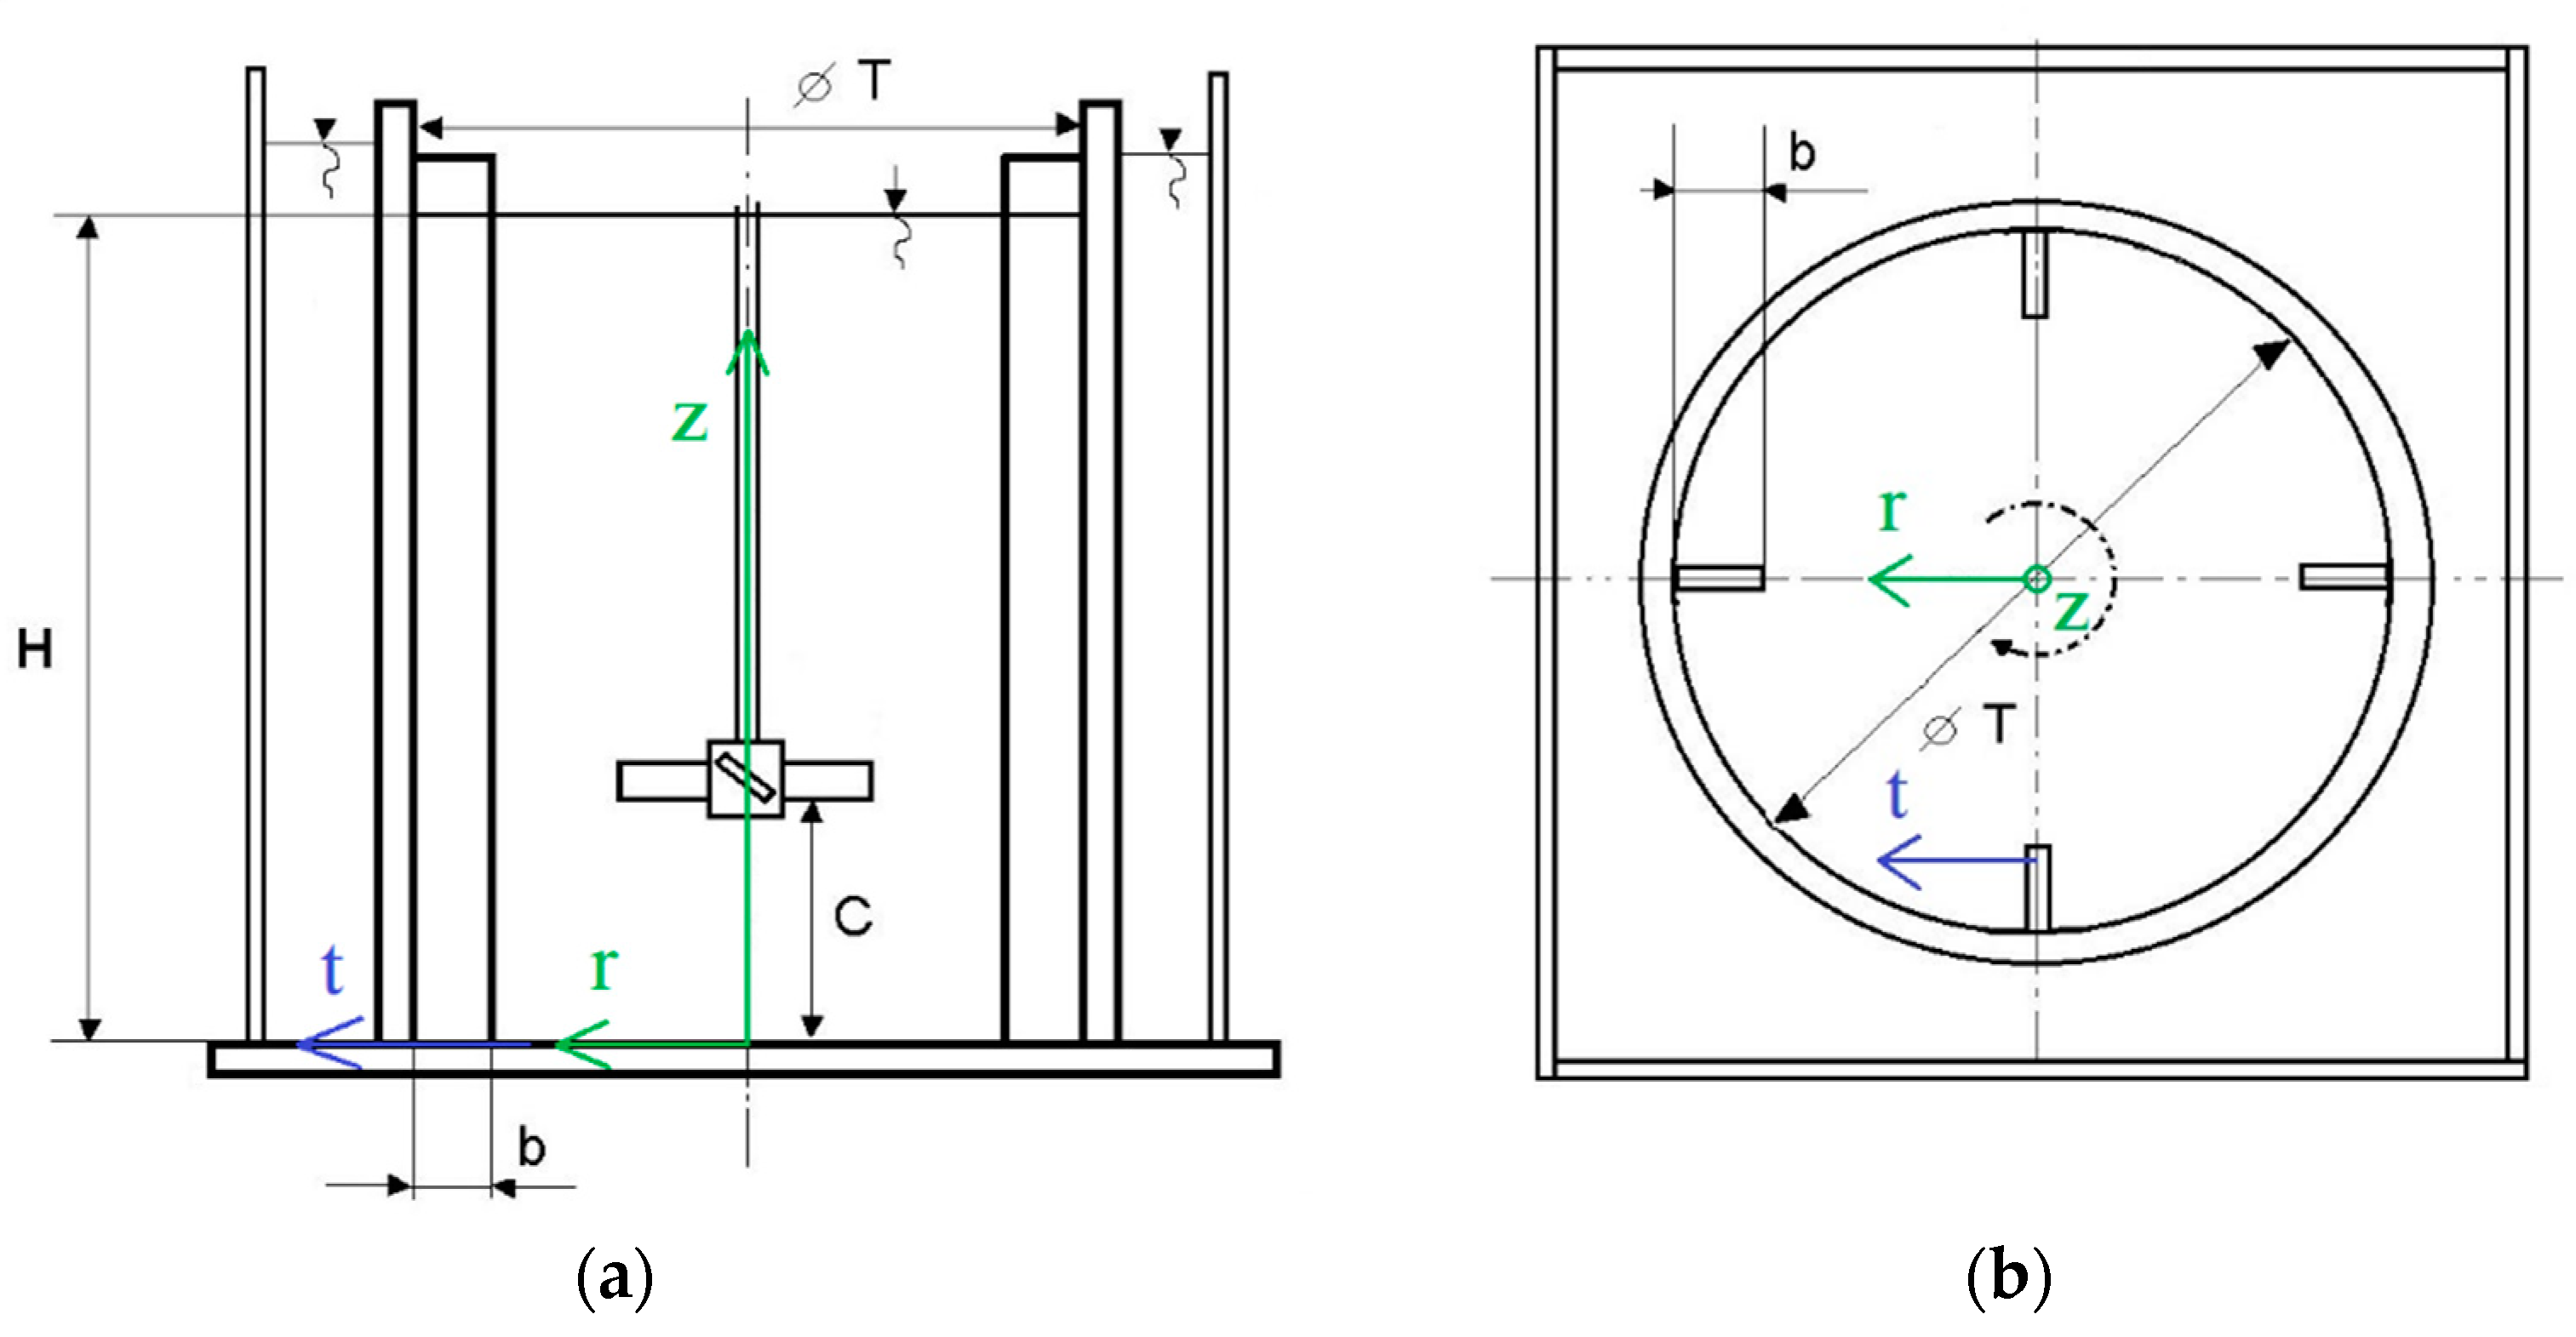
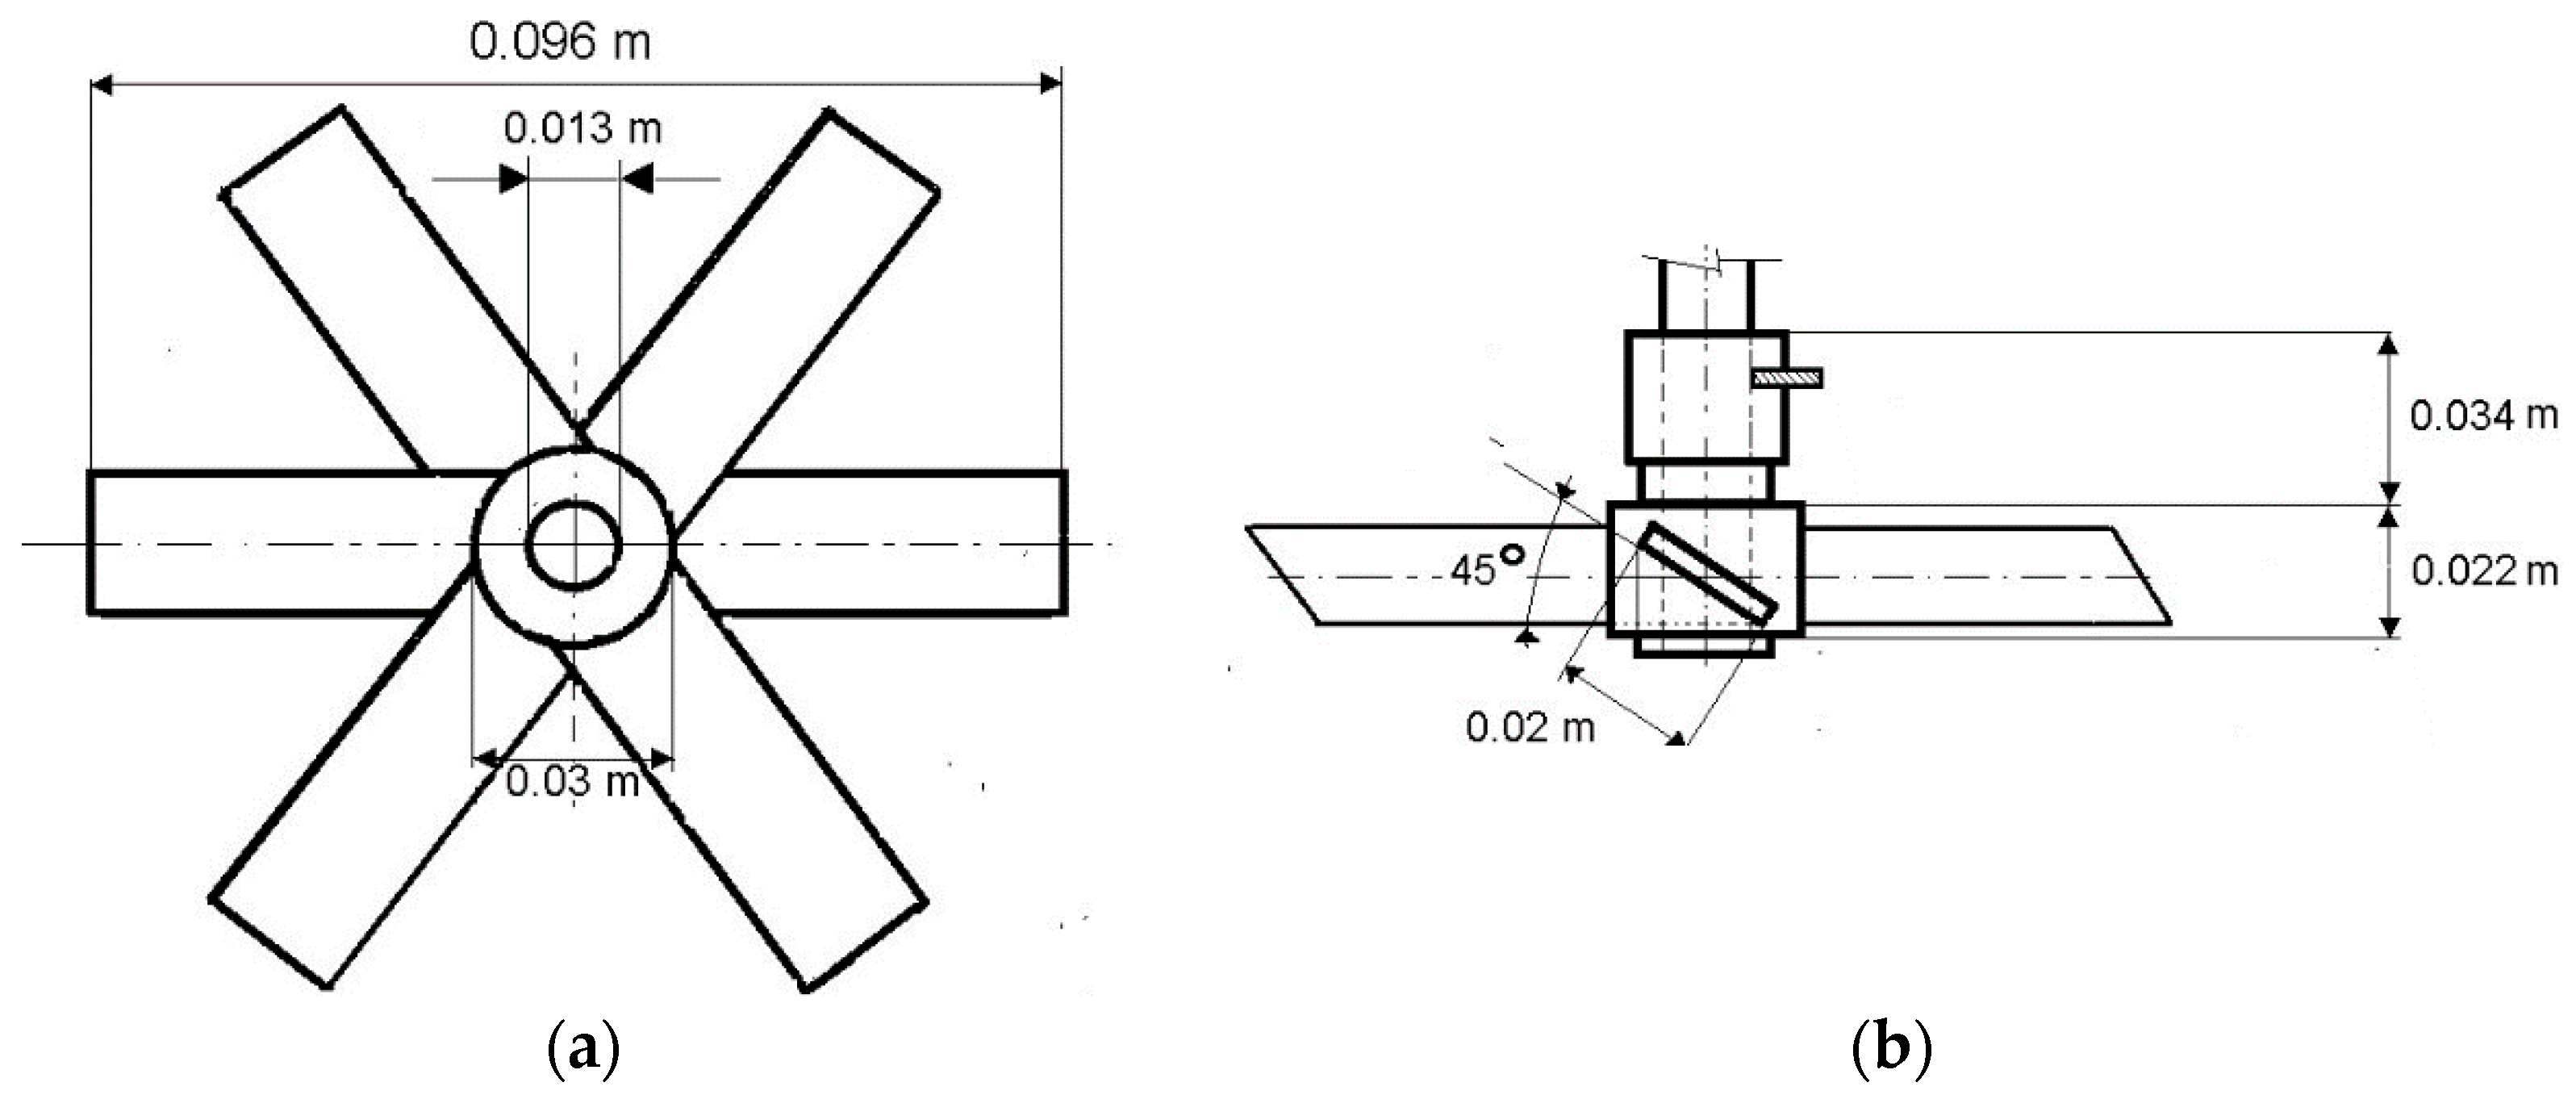
The experiments were performed in a flat-bottomed cylindrical stirred tank of inner diameter T = 0.24 m, filled with water at room temperature, with the liquid level height H = T. The vessel was equipped with four radial baffles with width b = 0.1 T and stirred with the six pitched blade impeller (pitch angle = 45°, diameter D = 0.4 T, width of blade w = 0.02 m, pumping downwards). The impeller speed was adjusted to Nimp = 400 rpm = 6.67 s−1 and its off-bottom clearance C = D. The schematic view of the mixing vessel is shown in Figure 1, and the impeller detail is shown in Figure 2.
In Figure 1, the Cartesian coordinate system is introduced consisting of radial, axial, and tangential coordinates, r, z, and t, respectively. The origin of the coordinate system is placed in the center of the bottom wall.
The velocity component U is in radial direction (r), V in axial direction (z), and T in tangential direction (t). Furthermore, the radial plane component L is defined as follows:
For the sake of compatibility of our results with older works, we introduce dimensionless quantities. The dimensionless coordinates:
The dimensionless velocities:
The kinetic energy (TKE) is defined using the radial and axial velocity components only, the third velocity component is supposed to be approximately the mean of the two considered:
Its dimensionless form, TKE′, is:
For the same purpose, the frequency, , is also defined in dimensionless form, :
The corrected mixing Strouhal number, , is defined in the following form:
The Reynolds mixing number, , is defined as follows:
In our case, the impeller revolution frequency is Nimp = 6.67 s−1, then the corresponding blade tip velocity, Vtip, was 2.01 ms−1, water viscosity ν = 10−6 m2 s−1, impeller diameter D = 9.6 × 10⁻² m, and the Reynolds mixing number ReM = 1.93 × 10⁵.
According to (Reference [18] Figure 12), where the authors investigated conditions of transition to turbulence within these setups, the fully turbulent regime is supposed reach to axial coordinate z/T = 0.81, and the corresponding z′ equals to 4.02.
As was found in previous publications [2,9,10,11,12,13] within this regime characterized by the similar ReM, the MI-related frequencies are directly proportional to Nimp, i.e., F′ = constant, with its value in the range 0.02−0.186 for different MIs.
It is necessary to emphasize that this analysis concerns one sector of four formed by four baffles in the mixing vessel. Based on the assumption of phase independence, the statistical homogeneity of flow macro-dynamics within each sector was proven in References [1,17]. Therefore, the presented macro-structures’ frequency values are to be considered as quadruple for the whole vessel.
2.2. Instrumentation and Methods of Analysis
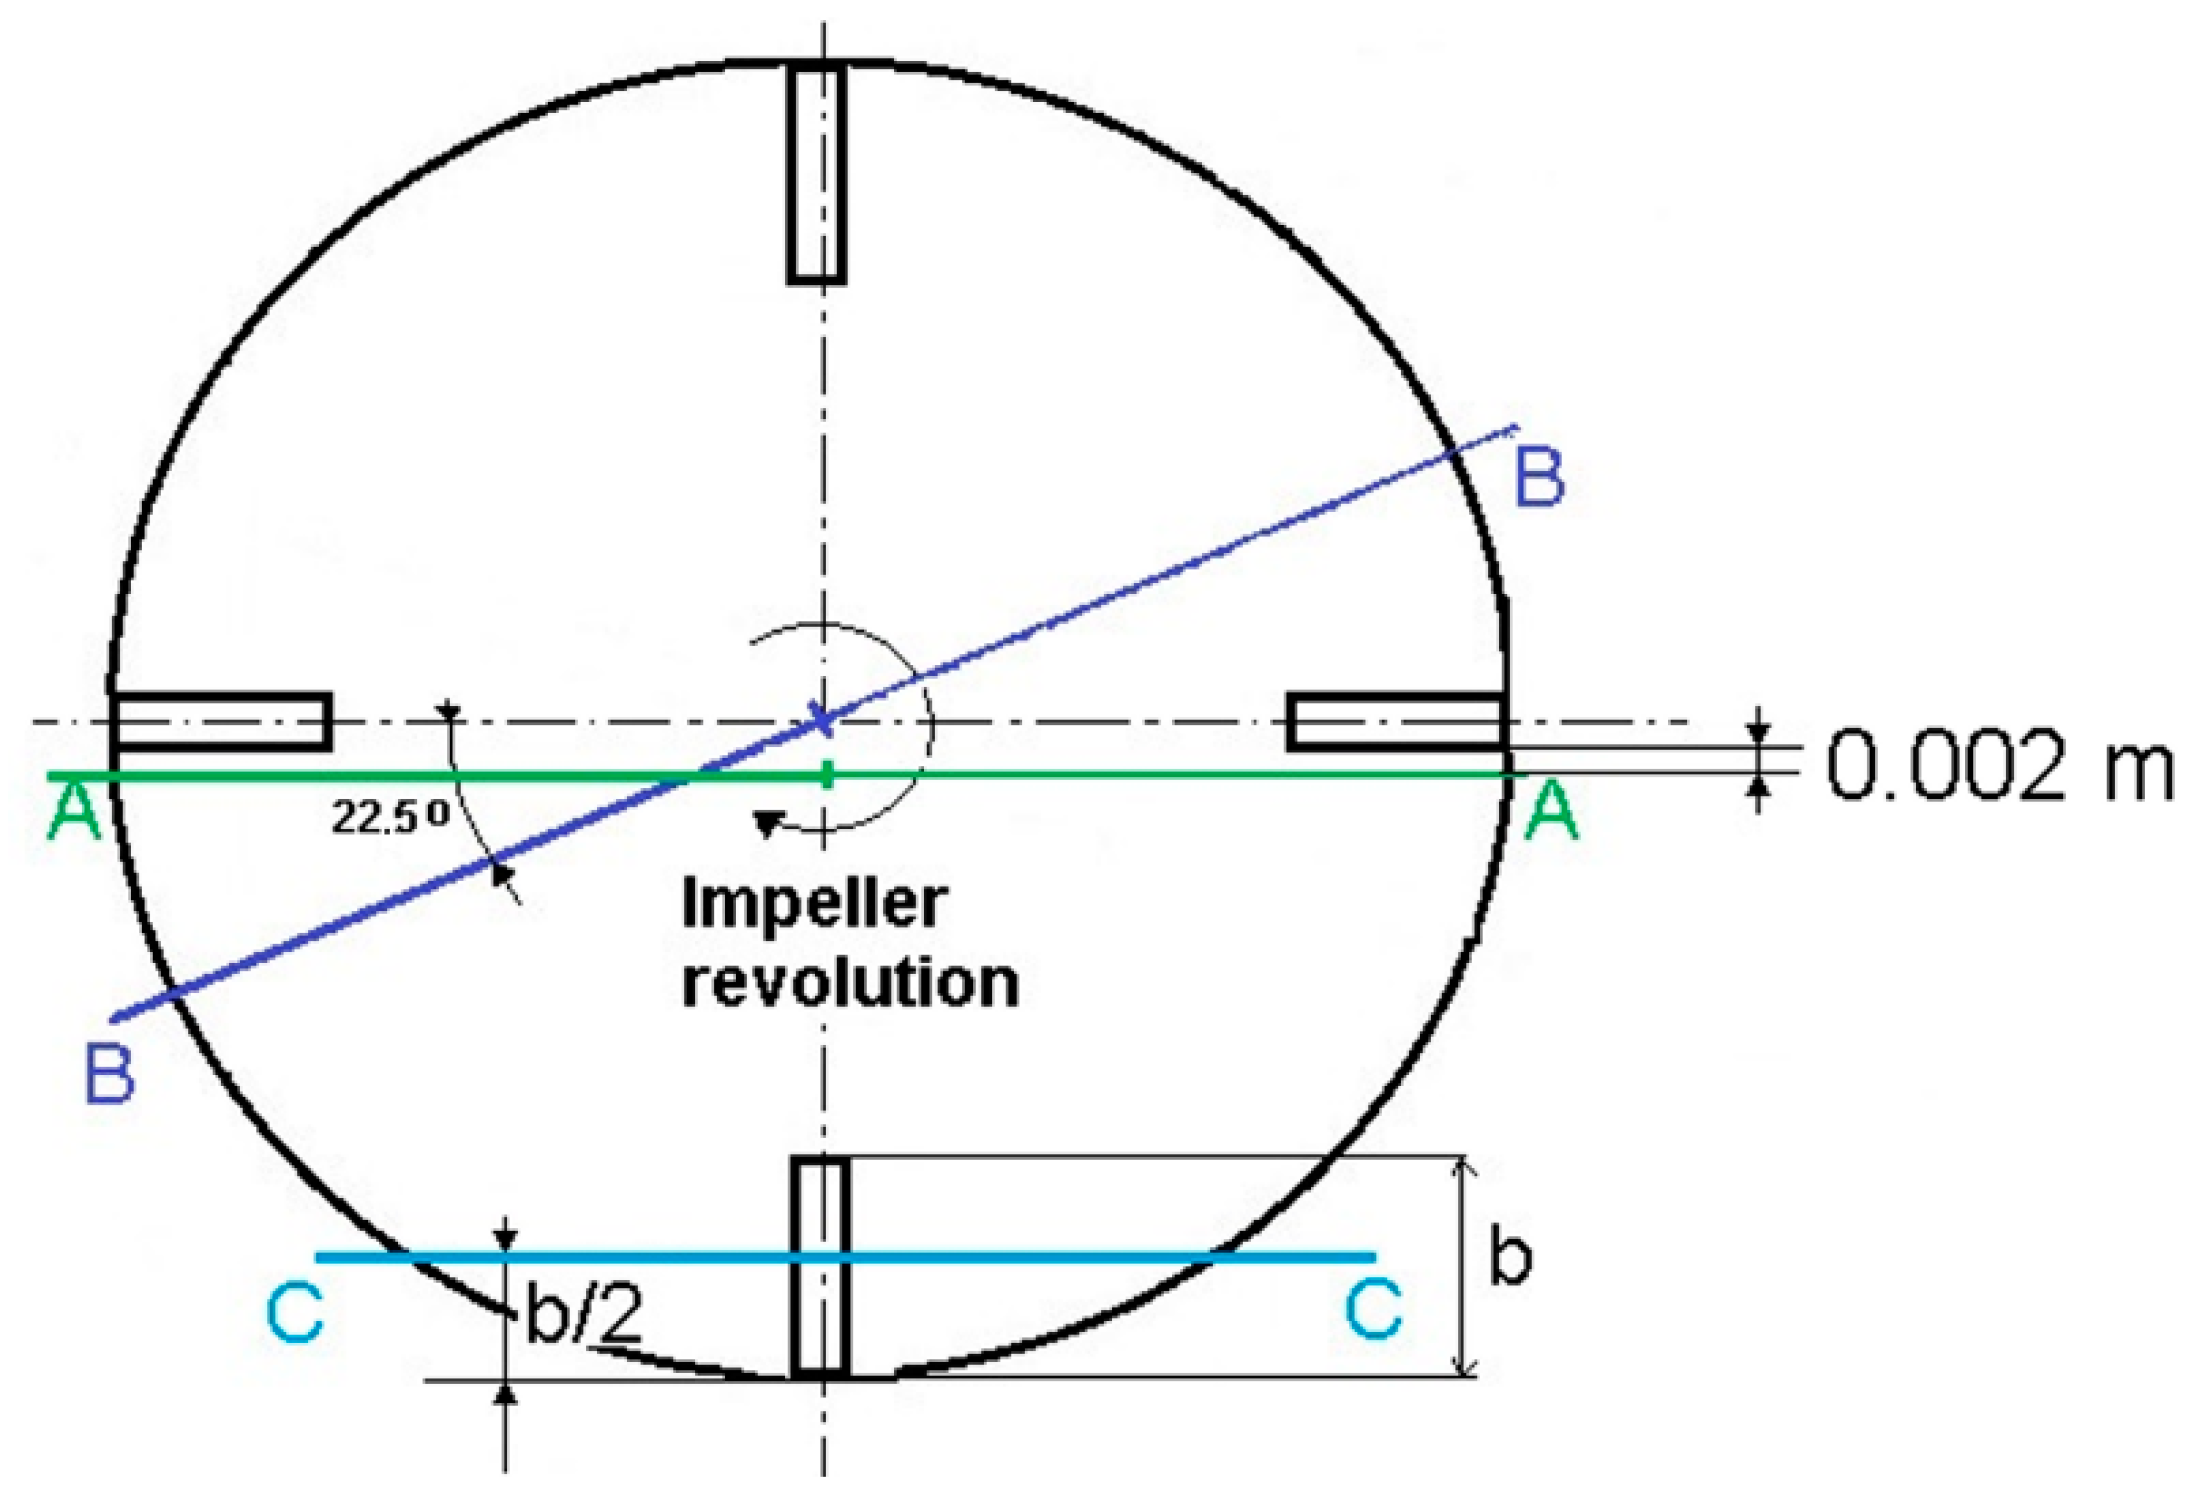
The 2D PIV measurements were carried out within the 3 selected planes of measurement (or half-planes) as follows:
- The plane A-A is located near the vessel center just in front of the opposite baffles.
- The plane B-B is passing through the vessel center at the angle of 22.5° with respect to the plane of the opposite baffles.
- The plane C-C is crossing the baffle.
The planes of measurement are shown in Figure 3.
The planes A-A and B-B were measured separately for lower and upper segments, while only the upper part of the C-C plane was explored. The laser light was introduced from the side. The cylindrical vessel was immerged in the rectangular one, and the gap was filled by water, see Figure 1. So, the laser sheet was introduced into the water area through the planar wall perpendicularly and the camera used on the other planar wall, to avoid the optical distortion effect. The thickness of the laser sheet was about 1 mm.
The PIV system used for the measurement consists of a laser and camera, by Dantec company. The double-head laser New Wave Pegasus with wavelength of 527 nm, maximal frequency 10 kHz, shot energy is 10 mJ (for 1 kHz), and corresponding power is 10 W per one head. The camera Phantom V611 with resolution of 1280 × 800 pixels can acquire double-snapshots, with frequency up to 3000 Hz (full resolution), and it uses internal memory of 8 GB. The data were acquired and post-processed in the DynamicStudio software by Dantec.
Two measurements of each region were performed, one acquisition record for statistics evaluation in frequency 21 Hz containing 1200 double-snapshots representing 57 s in real time, and the other record to study high-frequency dynamics in frequency 501 Hz containing 4000 double-snapshots representing 8 s in real-time only. For study of the MIs, the first record has been used preferably, however we covered the frequency range from 0.02 up to 250 Hz with our data. With respect to the velocities’ magnitudes and optical magnification, the delays between pulses of order of hundreds of microseconds were applied.
As seeding particles, the silver-coated hollow glass spheres were used, having the same density as the water and 10 microns in diameter. The particles’ space distribution was optimized to obtain good-quality optical signal.
The vectors’ evaluation from the double-snapshots was performed using the DynamicStudio software, the “Adaptive PIV” function was used, and the interrogation area of the size 16 × 16 pixels. Description of the used methods could be found in Reference [19]. The instantaneous vector-fields were analyzed. First, statistics were carried out, where the statistical moments were evaluated from each record. Among them were mean values and variances.
In selected points in space, the velocity components’ time-series were subjected to Fourier transform to obtain frequency spectra. From the spectra, dominant frequencies were detected as distinct peaks. However, those characteristics are relevant to local behavior in a given point in space only. To study the dynamical behavior of the flow-field as a whole, the point-by-point method is not appropriate. For this purpose, the Oscillation Pattern Decomposition (hereinafter OPD) has been applied.
The OPD method belongs to the group of spatio-temporal methods—see Reference [17]. The OPD method evaluates the basis representing oscillating modes and it is based on stability assessment of fluctuation patterns in the flow under study. The method results in sets of modes, each of them is characterized by its frequency, damping factor called e-folding time, and the topology. The periodical behavior is supposed with the given frequency and decaying amplitude, and the mean time period for its decay by factor e is given by the e-folding time, τe. Periodicity value is defined as the e-folding time to the mode period ratio; thus, it is a dimensionless quantity. The mode topology is defined by a complex spatial mode. Its real and imaginary parts characterize fluctuating flow patterns shifted by a quarter of a period, respectively. More details on the OPD method can be found, e.g., in References [20,21].
The OPD method has not been applied before on mixing in a vessel, to our knowledge. It can provide information about fine-flow substructures present within a complex flow pattern.
3. Results
The flow-field in the vessel is highly dynamical and turbulent, which is why the flow is unsteady. To describe the flow properly, the statistical methods are to be applied first. Then, the special methods such as OPD to analyze spatio-temporal data are to be used.
3.1. Statistical Analysis
The measuring planes defined in Figure 3 were explored. The acquired time-series of velocity fields were subjected to statistical analysis.
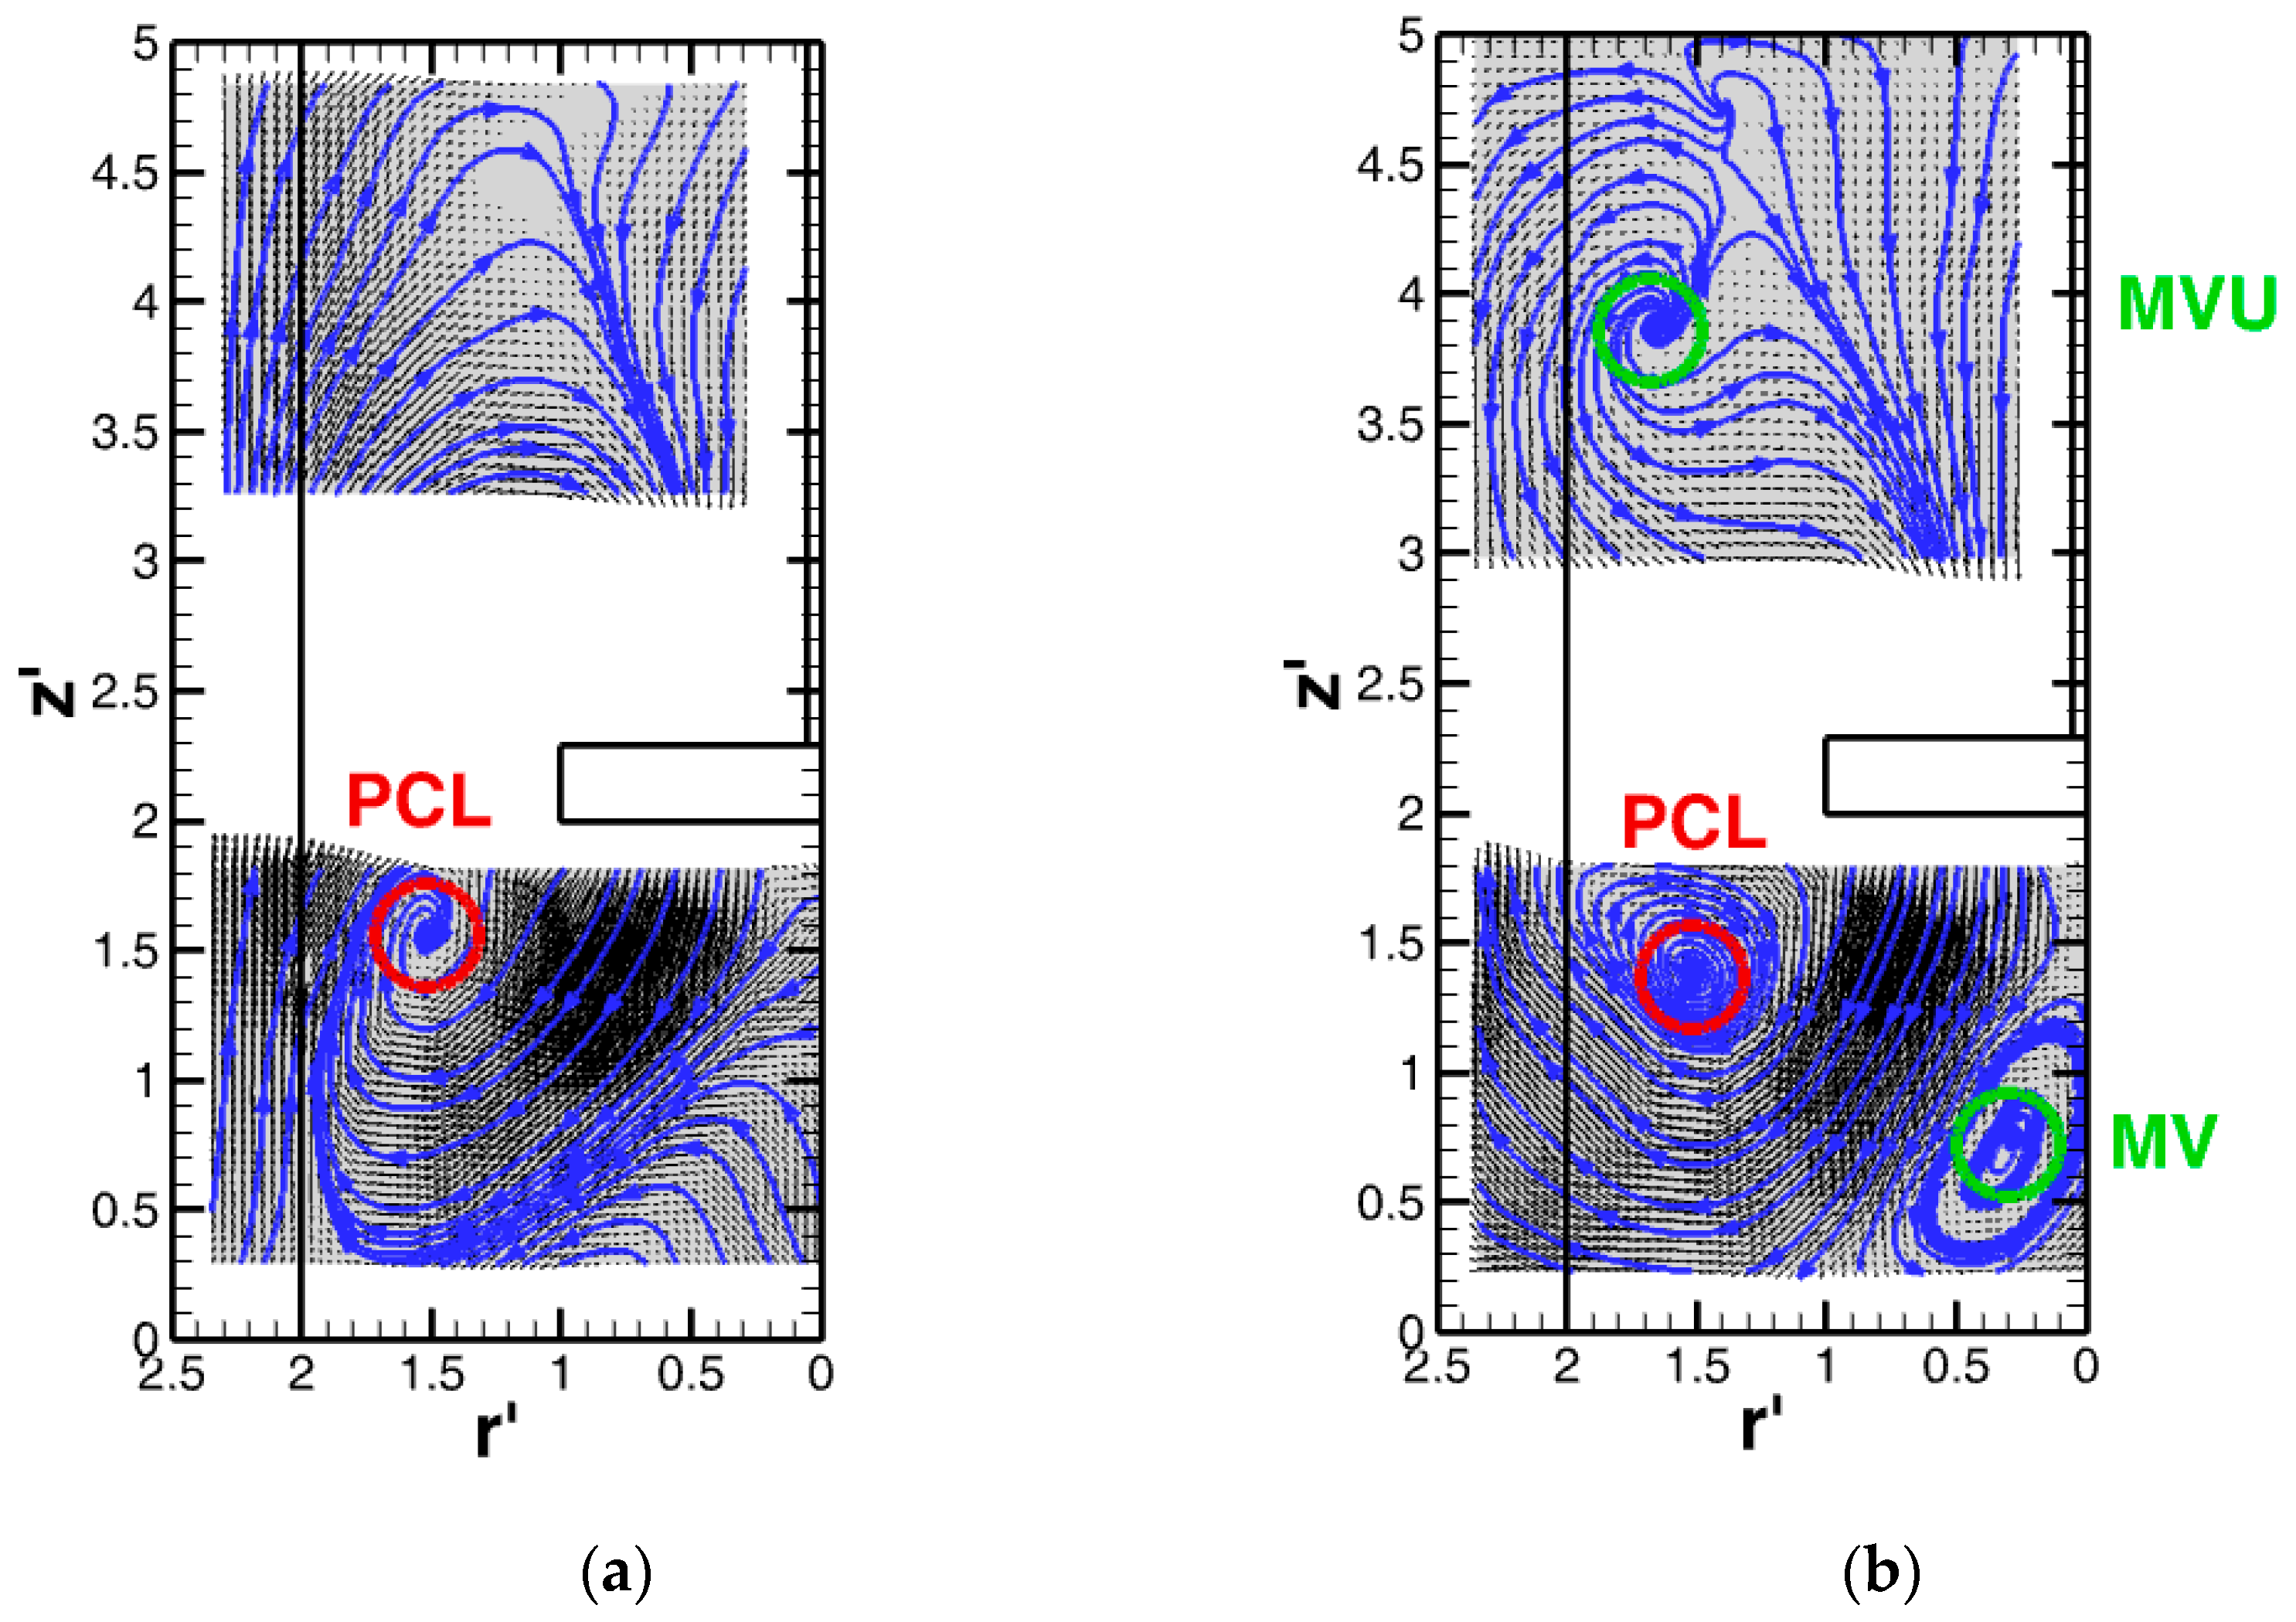
First, the time mean velocity fields are to be presented. The mean flow topologies in the planes of measurement A-A and B-B are shown in Figure 4. The vector fields are shown together with arbitrarily placed vector-lines.
In Figure 4, the positions of Primary Circulation Loop (PCL), Macro-Vortex (MV), and Macro-Vortex-Upper (MVU) are shown.
The flow patterns in the planes A-A and B-B are rather different. The common characteristic is the downwards pointing jet above the impeller towards the impeller center, with an angle of about 30° from the vessel axis, and rising flow close to the vessel casing PCL (i.e., major vertically oriented vortex with chaotic core area) in the channel beside the impeller, with its center in position (1.5,1.5). In addition, the B-B plane shows smaller vortex MVU in the upper part in the region of the jet formation. In the plane B-B, the above-mentioned strong vortex MV with opposite orientation to the PCL is located at the position (0.3,0.7) below the impeller central part.
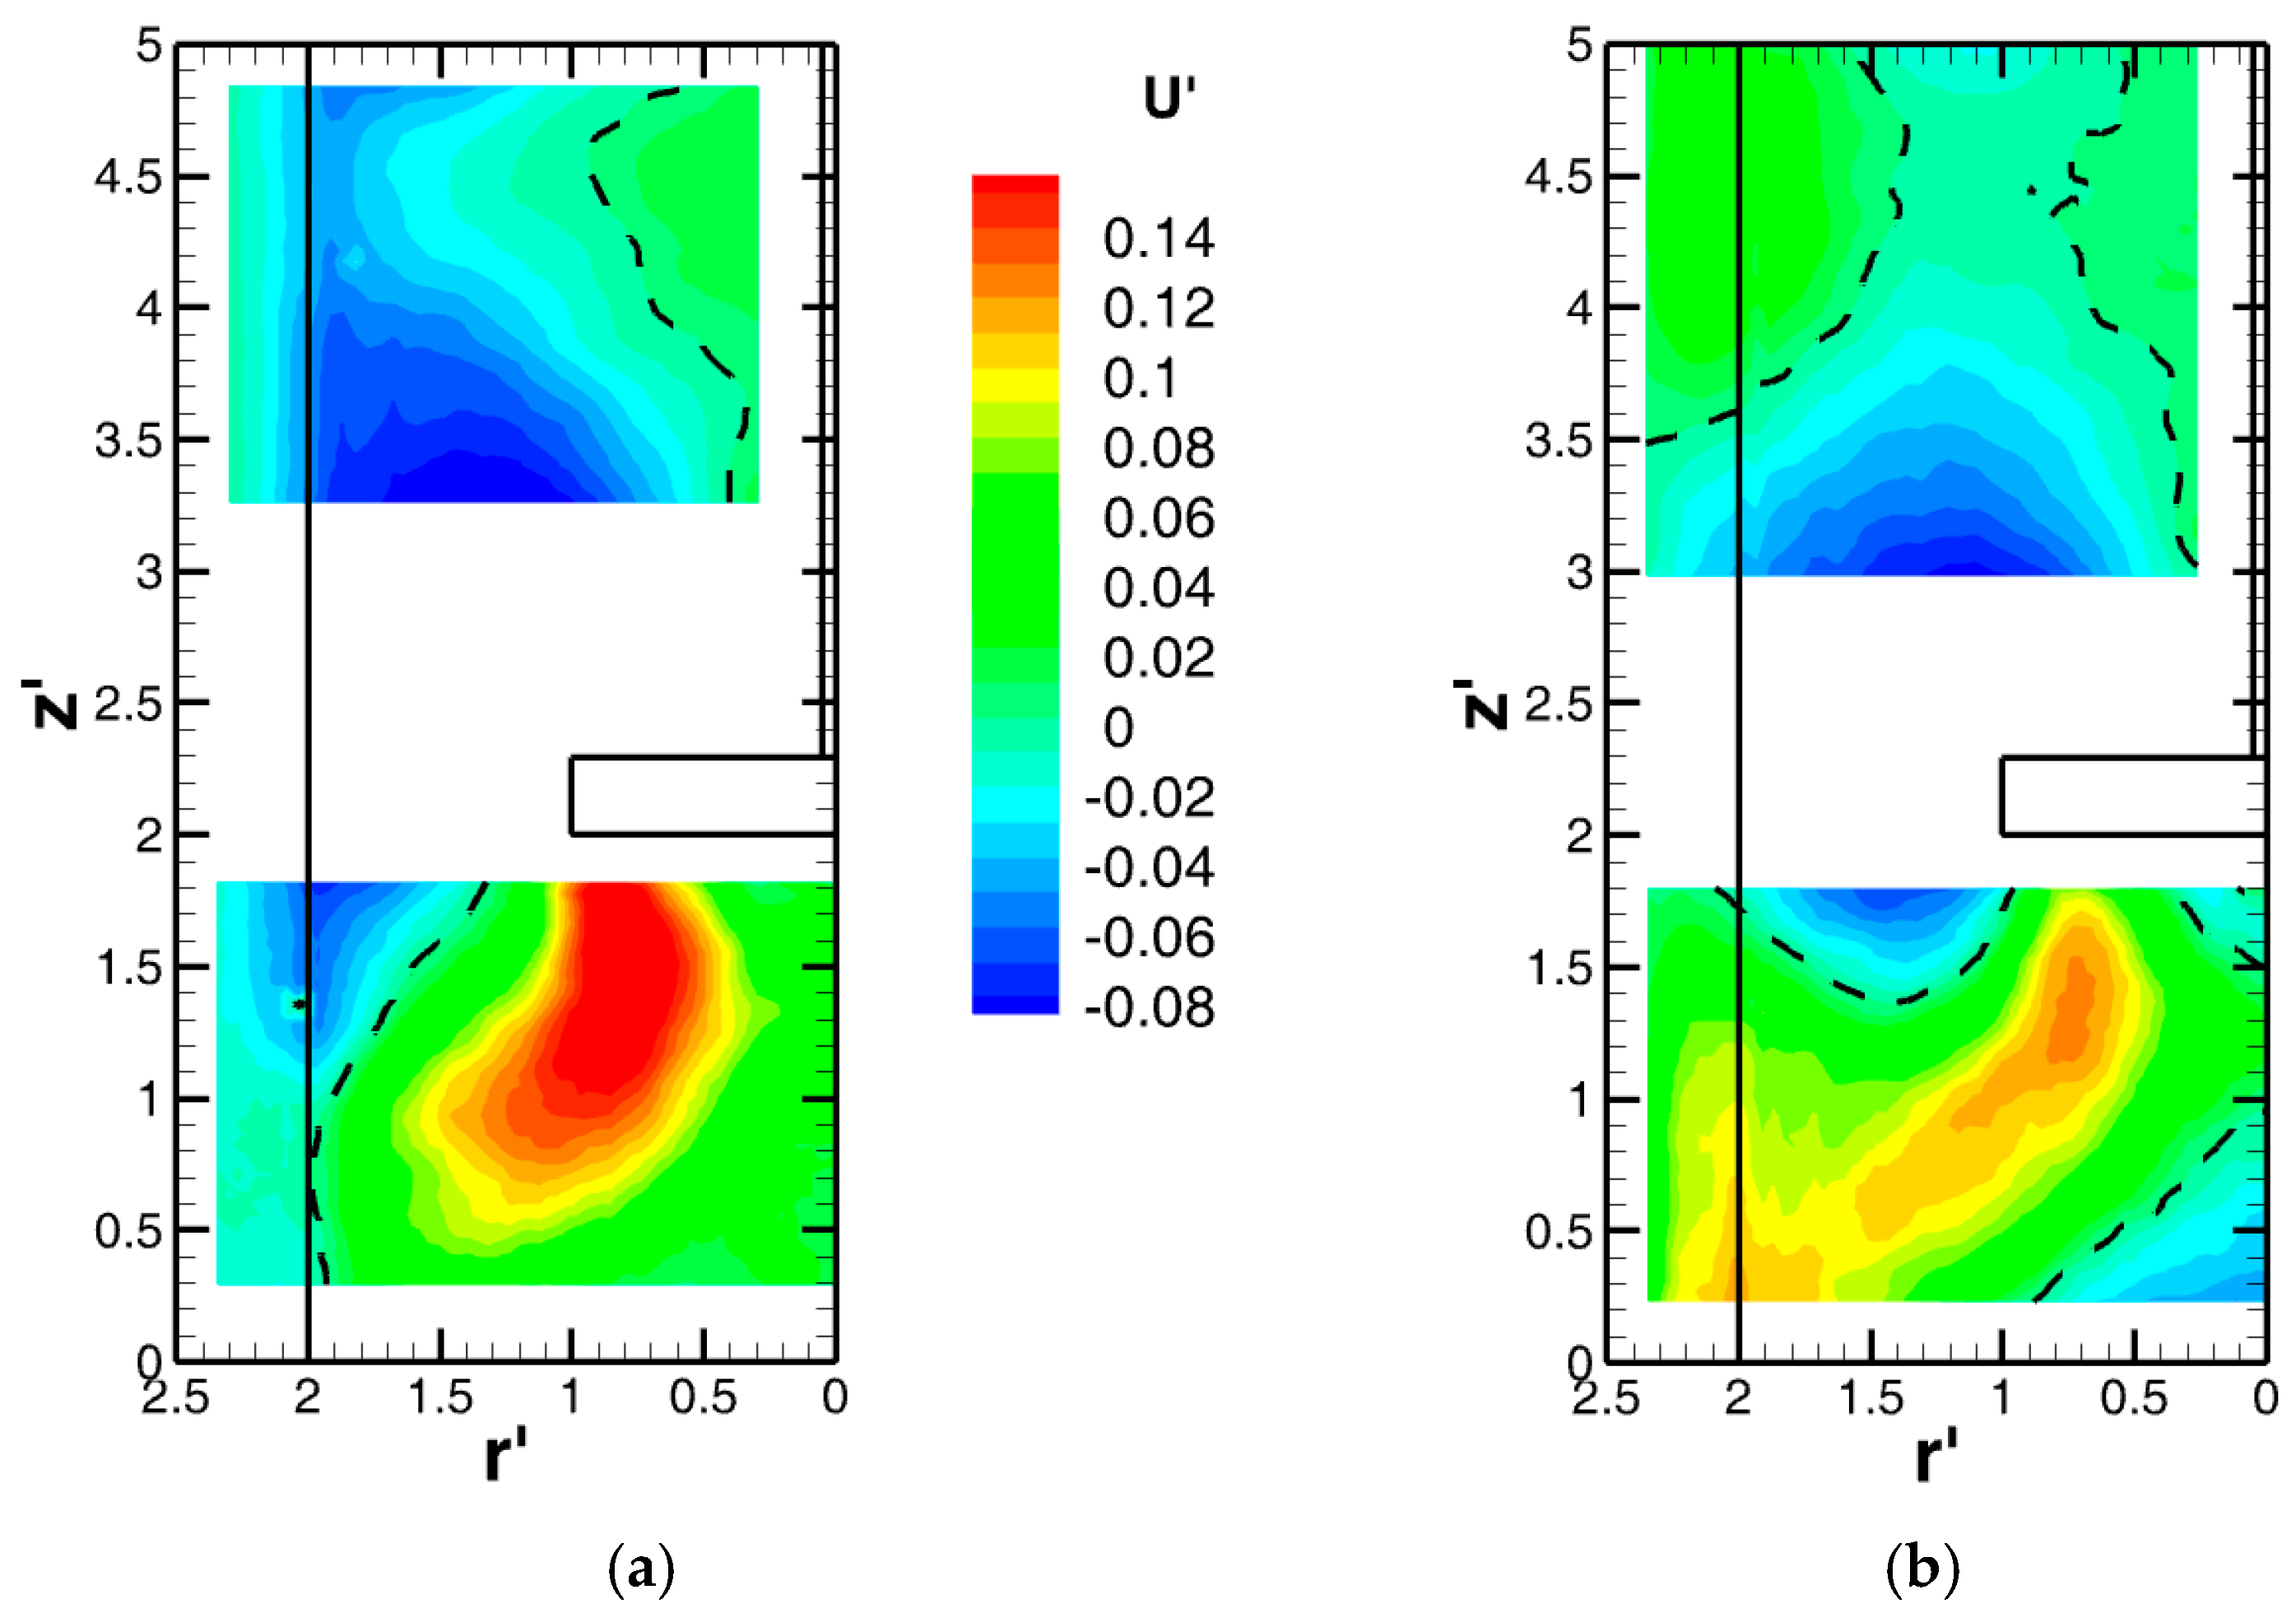
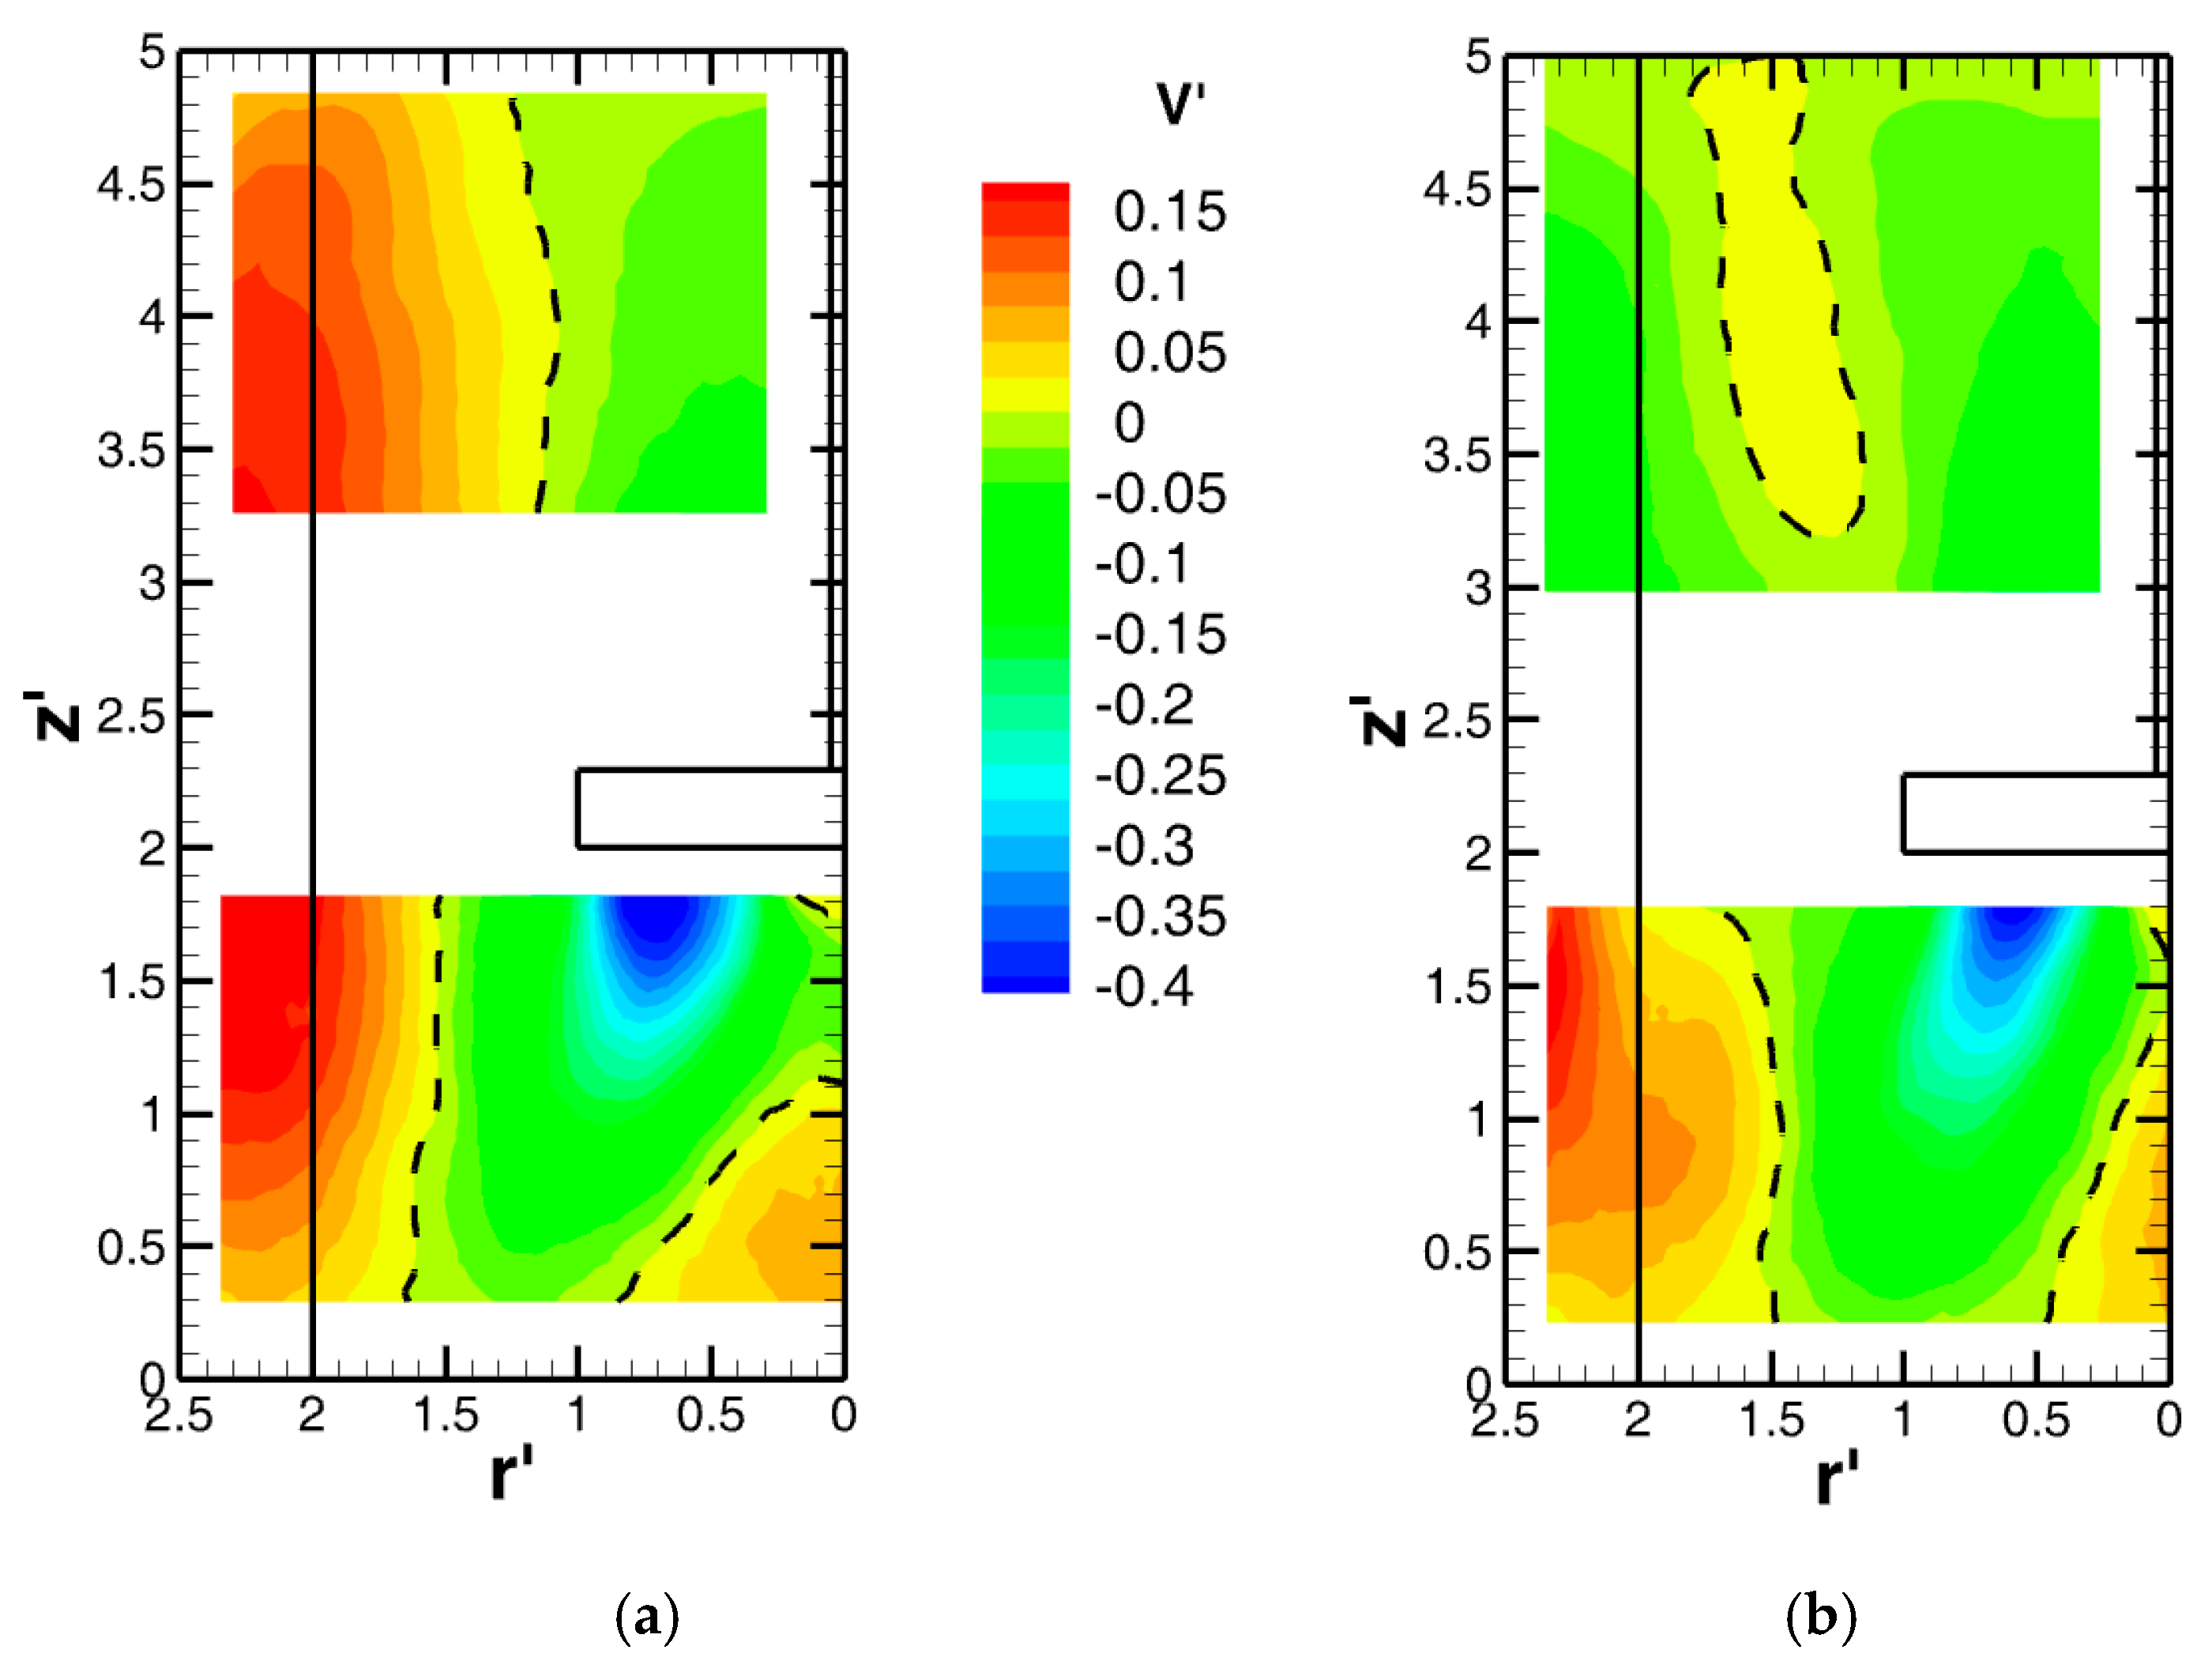
In Figure 5 and Figure 6, the horizontal and vertical mean velocity components U’ and V’ distributions are shown, respectively. The black broken line denotes vanishing quantity, at zero value.
The upper part of the vessel flow patterns in the planes A-A and B-B are rather different, which will be described in detail later. The PCL is not symmetrical, its axial part is significantly more intensive that its radial ones, which is due to the influence of the ascent wall current and sucking impeller current. A strong ascent wall current with an intensity that significantly exceeds the adjacent PCL is significant for the A-A plane flow pattern.
The mean flow pattern is represented in Figure 4, Figure 5 and Figure 6, where the mean height of the PCL reached up to z′ = 3.76, i.e., close to 2/3 of the liquid surface height z′ = 5, and a similar mean height of the PCL was reported in previous work [14].
Strong wall ascent flow is detected in the plane A-A, see Figure 6. It reaches the liquid surface vicinity, where it bends inwards. Concerning its radial position here, the mean radial coordinate is almost identical as that in the lower part (around r′ = 2.19), while close to the wall, it fades away. This finding is in good agreement with the results of a previous paper [12], where analysis of liquid surface swelling was carried out. The authors claimed that the mean maximal liquid swelling is present within the interval of dimensionless radial coordinate r′ = 2.5 − 0.375 = 2.125 to 2.5 − 0.75 = 1.75, while close to the wall, it is significantly smaller.
In the plane of measurement B-B, the ascent wall flow is present only in the lower part, while in the upper part, it vanishes, even descent flow is detected here.
Further, it is possible to detect lower velocity magnitude around the vertical axe of PCL (bending from upwards to downwards), as well as the expected higher velocity magnitude at the right upper part of PCL influenced by impeller sucking.
The radial velocity component distribution, U′, in Figure 5 shows that intense outward flow appears predominantly within the impeller discharging area. On the other hand, significant inward flow is present mainly within the wall ascent current (gradually from bottom to top, bending inwards) and as expected, at the upper margin of primary circulation.
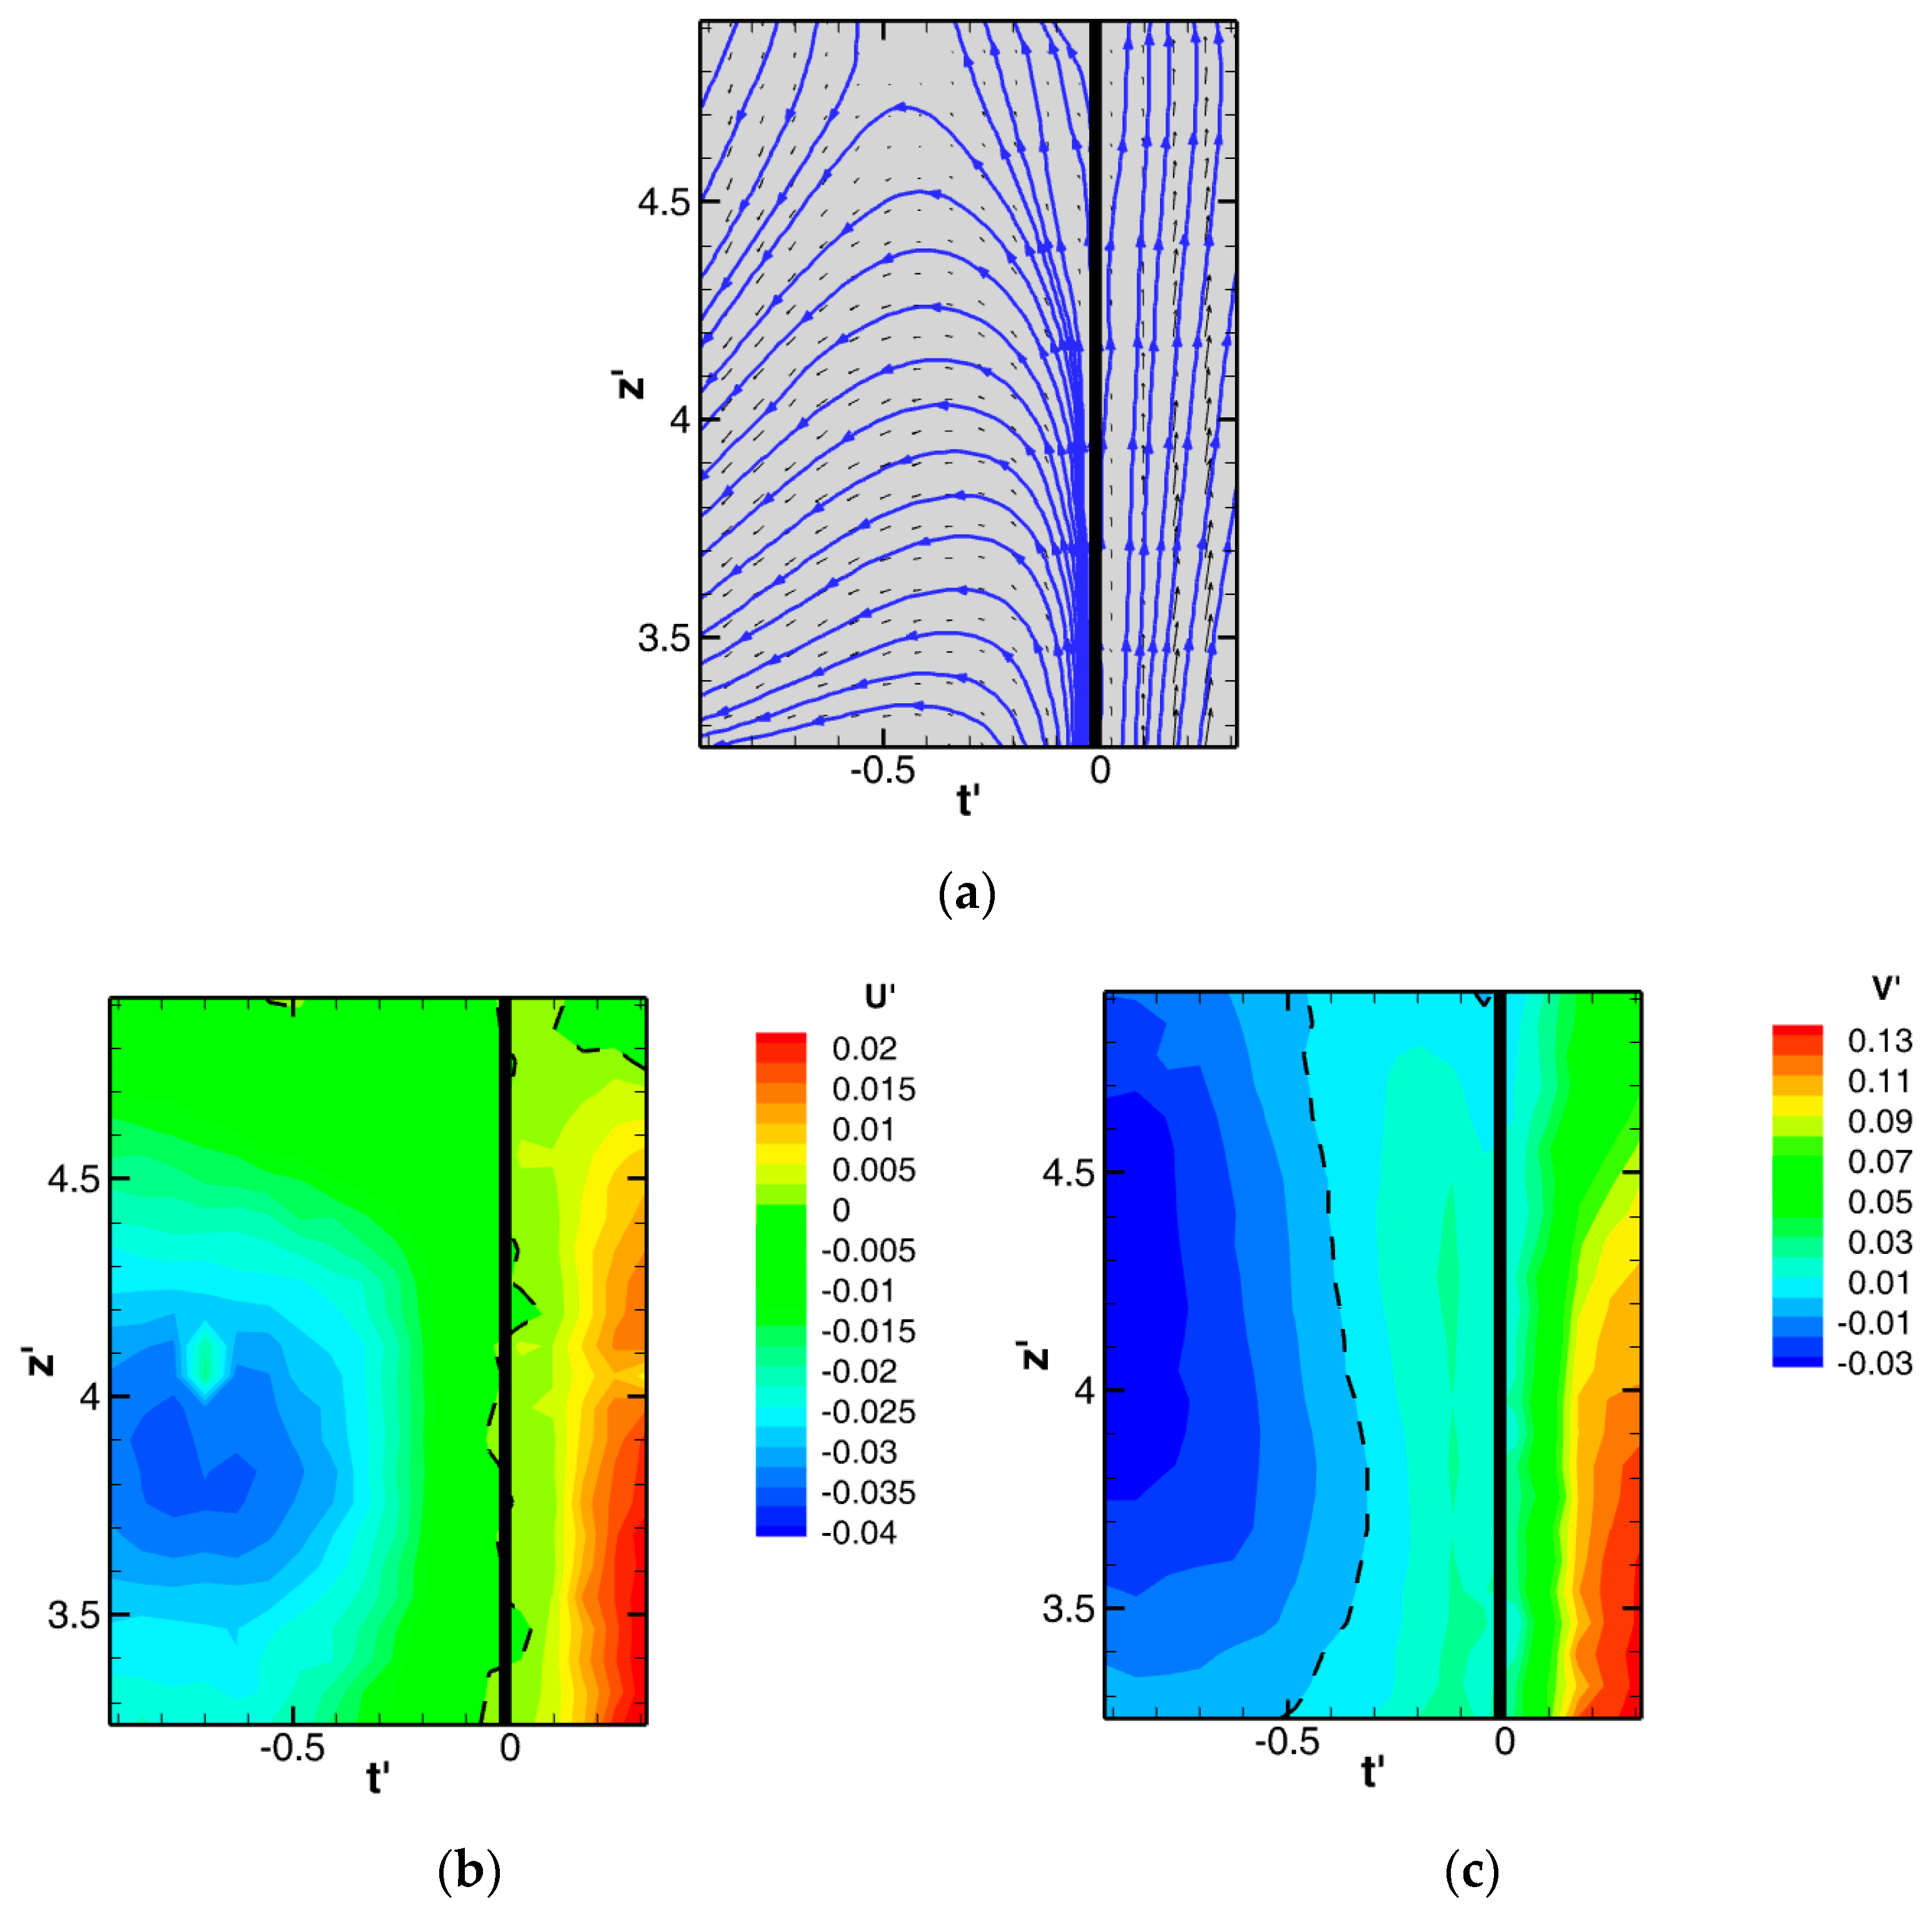
Figure 7 shows the detail of the flow pattern close to the baffle, for the plane of measurement C-C.
The flow close to the baffle is strongly ascending on both sides, and behind the baffle (the left-hand side), the back-flow wake is distinct.
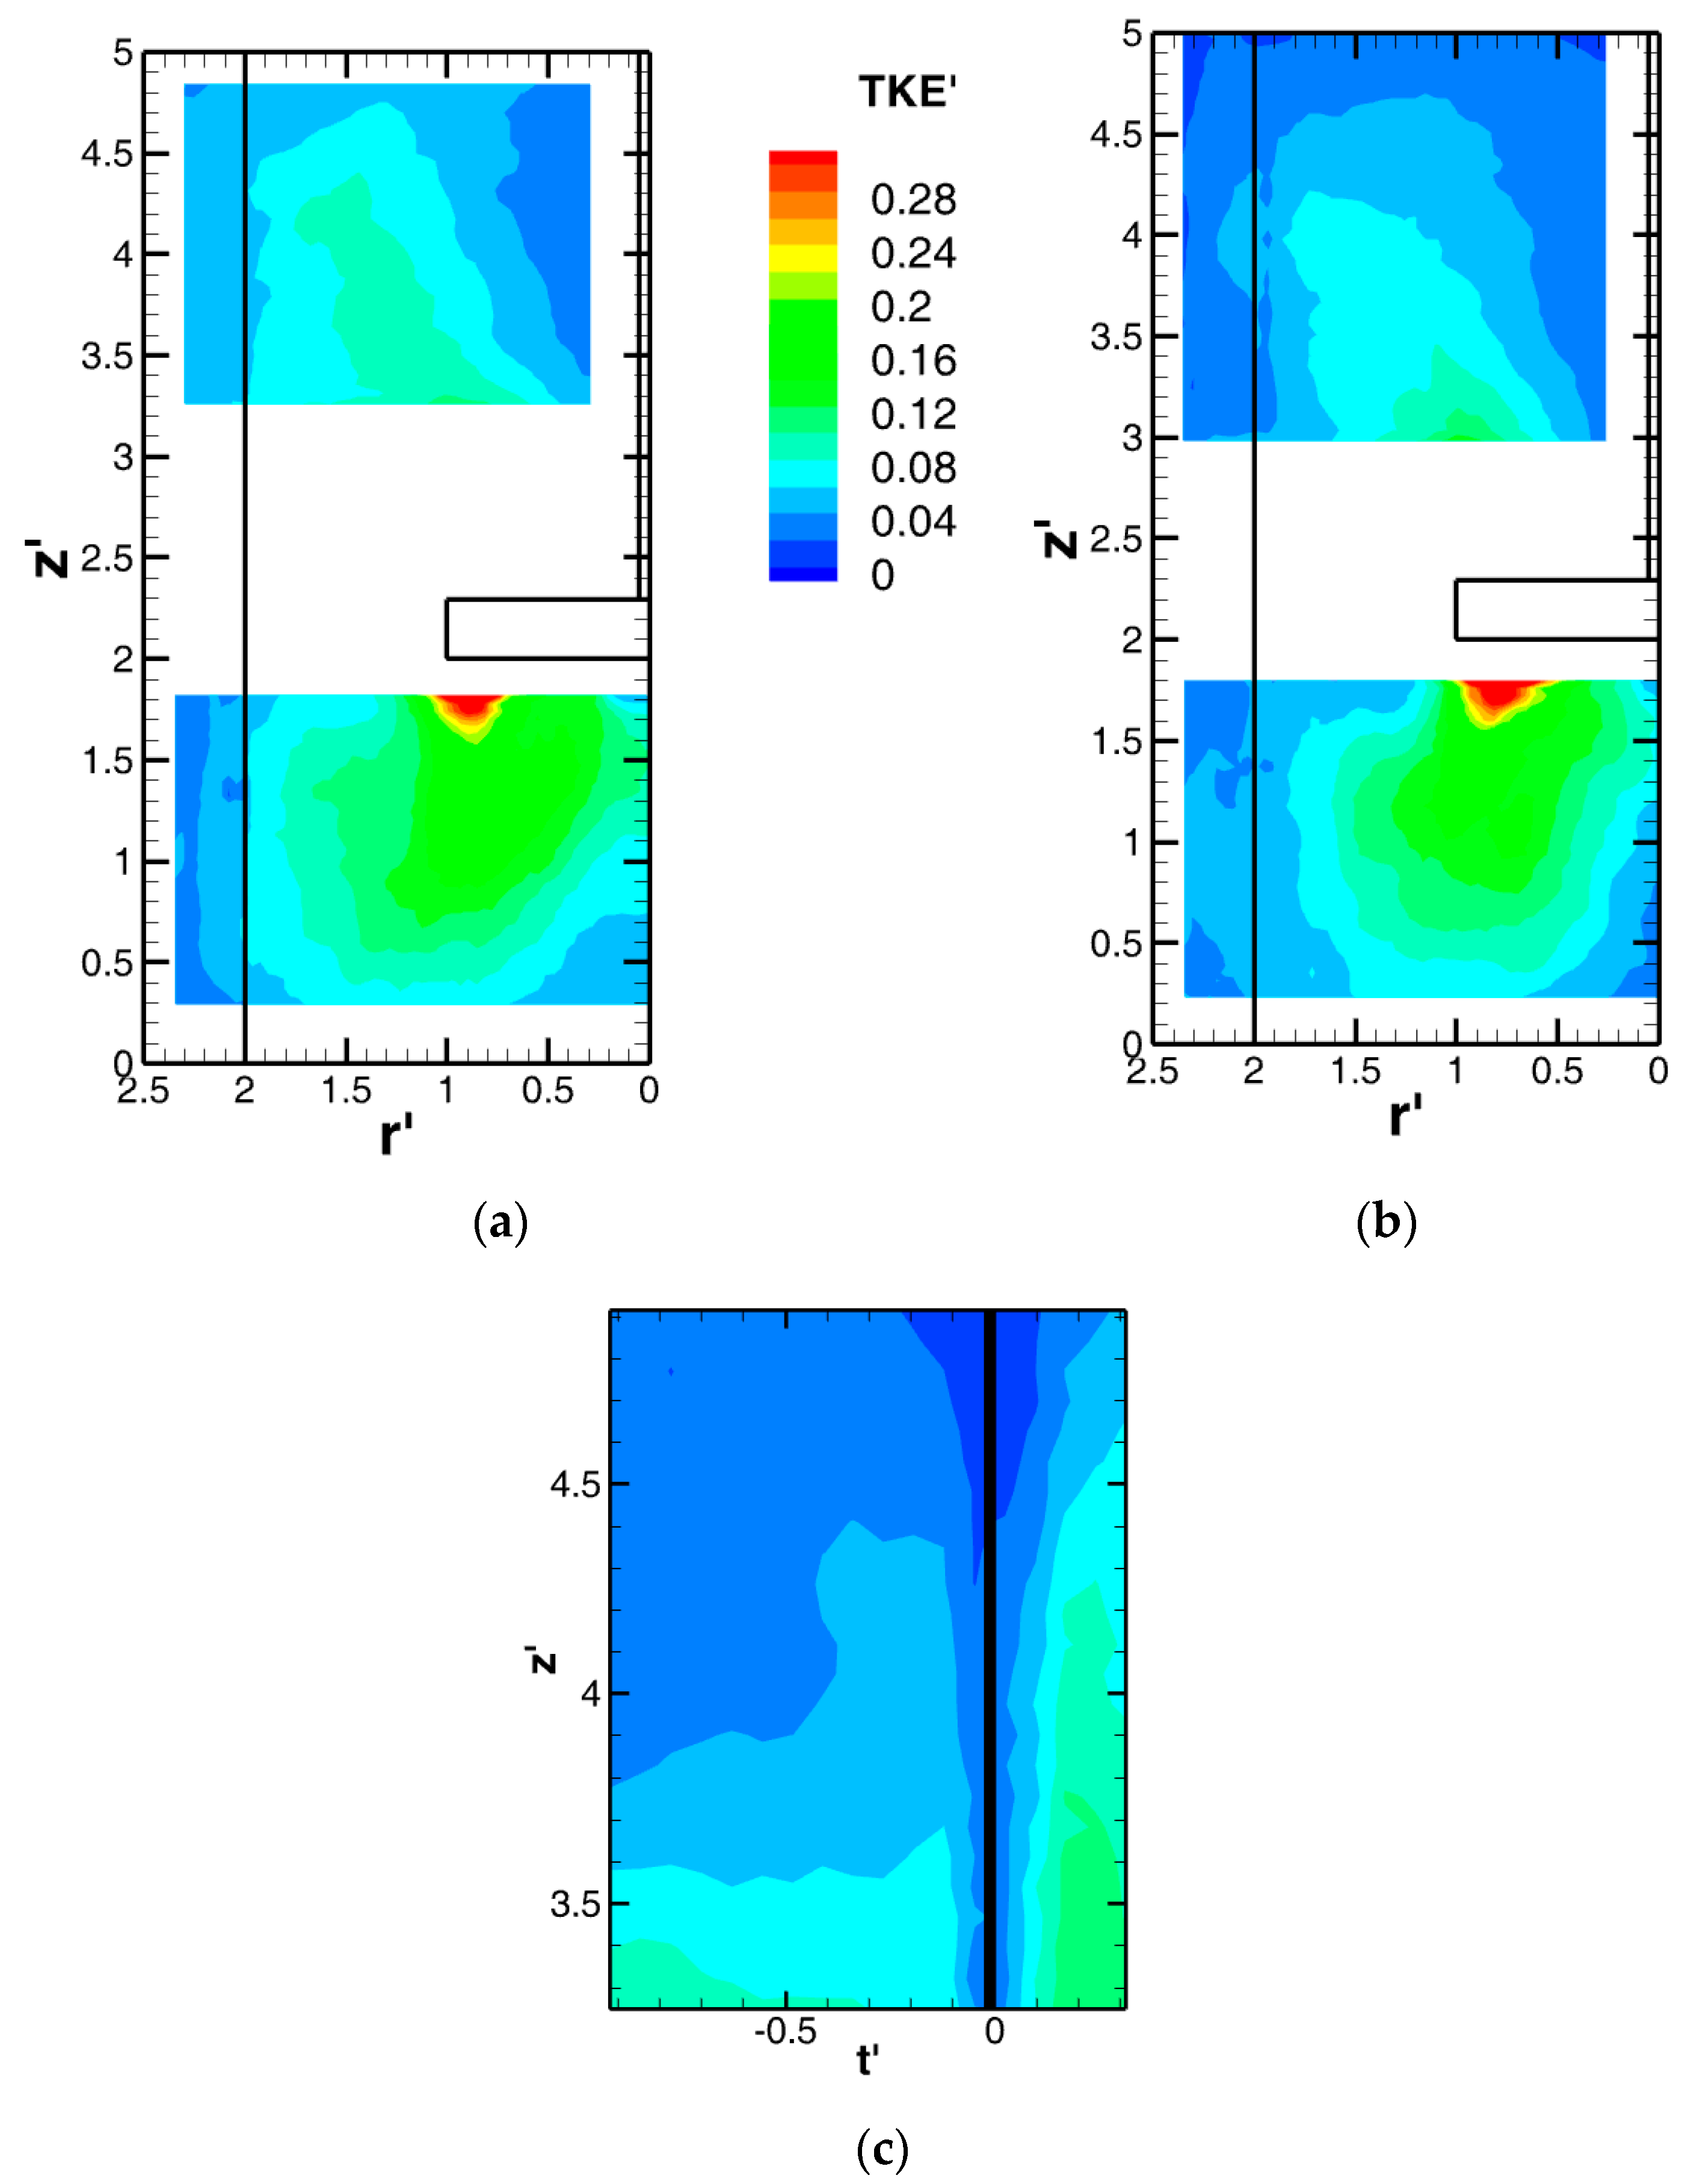
The dynamical activity is indicated by the local value of the TKE, and its distributions in planes A-A, B-B, and C-C are shown in Figure 8.
The dynamic activity is dominant bellow the impeller, and the main source of turbulence could be located to the spot below the impeller tip (red spot in Figure 8). In the upper vessel part above the impeller, the secondary dynamics activity is located within the suction jet-flow.
In Figure 8, A-A shows moderate dynamics activity within the area of strong ascent wall current, and this fact suggests predominantly uniform axial flow in this region. Dynamics activity at the wall region within the plane B-B is even smaller as the descent wall current dominates here. Concerning the area above the impeller, there is essentially analogical planar distribution of variations as within the A-A plane, only the descent wall current expresses slightly lower values of variations compared to the ascent wall current in plane A-A.
The next areas with very low dynamics activity are under the impeller hub, near the bottom close to the middle of the vessel, at the wall bottom corner, just under the liquid level close to the middle of the vessel, and just above the impeller hub.
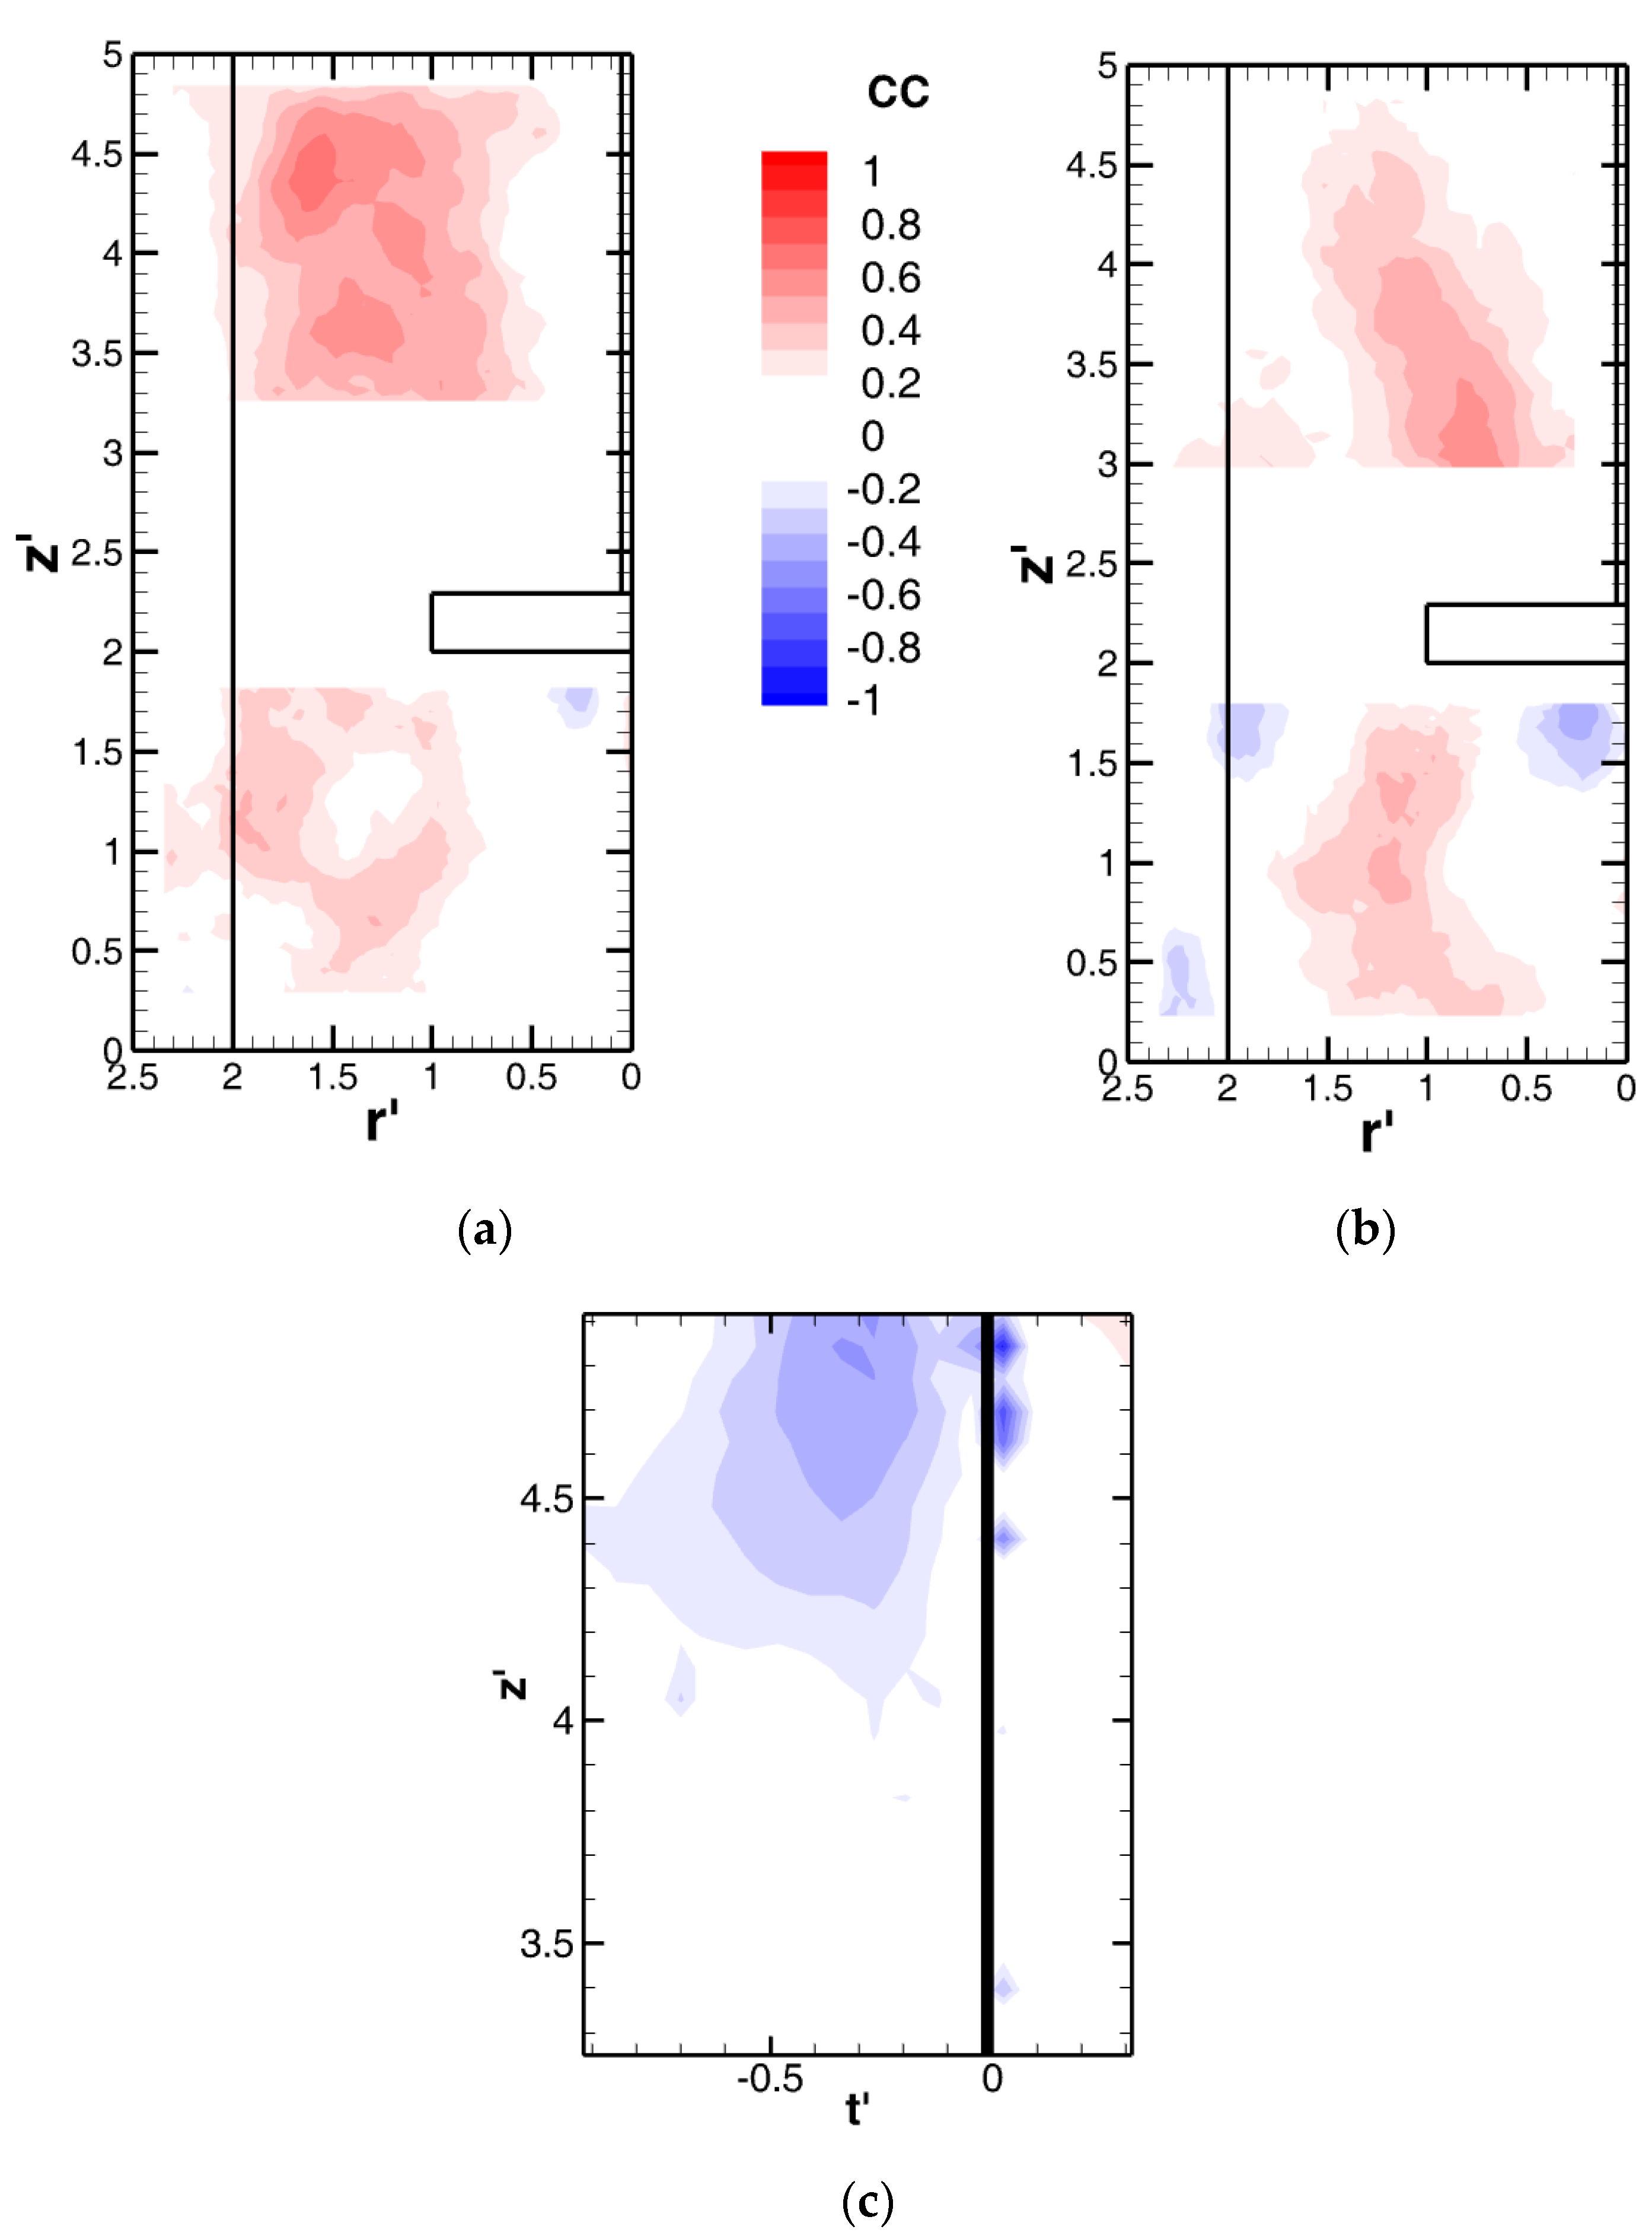
The turbulence production could be assessed using the correlation coefficient value, which estimates the cross component of the Reynolds stress. In Figure 9, distributions of the correlation coefficient (CC) are shown.
The correlation coefficient distributions indicate more intensive turbulence production in the vessel’s upper part within the jet than below the impeller.
3.2. Frequency Analysis at Selected Points
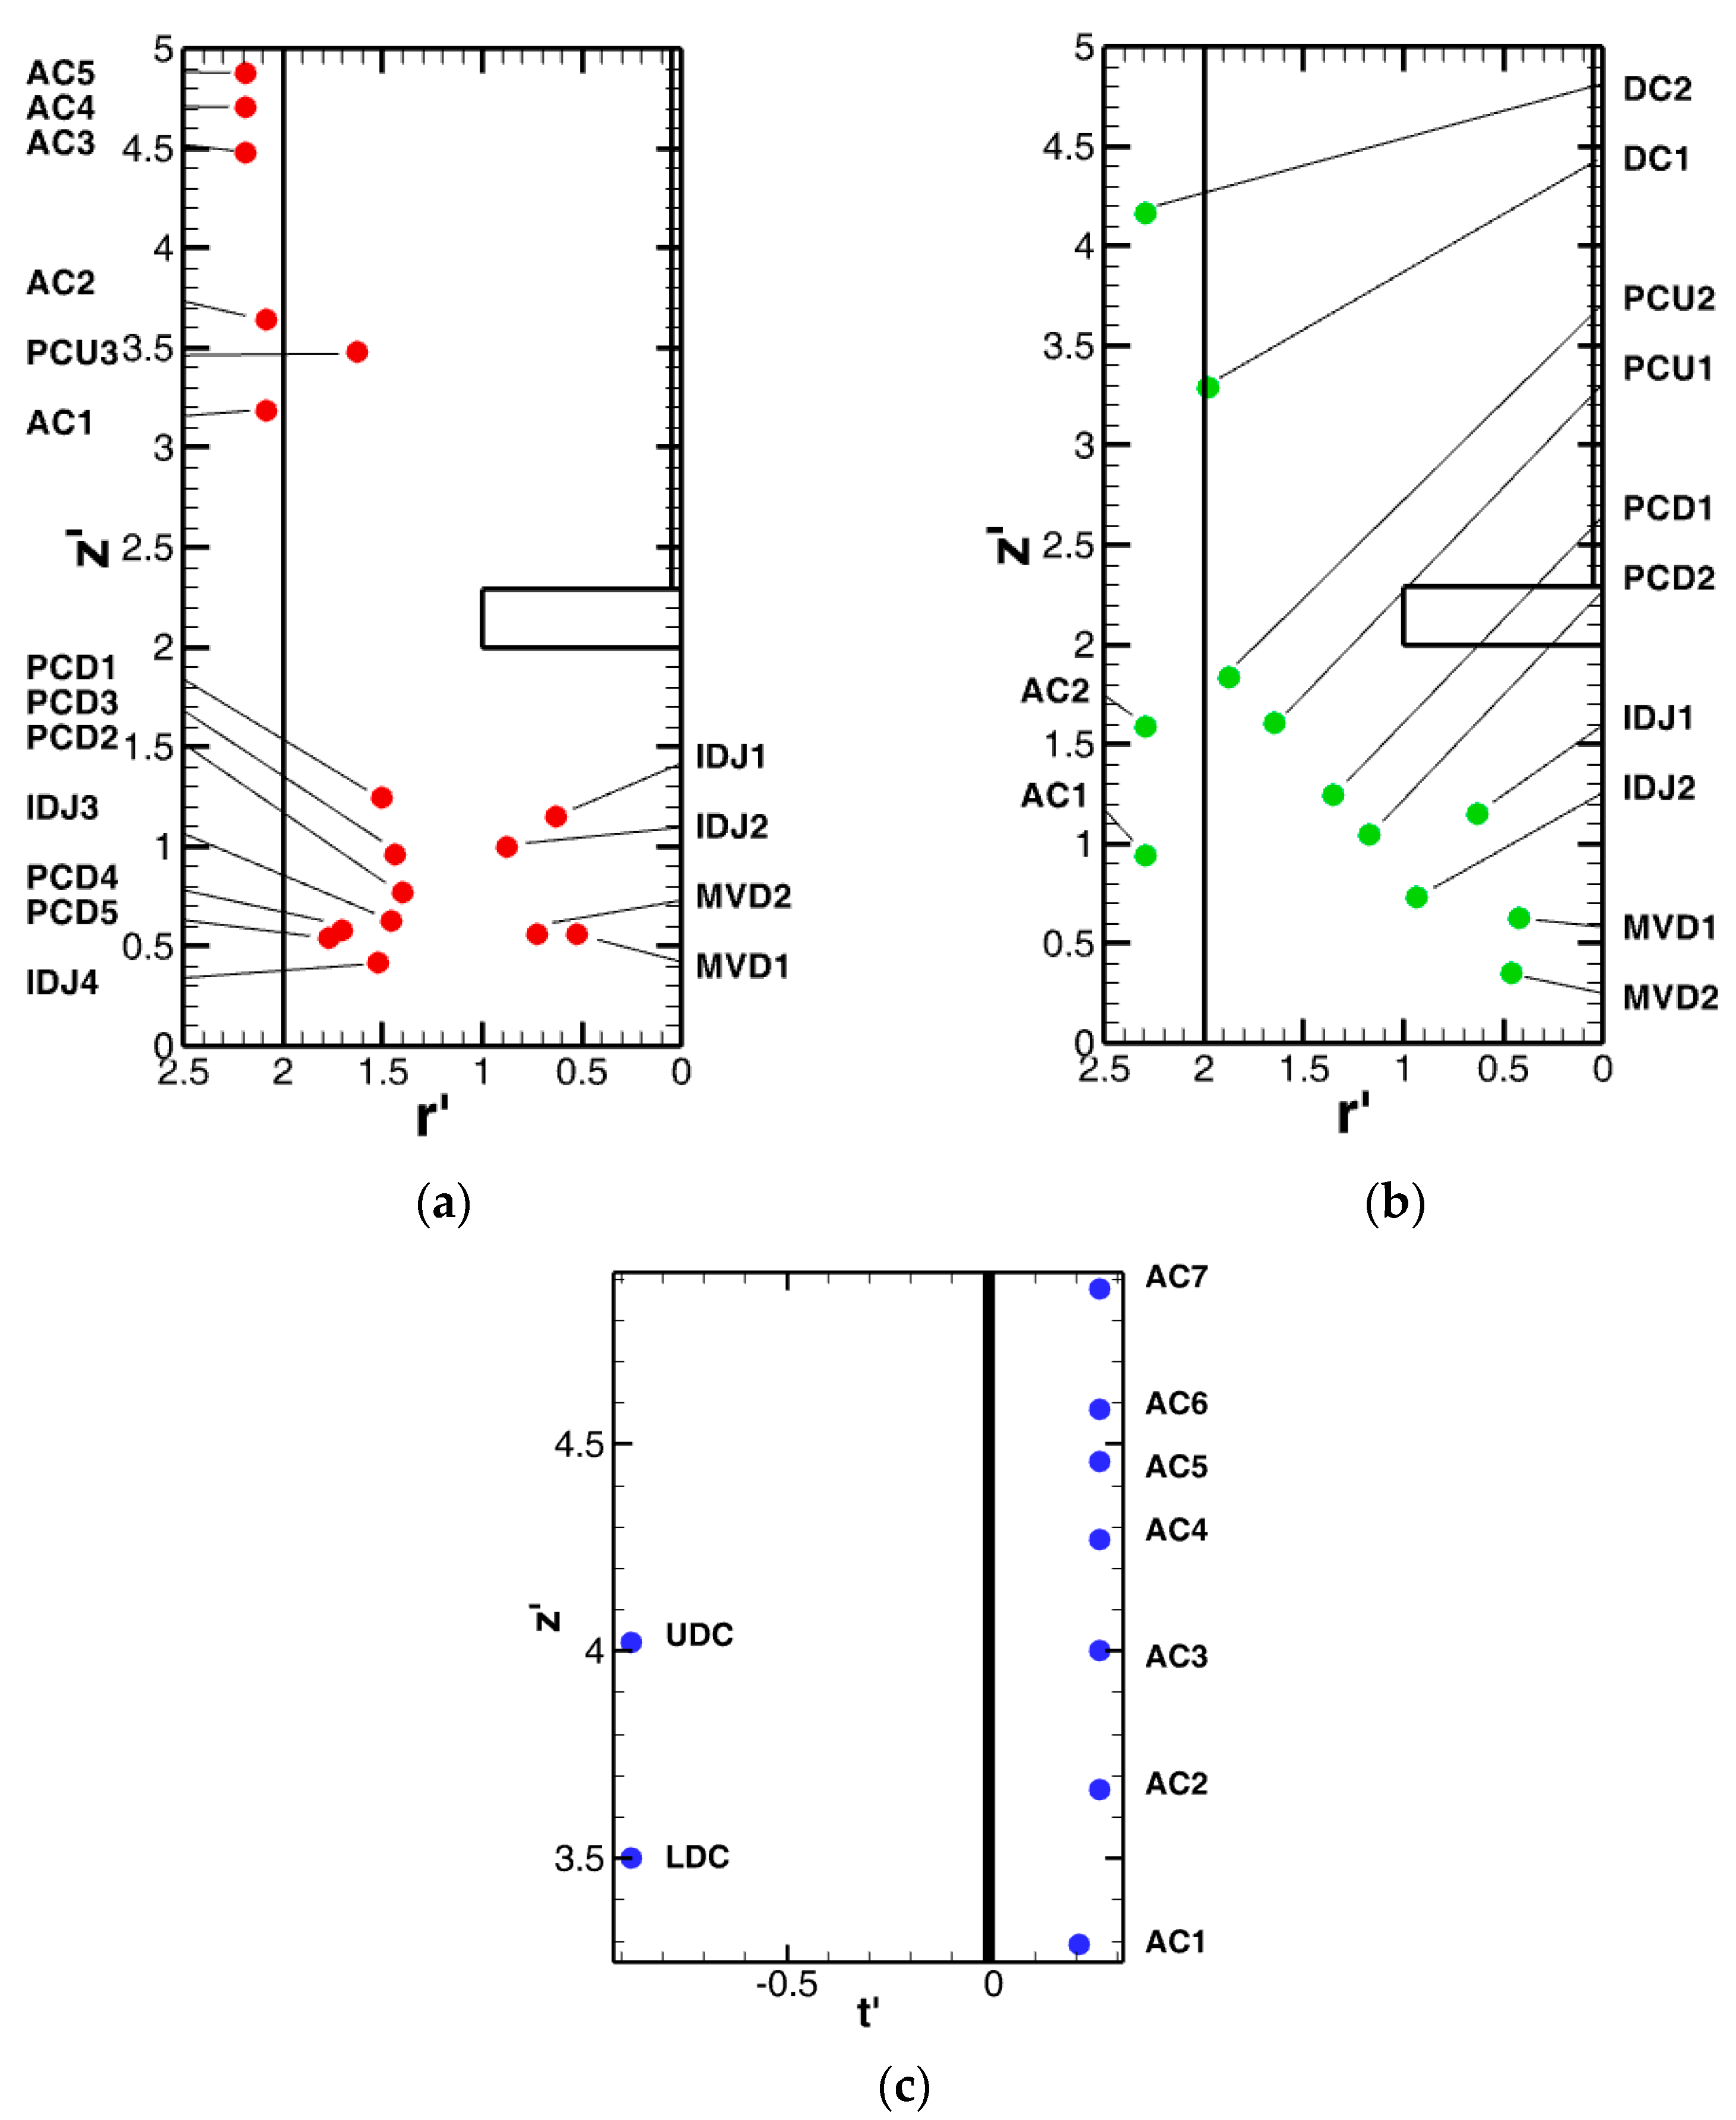
The next part of the investigation deals with frequency analysis of velocity components at selected points, which are shown in Figure 10. The points were selected within the areas occupied by the dominant low-frequency flow macro-structures (described already in previous works [3,9,10]), such as the PCL, the impeller discharge jet, the MV near the tank bottom center, and axial wall ascent (descent) currents.
Resulting values of dominant frequencies, F′1, are presented in Table 1 along with the corresponding points coordinates, evaluated velocity components, and mean velocity magnitudes. The velocity component used for frequency analysis is indicated in the fourth column. All quantities are shown in dimensionless form. If a second, quite different significant frequency was found in the spectra, its value F′2 is presented as well. The spectral analysis was performed for the two velocity components U and V, as indicated in Table 1, Table 2 and Table 3, the component L represents the resultant of the U and V components. The velocity component U is radial and V is axial component, respectively. In Table 3, the symbol T denotes tangential component. Then, the mean values of the velocity components are to be shown. The F′1 stands for the first dominant frequency, the F′2 stands for the second dominant frequency, and A1/A2 is the ratio of the corresponding amplitudes. Similar analyses were carried out in the measuring planes B-B, see Table 2, and C-C, see Table 3, where frequencies near the baffle are given. In Table 2 and Table 3, only the first dominant frequency F′1 is shown.
The data in Table 1, Table 2 and Table 3 allow us to draw the following implications. As for the dynamics of PCL behavior, the value of F′1 (L) 0.06 at the point PCD1 within the lower part of the PCL, close to the core, can be attributed to the frequency of PCL generation and therefore to the average frequency of the PCL cycle itself, very probably. The second represents the frequency with approximately half value, F′2 (L) = 0.033, suggesting that there is an average of the two different alternating cycles, resulting in smaller or bigger developed PCL. It is worthy to note that the value of F′1 (L) is reasonably close to the value presented for PCL oscillation frequency in previous work [2]: 0.0945.
The F′1 (L) for points PCD2 and PCD3 at the outer lower part of the PCL is very low, about 0.0045 and 0.0054. This implies that the PCL reaches this area in just less than 10% of its cycle. Values of F′2 (L) for these points are 0.1065 and 0.114. These quite higher values can be attributed to PCL lower border oscillation within this area.
The frequencies F′1 (L) in the points UL and UR within the upper outer part are 0.105 and 0.126 and can be attributed to the frequencies of upper border PCL oscillation around given positions. The value of F′2 (L) for point UL 0.045 can be similarly assigned to the PCL frequency reaching this position.
The frequency F′1 (L) value 0.0525 in the point on the very upper margin location PCU3 can be similarly attributed to frequency of PCL reaching to this position with oscillation frequency around this height, F′2 (L) = 0.102.
The frequency F′1 (V) in the points PCD4 and PCD 5 with values 0.1185 and 0.1215 can be then analogically attributed to the lower PCL margin oscillation frequency.
Next, 4 points within the impeller discharge jet, IDJ1, IDJ2, IDJ3, IDJ4, are to be presented. The value of F′1 (V) in the point IDJ1 0.1005 is possible to attribute to the frequency of impeller discharge jet pulsation. Regarding the same F′1 (V) for lower point IDJ2 and just a little higher F′1 (V) = 0.11 for the even lower IDJ3 point, it can be stated that this jet reaches lower axial position z′ = 0.63 in all pulsation cases.
Frequency of the strong impinging jet to vessel bottom can be attributed to F′1 (V) in the lowest point IDJ4 0.012, which is significantly lower than discharge jet pulsation frequency (within IDJ1), as expected.
Next, investigated points are related to the above-mentioned macro-vortex at the bottom middle vessel under the impeller. The F′1 (L) detected in the points MVD1 and MVD2 at the upper vortex margin has values of 0.1425 and 0.126.
Finally, the points within the ascent wall current with radial position r′ = 2.09 and 2.2 were analyzed. They respond approximately to the inner margin of the baffle within the interval of the axial positions above the bottom, just under the mean height of PCL z′ = 3.18 to close to liquid level z′ = 5.04, with these results:
Point AC1 at z′ = 3.19, which can be still considered within the PCL area, expresses an expectable close value of F′1 (V) 0.051 to the above-noted F′ for PCL cycle, 0.06.
For the point AC2 at z′ = 3.64, under the average maximal height of PCL, its value is F′1 (V) 0.165.
Regarding its axial position, this value can be attributed to the frequency of the ascent current separating from PCL, identified in the introduction as FMF. An identical value of significant F′2 (V) for AC1 suggests oscillation of primary circulation within the point connected with this ascent current separating.
As point AC2 also manifested a significant F′2 (V) with a value analogically identical to F′1 (V) 0.051, it is possible to suppose that macro-dynamics within these points are connected with the generation of the PCL and affect near the wall ascent current.
In previous work [15], the average value of all types of FMF frequency generation was 0.174, and therefore close to our findings. Similarly, in Reference [6], the authors detected a close value of dominant frequency of 0.186 within the area upstream of baffle. The frequency F′1 (V) of the third point AC3 at z′ = 4.48 has the value 0.0525. As its axial position according to the mentioned work [15] corresponds to already separated FMF, it is possible to state that approximately 32% of the generated ascent current creates it.
The identical value of F′1 (V) in the next point AC4 at z′ = 4.71 implies that all separated FMF reach this axial position. The F′1 (V) value in the point AC5 at z′ = 4.88 (therefore close to liquid level) can be attributed to the frequency of FMF crashing the surface and the subsequent liquid level MS (manifesting as the uplift of liquid surface by approximately Δh = 0.01 m for the given conditions). A previous contribution [1,17] dealing with MS detection with the help of the liquid level horizontal visualization and conducting probe presenting for the same conditions (rpm = 400, PBT 4, C/H = 0.4), indicated a very close value of MS frequency 10 min−1, i.e., dimensionless value 0.0255. Also, the contribution [12] dealing with liquid level dynamic mapping within the net of selected points, presenting for dimensionless MS frequency localized tangentially in front of the inner baffle margin, corresponds to interval of values 0.0225–0.03.
Overall, the lower values of F′1 (V) for the upper points AC3–AC5 can be attributed to the transition regime (not fully turbulent) within this area, as mentioned above in the Section “Statistical Analysis”.
We also made a comparison of U′ and V′ velocity components for the selected points presented in Table 1 with those detected in Reference [22] for similar relative positions, i.e., rc′ = 2r/D, zc′ = z/C. Authors in Reference [22] used the same PBT 6 impeller and the setup D = T/2, C = T/4, and Nimp = 345 rpm. As the authors positioned the vertical measured plane mid-way between the baffles (at maximal distance from them), this comparison can reveal the influence of the baffle distance for the vertical flow-field as well. The results of this comparison are presented in Table 4, where rc1′, zc1′, U1′, and V1′ are our coordinates and velocity magnitudes for selected points, and rc2′, zc2′, U2′, and V2′ are the coordinates of the nearest positions and corresponding velocity magnitudes from Reference [22] (Figure 3 and Figure 11).
Next follows a description of the flow pattern within the plane B-B intersecting the center of the vessel with angle 22.5° (see Figure 3). In the plane B-B, it can be supposed that there is minimal baffle influence on the flow pattern.
The time-averaged flow vector field with contour of dimensionless U′ and V′ velocity magnitudes are presented in Figure 4, Figure 5 and Figure 6.
In Figure 4 (and Figure 6 as well), within the lower part of the vessel, there is predominantly a detectable significantly smaller wall ascent current area compared to the plane A-A. This finding is expected because of the baffle absence, as well as the significantly smaller average maximal height of the PCL, reaching within this plane approximately just z′ = 1.88. Concerning PCL center position, there is no significant difference in the plane A-A (approximately (1.5;1.5)). There is also no detectable difference of the average radial localization of the most intensive wall ascent current area.
However, there is a significant difference of the flow pattern within the area above the impeller (see Figure 4) due to the absence of the wall ascent current, implying that this one reaches average maximal height at just z′ = 2.08−2.7. This finding agrees with the previous results [1,12], which report that the MS of liquid level is present exclusively in the baffle vicinity. Within this plane, the weaker wall descent current is differently detectable. This descent current between baffles was already reported in Reference [11], where the authors further observed collision of that with the wall upward current within the lower part of the vessel, and subsequent origin of the above-mentioned smaller vortex MVU with counterclockwise orientation, due to the PCL. The area of this vortex appeared quite weak within the main flow field (marked in Figure 4, B-B), with the center at approximately (1.7;4). At axial position, approximately z′ = 2.08, this descent current becomes adjacent to the PCL upper part and subsequently, close to the middle of the sucking impeller jet. The counterclockwise MV near the bottom middle vessel is again marked in Figure 4, B-B.
The similar frequency analysis of selected points within the plane B-B follows. Corresponding values of dominant frequencies F′, along with corresponding points coordinates, evaluated velocity components, and mean velocity magnitudes are shown in Table 2.
Almost identical F′1 (L) values of point PCD1 (within the middle of the PCL close to the core) and PCU1 (diagonally opposite point), 0.021 and 0.023 respectively (see Figure 10), can be again attributed to the average frequency of generation (oscillation) of the PCL, and this significantly lower frequency in the plane A-A implies longer phases of developed PCL sustaining and shorter chaotic phases, or vice-versa.
Here, it is worthy to note that a previous contribution [2] analyzing the PCL oscillations using flow visualization within the plane A-A presented a 400 rpm asymptotic value of the PCL relative incidence for identical impeller revolution (i.e., phase of growing and sustaining PCL), for approximately 80% of the whole cycle period on average.
The value F′1(L) of point PCU2 within the upper part of PCL 0.042 is again possible to attribute to the PCL upper margin oscillation frequency, and the value F′1(L) of the diagonally opposite point PCD2 0.029 analogically to the PCL lower margin oscillation frequency. Based on these results, it is possible to state that the planar development of the PCL within this plane is almost symmetrical. Further, the upper margin exhibits two significant oscillations in one PCL cycle, while the lower margin shows two significant oscillations during 70% of the PCL cycles.
Subsequently, the evaluation of the Dominant Frequency (hereinafter DF) axial component velocity course within the impeller discharge jet is to be discussed. The first selected point IDJ1 just below the impeller (the same coordinates as the point IDJ1 in the plane A-A) expresses F′1(V) 0.021, which is the same as the PCL oscillation frequency. The second selected point IDJ2 close to the vessel bottom (r′ = 0.94, z′ = 0.73) has a lower F′1 (V) value of 0.006, as expected.
Concerning the counterclockwise vortex near the bottom middle vessel, the two selected points, MVD1 at vortex upper margin and MVD2 at vortex lower margin, indicate F′1 (L) values of 0.04 and 0.1, respectively.
A further two points near the wall within the lower segment were selected: AC1 (r′ = 2.29, z′ = 0.94) and AC2 (r′ = 2.29, z′ = 1.58). The AC1 value of F′1 (U) 0.027 (i.e., at the position where the dominant influence of primary circulation or impeller discharge jet is located) is close to PCL oscillation, as expected, while the significantly lower value F′1 (V) of the higher point AC2, 0.012 (i.e., at the position where the wall ascent current separates from the PCL), implies significantly lower relative incidence of the wall ascent current at this location compared to the plane A-A. Subsequently, two points were selected at similar radial positions, near the wall within the upper area: points DC1 (r′ = 1.98, z′ = 3.29) and DC2 (r′ = 2.29, z′ = 4.17), see Figure 10. Quite low DF values of both points, F′1 (V) = 0.03 for DC1 and F′1 (V) = 0.03 for DC2, confirm that the upper flow segment is, in terms of macro-dynamics, significantly more stationary than the lower one. Moreover, these low DF values along with the low DF values within the wall ascent current area compared to plane A-A imply an interaction of the ascent and descent currents within this plane.
Finally, the plane C-C was analyzed, and the flow is perpendicular to the baffle through its radial center (i.e., in tangential direction, see Figure 3). The main reason for this choice was to compare the flow fields in the area just in front of the baffle (i.e., dominance of the wall ascent current) and the area just behind the baffle. However, as shown in Figure 3, within this plane, it is possible to visualize the tangential profile of the flow field within the interval from a large distance down to close to the baffle. Within the plane A-A, the radial profile of the flow field is visualized tangentially in front of the baffle.
In other words, comparing the results within the wall ascent current area for the planes A-A and C-C, we could assess horizontal homogeneity of the geometry, and macro-dynamics of the wall ascent current. Corresponding time-averaged flow vector fields with contours of dimensionless U´ and V´ velocity components are presented in Figure 5. It is apparent that the flow field is totally different in front of and behind the baffle.
The dominant wall ascent current in front of the baffle is replaced by a significantly weaker decent current behind the baffle, pointing from the baffle diagonally downwards and near the baffle turned upwards. It almost fades close the liquid level. The geometry of the ascent wall current within the plane C-C shows that it is adjacent to the baffle (tangential dimensionless coordinate t′ = 0.075), while mean tangential position of the most intense wall ascent current area is at tangential coordinate of approximately t′ = 0.208, in front of the baffle.
The similar frequency analysis of instantaneous velocity components at selected points for the plane C-C was presented with corresponding values of dominant frequencies, F′, along with corresponding points coordinates, see Table 3.
The comparison of F′ values at selected points within this plane and corresponding points within the plane A-A had the following outcomes.
The lowest point below the level of mean height of PCL, AC1 (t′ = 0.208, z′ = 3.29), expressed an F′1 (V) value of 0.036, thus lower but with close relation to the F′1 (V) value of the corresponding point AC1 within the plane A-A.
The F′1 (V) value of the next point AC2 (t′ = 0.26, z′ = 3.67), 0.114, which is attributed to the ascent current origin, is also lower than the F´1 (V) of corresponding point AC2 within the plane A-A. However, it is possible to state the proportionality of the points AC1 and AC2 taken for both planes A-A and C-C.
Points AC3–AC6 (t′ = 0.26, z′ = 4–4.58) show the identical F′1 (V) value of 0.0345. This fact implies that the macro-behavior of the wall ascent current in axial position z′ = 4.58 is essentially uniform with the given average frequency of oscillations.
With respect to the significantly lower F′1 (V) value of 0.003 for the highest point AC7 (t′ = 0.26, z′ = 4.88), it is possible to state that the liquid level MS appeared at this position with significantly lower frequency than in the plane A-A (effect of the baffle on the MS average frequency surely exists).
Concerning the dynamical activity within the plane C-C (see the TKE distribution in Figure 8), there is no detectable difference of planar distribution of this quantity within the ascent wall current area compared to the plane A-A.
For the area of “wake” behind the baffle, two points were selected close to the vessel wall (Table 3, Figure 5), UDC (t′ = −0.875, z′ = 4.02) and LDC (t′ = −0.875, z′ = 3.5). The value of F′1 (U) for point UDC, 0.065, is closely related (in the middle of the interval) to the values of F′1 (V) for points within the wall ascent current for both planes A-A and C-C. The F′1 (U) frequency value in the point LDC is 0.012, and it is significantly lower, as is the mean axial velocity within this point.
3.3. Spatio-Temporal Analysis
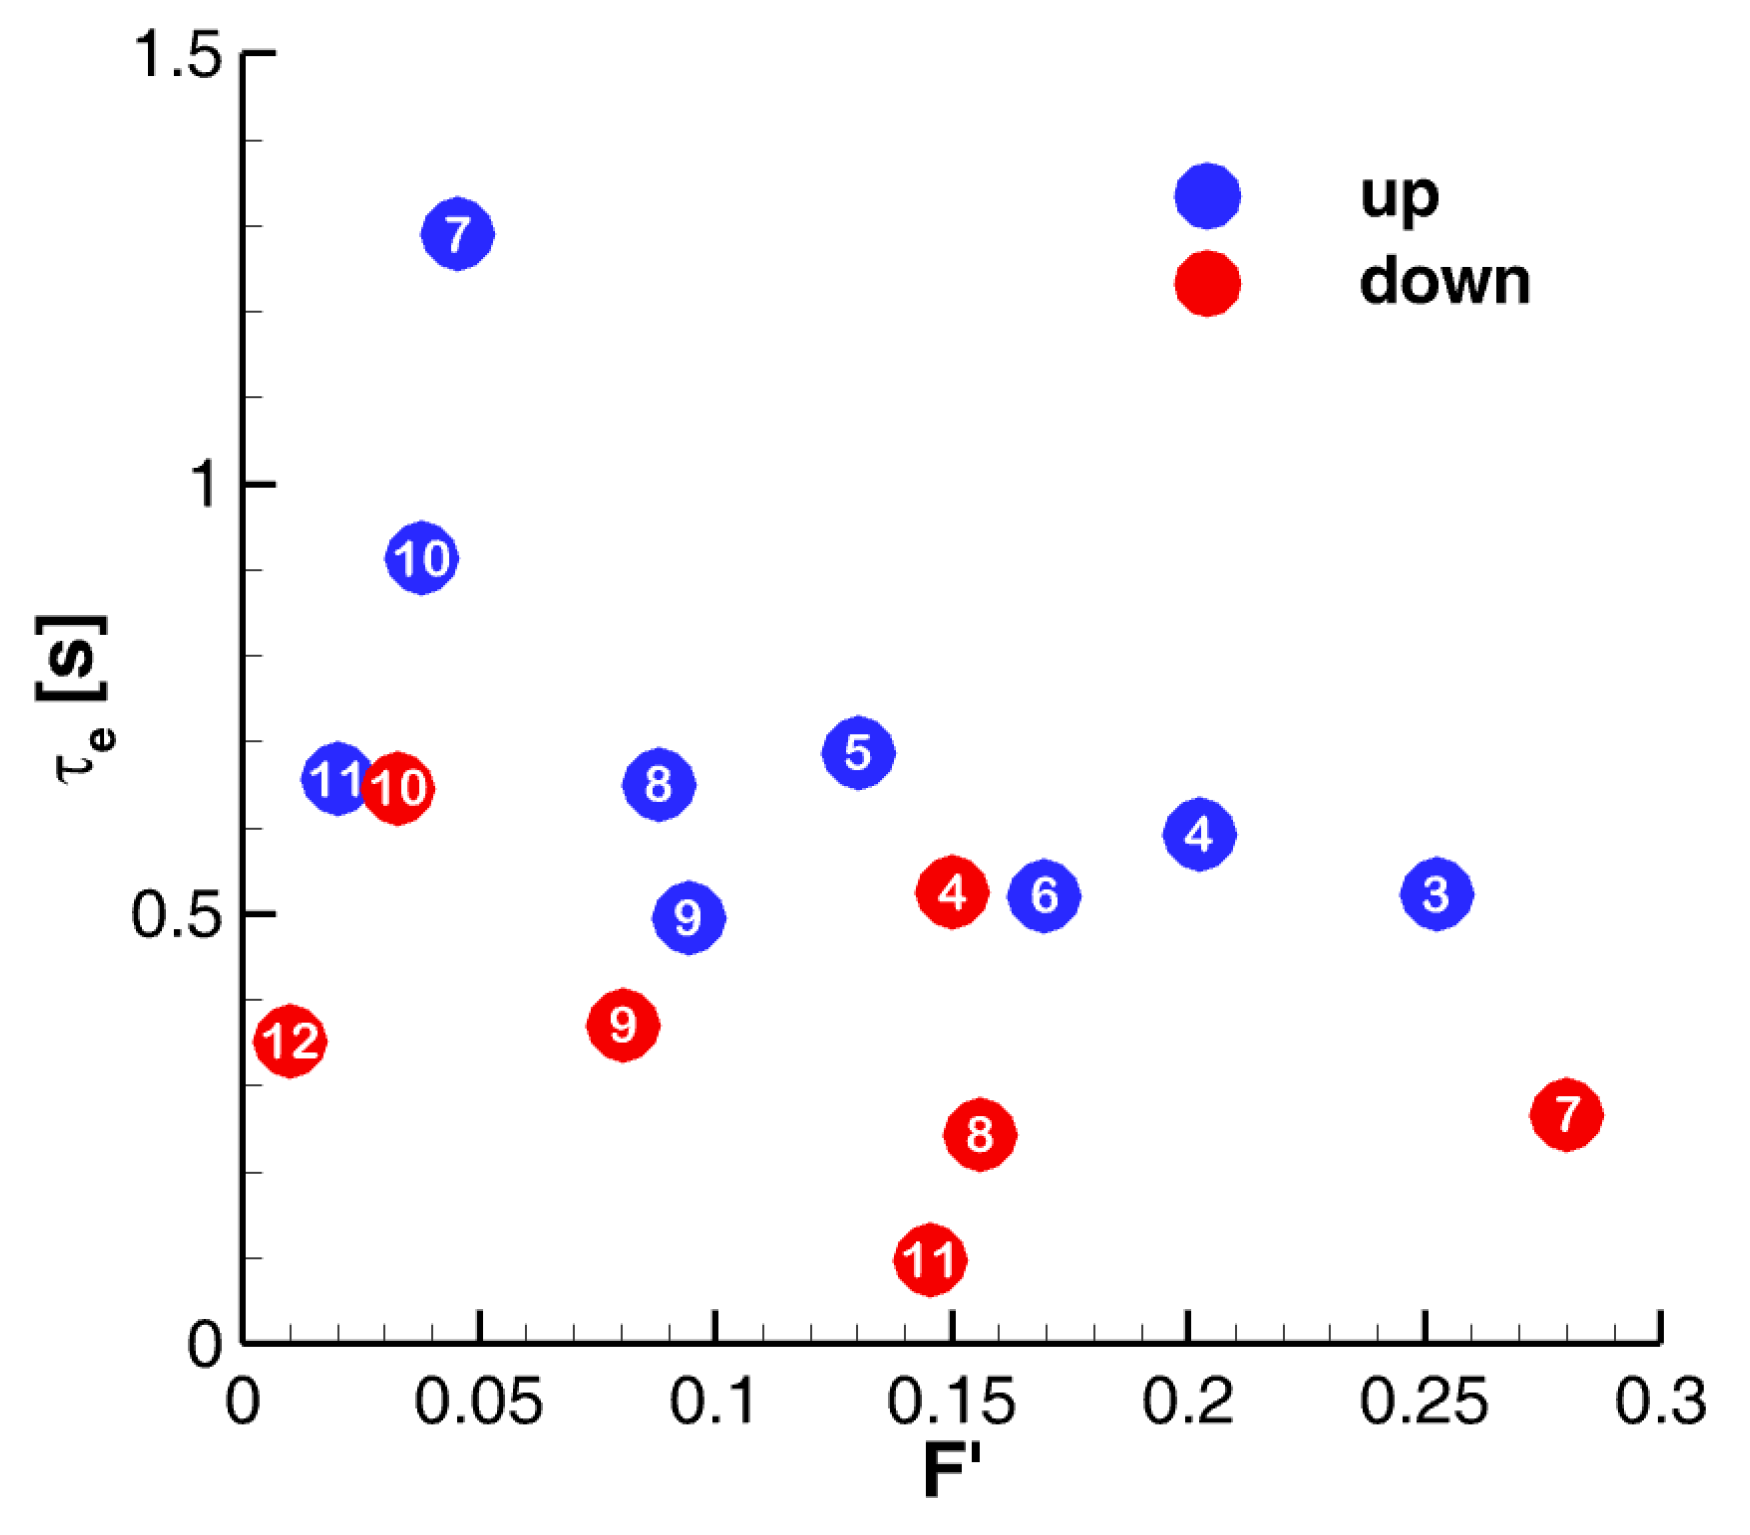
The Oscillation Pattern Decomposition method (OPD) is to be applied. The OPD frequency analysis was applied separately on the upper and lower parts of the flow-field plane A-A. Figure 11 shows the low-frequency part of the OPD spectra for selected OPD modes. The OPD modes are identified by numbers.
In Figure 11, the OPD modes are characterized by the dimensionless frequency, F′, and the e-folding time, τe, in seconds. The e-folding time indicates mean lifetime of the structure. Apparently, the pseudo-periodical behavior in the upper part exhibits considerably higher stability and longer e-folding times than that in the lower part.
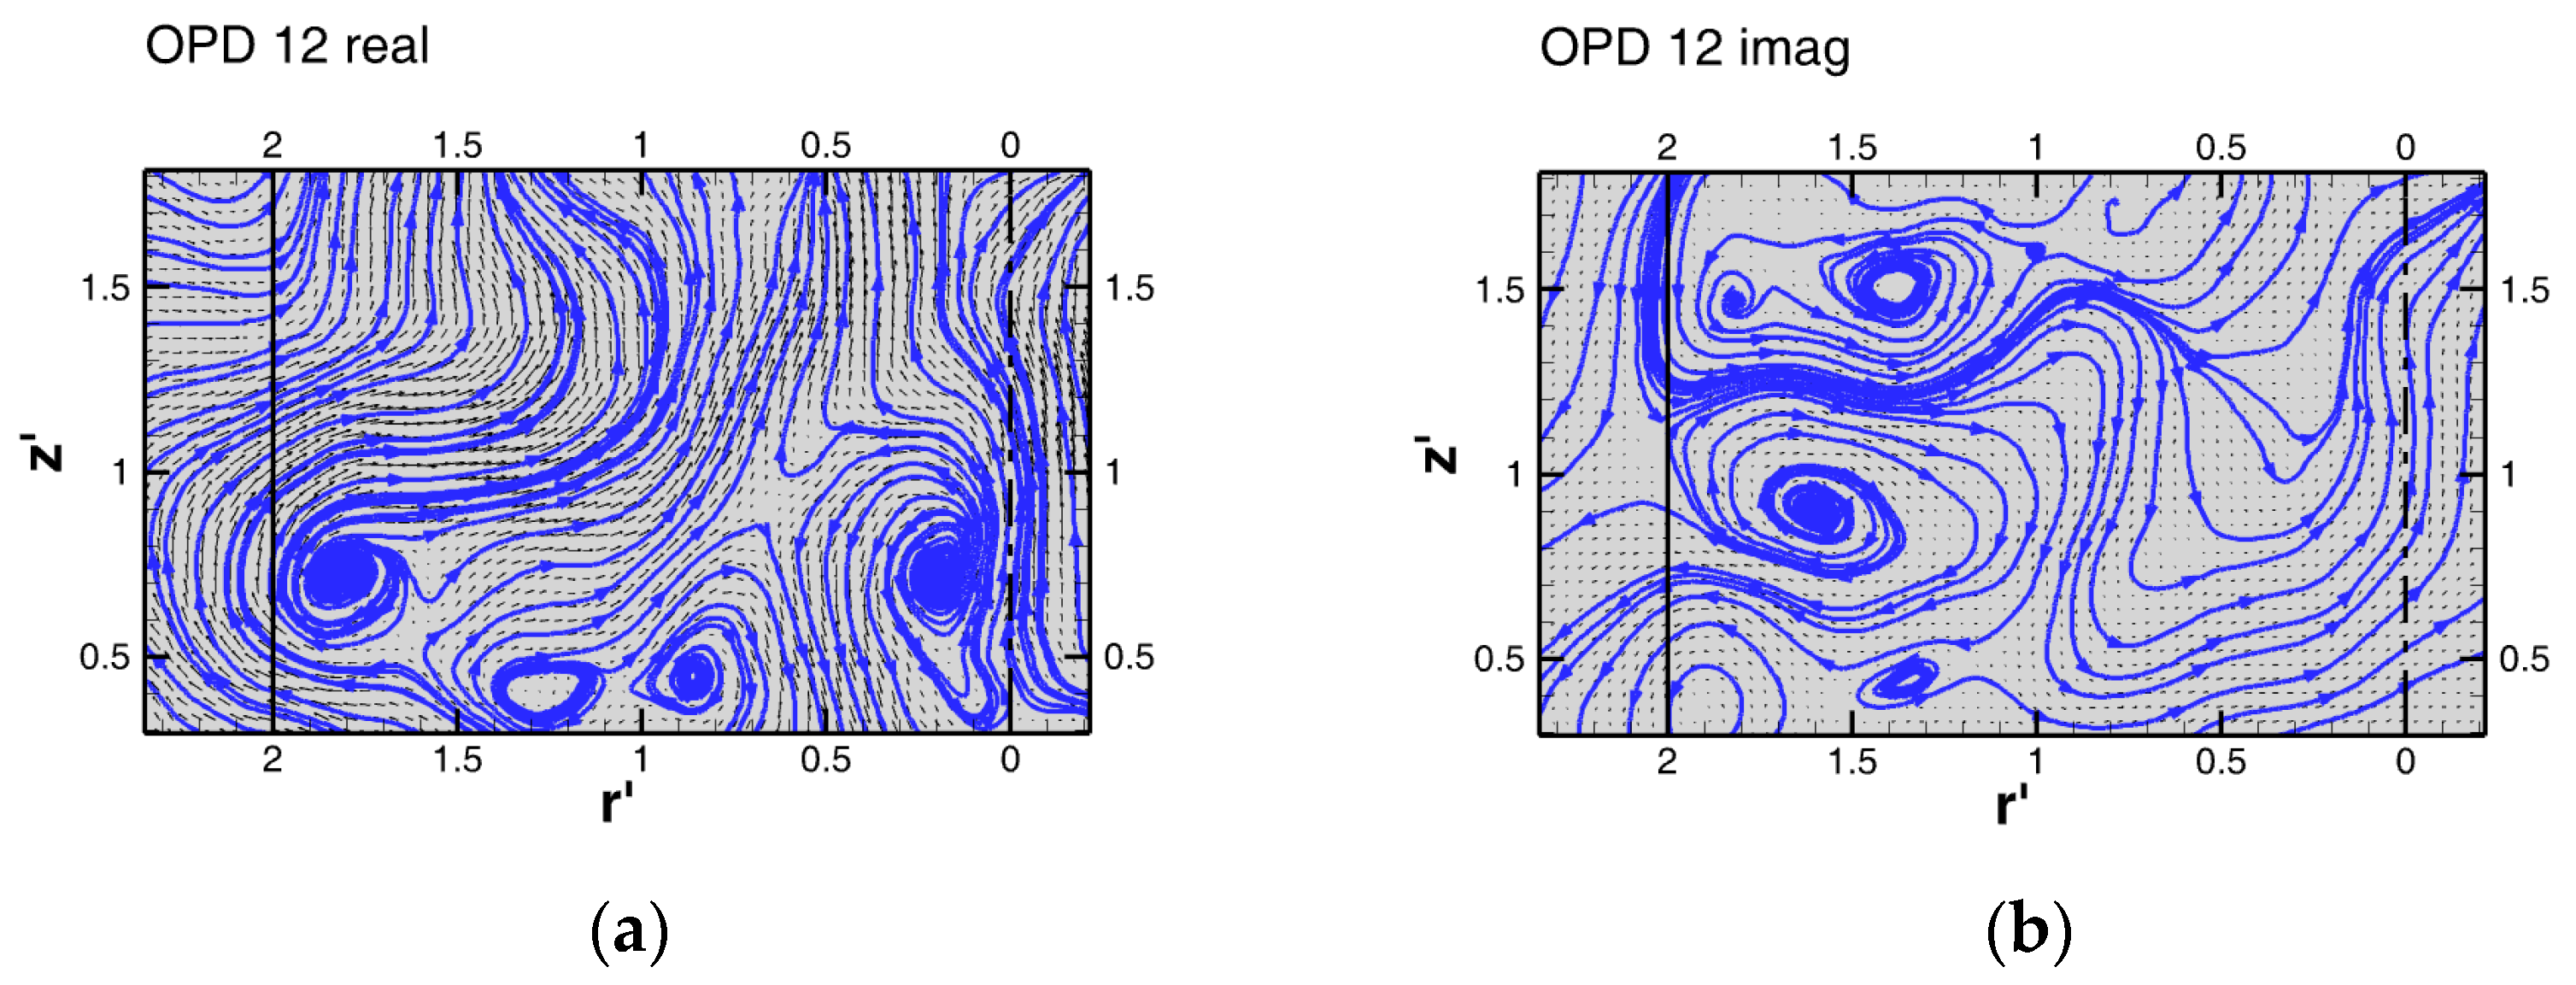
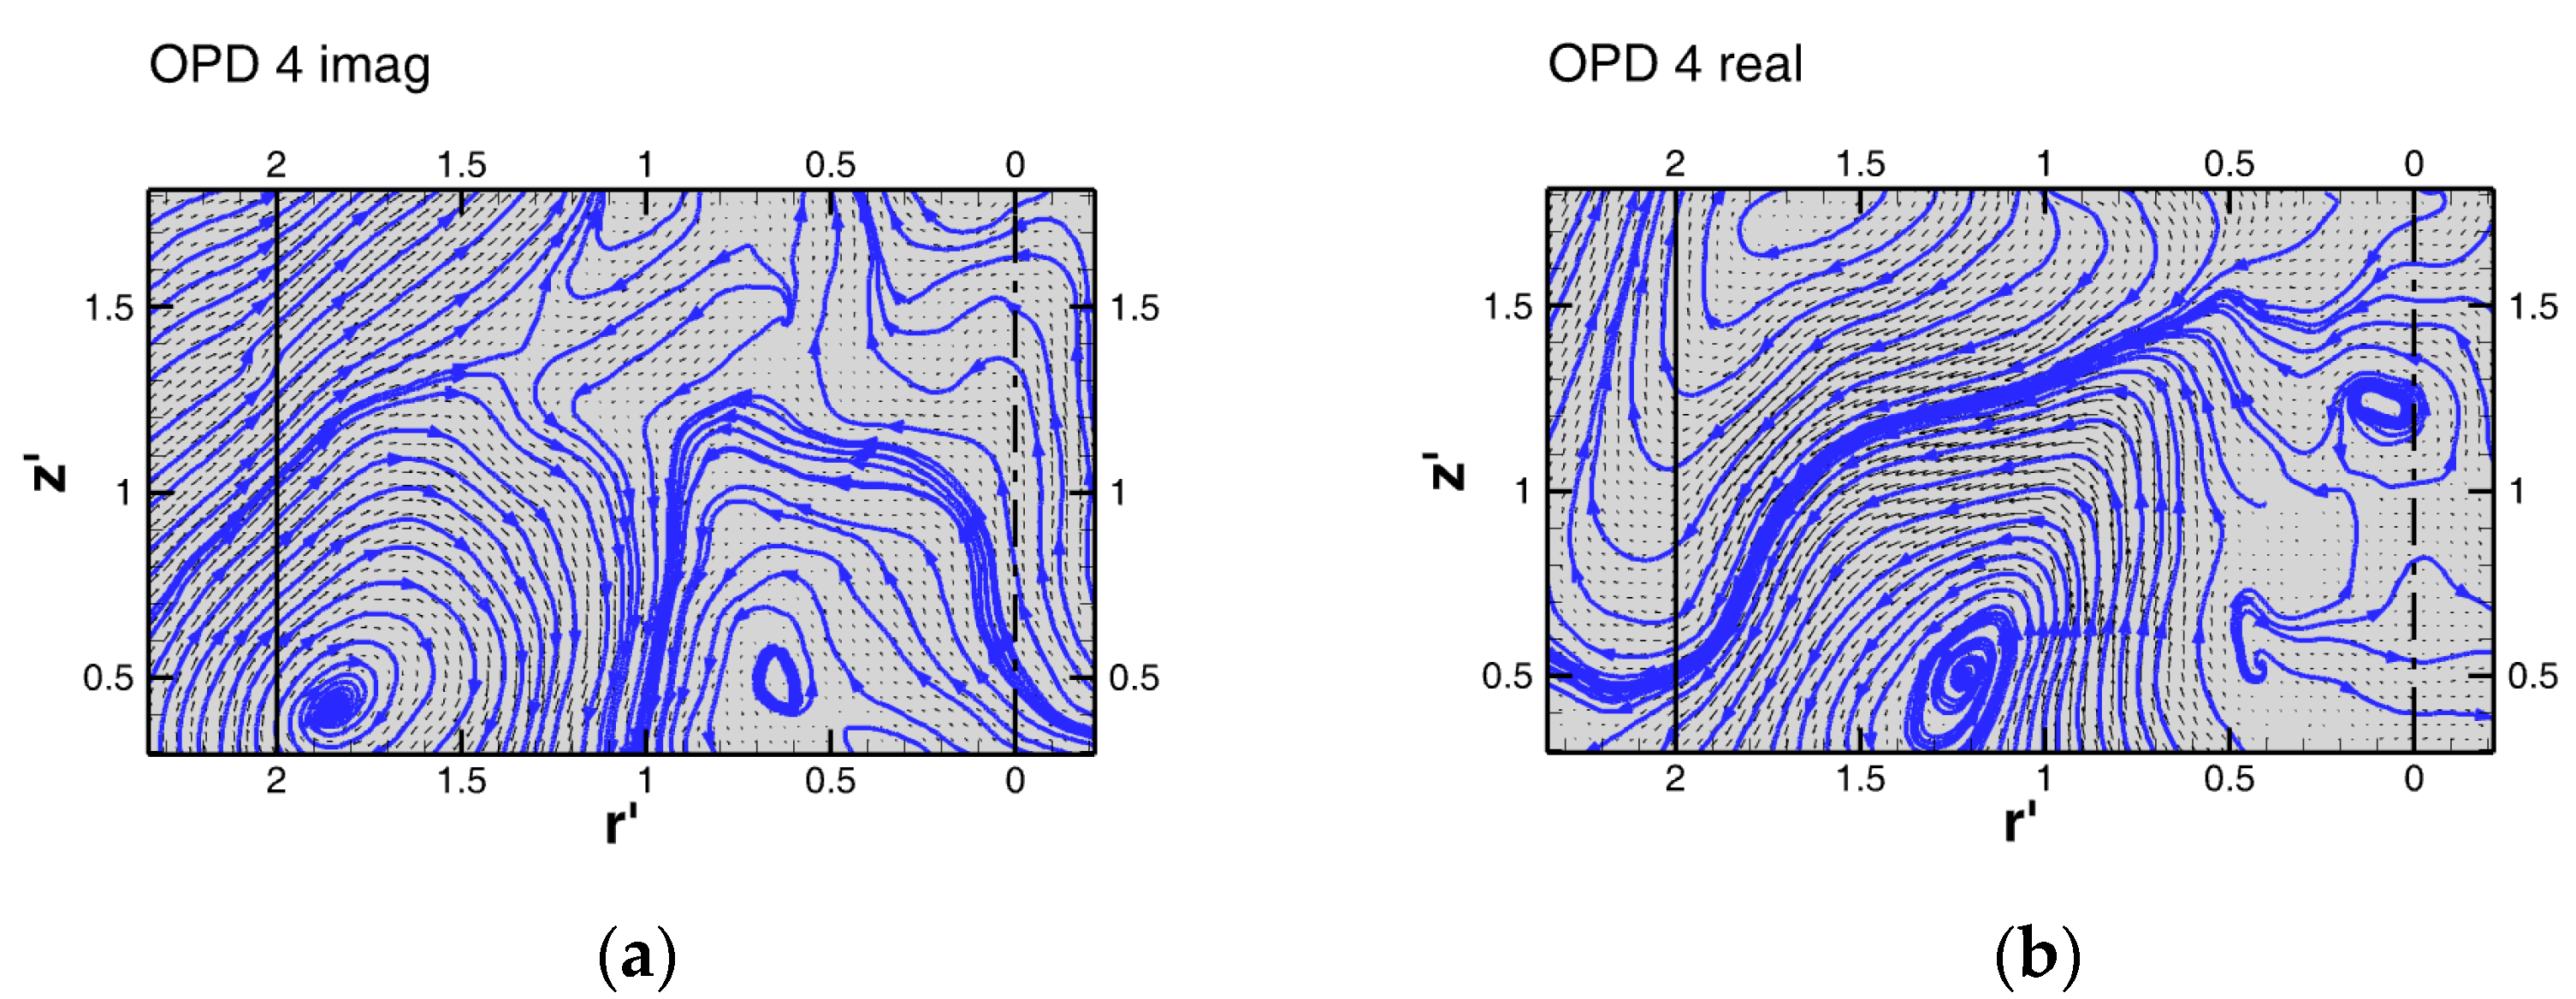
The pseudo periodical structures characterized by given frequency are defined by the complex topology, real (real) and imaginary (imag) stages. The topology changes during each period are in the sequence: real, imag, -real, -imag, and repeated again. The phase shift between the stages is π/2, giving 2π over the whole period. The period is given by frequency (it is a reciprocal value).
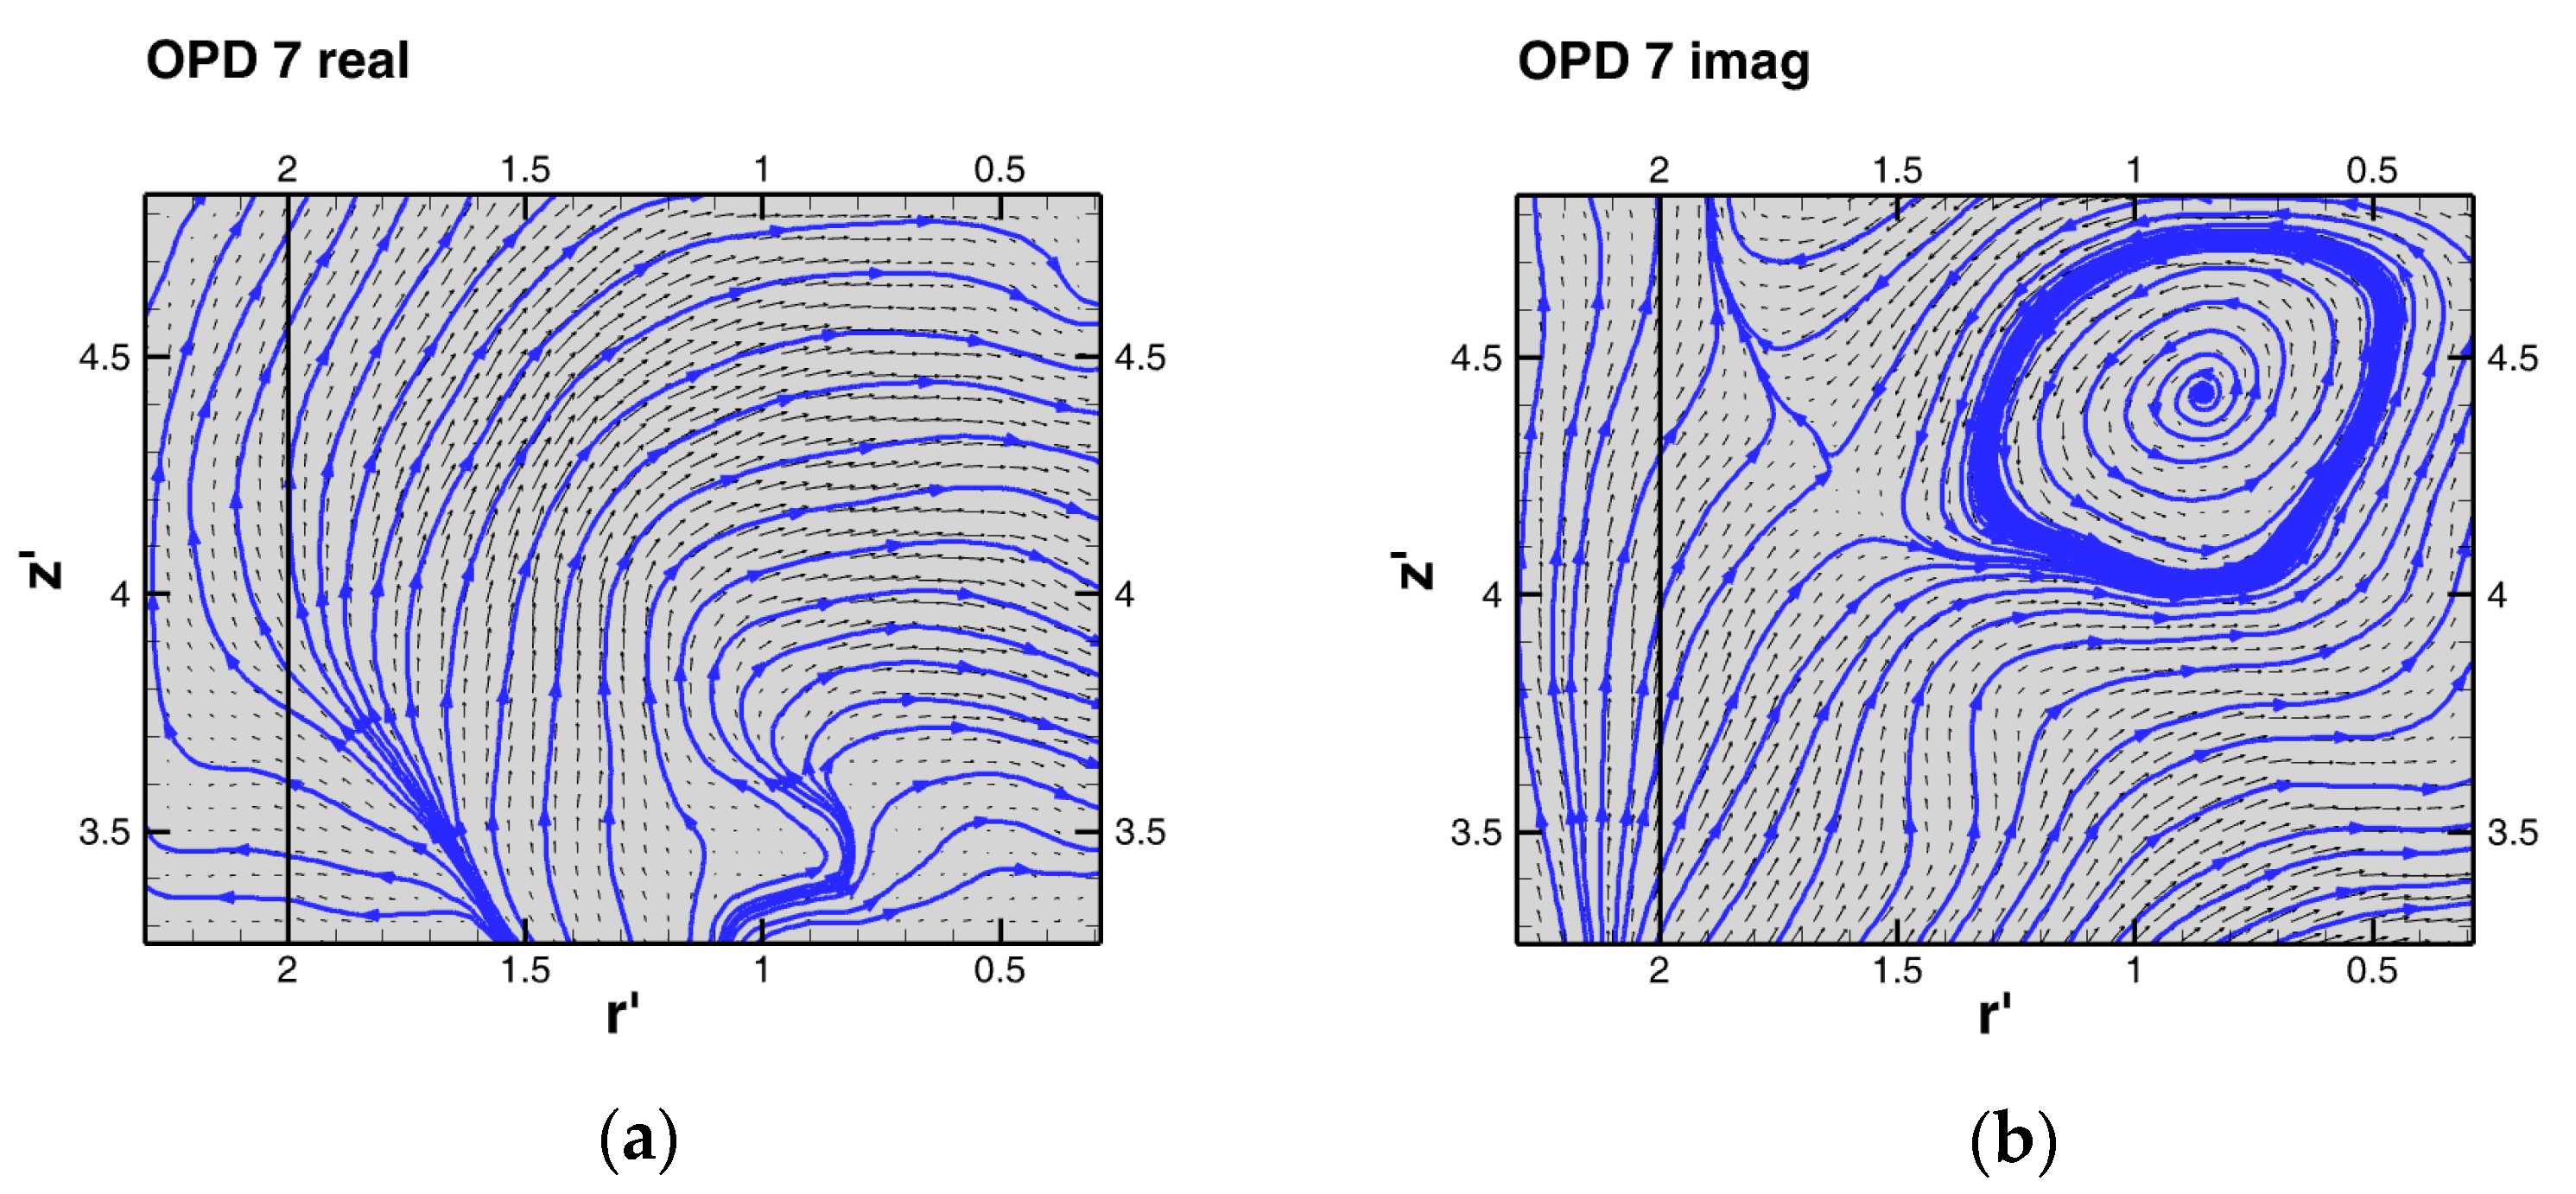
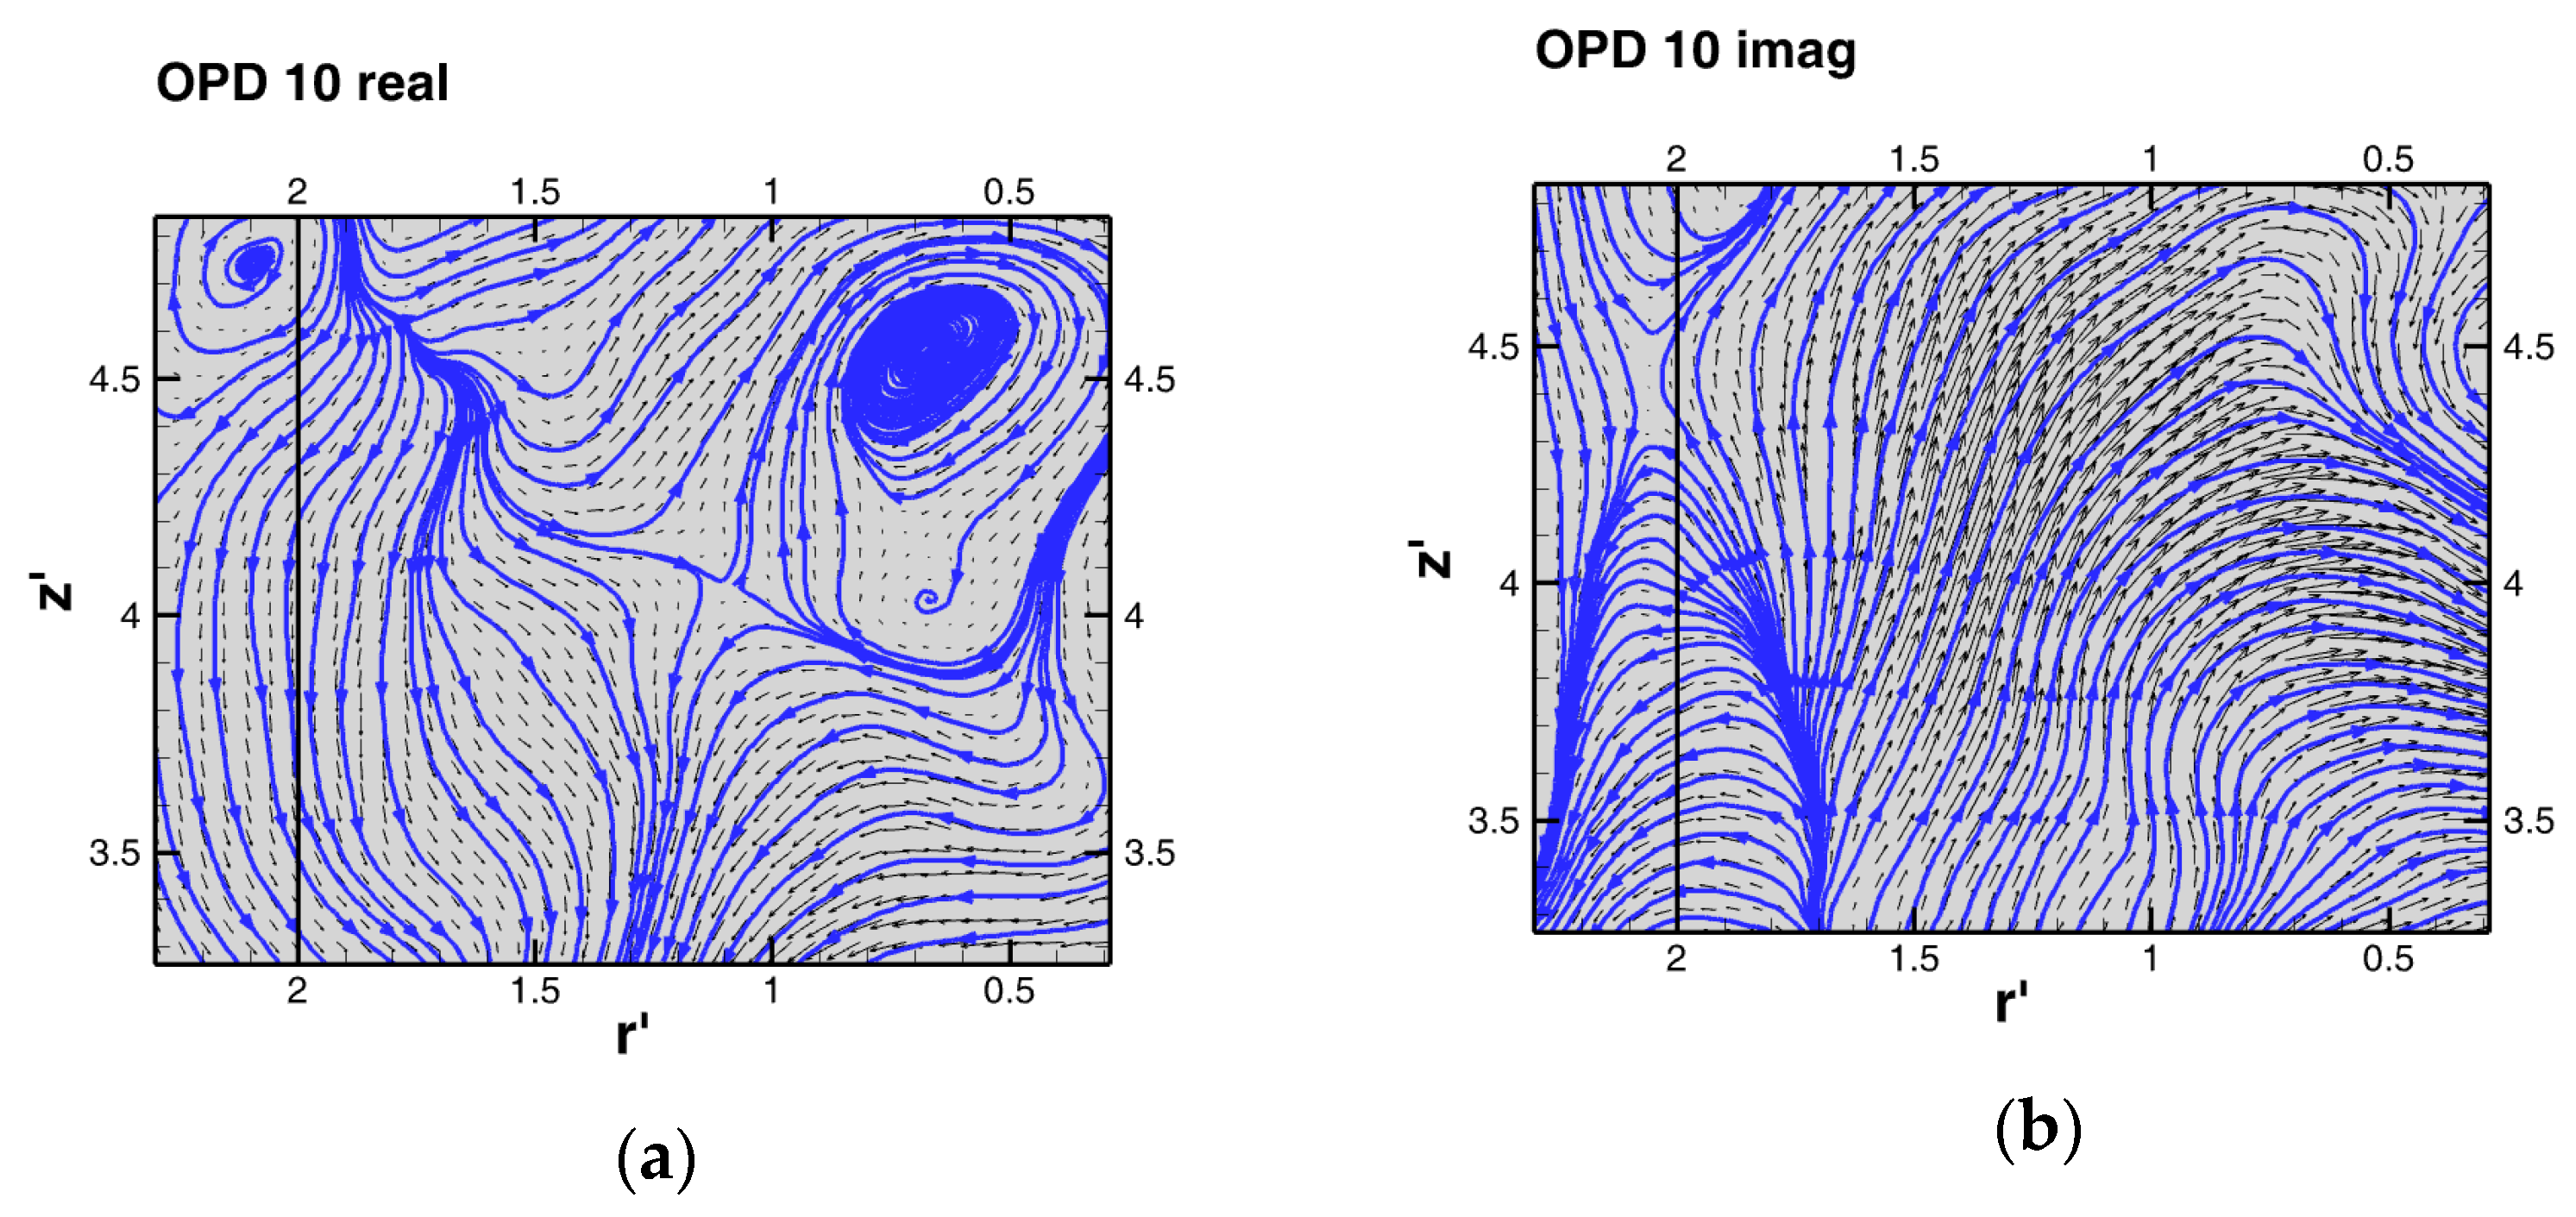
The dominant OPD mode 7 in the upper part is characterized by the dimensionless frequency F′ = 0.045, and the real and imaginary parts of the topology are shown in Figure 12.
The mode topology is dominated by the vortex in the imaginary part located at (0.8;4.5), and this vortex disappears in the real part. So, the vortex appears in positive (contra clockwise) and negative orientations during a single period, generating strong flow on the very top with alternative positive (from right to left) and negative orientations.
The other OPD mode 10 has both similar frequency F′ = 0.038 and topology, however the vortex is connected with the real part of the topology—see Figure 13.
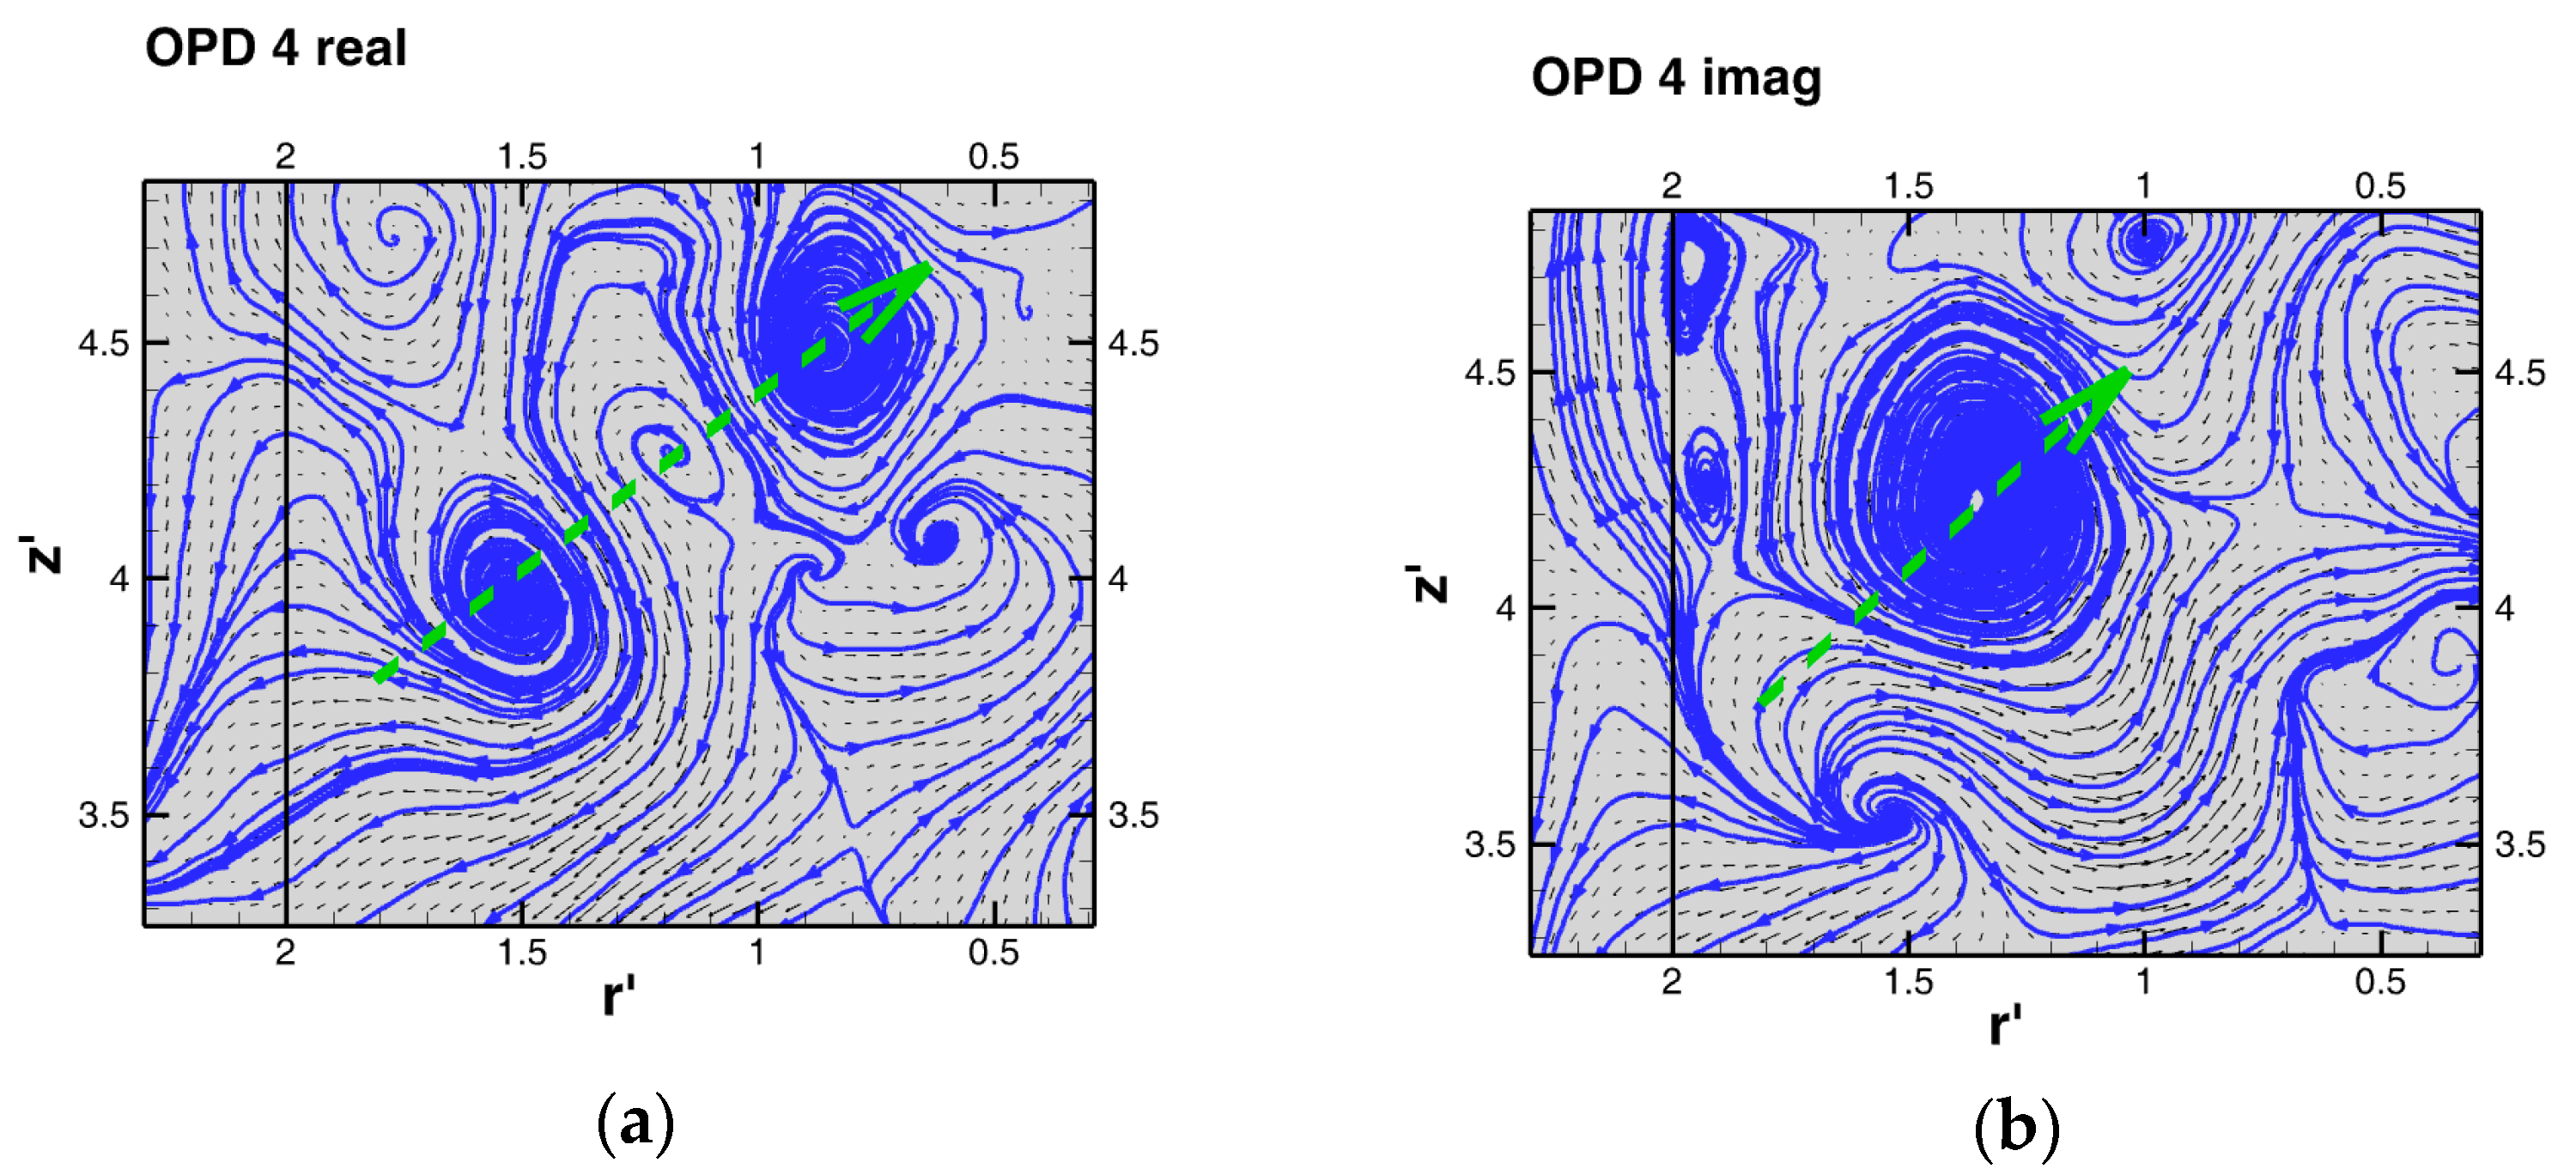
To show an example of the higher frequency dynamics, the OPD mode 4 is presented in Figure 14. The corresponding frequency, F′, is 0.202. The mode topology consists of a system of vortices forming the wave following the green broken line, moving along the measured area diagonally. Please note that the vortices pass across the jet, compared with Figure 4.
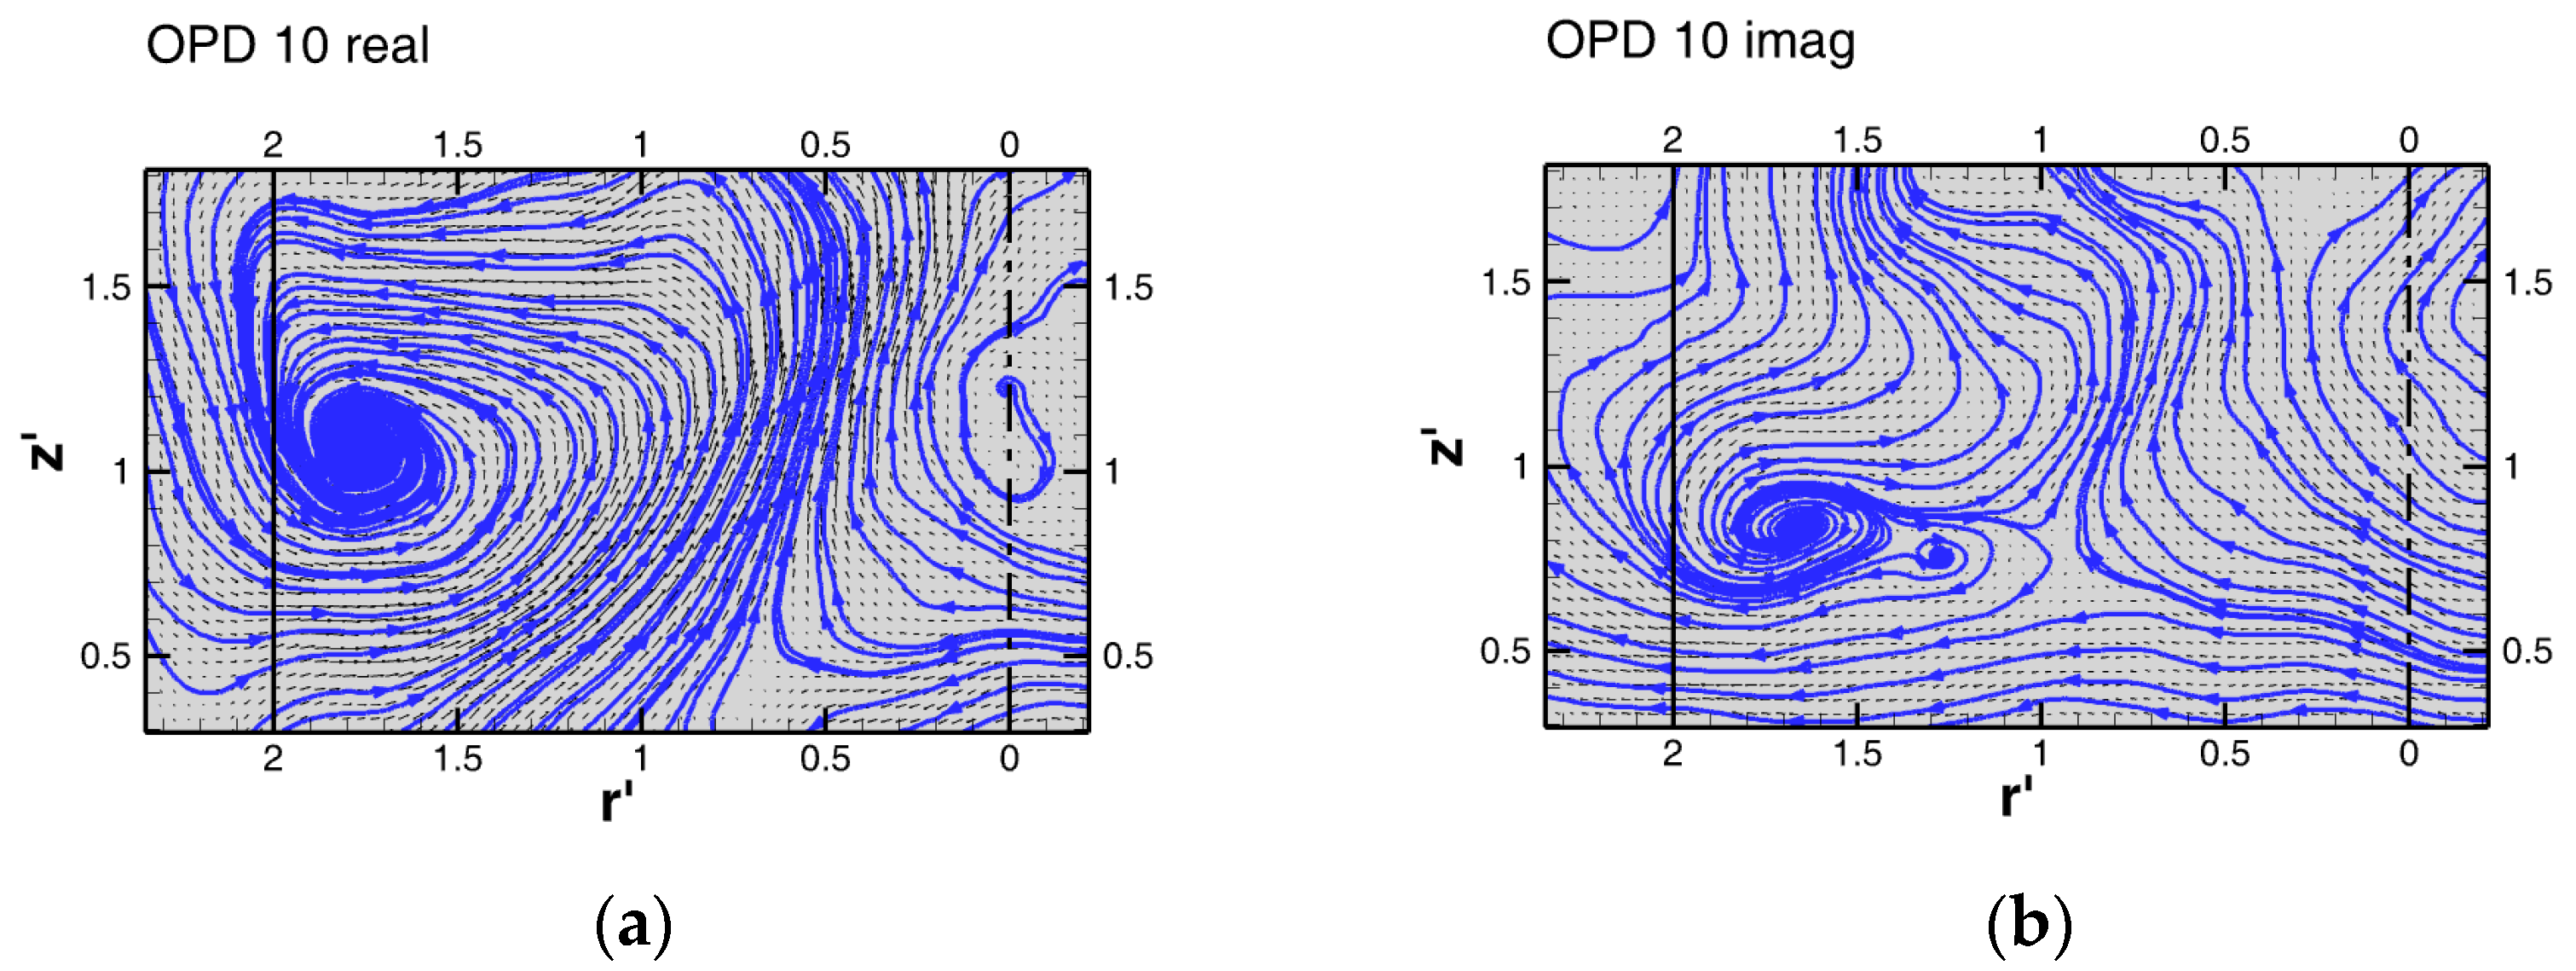
The bottom part of the vessel is less dynamical, and the dynamics are different than in the upper part. The dominant, most stable OPD mode 10 is characterized by the dimensionless frequency, F′ = 0.033. Topology is shown in Figure 15 and is dominated by a strong vortex sitting in fixed location (1.7;1) and changing orientation twice during the period.
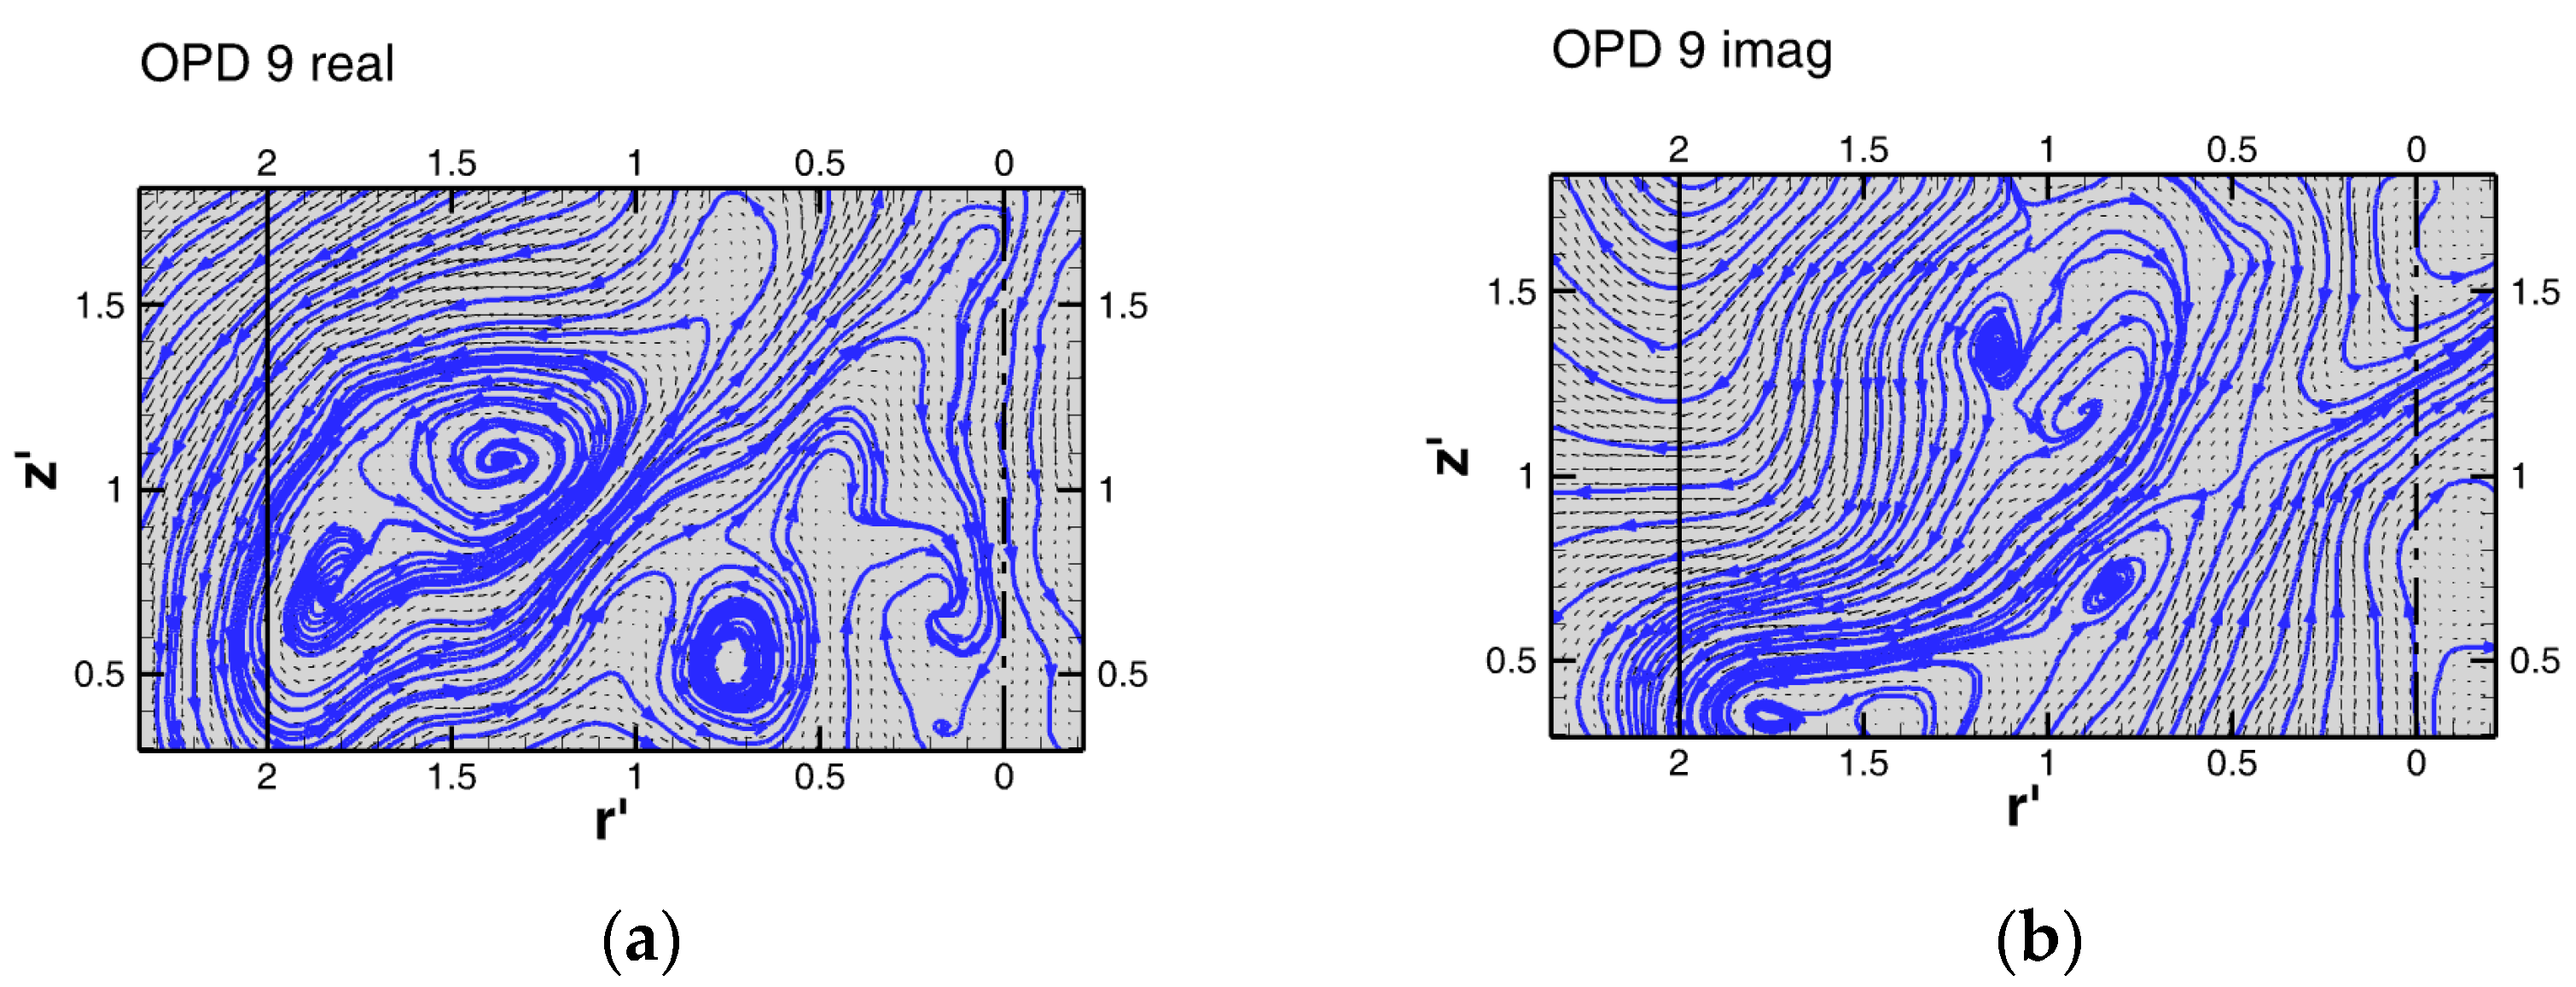
The other stable OPD mode 9 with frequency F′ = 0.081 shows the pair of oppositely oriented vortices relatively fixed in position, see Figure 16.
In the OPD mode 12, there is again a contrarotating vortex pair in the left part of the measuring plane moving periodically from lower position z′ = 0.5 to higher position z′ = about 1.3. Frequency is very low, about 0.010. The real and imaginary parts of the mode are shown in Figure 17.
In Figure 18, there is an example of high-frequency OPD mode 4 with F′ = 0.150. The topology is formed by two big vortices moving in radial direction.
The detected OPD modes represent moving vortices in the form of waves. The velocity of the structures is determined by the frequency and distance of the corresponding structures in the mode topology.
4. Discussion
Detected mean values of PCL center position are in good agreement with previous investigations, for example Reference [13], where authors present angle blade rotation resolved PBT mean flow field with PCL coordinates (as defined in our contribution) of r′ = 1.75 and z′ = 1.28, regardless of blade angle rotation value.
The impeller discharge jet is pointing diagonally to the bottom corner close to the wall and eventually impinging to it. It is as expected with the given pilot plant arrangement according to previous investigations, e.g., (Reference [14], Equation (9)).
The next important finding is that there are several “dead zones“, not participating on the overall macro-mixing within the plane A-A as well as within the plane B-B. One such area is under the impeller hub just near the bottom and close to the vessel middle, and the other is at the wall bottom corner. Next, “dead zones” within both planes could be considered in the area just under the liquid level close to the vessel middle and the area just above the impeller hub.
As the “dead zone”, also the area just behind the baffle near the liquid level within the plane C-C can be considered.
Added lines of zero mean radial and axial velocity magnitude show that the mean axial velocity direction distribution within the plane A-A is more or less symmetrical along the vertical plane symmetry axis (except the mentioned “dead zones”), which is derived from the dominance of impeller sucking and discharging within the right plane segment and the axial wall ascent current within the left segment. In contrast, the mean radial velocity direction distribution shows bigger dominance of the outward direction within the lower segment and inward direction within the upper segment derived from dominance of the radial directions of the impeller discharging and sucking jet, as well as the clockwise circulation of PCL and inward bending of the wall ascent current in the liquid level vicinity.
The same can be stated concerning V′ for the lower segment of the B-B plane. Concerning U′ within the lower segment for the plane B-B, it is noticeable that the outward direction predominantly prevails, as the mean radial dimension of the wall ascent axial current (and therefore, rate of gradual bending of U′ inward) is significantly smaller compared to plane A-A (see Figure 4, Figure 5 and Figure 6).
As for the U′ and V′ velocities’ comparison within plane A-A with Reference [22] presented in Table 4, it is possible to state the following.
Opposite direction of V1′ (−), V2′ (+) and lower magnitudes of V1′ for the points PCD1 and PCD3 within the area of PCL center suggest a certain shifting of the PCL core to the center of the vessel in the plane of reference [22], as well as the bigger radial distance of the points PCD1 and PCD3 from the PCL center compared to corresponding locations of Reference [22]. For the area within the strong impeller discharge jet (points IDJ1, IDJ2), higher magnitudes of the V2′ compared to the V1′ are expected due to the higher axial position of the zc2′ (closer to impeller) compared to the zc1′ positions of the IDJ1 and IDJ2 points. Similarly, the descending tendency of the V′ magnitudes along with descending axial positions within the impeller discharge jet are expected. As the value V2′ for the radial position out of the impeller rc2′ area has a positive upwards direction, it is possible to state that this point is out of the impeller discharge jet. Our IDJ3 point with the low axial position zc1′ close to the bottom has the lowest expected V1′ magnitude.
Concerning the upper wall ascent current area (points AC1–AC5), at zc2′ = 3.12 and the same radial locations rc2′ as locations rc1′, the magnitude of V2′ is quite a bit lower than magnitudes of V1′, while its direction is downwards. It corresponds to the above-mentioned findings, that within the plane far from the baffle upper wall, the ascent current is not present. The descending tendency of V′ magnitudes along with the raising axial position of points AC1–AC5 is expected, as the ascent current gets weaker approaching the liquid level. The magnitude of V2´ at lower wall current position [22] zc2′ = 1.24, i.e., similar axial position as lowest point AC1, is quite low as well, but its direction is upwards. It responds to the already noted finding that the ascent wall current exists within a plane far from baffle, just within the lower part of the vessel.
For comparison of radial velocities U1′ in points PCD1 and IDJ1 with U2′ in the nearest measured positions from Reference [22], it is possible to state, with respect to the middle values from (Reference [22] Figure 11), that there is a quite higher magnitude of U1′ within the point PCD1 compared to the U2′ magnitude within closer location at rc2′ = 1.438 [22] (which is around zero), which suggests stronger PCL circulation within our plane compared to the plane in Reference [22]. As noted above, this location is supposed to be close to the PCL core and therefore significantly higher magnitude of U1′. This difference also supports the idea of the above-mentioned PCL core shifting to the vessel center in Reference [22], because it is possible to suppose that the point PCD3 is more above the PCL center (i.e., within mostly radial flow), while the location from Reference [22] is shifted to the left from the PCL center (i.e., within mostly axial flow). About two times lower magnitude of U1´ within the impeller discharge jet (IDJ1) compared to U2′ at close location [22] is expected due to the higher axial position of zc2′ (closer to the impeller) than zc1′.
Generally, it is possible to state that the average dimensionless frequency of the PCL generation, and therefore whole PCL cycle, is 0.06, while the development of the generated PCL is within the vertical plane from its center (core), practically symmetrical with respect to all directions. One PCL cycle contains two significant oscillations on average and almost one achievement of PCL to z′ = 3.96.
Velocity frequency analysis within the area of the PCL shows that the phase of PCL sustaining within the plane A-A is significantly longer that the phase of the PCL disintegration. The PCL behavior within the plane B-B is expected to have a rather opposite tendency (i.e., significant shortening of the PCL sustaining phase, which can also be implied by a significantly smaller average PCL area within the plane B-B.) With respect to this finding, it is possible to consider the adjacent wall ascent current as the stabilization element (phenomenon) for the primary circulation sustaining.
According to the velocity frequency analysis within the area of the discharge jet, it is possible to state that dynamics of flow within point IJD probably expressed interference of the discharge jet and the jet reflected back from the bottom.
Furthermore, the close relation of F´ within PCL and the impeller discharge jet area suggests that these macro-structures are mutually significantly influenced, as described in previous investigations. For example, in Reference [6], the authors report practically identical flow patterns for the PBT impeller, such as double circulation, which expresses significant induction of PCL, and counterclockwise circulation at the bottom middle as well, and the impeller discharge jet (in contrast to our finding, for their geometry, C = T/2 impeller discharge jet in final phase impinging to vessel wall and not to bottom).
Values of dominant frequencies of points within the area of the macro-vortex under the impeller suggested that this one is developed from its center quite regularly. The close relation of these values with the impeller discharge jet F′ values confirms the above-stated influence of the impeller discharge jet on this macro-vortex dynamics.
Concerning detected F′1,2 (V) within wall ascent current (points AC1–AC5), two main groups of values were found, a high one 0.17, and a low one 0.025–0.05. Here, it is worth mentioning (Reference [23], Figure 11a–c), where the authors present a histogram of F´ for the experimental setup (PBT 45°, D = T/2, C = 0.67 D, and ReM = 4.8 × 10⁴) within a similar area above impeller and wall vicinity. Detection of the dominant F´ value of approximately 0.18 present for all 3 values of impeller off-bottom clearance and the F´2 value of approximately 0.07 at C = 0.67 D are with good agreement with our observations.
Generally, based on the presented results of frequency analysis within plane B-B and its comparison with analogical values within the plane A-A, it is possible to state the following.
Significantly lower values of DF within the impeller discharge jet and MW at the bottom middle vessel, along with more or less proportionally lower values for the PCL area compared to DF of analogical points within the plane A-A, imply that these macro-structures influence the impeller discharge jet and not vice-versa. This hypothesis is supported by the fact that there is not any apparent (for example geometrical) reason for different macro-dynamics of the impeller discharge jet in this plane and the plane A-A.
Concerning detected flow pattern within the plane C-C, it is generally possible to consider the flow field behind the baffle as a kind of wake. This is also confirmed by previous findings [1,3], that show that the corresponding liquid surface MI is present exclusively within the area in front of the baffle (regarding to the impeller revolution direction). The vector flow-field with contour of axial velocity magnitude shows no apparent significant difference in front of the baffle in the plane A-A, and therefore it allows the main flow field to ascent wall current and it is essentially horizontally homogeneous within its whole axial length.
There is a tangential position of the wall ascent current within the plane C-C due to baffle, confirming the finding of previous work [12], where tangential dimensionless position of maximal MI is reported within interval 0.1–0.25 in front of the baffle.
According to the results of velocity frequency analysis of points within the plane C-C wall ascent current area, it is possible to state that detected differences of frequency values compared to plane A-A imply certain horizontal non-homogeneity of wall ascending current macro-dynamics and respectively, influence of horizontal position due to the baffle for this characteristic.
The significantly lower value of the velocity dominant frequency at the highest point just under liquid level within the plane C-C compared to the corresponding point within the plane A-A is in agreement with findings presented in previous contributions [1,12,15,17] dealing with investigation of liquid level behavior with the help of visualization, conducting probe, or CFD simulation. These works state that MI originates predominately at baffle edge radial position with some tangential distance due to the baffle, and disappears tangentially at the baffle position and radially at the front of the baffle (i.e., towards the center of vessel), with maximal reaching to the inner baffle margin. The MI directly adjacent to the baffle appeared very rarely.
Concerning the area of the wake behind the baffle, due to the close relation of dominant frequency values within points here, and points at the front of the baffle within the wall ascent current (for the planes C-C and A-A as well), is possible to state that there exist significant influences of the macro-dynamics of the ascent current front of the baffle on the macro-dynamics of the descent current behind the baffle, and therefore significant tangential flow around the baffle induced by ascent current in front of the baffle should be present.
The significantly lower value of the velocity dominant frequency and mean axial velocity (see Figure 7) behind the lower part of the baffle compared to the upper part behind the baffle confirms that this area can be considered as the predominantly chaotic zone without significant dominant flow, similar to the location near the liquid level, just narrowly behind the baffle. Only slightly higher dynamics activity (TKE′, see Figure 8,c) compared to the upper segment can be detected.
5. Conclusions
The presented study provided deeper insight into the macro-instabilities dynamics, which are generated by the mixing process in a standard mixing vessel. The frequencies corresponding to the individual macrostructures have been detected together with the other (quasi)periodic substructures presented within the overall flow. Low-frequency behavior of the studied macrostructures was confirmed with frequency values closely related to those detected in previous works, and they were identified as macro-instabilities frequencies. Typical flow-dynamics are in the form of vortex trains or waves. This information is new, and it was acquired with the help of application of the new method, OPD.
Based on the obtained results, the following conclusions could be drawn about the MI dynamics. The PCL is driven and stabilized by the ascent current adjacent to the baffle. In the plane A-A close to the baffle, the PCL is bigger and longer lasting than in the off-baffle plane B-B. The strong axial wall current reaching the liquid level is present just along the front side of the baffle (relative to the impeller revolution direction), as we proved with measurements in the plane C-C, and this means that the current is induced by the baffle. The detected frequency values within the impeller discharge jet indicated that it interferes with the jet reflected back significantly near the bottom. The other close frequencies here and in the PCL suggest that these macro-structures interact together significantly, as described in previous investigations. For example, Nurtono et al. [6] reported almost identical flow patterns for the PBT impeller, such as double circulation, which expresses significant induction of PCL, and counterclockwise circulation at the bottom middle as well, and the impeller discharge jet. However, in contrast to our finding, in their geometry C = T/2, the impeller discharge jet is impinging to the vessel wall and not to the bottom. The values of dominant frequencies in the points within the area of the macro-vortex below the impeller suggest that it is developed quite regularly from its center and there is a close relation with the impeller discharge jet. This confirms the above-stated influence of the impeller discharge jet on the macro-vortex dynamics. However, it is worthy to note that significantly lower frequency values in the impeller discharge jet and MV at the bottom center of the vessel along with more or less proportionally lower values in the PCL area within the plane B-B, compared with analogical points within the plane A-A, imply that these macro-structures affect the impeller discharge jet, but the opposite is not true. This hypothesis is supported by the fact that there is no apparent (for example geometrical) reason for different macro-dynamics of the impeller discharge jet in this plane and the plane A-A. Finally, it is possible to state that the measurement results within the plane C-C prove a quite different character of the flow in front and behind the baffle. The flow behind the baffle can be considered as a wake of the flow in front of the baffle. This statement can be supplemented by noticing that due to the detected influence of the flow in front of the baffle on the flow behind it, a non-negligible tangential current around the baffle is present.
Author Contributions
Conceptualization, T.B. and V.U.; methodology, P.P.; formal analysis, V.U.; resources T.B.; writing—original draft preparation, T.B.; writing—review and editing, V.U.; visualization, P.P.; supervision, V.U. All authors have read and agreed to the published version of the manuscript.
Funding
The authors thank the Institute of Thermomechanics, Academy of Sciences of the Czech Republic, for funding by the institutional support RVO:61388998.
Institutional Review Board Statement
Not applicable.
Informed Consent Statement
Not applicable.
Data Availability Statement
Data is contained within the article.
Acknowledgments
This research was supported by the Ministry of Industry and Trade of the Czech Republic under the grant project FV30104 “Suction and discharge objects of pump and turbine stations“.
Conflicts of Interest
The authors declare no conflict of interest.
References
- Klaassen, G.P.; Peltier, W.R. The influence of stratification on secondary instability in free shear layers. J. Fluid Mech. 1991, 227, 71–106. [Google Scholar] [CrossRef]
- Brůha, O.; Fort, I.; Smolka, P. A large scale unsteady phenomenon in a mixing vessel. Acta Polytech. 1993, 33, 27–35. [Google Scholar]
- Brůha, T.; Smolka, P.; Jahoda, M.; Fořt, I. Dynamics of flow macro-formation and its interference with liquid surface in mixing vessel with pitched blade impeller. Chem. Eng. Res. Des. 2001, 89, 2279–2290. [Google Scholar] [CrossRef]
- Jakubowski, M. Secondary flows occurring in a whirlpool separator—a study of phenomena—observation, simulation and measurements. Chem. Process. Eng. 2015, 36, 277–289. [Google Scholar] [CrossRef] [Green Version]
- Kysela, B.; Jašíková, D.; Konfršt, J.; Šulc, R.; Ditl, P. Estimation of turbulence dissipation rate by Large eddy PIV method in an agitated vessel. In EPJ Web of Conferences; EDP Sciences: Les Ulis, France, 2015; Volume 92, p. 02045. [Google Scholar]
- Nurtono, T.; Setyawan, H.; Altway, A.; Winardi, S. Macro-Instability Characteristic in Agitated Tank Based on Flow Visualization Experiment and Large Eddy Simulation. Chem. Eng. Res. Des. 2009, 87, 923–942. [Google Scholar] [CrossRef]
- Gillissen, J.J.J.; Van den Akker, H.E.A. Direct Numerical Simulation of the Turbulent Flow in a Baffled Tank Driven by a Rushton Turbine. Aiche J. 2012, 58, 3878–3890. [Google Scholar] [CrossRef]
- Khan, F.R. Investigation of Turbulent Flows and Instabilities in a Stirred Vessel Using Particle Image Velocimetry. Ph.D. Thesis, Loughborough University, Loughborough, UK, 2005. Available online: https://ethos.bl.uk/OrderDetails.do?uin=uk.bl.ethos.420146 (accessed on 1 March 2021).
- Brůha, O.; Fort, I.; Smolka, P. Phenomenon of turbulent macro-instabilities in agitated system. Collect. Czech. Chem. Commun 1994, 60, 85–94. [Google Scholar] [CrossRef]
- Brůha, O.; Brůha, T.; Fort, I.; Jahoda, M. Dynamics of the flow pattern in a baffled mixing vessel with an axial impeller. Acta Polytech. 2007, 47, 17–26. [Google Scholar]
- Hasal, P.; Montes, J.L.; Boisson, H.C.; Fort, I. Macro-instabilities of velocity field in stirred vessel, detection and analysis. Chem. Eng. Sci. 2000, 55, 391–401. [Google Scholar] [CrossRef]
- Paglianti, A.; Montante, G.; Magelli, F. Novel experiments and mechanistic model for macro instabilities in stirred tanks. Aiche J. 2006, 52, 426–437. [Google Scholar] [CrossRef]
- Montes, J.-L.; Boisson, H.C.; Fořt, I.; Jahoda, M. Velocity Field Macro-Instabilities in an Axially Agitated Mixing Vessel. Chem. Eng. J. 1997, 67, 139–145. [Google Scholar] [CrossRef]
- Jahoda, M.; Moštek, M.; Fořt, I.; Hasal, P. CFD simulation of free liquid surface motion in a pilot plant stirred tank. Can. J. Chem. Eng. 2011, 89, 716–724. [Google Scholar] [CrossRef]
- Bittorf, K.V.; Kresta, S.M. Active volume of mean circulation for stirred tanks agitated with axial impellers. Chem. Eng. Sci. 2000, 55, 1325–1335. [Google Scholar] [CrossRef]
- Roussinova, V.T.; Kresta, S.M.; Weetman, R. Low frequency macro instabilities in stirred tank: Scale-up and prediction based on large eddy simulations. Chem. Eng. Sci. 2003, 58, 2297–2311. [Google Scholar] [CrossRef]
- Frisch, U. Turbulence: The Legacy of A. N. Kolmogorov; Cambridge University Press: Cambridge, UK, 1995. [Google Scholar]
- Machado, M.B.; Bittorf, K.J.; Roussinova, V.T.; Kresta, S.M. Transition from turbulent to transitional flow in the top half of a stirred tank. Chem. Eng. Sci. 2013, 98, 218–230. [Google Scholar] [CrossRef]
- Dantec Dynamics A/S. DynamicStudio User’s Guide V7.0; Dantec Dynamics A/S: Copenhagen, Denmark, 2020. [Google Scholar]
- Uruba, V. Near wake dynamics around a vibrating airfoil by means of PIV and Oscillation Pattern Decomposition at Reynolds number of 65,000. J. Fluids Struct. 2015, 55, 372–383. [Google Scholar] [CrossRef]
- Uruba, V. Decomposition Methods in Turbulence Research. In EPJ Web of Conferences; EDP Sciences: Les Ulis, France, 2011; Volume 25, p. 01095. [Google Scholar]
- Pianko-Oprych, P.; Nienow, A.W.; Barigou, M. Positron emission particle tracking (PEPT) compared to particle image velocimetry (PIV) for studying the flow generated by a pitched -blade turbine in single phase and multi-phase systems. Chem. Eng. Sci. 2009, 64, 4955–4968. [Google Scholar] [CrossRef]
- Roussinova, V.T.; Kresta, S.M.; Weetman, R. Resonant Geometries for Circulation Pattern Macroinstabilities in Stirred Tank. Fluid Mech. Transp. Phenom. 2004, 50, 2986–3005. [Google Scholar] [CrossRef]
Figure 1.
Pilot plant experiment equipment: (a) front view, (b) floor plan.

Figure 2.
Pitched blade impeller detail: (a) floor plan, (b) front view.

Figure 3.
Definition of the planes of measurement.

Figure 4.
The mean vector velocity fields in planes of measurement (a) A-A and (b) B-B.

Figure 5.
The mean radial velocity component U’ fields in planes of measurement (a) A-A and (b) B-B.
Figure 5.
The mean radial velocity component U’ fields in planes of measurement (a) A-A and (b) B-B.

Figure 6.
The mean axial velocity component V’ fields in planes of measurement (a) A-A and (b) B-B.

Figure 7.
The mean vector velocity field (a), U’ (b) and V’ (c) distributions in the plane of measurement C-C.
Figure 7.
The mean vector velocity field (a), U’ (b) and V’ (c) distributions in the plane of measurement C-C.

Figure 8.
Distributions of the turbulent kinetic energy (TKE) in measuring planes (a) A-A, (b) B-B and (c) C-C.
Figure 8.
Distributions of the turbulent kinetic energy (TKE) in measuring planes (a) A-A, (b) B-B and (c) C-C.

Figure 9.
Distributions of the correlation coefficient CC in measuring planes (a) A-A, (b) B-B and (c) C-C.
Figure 9.
Distributions of the correlation coefficient CC in measuring planes (a) A-A, (b) B-B and (c) C-C.

Figure 10.
Selected points in planes of measurement (a) A-A, (b) B-B, and (c) C-C. Legend of points marking: PCD1-5: Primary Circulation Down; PCU1-3: Primary Circulation Up; IDJ1-3: Impeller Discharge Jet; MVD1-2: Macro-Vortex Down; AC1-7: Ascent Current; DC1, DC2: Lower, Upper Descent wall Current; UDC, LDC: Upper, Lower wake behind baffle.

Figure 11.
The OPD spectra of upper and lower flow-field parts, plane A-A.

Figure 12.
The OPD mode 7, upper flow-field parts, plane A-A, (a) real and (b) imaginary parts.

Figure 13.
The OPD mode 10, upper flow-field parts, plane A-A, (a) real and (b) imaginary parts.

Figure 14.
The OPD mode 4, upper flow-field parts, plane A-A, (a) real and (b) imaginary parts.

Figure 15.
The OPD mode 10, lower flow-field parts, plane A-A, (a) real and (b) imaginary parts.

Figure 16.
The OPD mode 9, lower flow-field parts, plane A-A, (a) real and (b) imaginary parts.

Figure 17.
The OPD mode 12, lower flow-field parts, plane A-A, (a) real and (b) imaginary parts.

Figure 18.
The OPD mode 4, lower flow-field parts, plane A-A, (a) real and (b) imaginary parts.


Table 1.
Dominant frequencies of velocity components (comp.) within the selected points in the plane A-A.
Table 1.
Dominant frequencies of velocity components (comp.) within the selected points in the plane A-A.
| Point | r′ | z′ | Comp. | U′ | V′ | L′ | F′1 | F′2 | A1/A2 |
|---|---|---|---|---|---|---|---|---|---|
| PCD1 | 1.5 | 1.25 | L | −0.054 | −0.025 | 0.06 | 0.06 | 0.03 | 1.15 |
| PCD2 | 1.396 | 0.771 | L | −0.109 | −0.050 | 0.12 | 0.0045 | 0.11 | 1.73 |
| PCD3 | 1.438 | 0.958 | L | −0.113 | −0.050 | 0.123 | 0.01 | 0.11 | 1.43 |
| PCU3 | 1.625 | 3.479 | L | 0.079 | 0.086 | 0.117 | 0.05 | 0.1 | 1.17 |
| PCD4 | 1.771 | 0.542 | L | −0.015 | 0.015 | 0.021 | 0.12 | ||
| PCD5 | 1.708 | 0.583 | L | −0.035 | 0.005 | 0.035 | 0.12 | ||
| IDJ1 | 0.625 | 1.146 | V | −0.115 | −0.178 | 0.212 | 0.1 | ||
| IDJ2 | 0.875 | 1 | V | −0.135 | −0.158 | 0.208 | 0.1 | ||
| IDJ3 | 1.458 | 0.625 | V | −0.073 | −0.032 | 0.079 | 0.11 | ||
| IDJ4 | 1.521 | 0.417 | V | −0.030 | −0.013 | 0.033 | 0.01 | ||
| MVD1 | 0.521 | 0.563 | L | −0.020 | 0.033 | 0.038 | 0.14 | ||
| MVD2 | 0.729 | 0.563 | L | −0.030 | 0.004 | 0.031 | 0.13 | ||
| AC1 | 2.083 | 3.188 | V | 0.045 | 0.153 | 0.159 | 0.05 | 0.17 | 1.22 |
| AC2 | 2.083 | 3.646 | V | 0.028 | 0.144 | 0.147 | 0.17 | 0.05 | 1.46 |
| AC3 | 2.188 | 4.479 | V | 0.017 | 0.109 | 0.111 | 0.05 | ||
| AC4 | 2.188 | 4.708 | V | 0.02 | 0.088 | 0.09 | 0.05 | ||
| AC5 | 2.188 | 4.875 | V | 0.016 | 0.052 | 0.054 | 0.02 |
Table 2.
Dominant frequencies of velocity components within the selected points in the plane B-B.
| Point | r′ | z′ | Comp. | F′1 |
|---|---|---|---|---|
| PCD1 | 1.35 | 1.25 | L | 0.02 |
| PCU1 | 1.645 | 1.604 | L | 0.02 |
| PCU2 | 1.875 | 1.833 | L | 0.04 |
| PCD2 | 1.175 | 1.042 | L | 0.03 |
| IDJ1 | 0.625 | 1.146 | V | 0.02 |
| IDJ2 | 0.938 | 0.729 | V | 0.01 |
| MVD1 | 0.425 | 0.625 | L | 0.04 |
| MVD2 | 0.458 | 0.354 | L | 0.1 |
| AC1 | 2.293 | 0.938 | V | 0.03 |
| AC2 | 2.293 | 1.583 | V | 0.01 |
| DC1 | 1.98 | 3.292 | V | 0.003 |
| DC2 | 2.293 | 4.167 | V | 0.003 |
Table 3.
Dominant frequencies of velocity components within the selected points in the plane C-C.
| Point | t′ | z′ | Comp. | F′1 |
|---|---|---|---|---|
| AC 1 | 0.208 | 3.292 | V | 0.04 |
| AC 2 | 0.258 | 3.667 | V | 0.11 |
| AC 3 | 0.258 | 4 | V | 0.03 |
| AC 4 | 0.258 | 4.271 | V | 0.03 |
| AC 5 | 0.258 | 4.458 | V | 0.03 |
| AC 6 | 0.258 | 4.583 | V | 0.03 |
| AC 7 | 0.258 | 4.875 | V | 0.003 |
| UDC | −0.875 | 4.021 | T | 0.07 |
| LDC | −0.875 | 3.5 | T | 0.01 |
Table 4.
Comparison of mean velocities components U′ and V′ within the plane A-A with those presented in a previous investigation [22].
Table 4.
Comparison of mean velocities components U′ and V′ within the plane A-A with those presented in a previous investigation [22].
| Point | zc2′ [22] | zc1′ | rc2′ [22] | rc1′ | U2′ [22] | U1′ | V2′ [22] | V1′ |
|---|---|---|---|---|---|---|---|---|
| PCD1 | 0.66 | 0.625 | 1.5 | 1.5 | 0.1 | −0.025 | ||
| PCD3 | 0.66 | 0.479 | 1.438 | 1.438 | 0.07 | −0.05 | ||
| IDJ2 | 0.66 | 0.5 | 0.875 | 0.875 | −0.23 | −0.158 | ||
| IDJ1 | 0.66 | 0.57 | 0.625 | 0.625 | −0.18 | −0.178 | ||
| IDJ3 | 0.66 | 0.3125 | 1.458 | 1.458 | 0.09 | −0.032 | ||
| AC1 | 3.12 | 1.59 | 2 | 2.083 | −0.045 | 0.153 | ||
| AC2 | 3.12 | 1.82 | 2 | 2.083 | −0.045 | 0.144 | ||
| AC3 | 3.12 | 2.24 | 2 | 2.188 | −0.045 | 0.109 | ||
| AC4 | 3.12 | 2.35 | 2 | 2.188 | −0.045 | 0.088 | ||
| AC5 | 3.12 | 2.44 | 2 | 2.188 | −0.045 | 0.052 | ||
| [22] B | 1.24 | 2 | 0.05 | |||||
| PCD1 | 0.76 | 0.625 | 1.5 | 1.5 | 0.0 (+/−) | −0.054 | ||
| IDJ1 | 0.76 | 0.57 | 0.625 | 0.625 | −0.25 | −0.115 |
Publisher’s Note: MDPI stays neutral with regard to jurisdictional claims in published maps and institutional affiliations. |
© 2021 by the authors. Licensee MDPI, Basel, Switzerland. This article is an open access article distributed under the terms and conditions of the Creative Commons Attribution (CC BY) license (http://creativecommons.org/licenses/by/4.0/).
Share and Cite
MDPI and ACS Style
Brůha, T.; Procházka, P.; Uruba, V. Investigation of Low-Frequency Phenomena within Flow Pattern in Standard Mixing Vessel Induced by Pitched Blade Impeller. Processes 2021, 9, 545. https://doi.org/10.3390/pr9030545
AMA Style
Brůha T, Procházka P, Uruba V. Investigation of Low-Frequency Phenomena within Flow Pattern in Standard Mixing Vessel Induced by Pitched Blade Impeller. Processes. 2021; 9(3):545. https://doi.org/10.3390/pr9030545
Chicago/Turabian StyleBrůha, Tomáš, Pavel Procházka, and Václav Uruba. 2021. "Investigation of Low-Frequency Phenomena within Flow Pattern in Standard Mixing Vessel Induced by Pitched Blade Impeller" Processes 9, no. 3: 545. https://doi.org/10.3390/pr9030545
Note that from the first issue of 2016, this journal uses article numbers instead of page numbers. See further details here.