Article

Carbon Transfer from the Host Diatom Enables Fast Growth and High Rate of N2 Fixation by Symbiotic Heterocystous Cyanobacteria

1
School of Oceanography, University of Washington, 1492 NE Boat St., Seattle, WA 98105, USA
2
Department of Earth, Atmospheric and Planetary Sciences, Massachusetts Institute of Technology, Cambridge, MA 02139, USA
3
School of Earth and Ocean Sciences, Cardiff University, Main Building, Park Place, Cardiff CF10 3AT, UK
4
Institute of Microbiology, The Czech Academy of Sciences, 379 81b Třeboň, Czech Republic
*
Author to whom correspondence should be addressed.
Plants 2020, 9(2), 192; https://doi.org/10.3390/plants9020192
Submission received: 10 December 2019 / Revised: 20 January 2020 / Accepted: 30 January 2020 / Published: 4 February 2020
(This article belongs to the Special Issue Nitrogen-Fixing Plants )

Abstract

:
Diatom–diazotroph associations (DDAs) are symbioses where trichome-forming cyanobacteria support the host diatom with fixed nitrogen through dinitrogen (N2) fixation. It is inferred that the growth of the trichomes is also supported by the host, but the support mechanism has not been fully quantified. Here, we develop a coarse-grained, cellular model of the symbiosis between Hemiaulus and Richelia (one of the major DDAs), which shows that carbon (C) transfer from the diatom enables a faster growth and N2 fixation rate by the trichomes. The model predicts that the rate of N2 fixation is 5.5 times that of the hypothetical case without nitrogen (N) transfer to the host diatom. The model estimates that 25% of fixed C from the host diatom is transferred to the symbiotic trichomes to support the high rate of N2 fixation. In turn, 82% of N fixed by the trichomes ends up in the host. Modeled C fixation from the vegetative cells in the trichomes supports only one-third of their total C needs. Even if we ignore the C cost for N2 fixation and for N transfer to the host, the total C cost of the trichomes is higher than the C supply by their own photosynthesis. Having more trichomes in a single host diatom decreases the demand for N2 fixation per trichome and thus decreases their cost of C. However, even with five trichomes, which is about the highest observed for Hemiaulus and Richelia symbiosis, the model still predicts a significant C transfer from the diatom host. These results help quantitatively explain the observed high rates of growth and N2 fixation in symbiotic trichomes relative to other aquatic diazotrophs.

1. Introduction

Diatom–diazotroph associations (DDAs) are symbioses where the diazotrophs (e.g., Richelia and Calothrix sp.) are associated with diatoms (e.g., Hemiaulus, Rhizosolenia, and Chaetoceros sp.) [1,2,3,4,5,6,7]. They are widely observed [5,8,9,10,11,12,13,14,15,16] and predicted [17,18,19] in warm waters of the ocean. The symbiotic diazotrophs form a trichome where generally only one specialized cell, called a heterocyst, fixes dinitrogen (N2). The remaining cells in the trichome, called vegetative cells, are phototrophic and divide, whereas heterocysts do not. Despite the seemingly ideal combination of cells specialized for carbon (C) and nitrogen (N) acquisition, the trichomes have rarely been observed as free-living organisms in the marine environment [20,21]. This indicates that the trichomes receive some essential nutrients, which allow them to grow more efficiently as a part of the symbiosis. Recent studies revealed simplified N pathways in Richelia [7] and a significant amount of fixed N transferred to the diatom host from its symbiont [6]. The exchange of C between the diatom hosts and trichomes has been anticipated, but it has not been clearly demonstrated [2,22,23]. This is in contrast to cyanobacteria–plant symbiosis where the cyanobiont becomes photosynthetically inactive [23,24,25,26,27] and C transfer from the host has been directly observed [23,24,28,29,30].
In addition to the high rate of N2 fixation, a compilation of observed growth rate [31] shows a higher mean growth rate for DDAs than other, non-symbiotic, marine cyanobacterial diazotrophs. This enhanced growth is an essential assumption for an ecosystem model to reproduce observed seasonal blooms of DDAs in the oligotrophic ocean [31]. In general, the marine cyanobacterial diazotrophs grow at approximately 0.3 (d−1) under nutrient replete diazotrophic cultures [32,33,34,35,36], whereas Richelia in RhizosoleniaRichelia symbiosis can grow as high as 0.87 (d−1) in diazotrophic conditions [1,2]. In addition, in situ studies show that the growth rate of Crocosphaera (unicellular diazotrophic cyanobacteria) is low (0.001–0.15 (d−1)) in comparison with Richelia in HemiaulusRichelia symbiosis, which grew up to 0.59 (d−1) [6]. What makes the high rates of N2 fixation and growth possible? Here, we seek to quantify the extent to which the enhanced growth and N2 fixation rates in the trichomes could be caused by the exchange of resources with the host diatom.
To quantitatively examine the host–trichome nutrient exchange, we have developed a coarse-grained model of the HemiaulusRichelia symbiosis (cell flux model of DDAs: CFM-DDA) adapting relevant parts from previous CFMs [37,38,39,40,41], such as an idealized metabolic-flux network constrained by mass, energy, and electron budget. Extensive quantitative characteristics exist for this symbiosis [6], including cell volume and the number of trichomes per diatom. The availability of these cellular characteristics and their relative consistency make this symbiosis an ideal candidate for modeling. The CFM-DDA model we develop here focuses on C and N metabolisms to quantify growth and N2 fixation (Figure 1). For most N2-fixing organisms, oxygen (O2) metabolism is important, since O2 damages the N2 fixing enzyme, nitrogenase, and may control the rate of N2 fixation [39,40,42,43,44]. However, since the trichomes form a heterocyst, a cell with a thick glycolipid layer to minimize O2 influx [45], we assume that intracellular O2 is managed with normal levels of respiration [37,46]. This simplification allows us to focus on the metabolisms of C and N as the basis of the symbiosis. O2 metabolism could straightforwardly be included in our modeling framework if required by future observations.
Here, we resolve only four processes (CFM-DDA, Figure 1): photosynthesis, biosynthesis, respiration, and N2 fixation. Photosynthesis and biosynthesis are done only by the host diatom and vegetative cells whereas N2 fixation is performed only by the heterocysts. Respiration is done by all cells and adjusts to meet the energetic demand for all the other processes. We scaled the rate of photosynthesis based on the cellular N quota, which was estimated from the typical cell volumes (3493.5 µm3 for a diatom, 18.8 µm3 for a vegetative cell, and 61.0 µm3 for a heterocyst) [6], empirical volume–C relationship [47], and an assumed elemental stoichiometry (C:N of 6.6) [48], as well as the ratio of vegetative–cell:heterocyst of 4:1 and two Richelia trichomes per diatom based on the available microscopic images [6,7,49,50] (see Methods). The predicted balance of photosynthesis and metabolic demand for C suggests that a significant amount of C is transferred from the host to the trichome, sustaining its high rate of N2 fixation and enhanced growth.

2. Results and Discussion

2.1. Nitrogen Budget

The model results suggest that the trichomes (Richelia) fix significantly more N per unit C than other photoautotrophic diazotrophs (Figure 2A). Based on the size differences, the diatom contains 4.5 times more N than the trichomes. Assuming that the diatom’s N demand is fully covered by the N2-fixing symbiont [1,6] and that both organisms grow at the same speed (which is required if the symbiosis is in steady-state growth [51,52]), the model predicts that the trichome must fix N2 5.5 times faster than in the hypothetical case without the host. This increase has been observed in analogous systems. For example, an increase in N2 fixation has been reported for the Anthoceros–Nostoc symbioses as compared to free-living trichomes (4- and 35-fold increase relative to Anabaena and Nostoc, respectively [53]). Additionally, we find that the amount of N2 fixation done by the trichome to support its own growth falls in a similar range to that of other non-symbiotic aquatic N2-fixing organisms, including filamentous Trichodesmium [32,33,54], unicellular Crocosphaera [6,34,35,55,56], and a similar heterocyst-forming trichome from freshwater environments, Nostoc [57]. The similarity of N2 fixation rates suggests relatively conserved rates of N2 fixation across free-living diazotrophs. Moreover, the rate of N2 fixation by the DDA is significantly higher than these rates, indicating that the elevated rate of N2 fixation under symbiosis exists to fulfill the N demand of the diatom. Taken together, these results suggest that the rate of N2 fixation adjusts to meet the demand. The computed fate of N shows that 82% of fixed N flows into diatoms for their growth, whereas only 18% go to the new trichome (Figure 3). As the growth rate increases, the demand for fixed N increases, so the rate of N2 fixation must rise in proportion (Figure 2A).

2.2. Carbon Budget

Based on the photosynthetic capacity inferred from the cell volume, we predict that about 90% of photosynthesis by the HemiaulusRichelia symbiosis is done by Hemiaulus (the diatom) (Figure 2B and Figure 3). The largest part of fixed C (82%: 67% for diatom and 15% for the trichome (Richelia)) is used for biosynthesis (including respiration providing energy for biosynthesis), and the remaining 18% is used for supplying energy and electron for N2 fixation (Figure 3). A previous quantitative study on the heterotrophic soil N2 fixer Azotobacter vinelandii showed that the direct energy cost for N2 fixation is relatively small due to the overwhelming cost for managing O2 diffused from the environment [37]. However, since heterocysts most likely do not require such respiratory protection due to the thick glycolipid layer [37], the direct cost for N2 fixation (energy and electron for N2 reduction) is quantitatively significant in the symbiosis. The model predicts that about 10% of the total photosynthesis is achieved by vegetative cells in the symbiosis (Figure 2B and Figure 3). This is higher than that in the AzollaAnabaena symbiosis where Anabaena accounts for only less than 5% of photosynthesis [23,28,30]. However, even if the Richelia trichomes use all the C fixed by themselves for N2 fixation, there is still a deficit in C, and the trichome requires even more C to support its own biosynthesis.
With these factors, the model predicts the imbalances between the supply and demand of C for the trichome and for the diatom (Figure 2B and Figure 3). Due to the high rate of N2 fixation and its relatively high cost together with the cost for the biosynthesis, one-third of the total fixed C is consumed in the trichomes, which is about three times the C supplied by their own photosynthesis (Figure 3). On the other hand, since diatoms do not directly pay the cost for N2 fixation, the C they generate exceeds their own requirements if the C demand and supply are balanced (Figure 3). These imbalances in the C budget between the different organisms indicate that there is a C flux from the diatom to the trichome. The model predicts that about one-fourth of the C fixed by diatoms flows into the trichome, supporting their N2 fixation rates (Figure 3).
The predicted amount of C transfer supports more than just N2 fixation for the diatom’s needs. Even if we ignore the cost of N2 fixation for the diatom, the total modeled C cost for the trichome is still greater than its photosynthesis provides. About 60% more C is consumed than they produce, with the remainder coming from the host diatom (Figure 4A). This is based on that the diatom does not allocate its own space for N2 fixation whereas the trichome allocates a significant space for the heterocyst (approximately 43% in C in the trichome) to N2 fixation at the exclusion of photosynthesis. This additional C supply from the diatom may contribute to the observed faster growth rate of DDAs compared to non-symbiotic diazotrophs (Figure 4B). Given nutrient-replete conditions (except for N, all of which is supplied by N2 fixation), the growth rate of the trichome, μTrichome, would be limited by the C supply rate and the yield (the efficiency of C use). Since the yield is fixed, the μTrichome is proportional to the C supply rate [39]. C supply from the diatom increases the total C supply in the trichome by about 60% (Figure 4A), which increases μTrichome by the same proportion as well. This increase in μTrichome resembles the difference between the measured growth rates of non-symbiotic diazotrophs and DDAs (Figure 4B), indicating that the C transfer could be a major factor enabling the faster growth of DDAs.

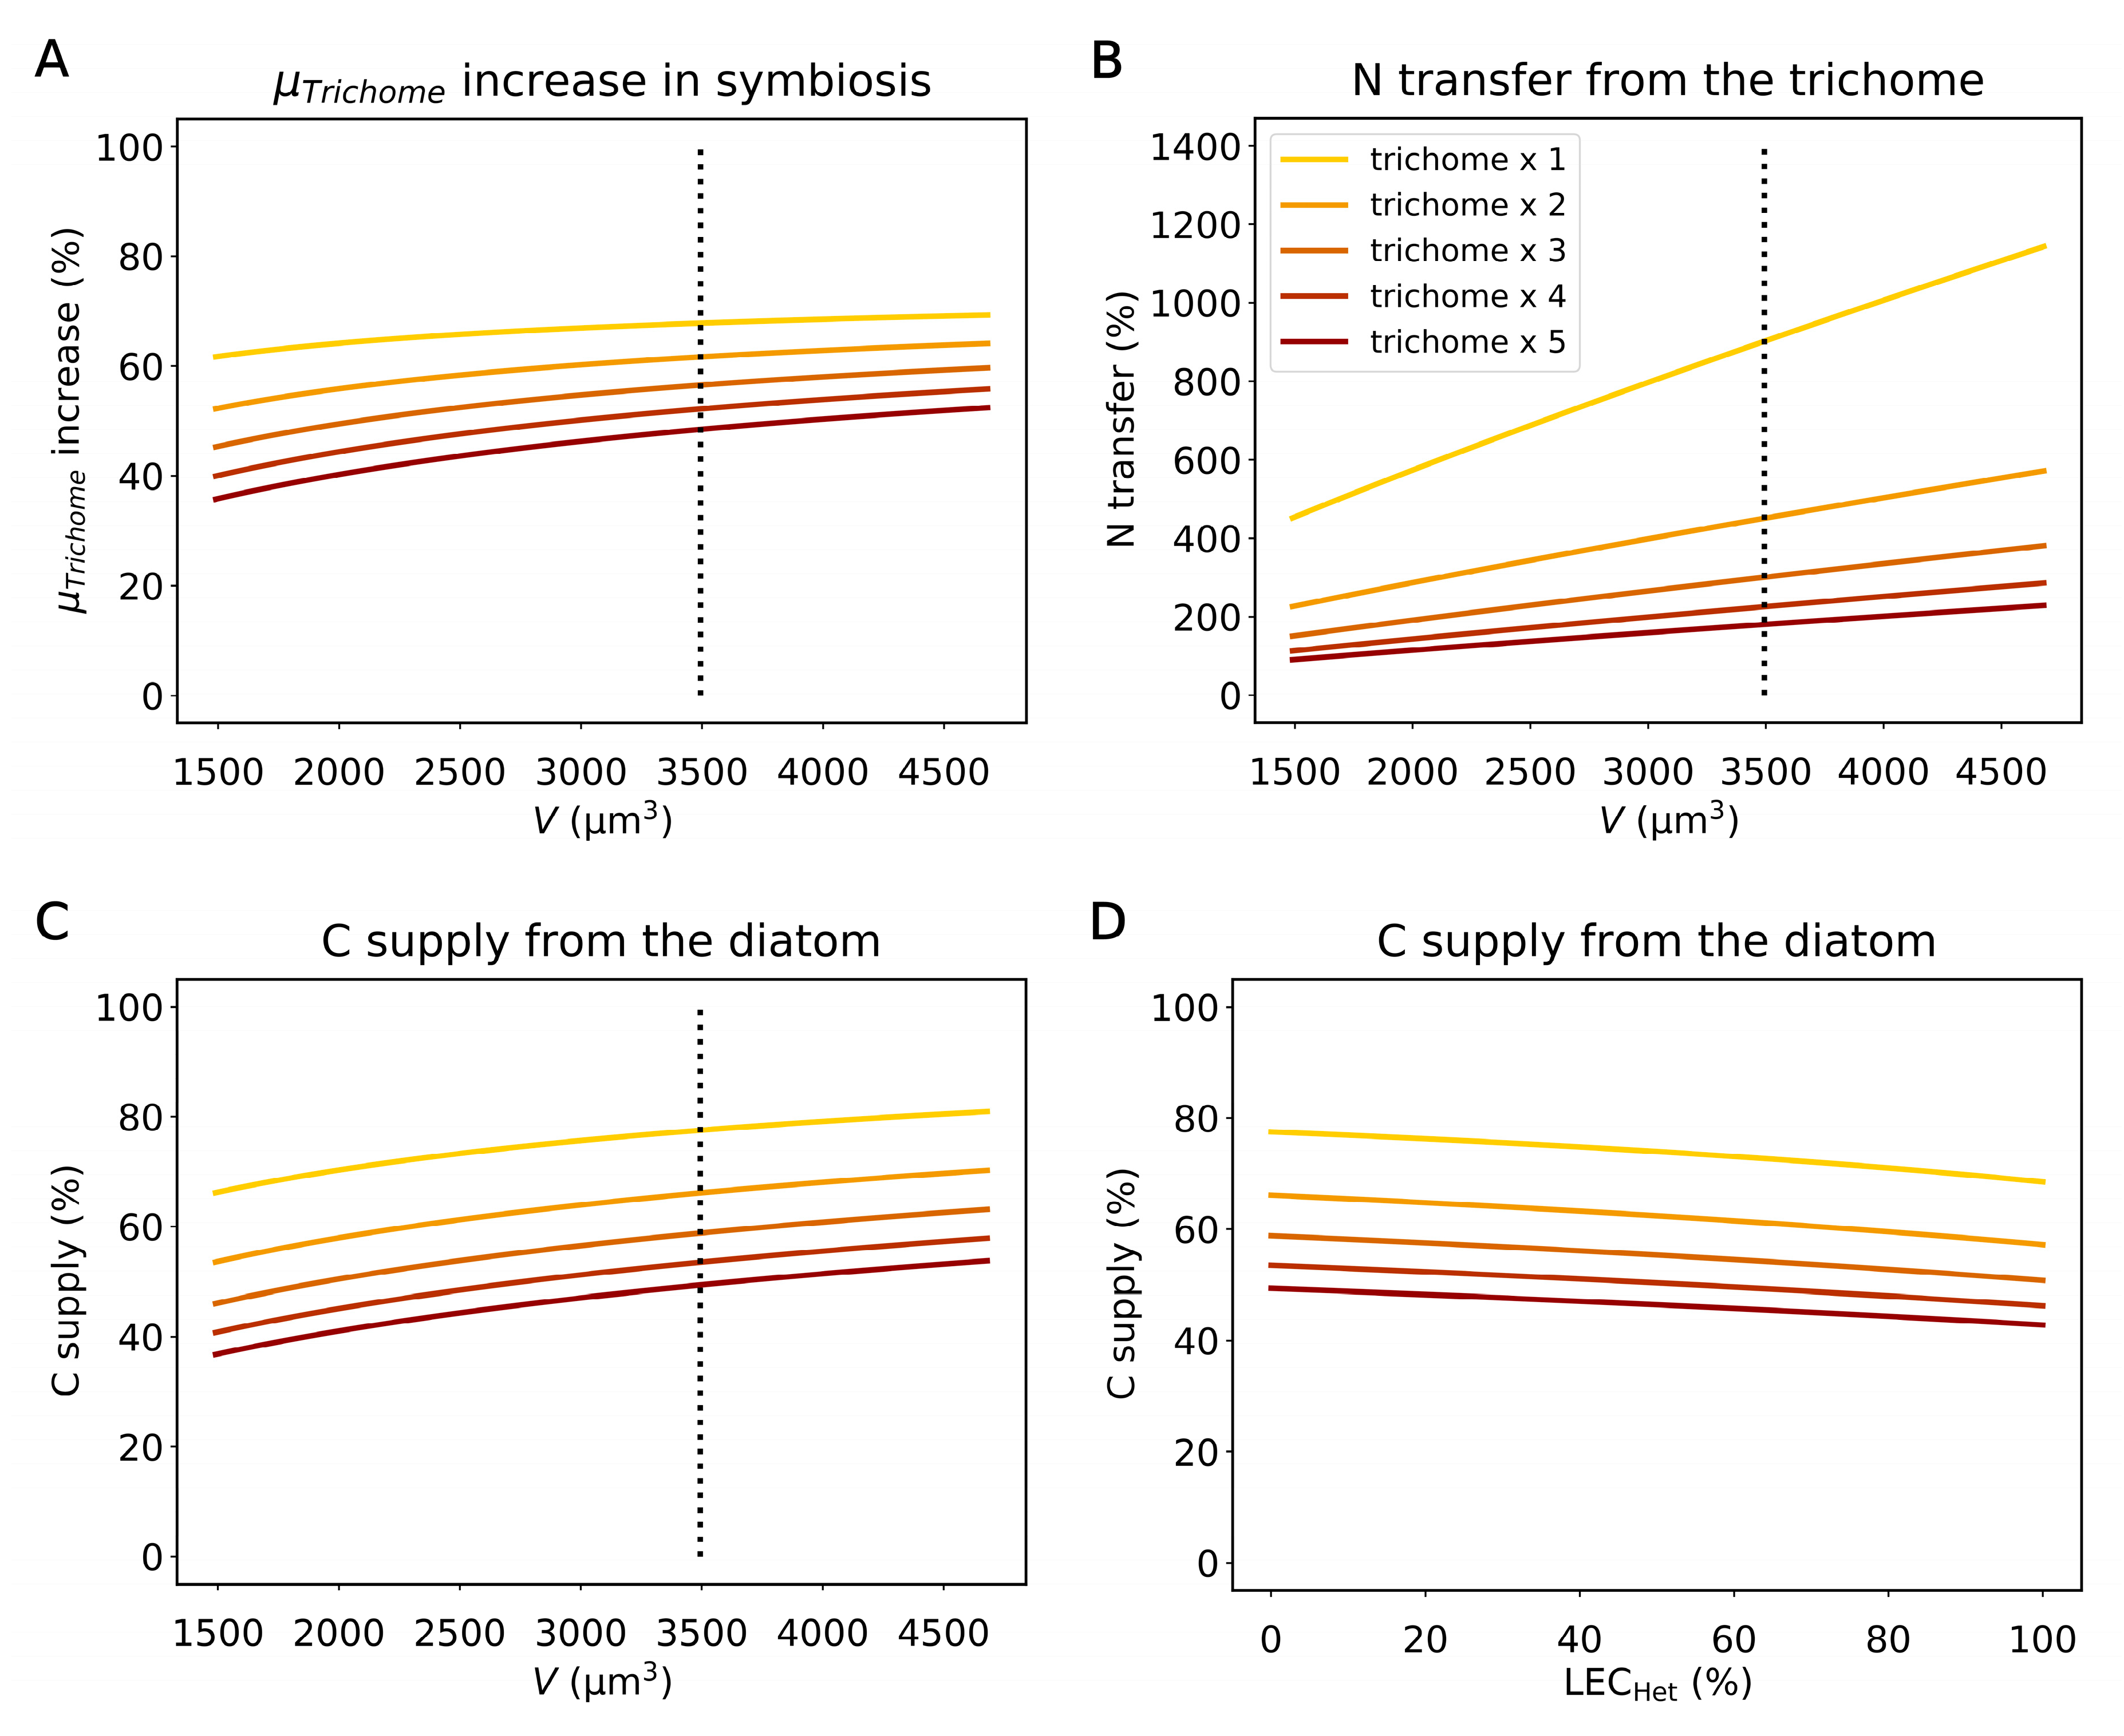
2.3. The Influence of the Diatom Size, Trichome Counts, and Light Harvesting by Heterocysts

In the above simulations, we used the “average” cell sizes and number of the Richelia trichomes per diatom (Hemiaulus) cell to quantify a typical map of material exchange (Figure 3; see Methods). However, in nature, these numbers vary [6]. Here, we simulated various possible cell sizes of diatoms (1490–4680 µm3) [6] and numbers of the trichomes per diatom (1–5) to quantify how they influence N and C transfer (Figure 5A–C). The trichome growth rate is sensitive to these factors, since they change the diatom–trichome volume ratio (Figure 5A). As the diatoms size increases, a relatively higher amount of C is fixed by the diatom, and more C can be used for the growth of the trichome, resulting in increased μTrichome. Similarly, as the number of the trichomes per diatom increases, the photosynthesis of the diatom per trichome decreases, and the μTrichome decreases.
N transfer from the trichome is also sensitive to the volume of the diatom. Increasing the diatom size demands more N2 fixation (Figure 5B), as it leads to increased cellular quotas of N. N transfer from the trichome increases linearly, reflecting the linear relation between the volume and cellular N quota. In the default run with two trichomes per diatom with the averaged size (3493.5 µm3), about 450% of fixed N (relative to the need for the trichomes) flows into the diatom, which increases to 901% when there is only one trichome. It is notable that even with five trichomes, which are hardly observed for Hemiaulus–Richelia symbiosis [6,7,49,50], 180% of fixed N is transferred to the host diatom.
The C supply from the diatom reflects the cost for excess N2 fixation. As the diatom volume increases, the cost for N2 fixation increases (Figure 5B), which in turn raises the C demand and thus the transfer of C from the diatom (Figure 5C). In the default run with the average diatom (Hemiaulus) size and 2 trichomes, 66% of C for the trichomes’ metabolic demand depends on the diatom, which increases to 78% when there is only one trichome (Figure 5C). When there are five trichomes, the cost decreases, but there is still about 50% of C transferred from the host diatom, supporting the idea that the C transfer from the diatom is essential, which may explain why Richelia is an obligate symbiont [7]. We have also tested how many vegetative cells are needed to make the trichome independent from the C supply from the host by using the obtained photosynthesis rate per vegetative cell and varying the number of vegetative cells per heterocyst. The result shows that when there are two trichomes (as in the default run), 104 vegetative cells would be required for supporting the growth of trichomes and N2 fixation for the symbiosis without C transfer from the host (Figure S2). If this was the case, the total volume of the trichomes would be larger than the diatom (Figure S2), supporting that C transfer is necessary.
Heterocysts do not have active Photosystem II (PSII) but possess Photosystem I (PSI) [58,59]. Thus, although they cannot generate reducing equivalents (electrons) by linear photosynthetic electron transport, they can potentially harness light energy and generate ATP for N2 fixation using PSI [58]. We have simulated various light energy contributions to N2 fixation within heterocysts (LECHet) for another sensitivity test (Figure 5D). When all the ATP for N2 fixation is covered by light harvesting in the heterocyst (thus, LECHet = 100%), it reduces the relative C supply from the diatom by less than 10%. The absolute value of reduction is especially significant when there is only one trichome in a diatom, since the per trichome rate of N2 fixation is the highest. However, even when 100% of the energy (ATP) requirement for N2 fixation is covered by the light harvesting in the heterocyst, we still predict a significant C supply from the diatom because of the large C requirement for providing electrons to reduce N2 (one C per N [37,38,39]). The model predicts that this C cost is similar to that for providing ATP for N2 fixation; thus, about half of the N2 fixation cost must be still paid even after all the ATP requirement is waivered.

2.4. Implication of the Model Results for Other DDAs

In this study, we have developed a cell flux model of DDAs (CFM-DDA) based on HemiaulusRichelia symbiosis and predicted C and N exchanges. How does the model results apply to other DDAs such as RhizosoleniaRichelia [2,22,50] and other related symbioses, such as ChaetocerosCalothrix (or Richelia) [7,9]? The framework of CFM-DDA should apply to these other symbioses since the modeled coarse-grained metabolisms are general enough to capture the common metabolism of the diatoms and trichomes and potential nutrient exchanges. In addition, the model prediction of C supply from the host to the trichome resonates with plant–cyanobacterial symbiosis where C transfer from the plant to the cyanobacteria has been observed [23,24,28,29,30]. Richelia is an obligate cyanobiont [7], indicating that it receives essential molecules from the host diatom including Rhizosolenia. Furthermore, our prediction of C transport is qualitatively supported by the observation where the Calothrix trichomes increase the number of the vegetative cells once they are detached from the host [60], which is likely to compensate for a lack of C supply from the diatom.
However, despite the generality of the model framework and these supporting implications, there are fundamental differences between the different DDAs, requiring any extrapolation of these results to be used with caution. For example, Rhizosolenia has a large vacuole [61], where photosynthesis does not occur, potentially leading to overestimation of the photosynthesis. In addition, Richelia in Rhizosolenia have higher numbers of vegetative cells per heterocyst than that in Hemiaulus [2,62,63], indicating higher C supply from the trichome. The number of the trichomes per host cell can be higher for Rhizosolenia as well [2,50,64]. Furthermore, the trichomes are often externally associated with Chaetoceros [2,9,31]; thus, the exchange of molecules may be less efficient. For example, if they are transported through the external environment, a significant loss must be associated.
To address some of the factors, we have extended our sensitivity study with an increased number of vegetative cells (10 per heterocyst), more trichomes per diatom (up to 15 per diatom), and a wider range of cellular volume (1000–7000 µm3: lower cell volume would have equivalent effects as higher vacuole amount) (Figure S3). Although these factors decrease the amount of C transported, we still predict supply–demand imbalance in C, thus transferring the C from the host (>10% of C supply from the host even in extreme scenarios). In addition, if there is a loss of N to the environment, it would increase the C demand, thus resulting in higher C supply from the host diatom. To test our predictions, further experiments would be required as described at the end of the next section.

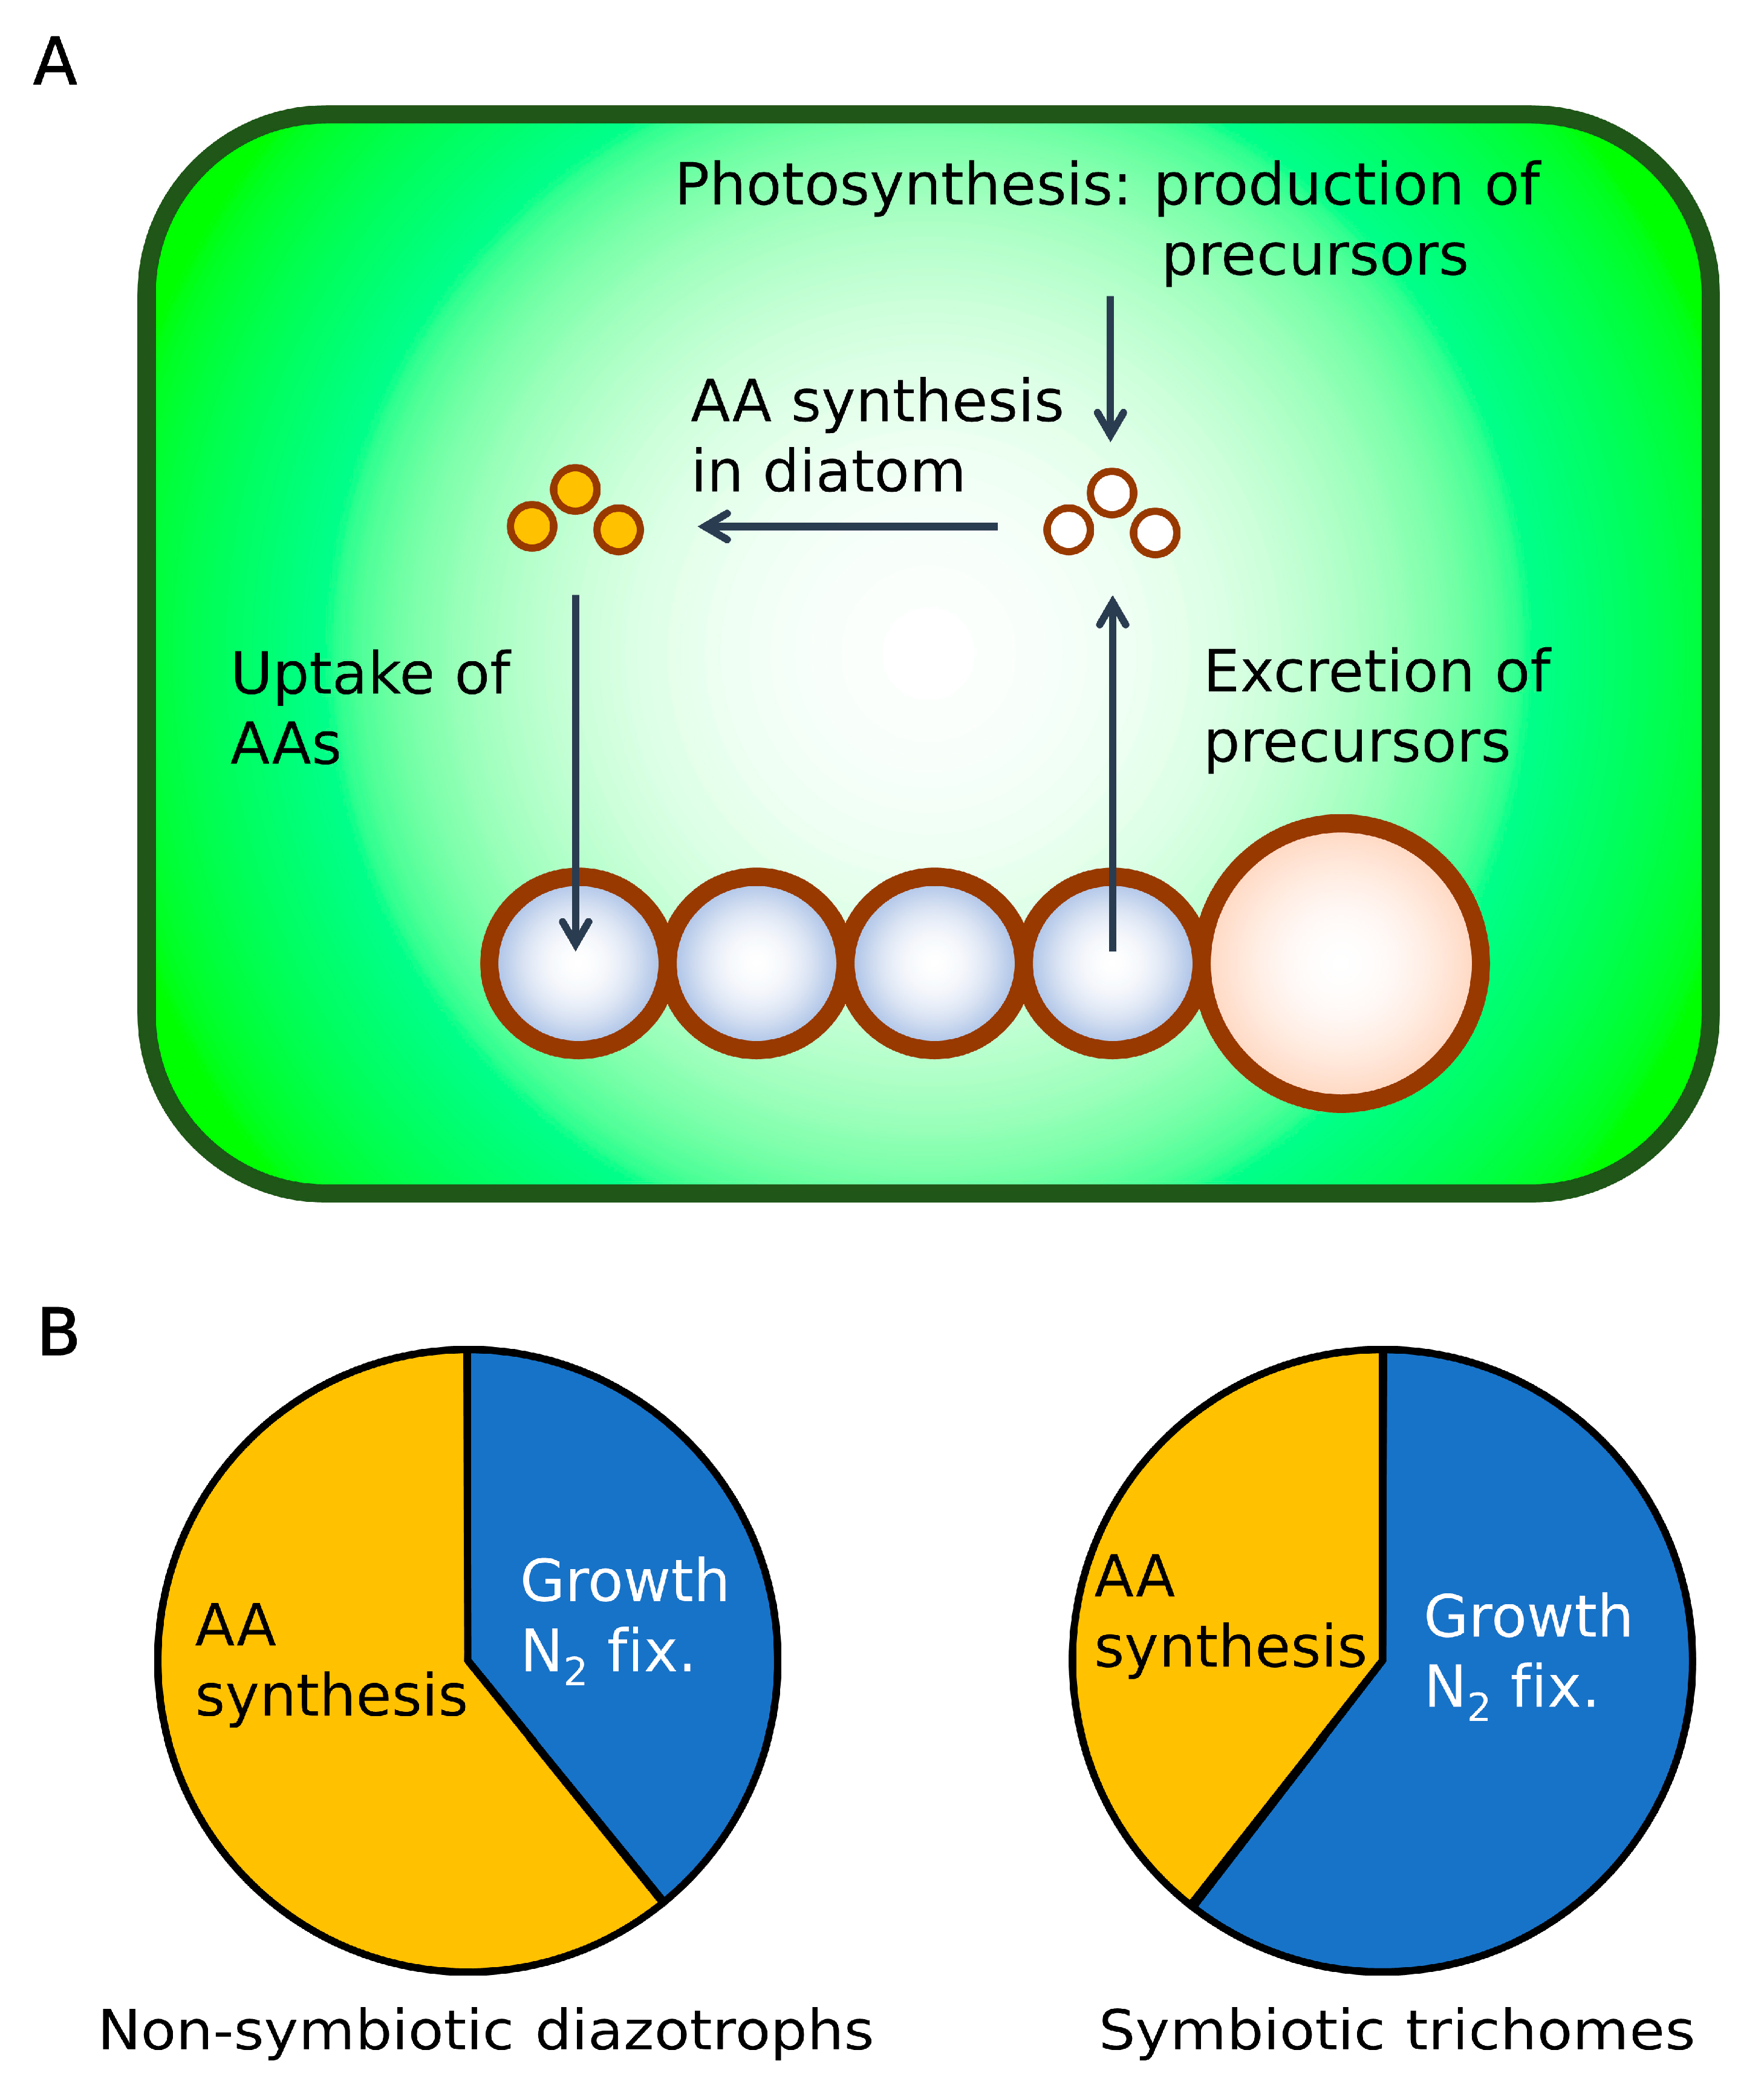
2.5. Hypothesis: Mechanism for High C Processing

High rates of N2 fixation by DDAs have been observed, but the mechanisms for that have not been fully elucidated. With a simple but mechanistic model for DDAs, we predict that a significant C flux from the diatom enhances both the growth and N2 fixation rates within the trichome. This leads to a further question: What mechanisms may allow the cell to process such a high amount of C at a faster rate than non-symbiotic diazotrophs? Here, we consider this question based on the protein allocation within the cell and suggest that parts of the biosynthesis pathway might occur within the diatom rather than the trichome.
Proteins (enzymes) are responsible for most of the biochemical reactions, and increasing the growth rate requires a higher density of growth-related proteins [65,66,67,68]. However, cellular space (resource) is limited, and cells need to allocate the finite amount of proteins for various purposes [65,66,69,70]. A coarse-grained model parameterized using laboratory measurements show that increasing the allocation of proteins related to amino acid synthesis sacrifices growth, because a smaller amount of proteins is allocated to growth-related proteins [66]. The reverse must also be true: If cells allocate a smaller amount of proteins for amino acid synthesis, more proteins can be allocated to the growth-related proteins, which should lead to faster growth.
If this theory is applied to the symbiosis, where molecular exchanges are possible between organisms, it is possible that one organism may effectively increase the growth rate of the other while sacrificing its own. This could be accomplished with altered protein allocation. For example, in DDAs, if most amino acid synthesis is done by diatoms, the diatom’s growth rate would decrease, since a higher amount of proteins must be allocated for amino acid synthesis. However, this would increase the growth of the trichomes, since they can reduce their allocation toward amino acid synthesis in favor of growth-related proteins. In the context of protein allocation, the reduced protein allocation for amino acid synthesis can also lead to a higher allocation of the N2-fixing enzyme: nitrogenase.
Thus, we hypothesize that diatoms “help” synthesize amino acids for the trichomes, leading to a reduced allocation of proteins for amino acid synthesis but an increased allocation toward growth-related proteins and nitrogenase in the trichomes. This leads to higher growth rates and faster C processing within the trichomes (Figure 6). This hypothesis is supported by various observations. First, the growth rate of diatoms in DDAs is lower than that of their free-living counterparts [31], indicating that they experience additional metabolic costs within the symbiosis. In addition, the Richelia trichome maintains amino acid transporters, despite the loss of various other transporters, enabling the uptake of amino acids from the diatom [7]. Additionally, the trichomes do not grow [7] or grow only at a slower pace once they are detached from the host [6], suggesting a reliance on diatoms for some molecules, possibly specific amino acids. Furthermore, Richelia in Hemiaulus and Calothrix in Chaetoceros have a high ratio of heterocysts (1 out of approximately 5 cells [2,6,7,49,50,71]), whereas free-living Anabaena in average have approximately 10 vegetative cells between heterocysts under diazotrophic conditions [72,73,74,75,76,77,78], supporting the increased nitrogenase content in the trichomes in these specific DDAs.
Our hypothesis can be tested with the combination of different levels of omics, imaging techniques, and kinetic analysis on field-sampled DDAs and cultures of the symbionts. Genomics and transcriptomics obtained with and without a host would allow us to target the “product”, which is transported from diatoms and should be confirmed by proteomics and metabolomics. A combination of genomics, proteomics, and metabolomics will give information on the metabolic capacity, activity, and metabolic relationships between the diatom and the trichome. Following up on the previous NanoSIMS study of 15N fixation and transfer in DDAs [6], time course analyses and pulse chase experiments with 13C using NanoSIMS and Raman microscopy would allow us to compare C fixation rates between trichomes and diatoms, confirm the transport of biomolecules from diatoms to trichomes, and identify transferred biomolecules [79,80,81,82]. Analyses of C isotope fractionation in the diatom and trichome biomass should indicate in which of the cells the C was assimilated [83,84]. These results should be confirmed by rate measurements of growth, DNA synthesis, and protein synthesis.

3. Conclusions

DDAs are major N2 fixers in the ocean whose rate of N2 fixation is quantitatively significant [6], but the connection between their metabolic rates and symbiotic association are unknown. With a simple mechanistic model of cellular metabolisms of HemiaulusRichelia symbiosis, we predict that the observed high rates of N2 fixation and growth of the trichomes [6,31] are supported by the C transfer from the host diatom, which is qualitatively consistent with the observations of plant–cyanobacteria symbiosis [23,24,28,29,30]. Our model also explicitly accounts for the C cost for N2 fixation, which is a central factor in the competitive fitness of diazotrophs relative to other plankton. The growth rate handicap by DDAs is commonly expressed as a constant factor in ecological and biogeochemical models [17,18,19], whereas our model shows that it is dependent on the molecular exchanges. Similarly, the model enables various cell sizes and number of the trichome per diatom, as well as the ratio of vegetative cells to the heterocysts, allowing the material exchanges and their metabolic advantages to be computed from mechanistic considerations. Such model flexibility allows the expression of diverse DDAs and can be used to study how such diversity helps DDAs to acquire their roles as significant sources of bioavailable N.

4. Methods

The CFM-DDA (Figure 1) is based on the following core equation, a steady-state solution for the time dependences of each C and N pool (see Supplementary Methods and Figure S1 for the derivation):
F P h o D + F P h o V = μ ( Q C V + Q C H + Q C D ) ( 1 + E ) + μ ( Q N V + Q N H + Q N D ) Y C : N N 2 f i x
where F P h o D and F P h o V (pmol C d−1 cell−1) are the daily rate of per-DDA photosynthesis by diatoms (Dia) and vegetative cells (Veg), respectively, μ is the growth rate (d−1), Q C V , Q C H , and Q C D are the cellular C quotas of Veg, Het (heterocysts), and Dia per DDA, Q N V , Q N H , and Q N D are their respective N quotas per DDA, E is the ratio of respiration to biosynthesis, and Y C : N N 2 f i x is a conversion term from N2 fixation to its C cost (mol C mol N−1).
This equation represents the balance between the C supply (left-hand side) and C consumption (right-hand side). The terms on the left are the photosynthesis from each organism providing C to the system. The first term on the right-hand side represents the consumption of C based on biosynthesis (making new cells) and respiration for supporting it. The second term represents the C cost based on N2 fixation.
We scale the rates and quotas based on the cell volume (V) (µm3). To convert V to C quotas, we have used a power relationship based on the compilation of various phytoplankton species [47]. This study suggests different relationships for non-diatom phytoplankton and diatoms: (pg C cell−1) = 0.216 × V0.939 and (pg C cell−1) = 0.288 × V0.811, respectively. Thus, we used the former equation for Q C V and Q C H and the latter for Q C D . We convert these C quotas to N quotas ( Q N V , Q N H , and Q N D ) based on the Redfield ratio of 6.6 C:1 N, following previous studies [6,48]. E is obtained based on the energy balance between biosynthesis and respiration with an energy transfer efficiency of 0.6 [85]. Y C : N N 2 f i x is based on the sum of the C costs for providing electron and energy to N2 fixation [37,38] with the same energy transfer efficiency as that for biosynthesis (0.6) [85] (see details in Supplementary Methods). As we have now defined all the values for the left-hand side, we can obtain ( F P h o D + F P h o V ) as a solution of Equation (1). To partition F P h o D and F P h o V , we assume that the rates of photosynthesis are proportional to the cellular N quotas, since the size of the N quota indicates the enzyme availability for photosynthesis. We have used the averaged cell volume for each cell from observations of Hemiaulus and Richelia [6] ignoring two extraordinary large symbioses and a ratio of diatom:trichome of 1:2 to represent commonly observed relations between Hemiaulus and Richelia based on microscopic images [6,7,49,50] except for Figure 5, where the cell volume and number of the trichomes are varied: 1490–4680 (µm3) (a range from the observation [6] after ignoring the two large outliers) and 1–5 (between minimum and significantly higher value than generally observed), respectively. We used a ratio of Veg:Het of 4:1 to represent typically observed Richelia trichomes in Hemiaulus based on microscopic images [6,7,49,50].

Supplementary Materials

The following are available online at https://www.mdpi.com/2223-7747/9/2/192/s1. Supplementary Methods. Figure S1: Schematic of CFM-DDA with flux notations. Figure S2: The impact of the number of vegetative cells per heterocyst on the C supply and demand and space occupation by the trichomes in a diatom cell. Figure S3: Sensitivity test for C supply from the diatom relative to the total C requirement of the trichome.

Author Contributions

Conceptualization, K.I. and C.L.F.; methodology, K.I., C.L.F., T.M., M.E. and O.P.; software, K.I.; validation, K.I. and M.E.; formal analysis, K.I.; investigation, K.I.; resources, K.I., C.L.F., T.M. and M.E.; data curation, K.I., T.M. and M.E.; writing—original draft preparation, K.I., T.M., M.E. and O.P.; writing—review and editing, K.I., C.L.F., T.M., M.E., O.P. and C.D.; visualization, K.I. and C.D.; supervision, O.P. and C.D.; project administration, K.I. and T.M.; funding acquisition, K.I., O.P. and C.D. All authors have read and agreed to the published version of the manuscript.

Funding

This research was funded by the Simons Foundation (Simons Postdoctoral Fellowship in Marine Microbial Ecology, Award 544338 to K.I.; Simons CBIOMES Postdoctoral Fellowship, Award 553242 to C.L.F.), GAČR (project 16-15467S to O.P.), the Czech Ministry of Education, Youth and Sports (projects LO1416 to O.P.) and the Gordon and Betty Moore Foundation (GBMF grant 3775 to C.D.).

Model Availability

CFM-DDA is freely available from Zenodo at https://doi.org/10.5281/zenodo.3561255 (DOI: 10.5281/zenodo.3561255).

Acknowledgments

We thank Rogier Braakman, Stephanie Dutkiewicz, Takuhei Shiozaki, Jonathan P. Zehr and Michael J. Follows for useful discussion. We are grateful for the support from the above-listed funding.

Conflicts of Interest

The authors declare no conflict of interest.

References

  1. Villareal, T.A. Laboratory culture and Preliminary Characterization of the nitrogen-fixing Rhizosolenia-Richelia Symbiosis. Mar. Ecol. 1990, 11, 117–132. [Google Scholar] [CrossRef]
  2. Villareal, T.A. Marine nitrogen fixing diatom - cyanobacteria symbioses. In Marine Pelagic Cyanobacteria: Trichodesmium and Other Diazotrophs; Carpenter, E.J., Capone, D.G., Rueter, J.G., Eds.; Kluwer Academic Publishers: Dordrecht, The Neatherlands, 1992; pp. 163–175. [Google Scholar]
  3. Janson, S.; Wouters, J.; Bergman, B.; Carpenter, E.J. Host specificity in the Richelia-diatom symbiosis revealed by hetR gene sequence analysis. Environ. Microbiol. 1999, 1, 431–438. [Google Scholar] [CrossRef]
  4. Foster, R.A.; Zehr, J.P. Characterization of diatom-cyanobacteria symbioses on the basis of nifH, hetR and 16S rRNA sequences. Environ. Microbiol. 2006, 8, 1913–1925. [Google Scholar] [CrossRef]
  5. Goebel, N.L.; Turk, K.A.; Achilles, K.M.; Paerl, R.; Hewson, I.; Morrison, A.E.; Montoya, J.P.; Edwards, C.A.; Zehr, J.P. Abundance and distribution of major groups of diazotrophic cyanobacteria and their potential contribution to N2 fixation in the tropical Atlantic Ocean. Environ. Microbiol. 2010, 12, 3272–3289. [Google Scholar] [CrossRef]
  6. Foster, R.A.; Kuypers, M.M.M.; Vagner, T.; Paerl, R.W.; Musat, N.; Zehr, J.P. Nitrogen fixation and transfer in open ocean diatom– cyanobacterial symbioses. ISME J. 2011, 5, 1484–1493. [Google Scholar] [CrossRef] [PubMed] [Green Version]
  7. Hilton, J.A.; Foster, R.A.; James Tripp, H.; Carter, B.J.; Zehr, J.P.; Villareal, T.A. Genomic deletions disrupt nitrogen metabolism pathways of a cyanobacterial diatom symbiont. Nat. Commun. 2013, 4, 1767. [Google Scholar] [CrossRef] [PubMed] [Green Version]
  8. Carpenter, E.J.; Montoya, J.P.; Burns, J.; Mulholland, M.R.; Subramaniam, A.; Capone, D.G. Extensive bloom of a N2-fixing diatom/cyanobacterial association in the tropical Atlantic Ocean. Mar. Ecol. Prog. Ser. 1999, 185, 273–283. [Google Scholar] [CrossRef] [Green Version]
  9. Gómez, F.; Furuya, K.; Takeda, S. Distribution of the cyanobacterium Richelia intracellularis as an epiphyte of the diatom Chaetoceros compressus in the western Pacific Ocean. J. Plankton Res. 2005, 27, 323–330. [Google Scholar] [CrossRef] [Green Version]
  10. Church, M.J.; Mahaffey, C.; Letelier, R.M.; Lukas, R.; Zehr, J.P.; Karl, D.M. Physical forcing of nitrogen fixation and diazotroph community structure in the North Pacific subtropical gyre. Global Biogeochem. Cycles 2009, 23, GB2020. [Google Scholar] [CrossRef]
  11. Foster, R.A.; Subramaniam, A.; Zehr, J.P. Distribution and activity of diazotrophs in the Eastern. Environ. Microbiol. 2009, 11, 741–750. [Google Scholar] [CrossRef] [Green Version]
  12. Sohm, J.A.; Webb, E.A.; Capone, D.G. Emerging patterns of marine nitrogen fixation. Nature 2011, 9, 499–508. [Google Scholar] [CrossRef] [PubMed]
  13. Villareal, T.A. Widespread occurrence of the Hemiaulus-cyanobacterial symbiosis in the Sourthwest North Atlantic Ocean. Bull. Mar. Sci. 1994, 54, 1–7. [Google Scholar]
  14. Subramaniam, A.; Yager, P.L.; Carpenter, E.J.; Mahaffey, C.; Björkman, K.; Kustka, A.B.; Montoya, J.P.; Sañudo-Wilhelmy, S.A.; Shipe, R.; Capone, D.G. Amazon river enhances diazotrophy and carbon sequestration in the tropical North Atlantic Ocean. Proc. Natl. Acad. Sci. USA 2008, 105, 10460–10465. [Google Scholar] [CrossRef] [PubMed] [Green Version]
  15. Villareal, T.A.; Brown, C.G.; Brzezinski, M.A.; Krause, J.W.; Wilson, C. Summer diatom blooms in the north Pacific subtropical gyre: 2008-2009. PLoS ONE 2012, 7, 2008–2009. [Google Scholar] [CrossRef] [PubMed]
  16. Shiozaki, T.; Kondo, Y.; Yuasa, D.; Takeda, S. Distribution of major diazotrophs in the surface water of the Kuroshio from northeastern Taiwan to south of mainland Japan. J. Plankton Res. 2018, 40, 407–419. [Google Scholar] [CrossRef]
  17. Monteiro, F.M.; Dutkiewicz, S.; Follows, M.J. Biogeographical controls on the marine nitrogen fixers. Global Biogeochem. Cycles 2011, 25, GB2003. [Google Scholar] [CrossRef] [Green Version]
  18. Monteiro, F.M.; Follows, M.J.; Dutkiewicz, S. Distribution of diverse nitrogen fixers in the global ocean. Global Biogeochem. Cycles 2010, 24, GB3017. [Google Scholar] [CrossRef] [Green Version]
  19. Stukel, M.R.; Coles, V.J.; Brooks, M.T.; Hood, R.R. Top-down, bottom-up and physical controls on diatom-diazotroph assemblage growth in the Amazon River plume. Biogeosciences 2014, 11, 3259–3278. [Google Scholar] [CrossRef] [Green Version]
  20. Staal, M.; Meysman, F.J.R.; Stal, L.J. Temperature excludes N2-fixing heterocystous cyanobacteria in the tropical oceans. Nature 2003, 425, 504–507. [Google Scholar] [CrossRef]
  21. Caputo, A.; Stenegren, M.; Pernice, M.C.; Foster, R.A. A short comparison of two marine planktonic diazotrophic symbioses highlights an un-quantified disparity. Front. Mar. Sci. 2018, 5, 1–8. [Google Scholar] [CrossRef] [Green Version]
  22. Janson, S.; Rai, A.; B, B. Intracellular cyanobiont Richelia intracellularis: Ultrastructure and immunolocalization of phycoerythrin, nitrogenase, Rubisco and glutamine synthetase. Mar. Biol. 1995, 124, 1–8. [Google Scholar]
  23. Rai, A.N.; Söderbäck, E.; Bergman, B. Cyanobacterium-plant symbiosis. New Phytol. 2000, 147, 449–481. [Google Scholar] [CrossRef]
  24. Peters, G.A.; Meeks, J.C. The Azolla-Anabaena symbiosis: Basic biology. Annu. Rev. Plant. Physiol. Mol. Biol. 1989, 40, 193–210. [Google Scholar] [CrossRef]
  25. Rai, A.N.; Borthkur, M.; Singh, S.; Bergman, B. Anthoceros-Nostoc symbiosis: Immunoelectronmicroscopic localization of nitrogenase, glutamine synthetase, phycoerythrin and ribulose-1,5-bisphosphate carboxylase/oxygenase in the cyanobiont and the cultured (free-living) isolate Nostoc 7801. Microbiology 1989, 135, 385–395. [Google Scholar] [CrossRef] [Green Version]
  26. Rai, A.N. Handbook of Symbiotic Cyanobacteria; CRC Press: Boca Raton, FL, USA, 1990. [Google Scholar]
  27. Bergman, B.; Rai, A.N.; Johansson, C.; Söderbäck, E. Cyanobacterial-plant symbioses. Symbiosis 1992, 14, 61–81. [Google Scholar]
  28. Adams, D.G.; Bergman, B.; Nierzwicki-Bauer, S.A.; Rai, A.N.; Schüßler, A. Cyanobacterial-pldant symbioses. In Signalling and Communication in Plant Symbiosis; Dowrkin, S., Falkow, S., Rosenberg, E., Schleifer, K.H., Stackebrandt, E., Eds.; Springer: Berlin, Germany, 2006; Volume 1, pp. 331–363. [Google Scholar]
  29. Peters, G.A.; Kaplan, D.; Meeks, J.C.; Buzby, K.M.; Marsh, B.H.; Corbin, J.L. Aspects of nitrogen and carbon interchange in the Azolla-Anabaena symbiosis. In Nitrogen Fixation and CO2 Metabolism; Ludden, P.W., Burries, J.E., Eds.; Elsevier Science: New York, NY, USA, 1985; pp. 213–222. [Google Scholar]
  30. Kaplan, D.; Peters, G.A. Interaction of carbon metabolism in the Azolla-Anabaena symbiosis. Symbiosis 1988, 6, 53–68. [Google Scholar]
  31. Follett, C.L.; Dutkiewicz, S.; Karl, D.M.; Inomura, K.; Follows, M.J. Seasonal resource conditions favor a summertime increase in North Pacific diatom–diazotroph associations. ISME J. 2018, 12, 1543–1557. [Google Scholar] [CrossRef] [Green Version]
  32. Mulholland, M.R.; Bernhardt, P.W. The effect of growth rate, phosphorus concentration, and temperature on N2 fixation, carbon fixation, and nitrogen release in continuous cultures of Trichodesmium IMS101. Limnol. Oceanogr. 2005, 50, 839–849. [Google Scholar] [CrossRef]
  33. Hutchins, D.A.; Fu, F.-X.; Zhang, Y.; Warner, M.E.; Feng, Y.; Portune, K.; Bernhardt, P.W.; Mulholland, M.R. CO2 control of Trichodesmium N2 fixation, photosynthesis, growth rates, and elemental ratios: Implications for past, present, and future ocean biogeochemistry. Limnol. Oceanogr. 2007, 52, 1293–1304. [Google Scholar] [CrossRef] [Green Version]
  34. Fu, F.-X.; Mulholland, M.R.; Garcia, N.S.; Beck, A.; Bernhardt, P.W.; Warner, M.E.; Sañudo-Wilhelmy, S.A.; Hutchins, D.A. Interactions between changing pCO2, N2 fixation, and Fe limitation in the marine unicellular cyanobacterium Crocosphaera. Limnol. Oceanogr. 2008, 53, 2472–2484. [Google Scholar] [CrossRef] [Green Version]
  35. Großkopf, T.; LaRoche, J. Direct and indirect costs of dinitrogen fixation in Crocosphaera watsonii WH8501 and possible implications for the nitrogen cycle. Front. Microbiol. 2012, 3, 236. [Google Scholar] [CrossRef] [PubMed] [Green Version]
  36. Sohm, J.A.; Edwards, B.R.; Wilson, B.G.; Webb, E.A. Constitutive extracellular polysaccharide (EPS) production by specific isolates of Crocosphaera watsonii. Front. Microbiol. 2011, 2, 229. [Google Scholar] [CrossRef] [PubMed] [Green Version]
  37. Inomura, K.; Bragg, J.; Follows, M.J. A quantitative analysis of the direct and indirect costs of nitrogen fixation: A model based on Azotobacter vinelandii. ISME J. 2017, 11, 166–175. [Google Scholar] [CrossRef] [PubMed]
  38. Inomura, K.; Bragg, J.; Riemann, L.; Follows, M.J. A quantitative model of nitrogen fixation in the presence of ammonium. PLoS ONE 2018, 13, e0208282. [Google Scholar] [CrossRef] [PubMed]
  39. Inomura, K.; Wilson, S.T.; Deutsch, C. Mechanistic model for the coexistence of nitrogen fixation and photosynthesis in marine Trichodesmium. mSystems 2019, 4, e00210-19. [Google Scholar] [CrossRef] [PubMed] [Green Version]
  40. Inomura, K.; Deutsch, C.; Wilson, S.T.; Masuda, T.; Lawrenz, E.; Bučinská, L.; Sobotka, R.; Gauglitz, J.M.; Saito, M.A.; Prášil, O.; et al. Quantifying oxygen management and temperature and light dependencies of nitrogen fixation by Crocosphaera watsonii. mSphere 2019, 4, e00531-19. [Google Scholar] [CrossRef] [PubMed] [Green Version]
  41. Inomura, K.; Masuda, T.; Gauglitz, J.M. Active nitrogen fixation by Crocosphaera expands their niche despite the presence of ammonium – A case study. Sci. Rep. 2019, 9, 15064. [Google Scholar] [CrossRef] [Green Version]
  42. Gallon, J.R. The oxygen sensitivity of nitrogenase: A problem for biochemists and micro-organisms. Trends Biochem. Sci. 1981, 6, 19–23. [Google Scholar] [CrossRef]
  43. Wang, Z.C.; Burns, A.; Watt, G.D. Complex formation and O2 sensitivity of Azotobacter vinelandii nitrogenase and its component proteins. Biochemistry 1985, 24, 214–221. [Google Scholar] [CrossRef]
  44. Gallon, J.R. Reconciling the incompatible: N2 fixation and O2. New Phytol. 1992, 122, 571–609. [Google Scholar] [CrossRef]
  45. Lang, N.J.; Fay, P. The heterocysts of blue-green algae II. Details of ultrastructure. Proc. R. Soc. B Biol. Sci. 1971, 178, 193–203. [Google Scholar]
  46. Walsby, A.E. The permeability of heterocysts to the gases nitrogen and oxygen. Proc. R. Soc. B Biol. Sci. 1985, 226, 345–366. [Google Scholar]
  47. Menden-deuer, S.; Lessard, E.J. Carbon to volume relationships for dinoflagellates, diatoms, and other protist plankton. Limnol. Oceanogr. 2000, 45, 569–579. [Google Scholar] [CrossRef] [Green Version]
  48. Redfield, A.C. The biological control of chemical factors in the environment. Am. Sci. 1958, 46, 205–221. [Google Scholar]
  49. Foster, R.A.; O’Mullan, G.D. Nitrogen-fixing and nitrifying symbioses in the marine environment. In Nitrogen in the Marine Environment; Capone, D.G., Bronk, D.A., Mulholland, M.R., Carpenter, E.J., Eds.; Academic Press: London, UK, 2008. [Google Scholar]
  50. Villareal, T.A. Nitrogen-fixation by the cyanobacterial symbiont of the diatom genus Hemiaulus. Mar. Ecol. Prog. Ser. 1991, 76, 201–204. [Google Scholar] [CrossRef]
  51. Harke, M.J.; Frischkorn, K.R.; Haley, S.T.; Aylward, F.O.; Zehr, J.P.; Dyhrman, S.T. Periodic and coordinated gene expression between a diazotroph and its diatom host. ISME J. 2019, 13, 118–131. [Google Scholar] [CrossRef]
  52. Foster, R.A.; Zehr, J.P. Diversity, genomics, and distribution of phytoplankton-cyanobacterium single-cell symbiotic associations. Annu. Rev. Microbiol. 2019, 73, 435–456. [Google Scholar] [CrossRef]
  53. Steinberg, N.A.; Meeks, J.C. Physiological sources of reductant for nitrogen fixation activity in Nostoc sp. strain UCD 7801 in symbiotic association with Anthoceros punctatus. J. Bacteriol. 1991, 173, 7324–7329. [Google Scholar] [CrossRef] [Green Version]
  54. Holl, C.M.; Montoya, J.P. Diazotrophic growth of the marine cyanobacterium Trichodesmium IMS101 in continuous culture: Effects of growth rate on N2-fixation rate, biomass, and C:N:P stoichiometry. J. Phycol. 2008, 44, 929–937. [Google Scholar] [CrossRef]
  55. Tuit, C.; Waterbury, J.; Ravizza, G. Diel variation of molybdenum and iron in marine diazotrophic cyanobacteria. Limnol. Oceanogr. 2004, 49, 978–990. [Google Scholar] [CrossRef]
  56. Masuda, T.; Furuya, K.; Kodama, T.; Takeda, S.; Harrison, P.J. Ammonium uptake and dinitrogen fixation by the unicellular nanocyanobacterium Crocosphaera watsonii in nitrogen-limited continuous cultures. Limnol. Oceanogr. 2013, 58, 2029–2036. [Google Scholar] [CrossRef]
  57. Lichtl, R.R.; Bazin, M.J.; Hall, D.O. The biotechnology of hydrogen production by Nostoc flagelliforme grown under chemostat conditions. Appl. Microbiol. Biotechnol. 1997, 47, 701–707. [Google Scholar] [CrossRef]
  58. Fay, P. Oxygen relations of nitrogen fixation in cyanobacteria. Microbiol. Rev. 1992, 56, 340–373. [Google Scholar] [CrossRef] [PubMed] [Green Version]
  59. Donze, M.; Haveman, J.; Schiereck, P. Absence of Photosystem 2 in heterocysts of the blue-green alga Anabaena. BBA Bioenerg. 1972, 256, 157–161. [Google Scholar] [CrossRef]
  60. Foster, R.A.; Goebel, N.L.; Zehr, J.P. Isolation of Calothrix rhizosoleniae (Cyanobacteria) strain SC01 from Chaetoceros (Bacillariophyta) spp. diatoms of the subtropical North Pacific Ocean. J. Phycol. 2010, 46, 1028–1037. [Google Scholar] [CrossRef]
  61. Letscher, R.T.; Villareal, T.A. Evaluation of the seasonal formation of subsurface negative preformed nitrate anomalies in the subtropical North Pacific and North Atlantic. Biogeosciences 2018, 15, 6461–6480. [Google Scholar] [CrossRef] [Green Version]
  62. Ostenfeld, C.H.; Schmidt, J. Plankton fra det Røde hav og Adenbugten, Vidensk. Meddel. Naturh. Forening i Kbhvn. In Marine Pelagic Cyanobacteria: Trichodesmium and other Diazotrophs; Carpenter, E.J., Capone, D.G., Eds.; Springer Science & Business Media: Berlin, German, 1901; pp. 141–182. [Google Scholar]
  63. Taylor, F.J.R. Symbioses in marine microplankton. Ann. Inst. Océanogr. 1982, 58, 61–90. [Google Scholar]
  64. Sundström, B.G. Observations on Rhizosolenia clevei Ostenfeld (Bacillariophyceae) and Richelia intracellularis Schmidt (Cyanophyceae). Bot. Mar. 1984, 27, 345–355. [Google Scholar] [CrossRef]
  65. Scott, M.; Gunderson, C.W.; Mateescu, E.M.; Zhang, Z.; Hwa, T. Interdependence of cell growth and gene expression: Origins and consequences. Science 2010, 330, 1099–1103. [Google Scholar] [CrossRef]
  66. You, C.; Okano, H.; Hui, S.; Zhang, Z.; Kim, M.; Gunderson, C.W.; Wang, Y.-P.; Lenz, P.; Yan, D.; Hwa, T. Coordination of bacterial proteome with metabolism by cyclic AMP signalling. Nature 2013, 500, 301–306. [Google Scholar] [CrossRef] [Green Version]
  67. Jahn, M.; Vialas, V.; Karlsen, J.; Maddalo, G.; Edfors, F.; Forsström, B.; Uhlén, M.; Käll, L.; Hudson, E.P. Growth of cyanobacteria is constrained by the abundance of light and carbon assimilation proteins. Cell Rep. 2018, 25, 478–486. [Google Scholar] [CrossRef] [PubMed] [Green Version]
  68. Zavřel, T.; Faizi, M.; Loureiro, C.; Poschmann, G.; Stühler, K.; Sinetova, M.; Zorina, A.; Steuer, R.; Červený, J. Quantitative insights into the cyanobacterial cell economy. Elife 2019, 8. [Google Scholar] [CrossRef] [PubMed]
  69. Ellis, R.J. Macromolecular crowding: Obvious but underappreciated. Trends Biochem. Sci. 2001, 26, 597–604. [Google Scholar] [CrossRef]
  70. Burnap, R.L. Systems and photosystems: Cellular limits of autotrophic productivity in cyanobacteria. Front. Bioeng. Biotechnol. 2015, 3, 1. [Google Scholar] [CrossRef]
  71. Lemmermann, E. Die Algenflora der Sandwich-Inseln. Ergebnisse einer Reise nach dem Pacific, H. Schauinsland 1896/97. Engler’s Bot. Jb. 1905, 34, 607–663. [Google Scholar]
  72. Yoon, H.S.; Golden, J.W. Heterocyst pattern formation controlled by a diffusible peptide. Science 1998, 282, 935–938. [Google Scholar] [CrossRef]
  73. Khudyakov, I.Y.; Golden, J.W. Different functions of HetR, a master regulator of heterocyst differentiation in Anabaena sp. PCC 7120, can be separated by mutation. Proc. Natl. Acad. Sci. USA 2004, 101, 16040–16045. [Google Scholar] [CrossRef] [Green Version]
  74. Yoon, H.S.; Golden, J.W. PatS and products of nitrogen fixation control heterocyst pattern. J. Bacteriol. 2001, 183, 2605–2613. [Google Scholar] [CrossRef] [Green Version]
  75. Risser, D.D.; Callahan, S.M. Genetic and cytological evidence that heterocyst patterning is regulated by inhibitor gradients that promote activator decay. Proc. Natl. Acad. Sci. USA 2009, 106, 19884–19888. [Google Scholar] [CrossRef] [Green Version]
  76. Borthakur, P.B.; Orozco, C.C.; Young-Robbins, S.S.; Haselkorn, R.; Callahan, S.M. Inactivation of patS and hetN causes lethal levels of heterocyst differentiation in the filamentous cyanobacterium Anabaena sp. PCC 7120. Mol. Microbiol. 2005, 57, 111–123. [Google Scholar] [CrossRef]
  77. Corrales-Guerrero, L.; Mariscal, V.; Nu¨rnberg, D.J.; Elhai, J.; Mullineaux, C.W.; Flores, E.; Herrero, A. Subcellular localization and clues for the function of the HetN factor influencing heterocyst distribution in Anabaena sp. strain PCC 7120. J. Bacteriol. 2014, 196, 3452–3460. [Google Scholar] [CrossRef] [PubMed] [Green Version]
  78. Muñoz-García, J.; Ares, S. Formation and maintenance of nitrogen-fixing cell patterns in filamentous cyanobacteria. Proc. Natl. Acad. Sci. USA 2016, 113, 6218–6223. [Google Scholar] [CrossRef] [PubMed] [Green Version]
  79. Berry, D.; Mader, E.; Lee, T.K.; Woebken, D.; Wang, Y.; Zhu, D.; Palatinszky, M.; Schintlmeister, A.; Schmid, M.C.; Hanson, B.T.; et al. Tracking heavy water (D2O) incorporation for identifying and sorting active microbial cells. Proc. Natl. Acad. Sci. USA 2015, 112, E194–E203. [Google Scholar] [CrossRef] [PubMed] [Green Version]
  80. He, C.; Fong, L.G.; Young, S.G.; Jiang, H. NanoSIMS imaging: An approach for visualizing and quantifying lipids in cells and tissues. J. Investig. Med. 2017, 65, 669–672. [Google Scholar] [CrossRef] [Green Version]
  81. Lee, K.S.; Palatinszky, M.; Pereira, F.C.; Nguyen, J.; Fernandez, V.I.; Mueller, A.J.; Menolascina, F.; Daims, H.; Berry, D.; Wagner, M.; et al. An automated Raman-based platform for the sorting of live cells by functional properties. Nat. Microbiol. 2019, 4, 1035–1048. [Google Scholar] [CrossRef] [Green Version]
  82. Popa, R.; Weber, P.K.; Pett-Ridge, J.; Finzi, J.A.; Fallon, S.J.; Hutcheon, I.D.; Nealson, K.H.; Capone, D.G. Carbon and nitrogen fixation and metabolite exchange in and between individual cells of Anabaena oscillarioides. ISME J. 2007, 1, 354–360. [Google Scholar] [CrossRef]
  83. Sharkey, T.D.; Berry, J.A. Carbon isotope fractionation of algae influenced by an inducible CO2 concentrating mechanism. In Inorganic Carbon uptake by Aquatic Photosynthetic Organisms; Lucas, W.J., Berry, J.A., Eds.; American Society of Plant Physiologists: Rockville, MD, USA, 1985; pp. 389–401. [Google Scholar]
  84. Keller, K.; Morel, F.M.M. A model of carbon isotopic fractionation and active carbon uptake in phytoplankton. Mar. Ecol. Prog. Ser. 1999, 182, 295–298. [Google Scholar] [CrossRef] [Green Version]
  85. Rittmann, B.E.; McCarty, P.L. Environmental Biotechnology: Principles and Applications; McGraw-Hill: New York, NY, USA, 2001; pp. 126–164. [Google Scholar]
Figure 1. Schematic of the cell flux model of diatom–diazotroph association (CFM-DDA). Green frame: the silica frustule of the diatom (Hemiaulus). Brown frame: cell membrane layers of trichomes (Richelia). Green space: intracellular space of the diatoms. Blue space: intracellular space of vegetative cells. Orange space: intracellular space of heterocysts. Yellow ovals: C-based molecules. Pink ovals: N-based molecules. QC and QN indicate cellular quotas of C and N, respectively. A schematic with detailed notation is shown in Figure S1.
Plants 09 00192 g001
Figure 2. Rate of N2 fixation and the balance of C supply and consumption. (A) Rate of N2 fixation per C in the trichome. In the legend, “Model, DDA” indicates model results for DDA. “Model, DDA*” is model ignoring N2 fixation for diatom. “Data Trichodesmium”, “Data Crocosphaera”, and “Data Nostoc” are data for Trichodesmium [32,33,54], Crocosphaera [6,34,35,55,56], and Nostoc [57], respectively. (B) Predicted balance of C supply and consumption. Supp. and Cons. indicate “supply from” and “consumption by”, respectively. The arrows are to point out the supply–demand discrepancies.
Plants 09 00192 g002
Figure 3. Simulated C (blue arrows) and N (brown arrows) exchanges between the diatoms (Hemiaulus) and trichomes (Richelia). The width of the arrows represents the relative magnitude of fluxes in mass. Blue numbers represent percentages of C fluxes (here, 100 indicates total sources and sinks of C in the symbiosis; e.g., 89 on the top left means 89% of photosynthesis in the symbiosis is done by a diatom) and red numbers are percentages of N (separate from those of C).
Plants 09 00192 g003
Figure 4. Simulated C budget for the Richelia trichomes and measured growth rates. (A) Cost and supply of C by the trichome per diatom (Hemiaulus) cells. Consumption* indicates the consumption of C that ignores the C consumption for N2 fixation for diatoms. (B) Measured growth rates of marine free-living diazotrophic cyanobacteria and DDAs (compiled by Follett et al., 2018) [31].
Plants 09 00192 g004
Figure 5. Simulated influences of the diatom volume (V) and number of the trichomes per diatom on N and C exchanges and the impact of light energy supply in heterocysts for sensitivity tests. (A) Increase in the (nutrient replete) growth rate of the trichomes (μTrichome) relative to that for the trichome without symbiosis. (B) N transfer from the trichome to diatom relative to the N requirement for the trichome for various diatom sizes and number of the trichomes; 100% means that the amount of N transfer equals the requirement for the growth of the trichomes. (C) C supply from the diatom relative to the total C requirement of the trichome. Dotted lines indicate the averaged volume based on the observations after removing the two highest outliers [6]. (D) The impact of light energy contribution in heterocysts (LECHet) on C supply from the diatom relative to the total C requirement of the trichome. LECHet indicates the fraction of energy requirements for N2 fixation that is covered by light harvesting in heterocysts. For example, 100% means no fixed C requirement for energy production for N2 fixation. We note that this energy requirement differs from the electron requirement for N2 fixation, which may not be covered by the light harvesting due to a lack of active Photosystem II [58]. The legend in (B) applies to all the panels. Trichome × n indicates n trichome per a diatom cell.
Plants 09 00192 g005
Figure 6. Hypothetical view of molecular exchanges between the diatom and the trichome and the protein allocation of the trichome. (A) Molecular exchanges between diatom and the trichome. Green space: cytoplasm in the diatom. Blue circles: vegetative cells. Orange Space: heterocysts. (B) The idealized protein allocations of non-symbiotic diazotrophs and symbiotic trichomes. Here, only proteins (enzymes) for amino acid (AA) synthesis and growth and N2 fixations (N2 fix.) are considered for conceptual simplicity. By having the diatom process molecules, symbiotic trichomes would be able to allocate more proteins for growth and N2 fixation, allowing the cells to grow and fix N2 faster.
Plants 09 00192 g006

