Article

Microwaves as Diagnostic Tool for Pituitary Tumors: Preliminary Investigations

1
Department of Electrical and Electronic Engineering, University of Cagliari, 09123 Cagliari, Italy
2
Istituto Italiano di Tecnologia, Via Morego 30, 16163 Genoa, Italy
3
Department of Electrical, Electronic, Telecommunications Engineering, and Naval Architecture, University of Genoa, 16145 Genoa, Italy
4
Institute for the Electromagnetic Sensing of the Environment, National Research Council of Italy, 80124 Naples, Italy
5
Faculty of Technical Sciences, University of Novi Sad, 142 20 Novi Sad, Serbia
6
Institute of Microbiology of the CAS, v. v. i., Vídeňská 1083, 142 20 Prague, Czech Republic
*
Author to whom correspondence should be addressed.
Electronics 2022, 11(10), 1608; https://doi.org/10.3390/electronics11101608
Submission received: 12 April 2022 / Revised: 11 May 2022 / Accepted: 16 May 2022 / Published: 18 May 2022
(This article belongs to the Special Issue Biomedical Applications of Micro/Millimeter Waves)

Abstract

:
To date, tumors, the second cause of death worldwide, are a modern medicine plight. The development of rapid, cost-effective and reliable prevention and diagnostics tools is mandatory to support clinicians and ensure patients’ adequate intervention. Pituitary tumors are a class of neoplasm, which calls for suitable and ad hoc diagnostic tools. Recently, microwaves have gained interest as a non-ionizing, non-invasive valuable diagnostic approach for identifying pathologic tissues according to their dielectric properties. This work deals with the preliminary investigation of the feasibility of using microwaves to diagnose pituitary tumors. In particular, it focuses on benign tumors of the adenohypophysis, e.g., the pituitary adenomas. It is assumed to access the region of interest of the pituitary region by following a trans-sphenoidal approach. The problem was modeled by developing an equivalent transmission line model of the multi-layered, lossy tissues (front bone of sphenoid sinuses, air in the sinuses, posterior bone of sphenoid sinuses, the pituitary gland and the tumor). The forward problem was developed to investigate the transmission coefficient for identifying the most favorable propagation conditions. Then, it was analyzed if, by the solution of an inverse problem, it is possible to reconstruct the permittivity and electrical conductivity profiles and identify the tumor presence. The results are promising since a maximum reconstruction error of 8% is found, in the worst case, thus paving the way for the use of microwaves for the diagnosis of pituitary tumors.

1. Introduction

Pituitary adenomas are benign tumors of the hypophysis anterior lobe (adenohypophysis), and are often associated with an excessive secretion of pituitary hormones (e.g., free T4, insulin growth factor 1, cortisol, testosterone) related to an endocrine hyperfunction [1,2,3,4]. The benign tumors of the adenohypophysis may present as microadenomas, which are small lesions ( < 1 cm) that do not increase the volume of the pituitary peduncle, or as macroadenomas, which are large size ( > 1 cm) formations that can grow to erode the sella turcica bone, even infiltrating surrounding cranial structures [4,5]. In general, pituitary microadenomas are asymptomatic, whilst pituitary macroadenomas often result in local symptomatology, due to the excessive size, and systematic effects, due to the hypersecretion of hormones [1,2,3,4,5]. Among the worst implications of pituitary macroadenomas, the infiltration of optic chiasm can lead to bitemporal hemianopsia and loss of central vision, but also the paralysis of oculomotor nerves and even severe headaches [4]. The quality of life of patients suffering from this pathology can worsen. Bigger pituitary adenomas can invade the hypothalamus, which would result in issues in thermo-regulation, hyperphagia, and hormone-related syndromes, originating from interference with the physiological stimuli of the hypothalamus on the hypophysis [5]. The pituitary adenomas generally affect mainly men between 20 and 50 years old, but the incidence is high for both genders and in other ages [6]. It is worth highlighting that non-functional, small pituitary adenomas are incidentally found in the 25% of adults subject to autopsy, thus implying that this class of neoplasms is very frequent [6].
From a clinical point of view, the diagnosis of pituitary tumors is not trivial [7]. Currently available state-of-the-art diagnostic methodologies present limitations. The diagnostic process begins with the medical history and the familiarity analysis, then blood and urine samples are analyzed to highlight if some hormones are present in excessive concentration. However, these biomarkers are sufficient to suggest the presence of a pituitary tumor, but cannot provide information on the size, position and functional state. Therefore, radiologic techniques are needed [5,7], such as nuclear magnetic resonance (NMR) and computerized tomography (CT). NMR is, to date, the gold-standard approach for the evaluation of adenohypophysis tumors, which present a high contrast, with respect to healthy tissues, in the transverse relaxation (T2)-based images [5]. Despite this advantage, NMR technique presents several limitations [8,9,10], such as the relatively high cost, as well as safety and compatibility issues for patients with pacemakers or defibrillators or metallic prosthetic implants [10]. Furthermore, from a patient perspective, the NMR exam comes with discomfort, due to anxiety and claustrophobia, and relatively long examination times [4]. On the other hand, CT is supposed to be more patient-friendly, faster, and with a significantly lower cost than NMR, but makes use of ionizing radiations, which are known to damage DNA, have carcinogenic potential and produce cellular damage [5,10]. In this framework, it is necessary to investigate if alternative diagnostic methods and technologies, even with a complementary and supporting character, can be developed to identify and monitor pituitary tumors, with sufficient accuracy and reliability, in a safe way, and with cost-effective, real-time performances.
To date, microwaves (MW) as a diagnostic tool are gaining increasing interest in biomedical science [11,12]. By launching an MW signal in biological tissues, the electromagnetic field (EMF) interacts differently with healthy or pathologic cells, given their different relative dielectric permittivity ( ϵ r ) and electrical conductivity ( σ , in S/m) [13,14]. MW makes use of non-ionizing radiation by relying on relatively cheap and easily realizable equipment and scalable and ergonomic devices [11,12,13,14]. These features make MW an appealing diagnostic technique. Furthermore, MW does not make use of ionizing radiation, thus representing a non-harmful and non-risky diagnostic and monitoring methodology. The detection of breast cancers with MW imaging has been thoroughly investigated [15,16,17,18,19]. For instance, in [17], a low-cost, portable microwave imaging system, composed of an antenna array working between 0.5 and 8 GHz, was developed and tested on a four-layer tissue-mimicking phantom, with promising results. On the other hand, MW has been studied to help the early diagnosis of hemorrhagic and ischemic ictus located in the brain region [20,21,22,23,24]. In [20], a preliminary investigation was performed on a mono-dimensional multi-layer model of the human head in order to select suitable matching medium properties and working frequencies. Then, other works, such as [21], focused on the computational issues related to tomographic microwave imaging for stroke detection. In this regard, different solution approaches were proposed, such as the variable-exponent Lebesgue-space inversion scheme found in [23] or the deep neural network strategy from [24]. More recently, the detection and diagnosis of bone fracture by using MW in the range 0.5–4 GHz and Vivaldi antennas were proposed [25]. The monitoring of fluid accumulation in the thorax region through 24 epsilon-negative metamaterial unit-cell loaded Yagi antennas was preliminarily investigated in [26]. The challenge of brain tumors (mainly glioblastomas) detection with ultra-wideband MW signals was preliminarily analyzed with numerical finite difference time domain (FDTD) analysis in [27]. The use of MW to diagnose and monitor cervical myelopathy was analyzed theoretically and with phantom experiments in [28]. More recently, the problem of MW tumor detection in the neck region was investigated by using neural networks [29]. Despite MW having been applied to several body regions and different pathologies, to date, to the best of the authors’ knowledge, the use of MW to diagnose pituitary tumors has never been proposed.
Given these promising biomedical applications, in this work, MW as an alternative and innovative diagnostic approach for the diagnosis of pituitary tumors is proposed. Despite the fact that MW systems for breast cancer [15,16,17,18,19] and ictus [20,21,22,23,24] detection and monitoring are approaching the commercialization stage, when new body locations or pathologies are targeted, such as in [25,26,27,28,29], a dedicated initial study is mandatory. In particular, it is fundamental to develop a mathematical framework to investigate the propagation in a simplified geometry and identify if and which type of matching medium is required, while finding a suitable range of working frequency [20,27,28]. Such an in silico analysis can drive the design of an MW system, inspire the development of dedicated, efficient solutions to inverse problems and guide the preparation of dedicated experimental setups for testing the proof-of-concept on tissue-mimicking phantoms [25,26,28].
This work aims at evaluating the feasibility of MW as a diagnostic tool for pituitary tumors. To this aim, a simplified, mono-dimensional propagation model based on transmission line formalism is proposed, which can seize the essential geometric and physiopathologic features of the pituitary region in order to evaluate the operative frequencies required to ensure sufficient transmission performances. After a thorough preliminary study of the forward problem, an inverse problem aimed at investigating the capability of reconstructing the dielectric properties distribution of the targeted tissues is developed and, hence, the tumor detection. The paper is organized as follows: in Section 2, the physiopathology and anatomy of pituitary tumors are described. In Section 3, the proposed model is carefully presented and the preliminary investigation method is outlined. In Section 4, results are given, whilst in Section 5, the conclusions are provided.

2. Physiopathology and Problem Description

Since the state-of-the-art diagnostic approaches for the detection of pituitary tumors suffer from high cost and discomfort and are limited by the use of ionizing radiations, in this work we propose an alternative strategy based on microwaves. To this aim, in order to study the feasibility of this approach, it is necessary to understand the physiological scenario in hand.
In Figure 1a, a 3D sagittal section of a human head is shown. The use of microwaves as a tool for investigating head and brain pathologies has already been studied [20,21,22,23,24,28,29]. Previous works dealt with the use of antenna arrays to illuminate the head and recover the distribution of dielectric properties from the scattered fields, following suitable inversion procedures. This strategy was used for detecting ictus, while discriminating their size and type (i.e., ischemic or hemorrhagic) [20,21], and also for detecting brain tumors [24]. Despite being established methods in microwave imaging, these alternative diagnostic modalities mainly aim at providing information about the dielectric contrast of specific biological targets, with respect to the healthy tissue. The estimation of size and geometrical aspects is sometimes underestimated. The spatial resolution, which is limited to several mm, of these methods is not enough for precise and effective detection of abnormalities in the surroundings of the pituitary gland. Therefore, the use of external antenna arrays cannot be the best approach for the case of interest.
In this framework, this work conceives an innovative approach for performing the diagnosis of pituitary tumors with microwaves. Inspiration was taken from the well-known neurosurgical approach known as the trans-sphenoidal approach (TSSPA) [30,31,32]. The TSSPA is a mini-invasive, endonasal surgical strategy in which pituitary adenomas are removed by directly accessing the target area with a handheld nasal speculum, passing through the middle turbinate and arriving directly at the sella turcica (Figure 1b). The TSSP has the advantages of minimizing post-operative rhinological complications, with high efficacy and safety, thus reducing pain and facilitating recovery [30,31]. Given this minimally invasive access to the target area, our idea is to assume that a coaxial cable (Ø < 1 mm) can be driven to the sella turcica through this endonasal route, as shown in Figure 1b, and hence, a microwave signal can be injected, so that the reflected signal can be analyzed to retrieve useful diagnostic information. Probably, discomfort could be a drawback of the envisioned MW diagnostic approach. Therein, from the reflected signal, the presence of a tumor, such as that depicted in Figure 1c, could be detected. However, the proposed approach is innovative, thus it has never been tested and must be studied with rigorous electromagnetic engineering methods.

3. Methods

3.1. Forward Problem

Given the anatomy of the pituitary region (Figure 1a), and provided that the coaxial cable would lie in the nasal area, which is filled with air (Figure 1b), it is possible to assume a simplified geometry to develop a model suitable to perform the solution of the forward propagation problem. This simplified approach is often encountered in the preliminary studies of MW diagnostics [20].
As given in Figure 2, under a first approximation, the anatomical area of interest can be reduced to a planar, stratified and multi-layer geometry consisting of air, bone, air, bone again, then the hypothetical tumor and, finally, the pituitary gland. The outer, semi-infinite medium is assumed to be air ( ϵ a = 1 ϵ 0 ,   σ a = 0 S/m) because the probe would not directly touch the sphenoidal sinus. The first bony structure is the sphenoidal sinus, having a length, l b , 1 (Figure 2a), with relative dielectric permittivity, ϵ b and electrical conductivity, σ b . An air gap of size, d a is present, and, then, the posterior part of the sphenoidal sinus fused with the central body of the sphenoid is found. Behind these skull bones, a hypothetical tumor having relative dielectric permittivity, ϵ t and electrical conductivity, σ t , with length, l t , can be present. Finally, the pituitary gland is considered to be a semi-infinite medium. The geometry may appear far from the realistic medical scenario, but the essential propagation features and the minimal geometric aspects are considered herein.
The bone and pituitary gland electromagnetic properties were taken from the IT’IS database [33]. As regards the bone properties, the properties of cortical bone are assumed, as is usually done [20,21,22,23,24,28,29]. This choice is justified by the fact that, from an anatomic-histological point of view, the sphenoid is a compact and not fragile bone. On the other hand, the IT’IS database assumes that the endocrine glands all have similar properties [33]. By comparing the microwave properties from [33] to that measured from ex vivo thyroid tissue samples found in [34], it is possible to notice that the pituitary and thyroid tissues present similar dielectric dispersion over frequency. This uncertainty and lack of precise characterization of the hypophysis must be reported. However, specific values for the pituitary glands have not been reported.
As regards the pituitary tumor properties, a remark is in order. Given that there is a lack in the literature on the high-frequency electromagnetic properties of healthy hypophysis tissue, it is not surprising that for the pathologic counterpart, specific dielectric characterization campaigns have never been carried out. By relying on the histological and physiological similarities between thyroid and pituitary glands, the dielectric data acquired on ex vivo thyroid adenoma samples can be used [35]. In [35], the complex dielectric permittivity of the tumor can be described by the following two-pole Cole–Cole model:
ϵ t ω = ϵ j ϵ = ϵ + Δ ϵ 1 1 + j ω τ 1 1 α 1 + Δ ϵ 2 1 + j ω τ 2 1 α 2 j σ D C ω   ϵ 0  
where ϵ and ϵ are the in-phase and out-of-phase components of the permittivity, whilst ω = 2 π f is the angular frequency, ϵ is the permittivity at optical frequency. In Equation (1), Δ ϵ i , for i = 1 , 2 , is the difference between the static permittivity of the i -th pole and ϵ (i.e., Δ ϵ i = ϵ s , i ϵ ), whilst τ i is the i -th relaxation time (in s) and α i is the i -th pole broadening parameter. The values of the Cole–Cole coefficients for the pituitary tumor are reported in Table 1 [35]. A comparison of the dielectric permittivities and electrical conductivities of the different media and biological tissues involved in this problem is shown in Figure 3a,b. From Figure 3, it is possible to notice that a reasonable contrast between the pituitary tumor and the healthy hypophysis in the electromagnetic properties exists. However, for the propagation problem sketched in Figure 2, it is relevant to evaluate the penetration depth, defined as [36]:
δ = c 2 ω ε 1 + ε ε 2 1
where c is the speed of light in m/s, and the other symbols retain their usual meaning. In Figure 3c, the penetration depths in the bone, hypophysis and pituitary tumor are shown for the given frequency range. It can be noticed that the bone tissue ensures good penetration for all frequencies. On the other hand, the tumor and hypophysis for f > 4 GHz absorb the MW signal in a significant way. Therefore, the selection of working frequencies has to be carefully investigated.
Given these tissue properties and considering the working frequency f to vary in the range 0.9 ,   10 GHz for the geometry from Figure 1a, the equivalent transmission line problem (Figure 1b) was solved by computing the characteristic impedance of the q -th layer (for q = 1 , .. , N , for N = 6 ) as [37]:
Z q ω = ζ 0 ϵ q ω
where ζ 0 is the vacuum impedance, equal to 377 Ω. The range of working frequencies was selected for several reasons. By relying on the existing literature on microwave imaging for biomedical applications [11,12,13,14,15,16,17,18,19,20,21,22,23,24,25,26,27,28,29], most of the work focused on a similar range. Furthermore, the propagation problem must be studied in a broad range in order to explore the trade-off between the penetration depth and the imaging resolution [28].
Then, relying on the iterative method, the circuital model shown in Figure 1b was solved by [37]:
Z i n , q   = Z q 1 Z i n , q 1 + j Z q 1 tan k q l q Z i n , q 1 + j Z i n , q 1 tan k q l q
where k (in 1/m) is the complex propagation constant of the q -th medium and l q is the physical size of the q -th layer. Therefore, the q -th reflection coefficient ( Γ q ) can be derived as [37]:
Γ q ω = Z i n , q + 1 Z q Z i n , q + 1 + Z q     .
The calculations were carried out using Matlab 2019a (The MathWorks Inc., Boston, MA, USA). The forward problem was solved in order to study the reflection coefficient Γ for f 0.9 ,   10 GHz and identify if minima in the reflection are found. In this framework, the Industrial, Scientific and Medical (ISM) bands of 915 MHz, 2.45 GHz and 5.8 GHz are considered, since the proposed simplified and preliminary analysis can drive the future design of a coaxial probe for the diagnosis of pituitary tumors [38,39]. For the study of the forward problem, the geometrical parameters were considered fixed and were not varied. The average geometrical features for the geometry shown in Figure 2 are reported in Table 2. The values of the layers were taken from literature data [30,31,32,33] by relying on measurements performed with Image J software on available magnetic resonance imaging (MRI) images [40].
In this framework, by recalling the discussion about the uncertainty in the electromagnetic tumor properties, we also studied the influence of a 16% and 5% variation on the average nominal value of the dielectric permittivity and of the electrical conductivity on the reflection coefficient.

3.2. Inverse Problem
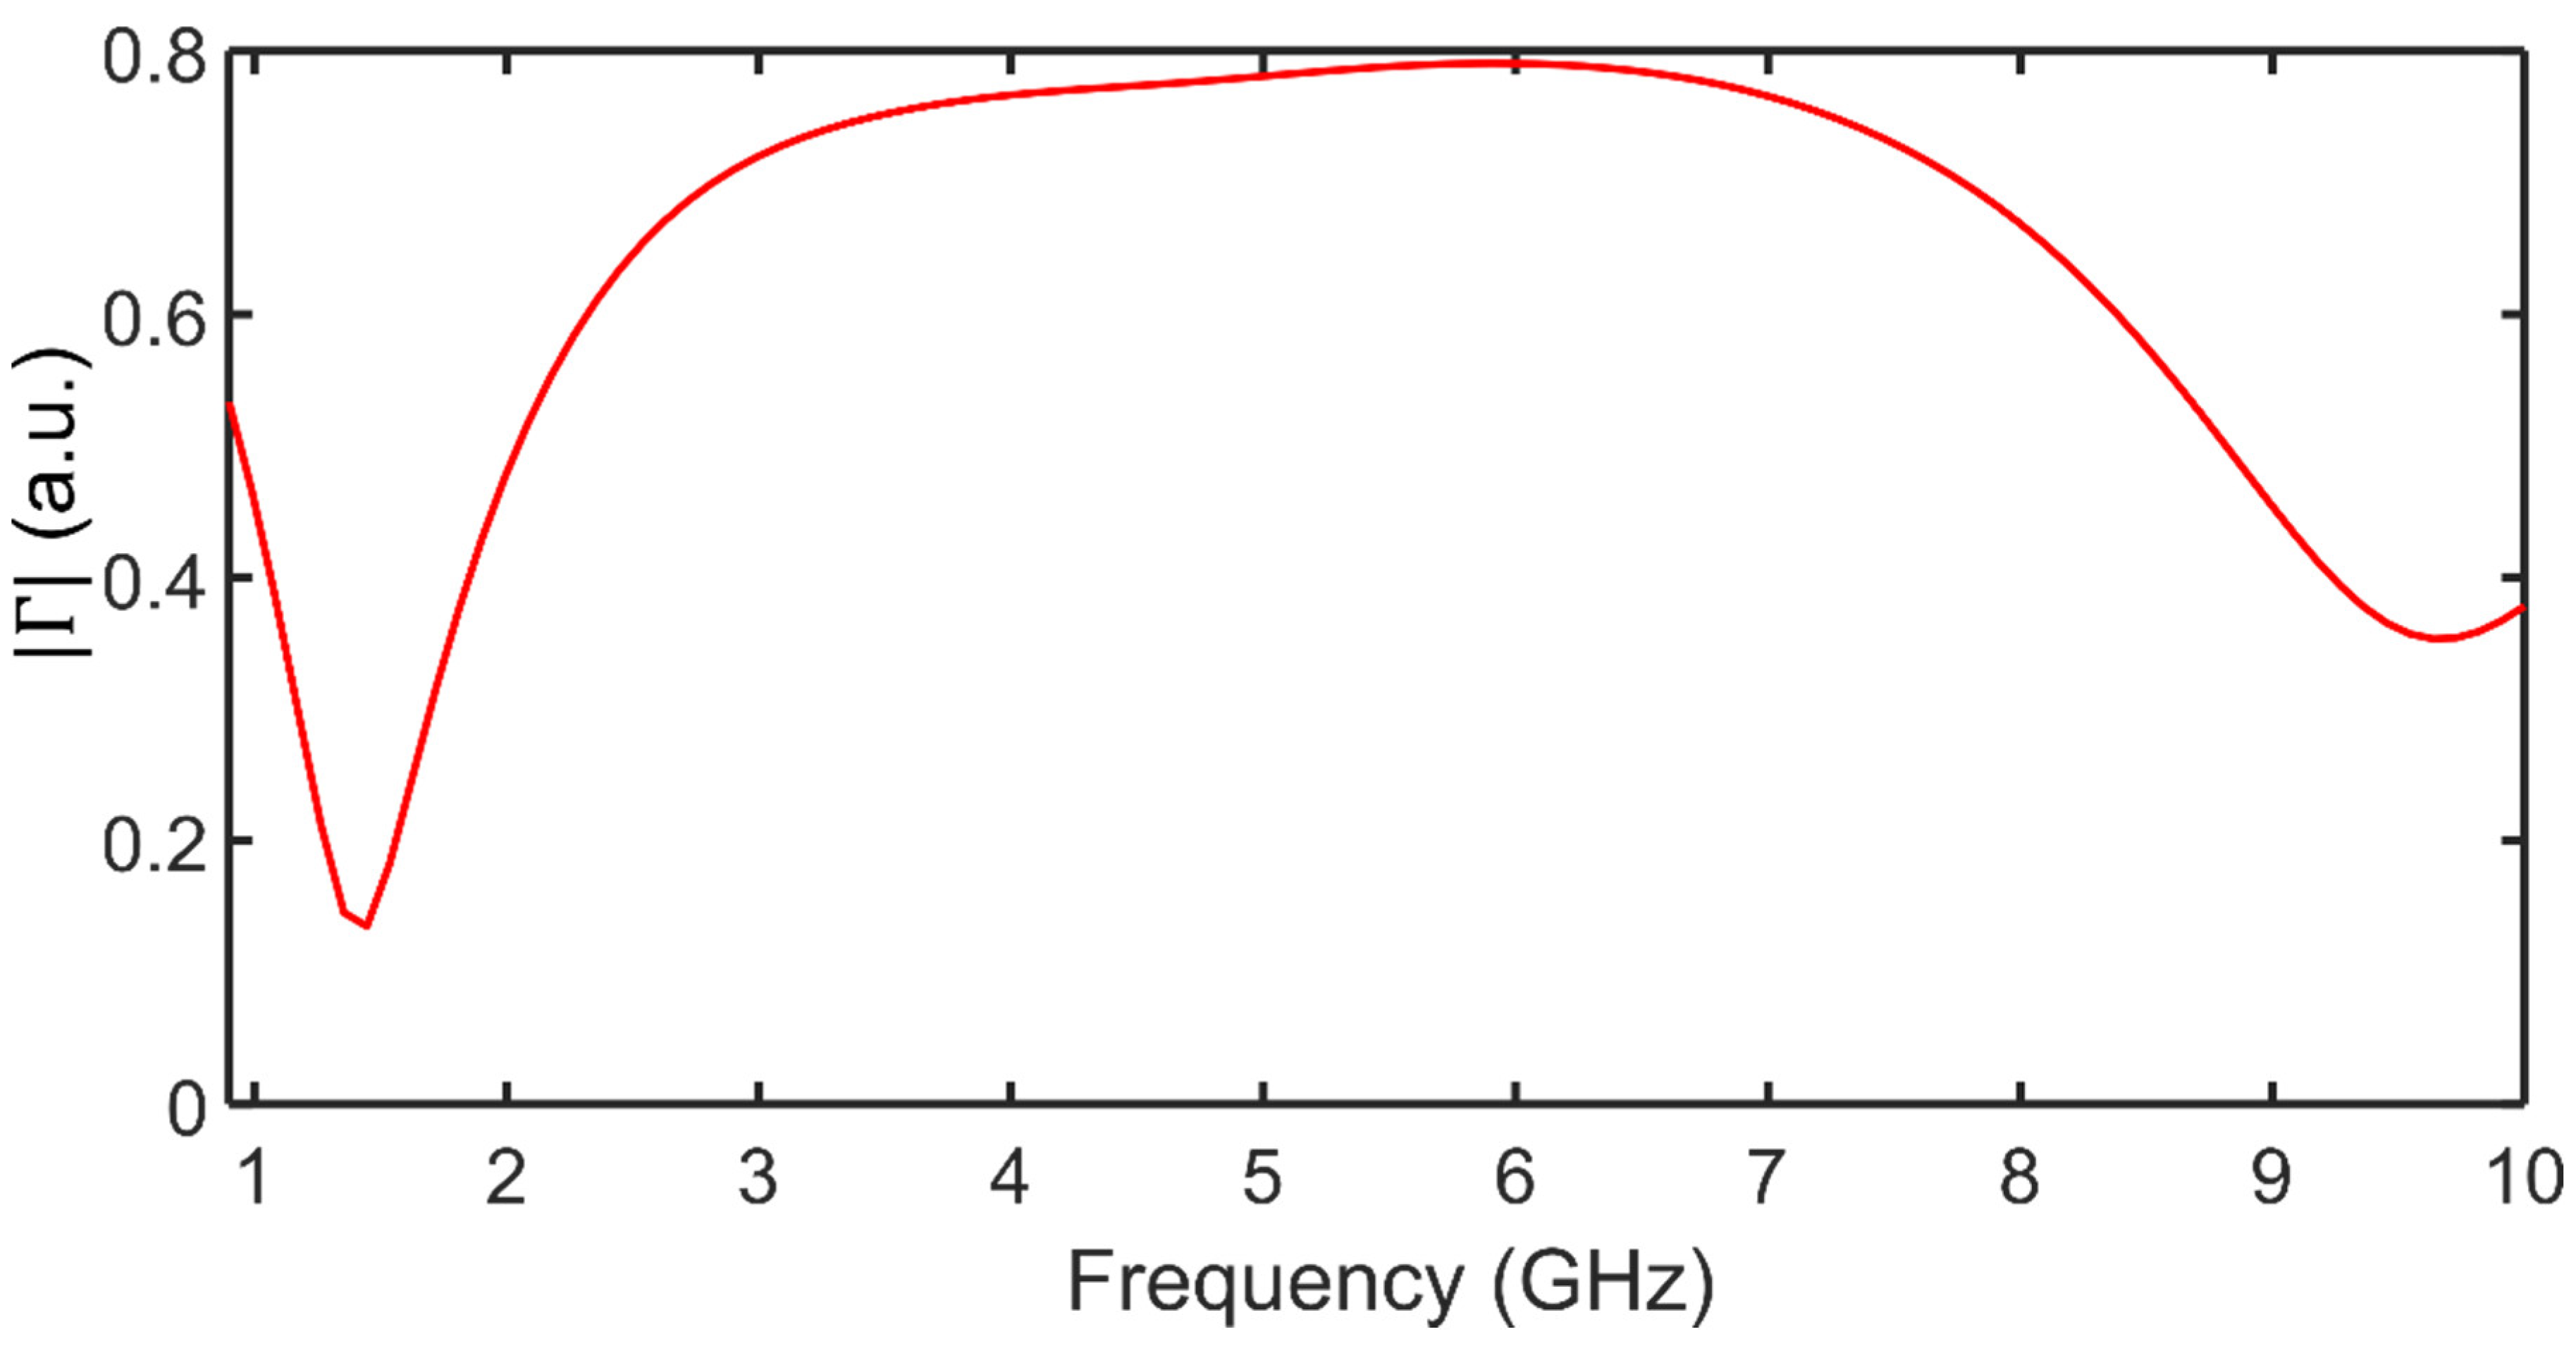
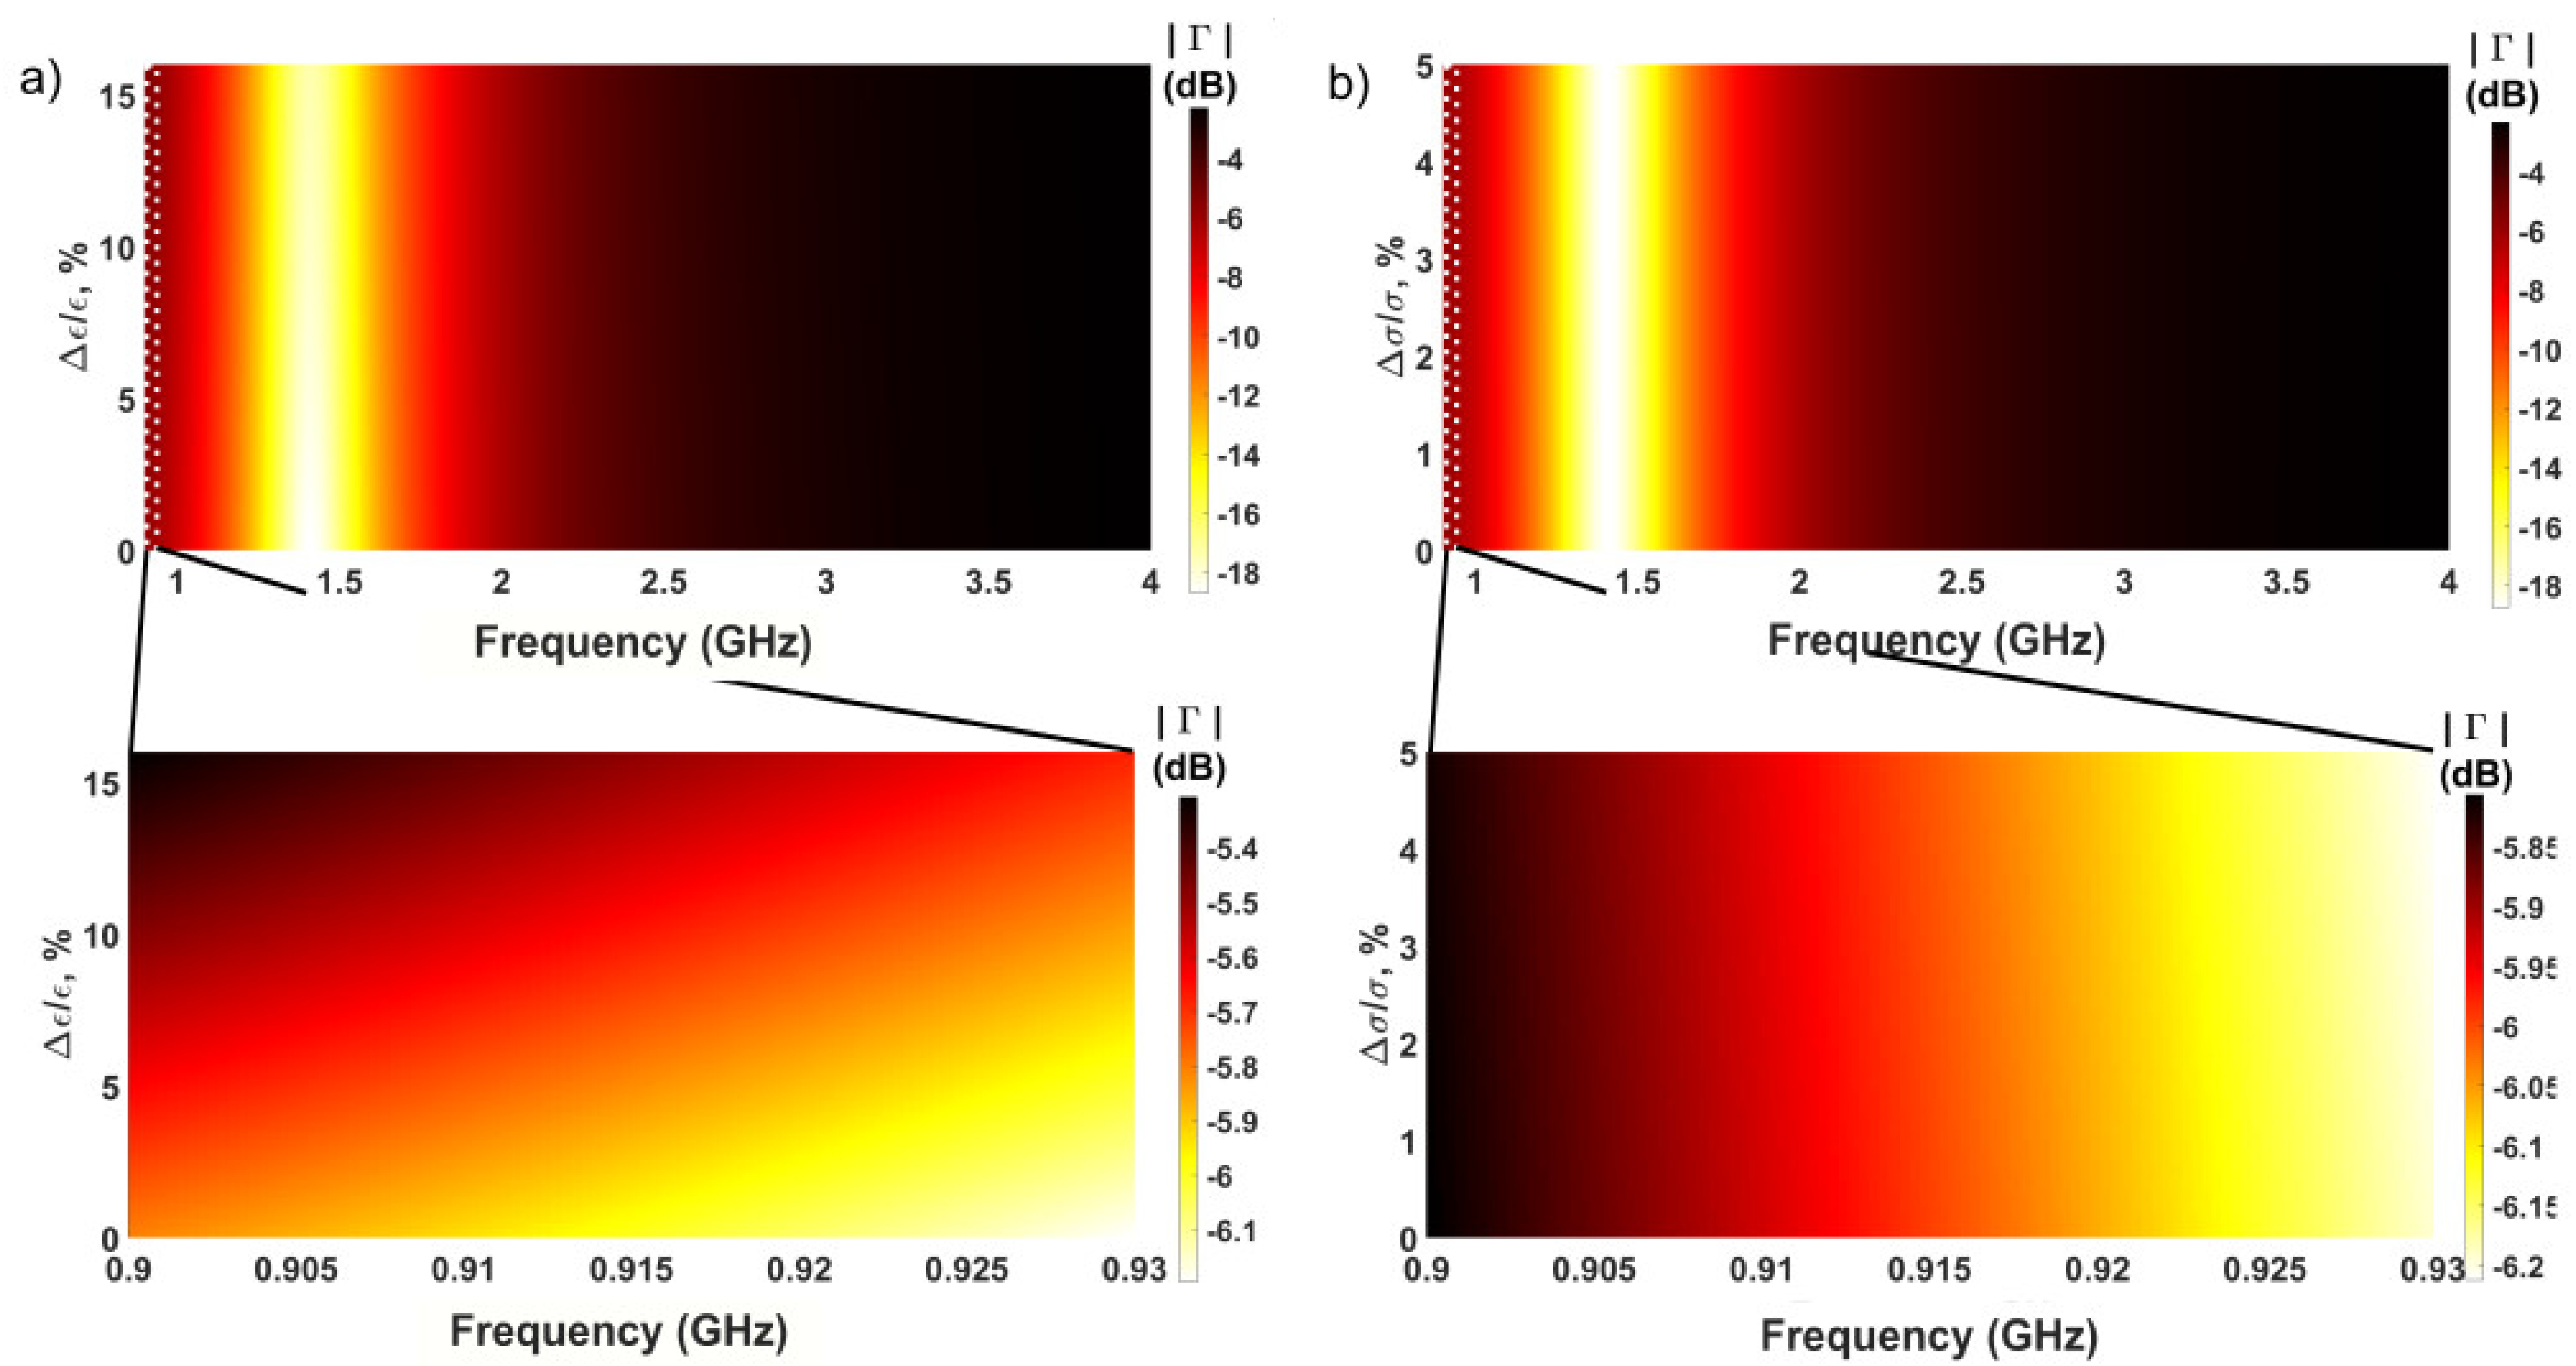
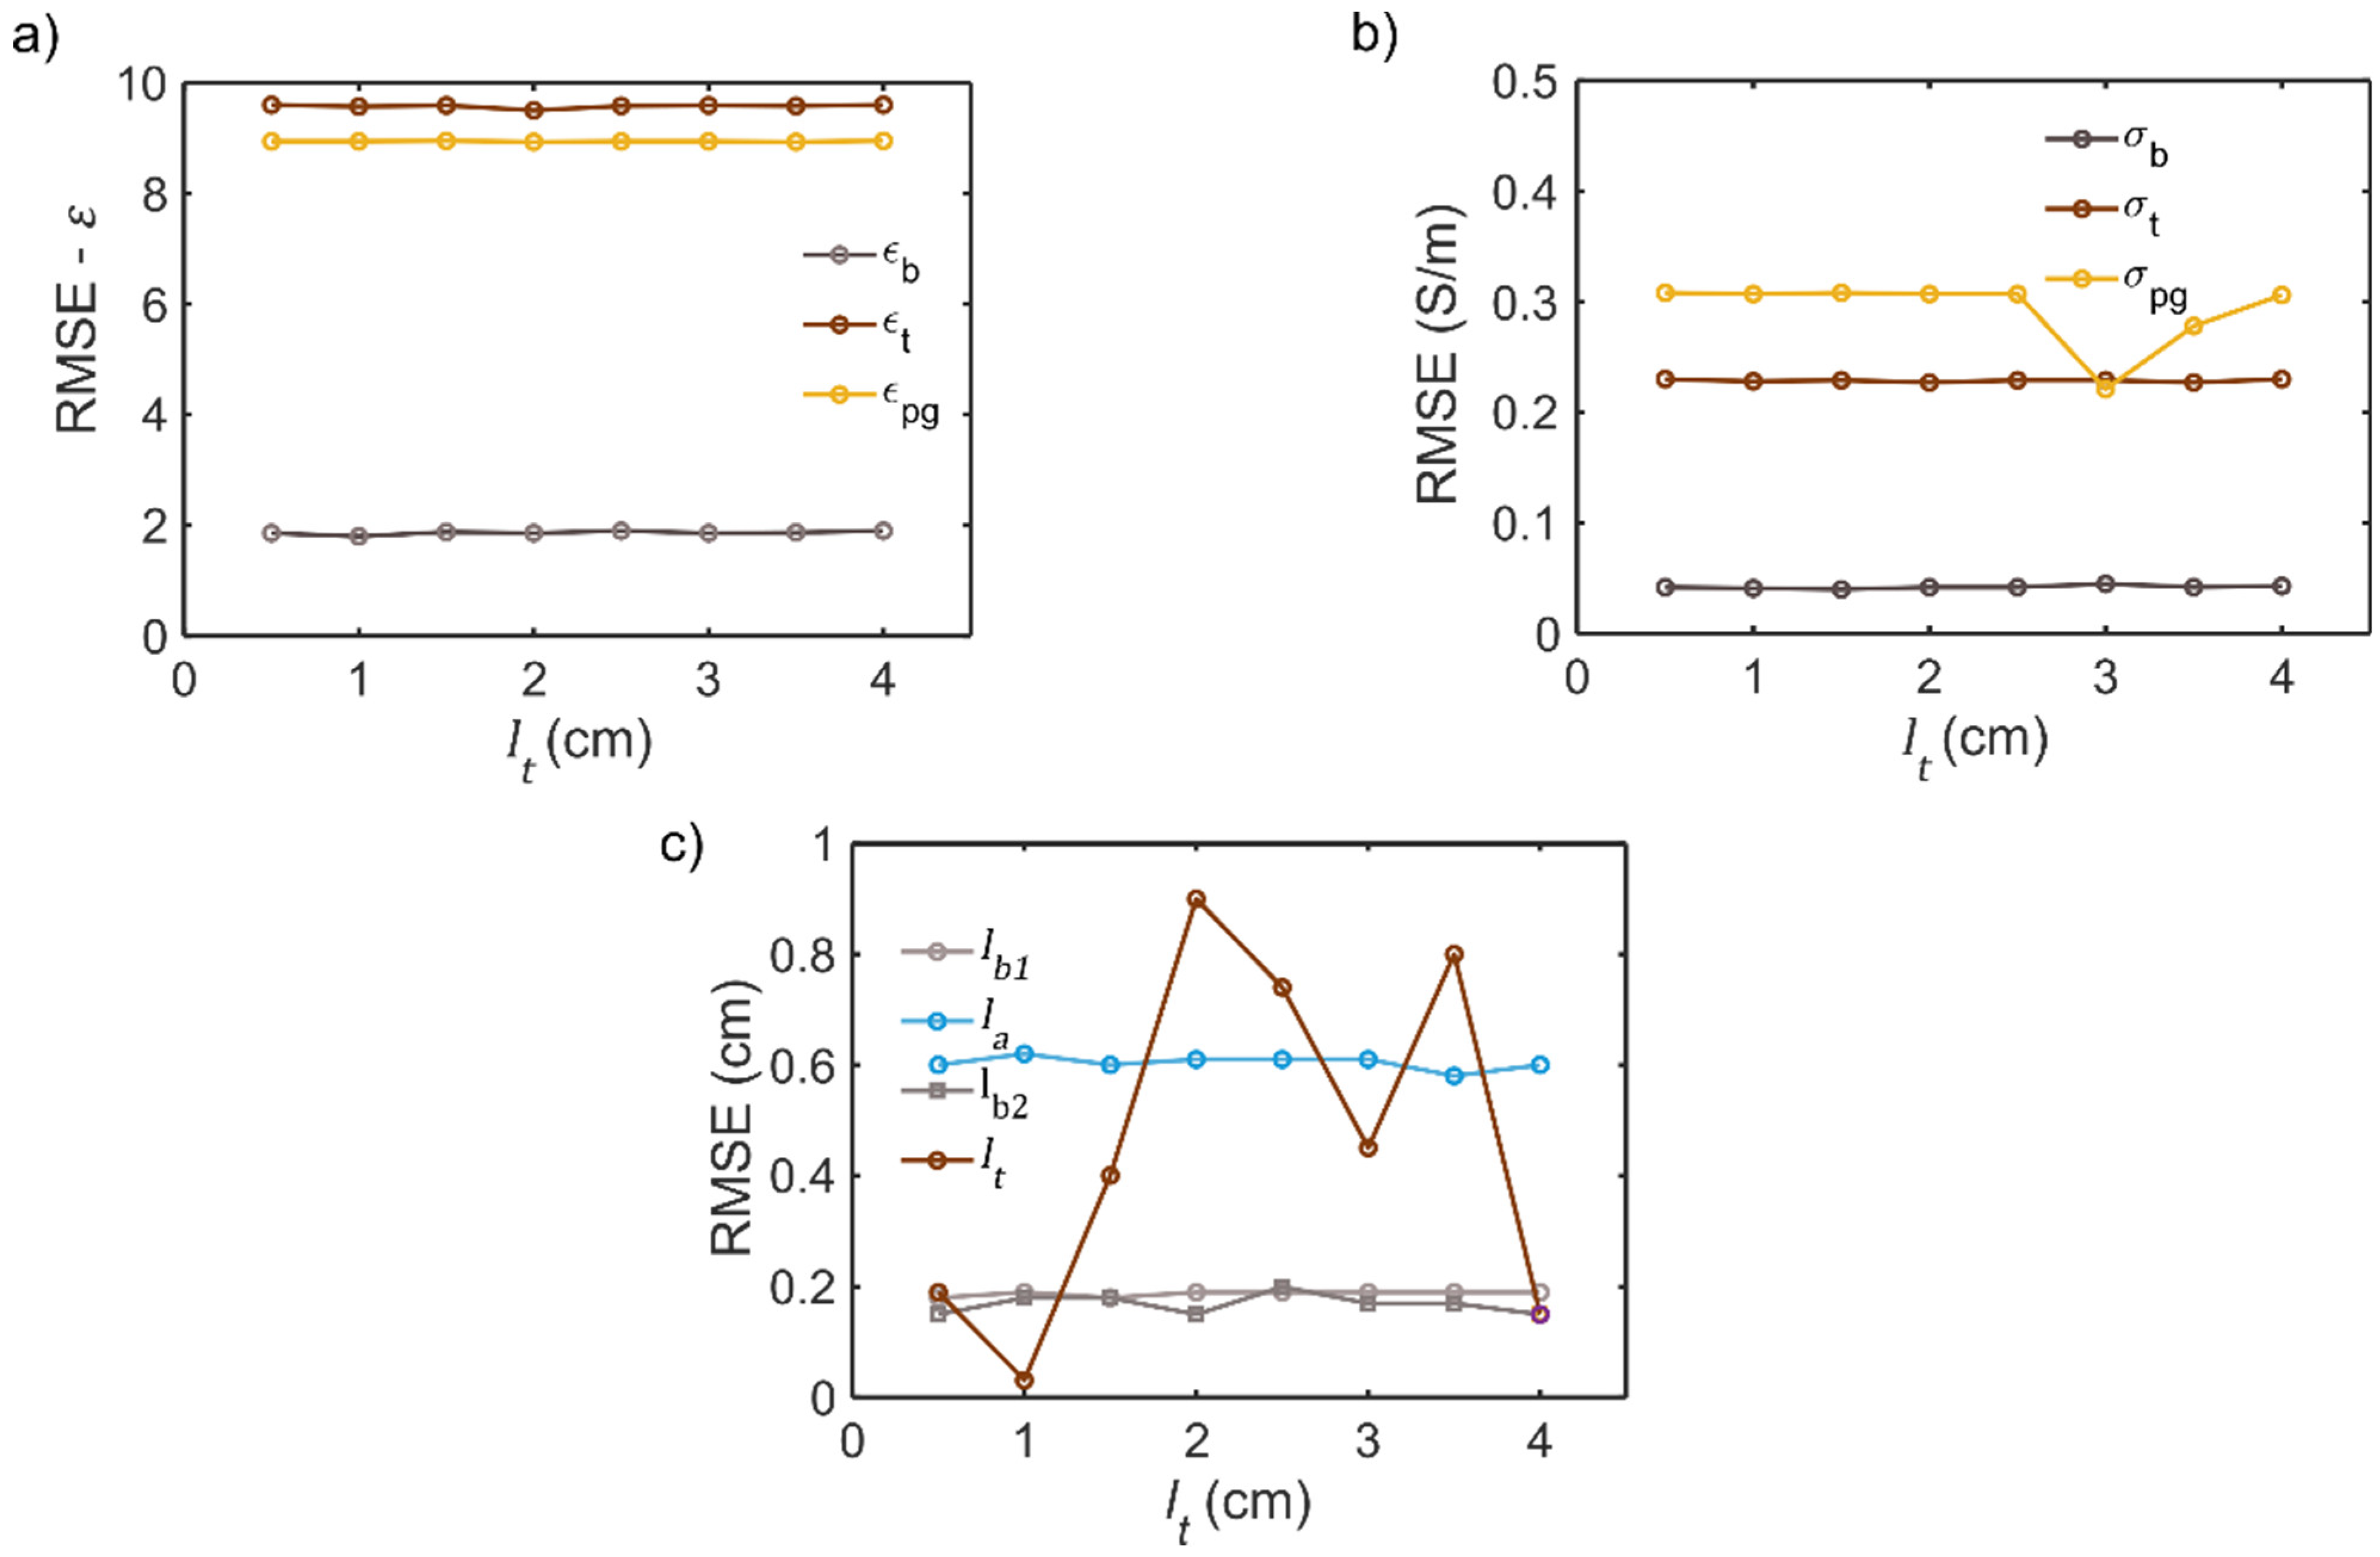
A diagnostic method, especially that based on imaging modalities, is based on the solution of an inverse problem [13,14,15]. The aim of this work is to preliminarily assess if it is possible to detect a pituitary tumor from the knowledge of the reflection coefficient ( Γ ω ), measured at the first (air–bone) interface for the geometry of Figure 1a. In particular, the aim is to retrieve the dielectric permittivity and electrical conductivity profiles (i.e., ϵ r z and σ z ), as well as to estimate the size of the tumor ( l t ).
Despite being a mono-dimensional geometry, the problem is non-linear and ill-posed, so that the existence, uniqueness and stability of the solution cannot be assumed [13,14,15,28,29]. In this work, the inverse problem was solved as an optimization problem, for which the cost function F : N u   , for a set of points S   N u should be minimized, so that:
min F x             x S
where x is a 1 × N u vector, N u being the number of unknowns. For our problem, by relying on the transmission line model (Figure 1b) developed for studying the propagation problem, the measured value was simulated and provided virtual, synthetic reflection coefficients, defined hereby as Γ s y n . The cost function is then:
F x = k h = 1 N f Re Γ m , h Re Γ s y n , h + Im Γ m , h Im Γ s y n , h 2
where N f is the number of frequencies. Indeed, after the study of the propagation in the geometry from Figure 2, a preferred frequency band is selected, and thus the inverse problem is solved for a narrow band around it. In this work, the solution vector is found by using a genetic algorithm (GA) routine. The use of GA for inverse microwave problems is known and constitutes a valid methodological choice for handling the large number of parameters involved [41,42]. The population size was set to 200 individuals, the mutation probability was fixed to 0.8 whilst the crossover was 0.5 and the maximum iteration was 1000. Given that the proposed solution approach is stochastic in nature [41,42], the GA routine is run three times, and the average value of the solution parameter is taken and reported.
In order to evaluate the quality of the solution, the reconstruction error on the dielectric permittivity, electrical conductivity and layer length was computed as the root mean square error (RMSE):
R M S E i = k = 1 N f y k y ^ k 2 N f
where y k is the estimated value and y ^ k is the expected, true value of the given variable.
The proposed approach to the inverse problem of MW diagnosis of pituitary tumors was tested for different cases. Having studied in the forward problem the selection of working frequency and the influence of the tumor properties on the reflection coefficient, the inverse problem for the multi-layer configuration given in Table 2 was solved. It is assumed that the geometrical parameters are known a priori, and hence the performance of the algorithm in deriving the MW properties of tissues was tested. In this case, the number of unknowns N u is equal to 6, and x = ϵ b , σ b , ϵ t , σ t , ϵ p g , σ p g .
Then, our analysis was refined by testing the proposed GA-based approach for the solution of the inverse problem by varying the tumor size and studying if it was possible to discriminate between microadenomas and macroadenomas [1,2,3,4,5]. In particular, the inverse problem for l t 0.5 ,   4 cm, with a step of 0.5 cm, was solved. In this case, the number of unknowns N u is equal to 10. Indeed, the aim is to find the dielectric permittivities and electrical conductivities of bone, tumor and hypophysis tissues, but also the length of the bone layer and the tumor size, i.e., in mathematical terms, x = ϵ b , σ b , ϵ t , σ t , ϵ p g , σ p g , l b 1 ,   l a , l b 2 , l t .

4. Results

The detection of pituitary tumors can be complex and costly using traditional imaging apparatuses, and alternative, engineering solutions have to be investigated. This work deals with the preliminary analysis of the use of microwaves as a tool for diagnosing the presence and size of pituitary tumors. It is assumed to access the front of the sella turcica from the endonasal route, by relying on the TSSPA with a coaxial cable, and then inject a MW signal. To this aim, by relying on a simplified mono-dimensional propagation model, shown in Figure 2, developed by relying on the physio-pathological morphology of the hypophysis region, a transmission line model was used to study the propagation in the system. In Figure 4, the magnitude of the reflection coefficient ( Γ ) in the band from 900 MHz to 10 GHz is shown. A strong reflection around ~6 GHz is occurring, whilst two minima can be observed, i.e., at circa 1.5 GHz and 9.5 GHz. Given the forecasted medical application, the values of the reflection coefficients at the nearest ISM bands have to be checked. In this framework, at 915 MHz the value of   Γ is ~0.4, whilst at 5.8 GHz it is ~0.8. At 2.45 GHz, Γ retains an intermediate value of ~0.65. Therefore, the lowest ISM band is the most promising working frequency range. Given the findings from Figure 4, the investigation range was narrowed to f 0.9 , 4 GHz in order to analyze the impact of the tumor properties on the MW propagation.
Given that the tumor properties are a relatively large and significant source of uncertainty, our feasibility study aimed at investigating if meaningful and relevant variation in the magnitude of the reflection coefficient can be found for different tumor properties. Therefore, with respect to the dielectric data reported in Figure 3 and [35], the tumor properties were varied at a maximum of 16%, whilst the electrical conductivity was increased up to 5% from its average value. The findings for the sensitivity analysis of the variations of Γ as a function of the tumor electromagnetic properties are reported in Figure 5. From Figure 5, we can observe that the reflection coefficient ranges from −3 to −18 dB. The insets around 915 MHz highlight that a narrow ~1 dB variation can arise for the prescribed tumor variation. It is therefore questionable to ask if it is possible to retrieve the electromagnetic properties and their spatial distribution with reasonable error by solving the inverse problem (Section 3.2). Given the findings from Figure 4 and Figure 5, the inverse problem will be solved for f 900 ,   930 MHz, for N f = 101 . The selection of this narrow range ensures that the dielectric properties are almost constant with frequency, allowing one to find a single value of the dielectric permittivity and of the electrical conductivity of each tissue.
To the aim of assessing the feasibility of using a microwave as a diagnostic tool for identifying the presence and type of pituitary tumors, the inverse problem for the case of a subject with layers having the sizes reported in Table 1 was solved. The dielectric permittivity and electrical conductivity profiles, compared to the ground truths, are shown in Figure 6a,b, respectively. It can be noticed that an average RMSE of ~0.8 can be found for ϵ b , while the error increases up to ~4.2 for ϵ t and is about 3.5 for ϵ p g . As regards the RMSE of the electrical conductivity values, the lowest average RMSE is circa 0.15 S/m for σ b and the maximum average RMSE is 1.3 S/m for σ p g .
Given the capability of the proposed inversion scheme to reconstruct with reasonable errors the distribution of the dielectric permittivity and the electrical conductivity, the analysis was refined and the layer’s size as unknown was included. Therefore, in this work, it was studied as to how the variation of the tumor size could affect the performances of the inverse problem and impact the potential of this innovative MW diagnostic method. These tests aimed at understanding if it was possible to estimate the size of the pituitary tumor, and, hence, discriminate between microadenomas and macroadenomas. The reconstructed profiles for the case of a macroadenoma ( l t = 3 cm) are shown in Figure 6c,d. By comparing Figure 6a,c, it is possible to notice that the reconstruction error lowers for ϵ b and that the algorithm underestimates ϵ t . By comparing Figure 6b,d, it is possible to highlight that the reconstructed σ t is underestimated. From Figure 6c,d, it is possible to infer that the tumor size, once the other geometrical parameters are fixed ( l b 1 ,   l a ,   l b 2 ), can impact the quality of the solution. This can in turn affect the diagnostic power of the proposed technique. Therefore, the tumor length l t was varied in the range 0.5 ,   4 cm, with a 0.5 cm step, and this solved the inverse problem. In Figure 7, the RMSE of the estimated dielectric permittivity, electrical conductivity and length of the layer sizes are reported. By observing Figure 7a, it is possible to notice that an almost constant reconstruction error is found for the dielectric permittivity. On the other hand, as given in Figure 7b, the RMSE for the σ t and σ b values presents similar behavior, whilst the values of   σ p g estimated for l t > 3 cm resulted in a lower error. From the diagnostic point of view, this finding suggests that the detection of larger tumors would be easier. However, the occurrence of macroadenomas is generally lower in the normal population [1,2,3,4,5]. As regards the physical size of the involved biological tissues, Figure 7c indicates that the dimension of the bony layers can be estimated reliably. In other words, the reconstructed l b 1 and l b 2 are almost insensitive to l t variations. Similar behavior is observed for the air gap length l a . The most critical parameter is the tumor size l t , as can be noticed in Figure 7c. The size of the tumor can be best estimated and retrieved when the tumor is a microadenoma ( l t < 1 cm), whilst the RMSE increases for 1.5 < l t < 3.5 cm, being relatively low for bigger neoplasms ( l t = 4 cm).

5. Conclusions

This work dealt with the preliminary investigation of the use of microwaves as a diagnostic tool for pituitary tumors. Currently available diagnostic tools are too costly and may be hazardous for human health, thus limiting pathology evolution and monitoring. A mini-invasive method that would make use of a coaxial cable inserted through the endonasal route was assumed to be used. Through the analysis of the reflected microwave signal, given a simplified mono-dimensional propagation problem, a suitable inversion procedure was developed to investigate the possibility of retrieving the permittivity and electrical conductivity profiles, as well as the tumor size. The inverse problem was solved using genetic algorithms. When working around 915 MHz, the maximum reconstruction error is ~6% for the electromagnetic properties and ~9% for the tumor length. The results indicate that there is room for developing an electromagnetic method for the diagnosis of pituitary tumors.
Future works will deal with the refinement of the inverse problem, the design of the endonasal coaxial cable [43,44,45] or with the bi- and three-dimensional full-wave analysis of the propagation problem, accounting for the presence of more detailed geometries and approximating a more realistic medical scenario [46,47], considering the near-field features in the electromagnetic model, thus challenging the translation of the proposed and envisioned MW diagnostic methodology into research projects, commercial products or clinical trials [48,49,50,51].

Author Contributions

Conceptualization, F.C., M.B.L., R.S., A.F. (Alessandro Fedeli), A.F. (Alessandro Fanti), G.M.; methodology, F.C., M.B.L., R.S., A.F. (Alessandro Fedeli); software, F.C., M.B.L., A.F. (Alessandro Fanti); validation, F.C.; formal analysis, F.C., M.B.L., N.C., A.F. (Alessandro Fedeli), A.R., N.D., A.F.; investigation, G.M., F.C., M.B.L., A.F. (Alessandro Fedeli), A.F. (Alessandro Fanti); resources, M.B.L., L.V., A.F. (Alessandro Fanti); data curation, G.M., F.C.; writing—original draft preparation, F.C., M.B.L., N.C., R.S.; writing—review and editing, F.C., M.B.L., N.C., R.S., A.F. (Alessandro Fedeli), N.D., L.V., A.F. (Alessandro Fanti); visualization, F.C., M.B.L.; supervision, A.F. (Alessandro Fedeli), A.R., N.D., L.V., A.F. (Alessandro Fanti), R.S.; project administration, A.F. (Alessandro Fanti); funding acquisition, A.F. (Alessandro Fanti) All authors have read and agreed to the published version of the manuscript.

Funding

This research received no external funding.

Institutional Review Board Statement

Not applicable.

Informed Consent Statement

Not applicable.

Data Availability Statement

Not applicable.

Acknowledgments

The authors would like to sincerely thank the anonymous reviewers for providing valuable suggestions that helped to improve this paper.

Conflicts of Interest

The authors declare no conflict of interest.

List of Abbreviations and Acronyms

Computerized TomographyCT
Electromagnetic FieldsEMF
Finite Difference Time DomainFDTD
Genetic AlgorithmGA
Industrial, Scientific and MedicalISM
Magnetic Resonance ImagingMRI
MicrowavesMW
Nuclear Magnetic ResonanceNMR
Root Mean Square ErrorRMSE
Trans-Sphenoidal ApproachTSSPA

List of Symbols and Variables

Variable/SymbolDescriptionUnit
α Broadening parameter-
c Speed of lightm/s
δ Penetration depthm
ϵ r Relative dielectric permittivity-
ϵ a Air dielectric permittivity-
ϵ 0 Vacuum permittivityF/m
ϵ b Bone dielectric permittivity-
ϵ t Pituitary tumor dielectric permittivity-
ϵ p g Pituitary gland dielectric permittivity-
ϵ Real part of the complex permittivity-
ϵ Imaginary part of the complex permittivity-
ϵ Permittivity at optical frequency-
Δ ϵ i Dielectric strength-
ϵ s Static dielectric permittivity-
f Working frequencyGHz
Γ Reflection coefficient-
k Complex propagation constant1/m
l b , 1 Length of the anterior sphenoidal sinusmm
d a Size of the air gapmm
l b , 2 Length of the posterior sinusmm
l t Size of the pituitary tumormm
N Number of layers-
N f Number of frequencies-
N U Number of unknowns-
σ a Electrical conductivity of airS/m
σ b Electrical conductivity of bone tissueS/m
σ t Electrical conductivity of pituitary tumorS/m
σ p g Electrical conductivity of pituitary glandS/m
τ Relaxation timeps
ω Angular frequencyrad/s
Z q Characteristic impedance of the q-th mediumΩ
Z i n , q   Input impedance of the q-th mediumΩ
ζ 0 Vacuum characteristic impedanceΩ

References

  1. Gasperi, M.; The Acromegaly Study Group of the Italian Society of Endocrinology; Martino, E.; Manetti, L.; Arosio, M.; Porretti, S.; Faglia, G.; Mariotti, S.; Colao, A.M.; Lombardi, G.; et al. Prevalence of thyroid diseases in patients with acromegaly: Results of an Italian multi-center study. J. Endocrinol. Investig. 2002, 25, 240–245. [Google Scholar] [CrossRef] [PubMed]
  2. Filopanti, M.; Barbieri, A.M.; Angioni, A.R.; Colao, A.; Gasco, V.; Grottoli, S.; Peri, A.; Baglioni, S.; Fustini, M.F.; Pigliaru, F.; et al. Dopamine D 2 Receptor gene polymorphisms and response to cabergoline therapy in patients with prolactin-secreting pituitary adenomas. Pharm. J. 2008, 8, 357–363. [Google Scholar] [CrossRef] [PubMed] [Green Version]
  3. Campero, A.; Martins, C.; Yasuda, A.; Rhoton, A.L., Jr. Microsurgical anatomy of the diaphragma sellae and its role in directing the pattern of growth of pituitary adenomas. Neurosurgery 2008, 62, 717–723. [Google Scholar] [PubMed]
  4. Serioli, S.; Doglietto, F.; Fiorindi, A.; Biroli, A.; Mattavelli, D.; Buffoli, B.; Ferrari, M.; Cornali, C.; Rodella, L.; Maroldi, R.; et al. Pituitary adenomas and invasiveness from anatomo-surgical, radiological, and histological perspectives: A systematic literature review. Cancers 2019, 11, 1936. [Google Scholar]
  5. Tortora, F.; Negro, A.; Grasso, L.F.; Colao, A.; Pivonello, R.; Splendiani, A.; Brunese, L.; Caranci, F. Pituitary magnetic resonance imaging predictive role in the therapeutic response of growth hormone-secreting pituitary adenomas. Gland. Surg. 2019, 8, S150–S158. [Google Scholar] [CrossRef]
  6. Casanueva, F.F.; Barkan, A.L.; Buchfelder, M.; Klibanski, A.; Laws, E.R.; Loeffler, J.S.; Melmed, S.; Mortini, P.; Wass, J.; Giustina, A. Criteria for the definition of Pituitary Tumor Centers of Excellence (PTCOE): A Pituitary Society statement. Pituitary 2017, 20, 489–498. [Google Scholar] [CrossRef]
  7. Daly, A.F.; Beckers, A. The epidemiology of pituitary adenomas. Endocrinol Metab Clin. N. Am. 2020, 49, 347–355. [Google Scholar]
  8. Bell, R.A. Economics of MRI technology. J. Magn. Reson. Imaging 1996, 6, 10–25. [Google Scholar]
  9. Robinson, J.C.; Whaley, C.; Brown, T.T. Reference pricing, consumer cost-sharing, and insurer spending for advanced imaging tests. Med. Care 2016, 54, 1050–1055. [Google Scholar] [CrossRef]
  10. Callahan, M.J.; MacDougall, R.D.; Bixby, S.D.; Voss, S.D.; Robertson, R.L.; Cravero, J.P. Ionizing radiation from computed tomography versus anesthesia for magnetic resonance imaging in infants and children: Patient safety considerations. Pediatr. Radiol. 2018, 48, 21–30. [Google Scholar]
  11. Chandra, R.; Zhou, H.; Balasingham, I.; Narayanan, R.M. On the opportunities and challenges in microwave medical sensing and imaging. IEEE Trans. Biomed. Eng. 2015, 62, 1667–1682. [Google Scholar] [CrossRef]
  12. Shao, W.; McCollough, T. Advances in microwave near-field imaging: Prototypes, systems, and applications. IEEE Microw. Mag. 2020, 21, 94–119. [Google Scholar] [CrossRef]
  13. Larsen, L.E.; Jacobi, J.H. Medical Applications of Microwave Imaging; IEEE Press: New York, NY, USA, 1985. [Google Scholar]
  14. Pastorino, M.; Randazzo, A. Microwave Imaging Methods and Applications, 1st ed.; Artech House: Boston, MA, USA, 2018. [Google Scholar]
  15. Nikolova, N.K. Microwave imaging for breast cancer. IEEE Microw. Mag. 2011, 12, 78–94. [Google Scholar] [CrossRef]
  16. Di Meo, S.; Espin-Lopez, P.F.; Martellosio, A.; Pasian, M.; Matrone, G.; Bozzi, M.; Magenes, G.; Mazzanti, A.; Perregrini, L.; Svelto, F.; et al. On the feasibility of breast cancer imaging systems at millimeter-waves frequencies. IEEE Trans. Microw. Theory Technol. 2017, 65, 1795–1806. [Google Scholar] [CrossRef]
  17. Islam, M.; Mahmud, M.; Islam, M.T.; Kibria, S.; Samsuzzaman, M. A low cost and portable microwave imaging system for breast tumor detection using UWB directional antenna array. Sci. Rep. 2019, 9, 15491. [Google Scholar]
  18. Aldhaeebi, M.A.; Alzoubi, K.; Almoneef, T.S.; Bamatraf, S.M.; Attia, H.; Ramahi, O.M. Review of microwaves techniques for breast cancer detection. Sensors 2020, 20, 2390. [Google Scholar] [CrossRef] [Green Version]
  19. Hosseinzadegan, S.; Fhager, A.; Persson, M.; Geimer, S.D.; Meaney, P.M. Discrete dipole approximation-based microwave tomography for fast breast cancer imaging. IEEE Trans. Microw. Theory Tech. 2021, 69, 2741–2752. [Google Scholar] [CrossRef]
  20. Scapaticci, R.; Di Donato, L.; Catapano, I.; Crocco, L. A feasibility study on microwave imaging for brain stroke monitoring. Prog. Electromagn. Res. B 2012, 40, 305–324. [Google Scholar] [CrossRef] [Green Version]
  21. Tournier, P.H.; Bonazzoli, M.; Dolean, V.; Rapetti, F.; Hecht, F.; Nataf, F.; Aliferis, I.; El Kanfoud, I.; Migliaccio, C.; De Buhan, M.; et al. Numerical modeling and high-speed par- allel computing: New perspectives on tomographic microwave imaging for brain stroke detection and monitoring. IEEE Antennas Propag. Mag. 2017, 59, 98–110. [Google Scholar] [CrossRef] [Green Version]
  22. Scapaticci, R.; Bjelogrlic, M.; Tobon-Vasquez, J.; Vipiana, F.; Mattes, M.; Crocco, L. Microwave technology for brain imaging and monitoring: Physical foundations, potential and limitations. In Emerging Electromagnetic Technologies for Brain Diseases Diagnostics, Monitoring and Therapy, 1st ed.; Crocco, L., Karanasiou, I., James, M.L., Conceição, R.C., Eds.; Springer International Publishing AG: Berlin, Germany, 2018; pp. 7–35. [Google Scholar]
  23. Bisio, I.; Estatico, C.; Fedeli, A.; Lavagetto, F.; Pastorino, M.; Randazzo, A.; Sciarrone, A. Variable-exponent Lebesgue-space inversion for brain stroke microwave imaging. IEEE Trans. Microw. Theory Tech. 2020, 68, 1882–1895. [Google Scholar] [CrossRef]
  24. Al-Saffar, A.; Bialkowski, A.; Baktashmotlagh, M.; Trakic, A.; Guo, L.; Abbosh, A. Closing the gap of simulation to reality in electromagnetic imaging of brain strokes via deep neural networks. IEEE Trans. Comp. Imaging 2021, 7, 13–21. [Google Scholar] [CrossRef]
  25. Ruvio, G.; Cuccaro, A.; Solimene, R.; Brancaccio, A.; Basile, B.; Amman, M.J. Microwave bone imaging: A preliminary scanning system for proof-of-concept. Healthc. Technol. Lett. 2016, 3, 218–221. [Google Scholar] [CrossRef] [PubMed] [Green Version]
  26. Ahdi Rezaeieh, S.; Zamani, A.; Bialkowski, K.S.; Abbosh, A.M. Novel Microwave Torso Scanner for Thoracic Fluid Accumulation Diagnosis and Monitoring. Sci. Rep. 2017, 7, 304. [Google Scholar] [CrossRef] [PubMed]
  27. Gao, Y.J.; Liu, J.X.; Ye, Q.Y. Research on the detection of the brain tumor with the ultrawide-band microwave signal based on the high- precision symplectic finite-difference time-domain electromagnetic algorithm and beam forming imaging algorithm. Int. J. RF Microw. Comput. Aided Eng. 2020, 30, e22463. [Google Scholar] [CrossRef]
  28. Dachena, C.; Fedeli, A.; Fanti, A.; Lodi, M.B.; Pastorino, M.; Randazzo, A. Microwave Imaging for the Diagnosis of Cervical Diseases: A Feasibility Analysis. IEEE J. Electromagn. RF Microw. Med. Biol. 2021, 5, 277–285. [Google Scholar] [CrossRef]
  29. Dachena, C.; Fedeli, A.; Fanti, A.; Lodi, M.B.; Fumera, G.; Randazzo, A.; Pastorino, M. Microwave Imaging of the Neck by Means of Artificial Neural Networks for Tumor Detection. IEEE Open J. Antennas Propag. 2021, 2, 1044–1056. [Google Scholar] [CrossRef]
  30. Zada, G.; Kelly, D.F.; Cohan, P.; Wang, C.; Swerdloff, R. Endonasal transsphenoidal approach to treat pituitary adenomas and other sellar lesions: An assessment of efficacy, safety, and patient impressions of the surgery. J. Neurosurg. 2003, 98, 350–358. [Google Scholar] [CrossRef]
  31. Penn, D.L.; Burke, W.T.; Laws, E.R. Management of non-functioning pituitary adenomas: Surgery. Pituitary 2018, 21, 145–153. [Google Scholar]
  32. Pérez-López, C.; Álvarez-Escolá, C.; Isla Guerrero, A. Therapeutic approach to non-functioning pituitary adenomas. Med. Clínica 2021, 156, 284–289. [Google Scholar]
  33. Hasgall, P.A.; Neufeld, E.; Gosselin, M.; Klingenbock, A.; Kuster, N. IT’IS Database for Thermal and Electromagnetic Parameters of Biological Tissues. IT’IS Foundation. 2012. Available online: https://itis.swiss/virtual-population/tissue-properties/database (accessed on 4 February 2022).
  34. Gabriel, S.; Lau, R.; Gabriel, C. The dielectric properties of biological tissues: II. Measurements in the frequency range 10 Hz to 20 GHz. Phys. Med. Biol. 1996, 41, 2251–2269. [Google Scholar] [CrossRef] [Green Version]
  35. Gavazzi, S.; Limone, P.; De Rosa, G.; Molinari, F.; Vecchi, G. Comparison of microwave dielectric properties of human normal, benign and malignant thyroid tissues obtained from surgeries: A preliminary study. Biomed. Phys. Eng. Express 2018, 4, 47003. [Google Scholar] [CrossRef]
  36. Orphanidis, S. Electromagnetic Waves and Antennas. 2016, pp. 186–190. Available online: https://www.ece.rutgers.edu/~orfanidi/ewa (accessed on 15 January 2022).
  37. Massa, R.; Migliore, M.D.; Panariello, G.; Pinchera, D.; Schettino, F.; Caprio, E.; Griffo, R. Wide band permittivity measurements of palm (phoenix canariensis) and rhynchophorus ferrugineus (coleoptera curculionidae) for RF pest control. J. Microw. Power Electromagn. Energy 2014, 48, 158–169. [Google Scholar] [CrossRef]
  38. Fan, S.; Staebell, K.; Misra, D. Static analysis of an open-ended coaxial line terminated by layered media. IEEE Trans. Instrum. Meas. 1990, 39, 435–437. [Google Scholar] [CrossRef]
  39. Alanen, E.; Lahtinen, T.; Nuutinen, J. Variational formulation of open-ended coaxial line in contact with layered biological medium. IEEE Trans. Biomed. Eng. 1998, 45, 1241–1248. [Google Scholar] [CrossRef]
  40. Schneider, C.A.; Rasband, W.S.; Eliceiri, K.W. NIH Image to ImageJ: 25 years of image analysis. Nat. Methods 2012, 9, 671–675. [Google Scholar] [CrossRef]
  41. Pastorino, M. Stochastic optimization methods applied to microwave imaging: A review. IEEE Trans. Antennas Propag. 2007, 55, 538–548. [Google Scholar] [CrossRef]
  42. Pastorino, M.; Massa, A.; Caorsi, S. A microwave inverse scattering technique for image reconstruction based on a genetic algorithm. IEEE Trans. Instrum. Meas. 2000, 49, 573–578. [Google Scholar] [CrossRef]
  43. Guarin, G.; Hofmann, M.; Nehring, J.; Weigel, R.; Fischer, G.; Kissinger, D. Miniature microwave biosensors: Noninvasive applications. IEEE Microw. Mag. 2015, 16, 71–86. [Google Scholar] [CrossRef]
  44. La Gioia, A.; Santorelli, A.; O’Halloran, M.; Porter, E. Predicting the Sensing Radius of a Coaxial Probe Based on the Probe Dimensions. IEEE Trans. Antennas Propag. 2020, 68, 6704–6716. [Google Scholar] [CrossRef]
  45. Farshkaran, A.; Porter, E. Improved Sensing Volume Estimates for Coaxial Probes to Measure the Dielectric Properties of Inhomogeneous Tissues. IEEE J. Electromagn. RF Microw. Med. Biol. 2022, Early Access, 1–7. [Google Scholar] [CrossRef]
  46. Rodriguez-Duarte, D.O.; Vasquez, J.A.T.; Scapaticci, R.; Crocco, L.; Vipiana, F. Assessing a microwave imaging system for brain stroke monitoring via high fidelity numerical modelling. IEEE J. Electromagn. RF Microw. Med. Biol. 2021, 5, 238–245. [Google Scholar] [CrossRef]
  47. Fedeli, A.; Schenone, V.; Randazzo, A.; Pastorino, M.; Henriksson, T.; Semenov, S. Nonlinear S-Parameters Inversion for Stroke Imaging. IEEE Trans. Microw. Theory Tech. 2020, 69, 1760–1771. [Google Scholar] [CrossRef]
  48. MiMED. Available online: https://www.cost.eu/actions/TD1301 (accessed on 10 May 2022).
  49. EMERALD. Available online: https://cordis.europa.eu/project/id/764479 (accessed on 10 May 2022).
  50. WEBOING. Available online: https://cordis.europa.eu/project/id/793449 (accessed on 10 May 2022).
  51. MammoWave. Available online: https://cordis.europa.eu/project/id/830265 (accessed on 10 May 2022).
Figure 1. (a) Anatomical detailed 3D view of a sagittal section of a physiological human head, taken from Visible Body (https://www.visiblebody.com/, accessed on 15 January 2022). (b) Three-dimensional rendering of the trans-sphenoidal endoscopic surgical approach, typically used in clinical practice. Some biological structures were removed to increase visibility. (c) Zoom of the pituitary gland affected by a tumor.
Electronics 11 01608 g001
Figure 2. (a) Simplified mono-dimensional geometry for the propagation model considered for the proposed trans-sphenoidal microwave diagnostic approach. (b) Transmission line equivalent model for the solution of the forward problem.
Electronics 11 01608 g002
Figure 3. (a) Relative dielectric permittivity of the pituitary gland, bone and tumor tissues vs. frequency. (b) Electric conductivity (in S/m) of the pituitary gland, bone and tumor tissues vs. frequency. (c) Penetration depth (in mm) of the pituitary gland, bone and tumor tissues vs. frequency.
Electronics 11 01608 g003
Figure 4. Magnitude of the reflection coefficient ( Γ ) vs. frequency, for the case of a microadenoma.
Electronics 11 01608 g004
Figure 5. (a) Magnitude of the reflection coefficient ( Γ ) vs. frequency for the variation of the dielectric permittivity of the pituitary tumor with respect to its average value ( Δ ϵ / ϵ ). (b) Magnitude of the reflection coefficient ( Γ ) vs. frequency, for the variation of the electrical conductivity of the pituitary tumor with respect to its average value ( Δ σ / σ ).
Electronics 11 01608 g005
Figure 6. (a) Reconstructed dielectric permittivity profile for the case of a microadenoma. (b) Reconstructed electrical conductivity profile (in S/m) for the case of a microadenoma. (c) Reconstructed dielectric permittivity profile for the case of a macroadenoma. (d) Reconstructed electrical conductivity profile (in S/m) for the case of a macroadenoma. The dashed red line denotes the ground truth profile. The ground truth is provided as a dashed red line.
Electronics 11 01608 g006
Figure 7. (a) RMSE for the three unknown permittivity values for different sizes of the pituitary tumor layer. (b) RMSE for the three unknown electrical conductivity values, in S/m, for different sizes of the pituitary tumor layer. (c) RMSE for lengths, in cm, of the tissue layers as a function of the pituitary tumor size.
Electronics 11 01608 g007
Table 1. Cole–Cole parameters used for modeling the dielectric response of pituitary tumors.
ParameterValueUnit
ϵ 10.02a.u.
Δ ϵ 1 47.24a.u.
τ 1 11.60ps
α 1 0.014a.u.
Δ ϵ 2 1.48a.u.
τ 2 667.57ps
α 2 0.95a.u.
σ D C 0.60S/m
Table 2. Lengths of the air and biological tissues for the multi-layer model.
ParameterValue (cm)
l b , 1 0.42
l a 1.34
l b , 2 0.52
l t 1
Publisher’s Note: MDPI stays neutral with regard to jurisdictional claims in published maps and institutional affiliations.

