Author Contributions
Conceptualization, S.P.-A. and S.O.; Methodology, S.O.; Validation, S.P.-A., S.O. and S.P.; Formal Analysis, S.P.-A., S.O. and L.M.; Investigation, S.P.-A. and S.O.; Resources, S.O. and R.L.K.; Data Curation, S.P.-A.; Writing—Original Draft Preparation, S.P.-A., S.O. and L.M.; Writing—Review & Editing, S.P.-A., S.O., S.P., L.M. and R.L.K.; Visualization, S.P.-A. and L.M.; Supervision, S.O. and R.L.K.; Project Administration, S.O. and R.L.K.; Funding Acquisition, S.P.-A. and R.L.K. All authors have read and agreed to the published version of the manuscript.
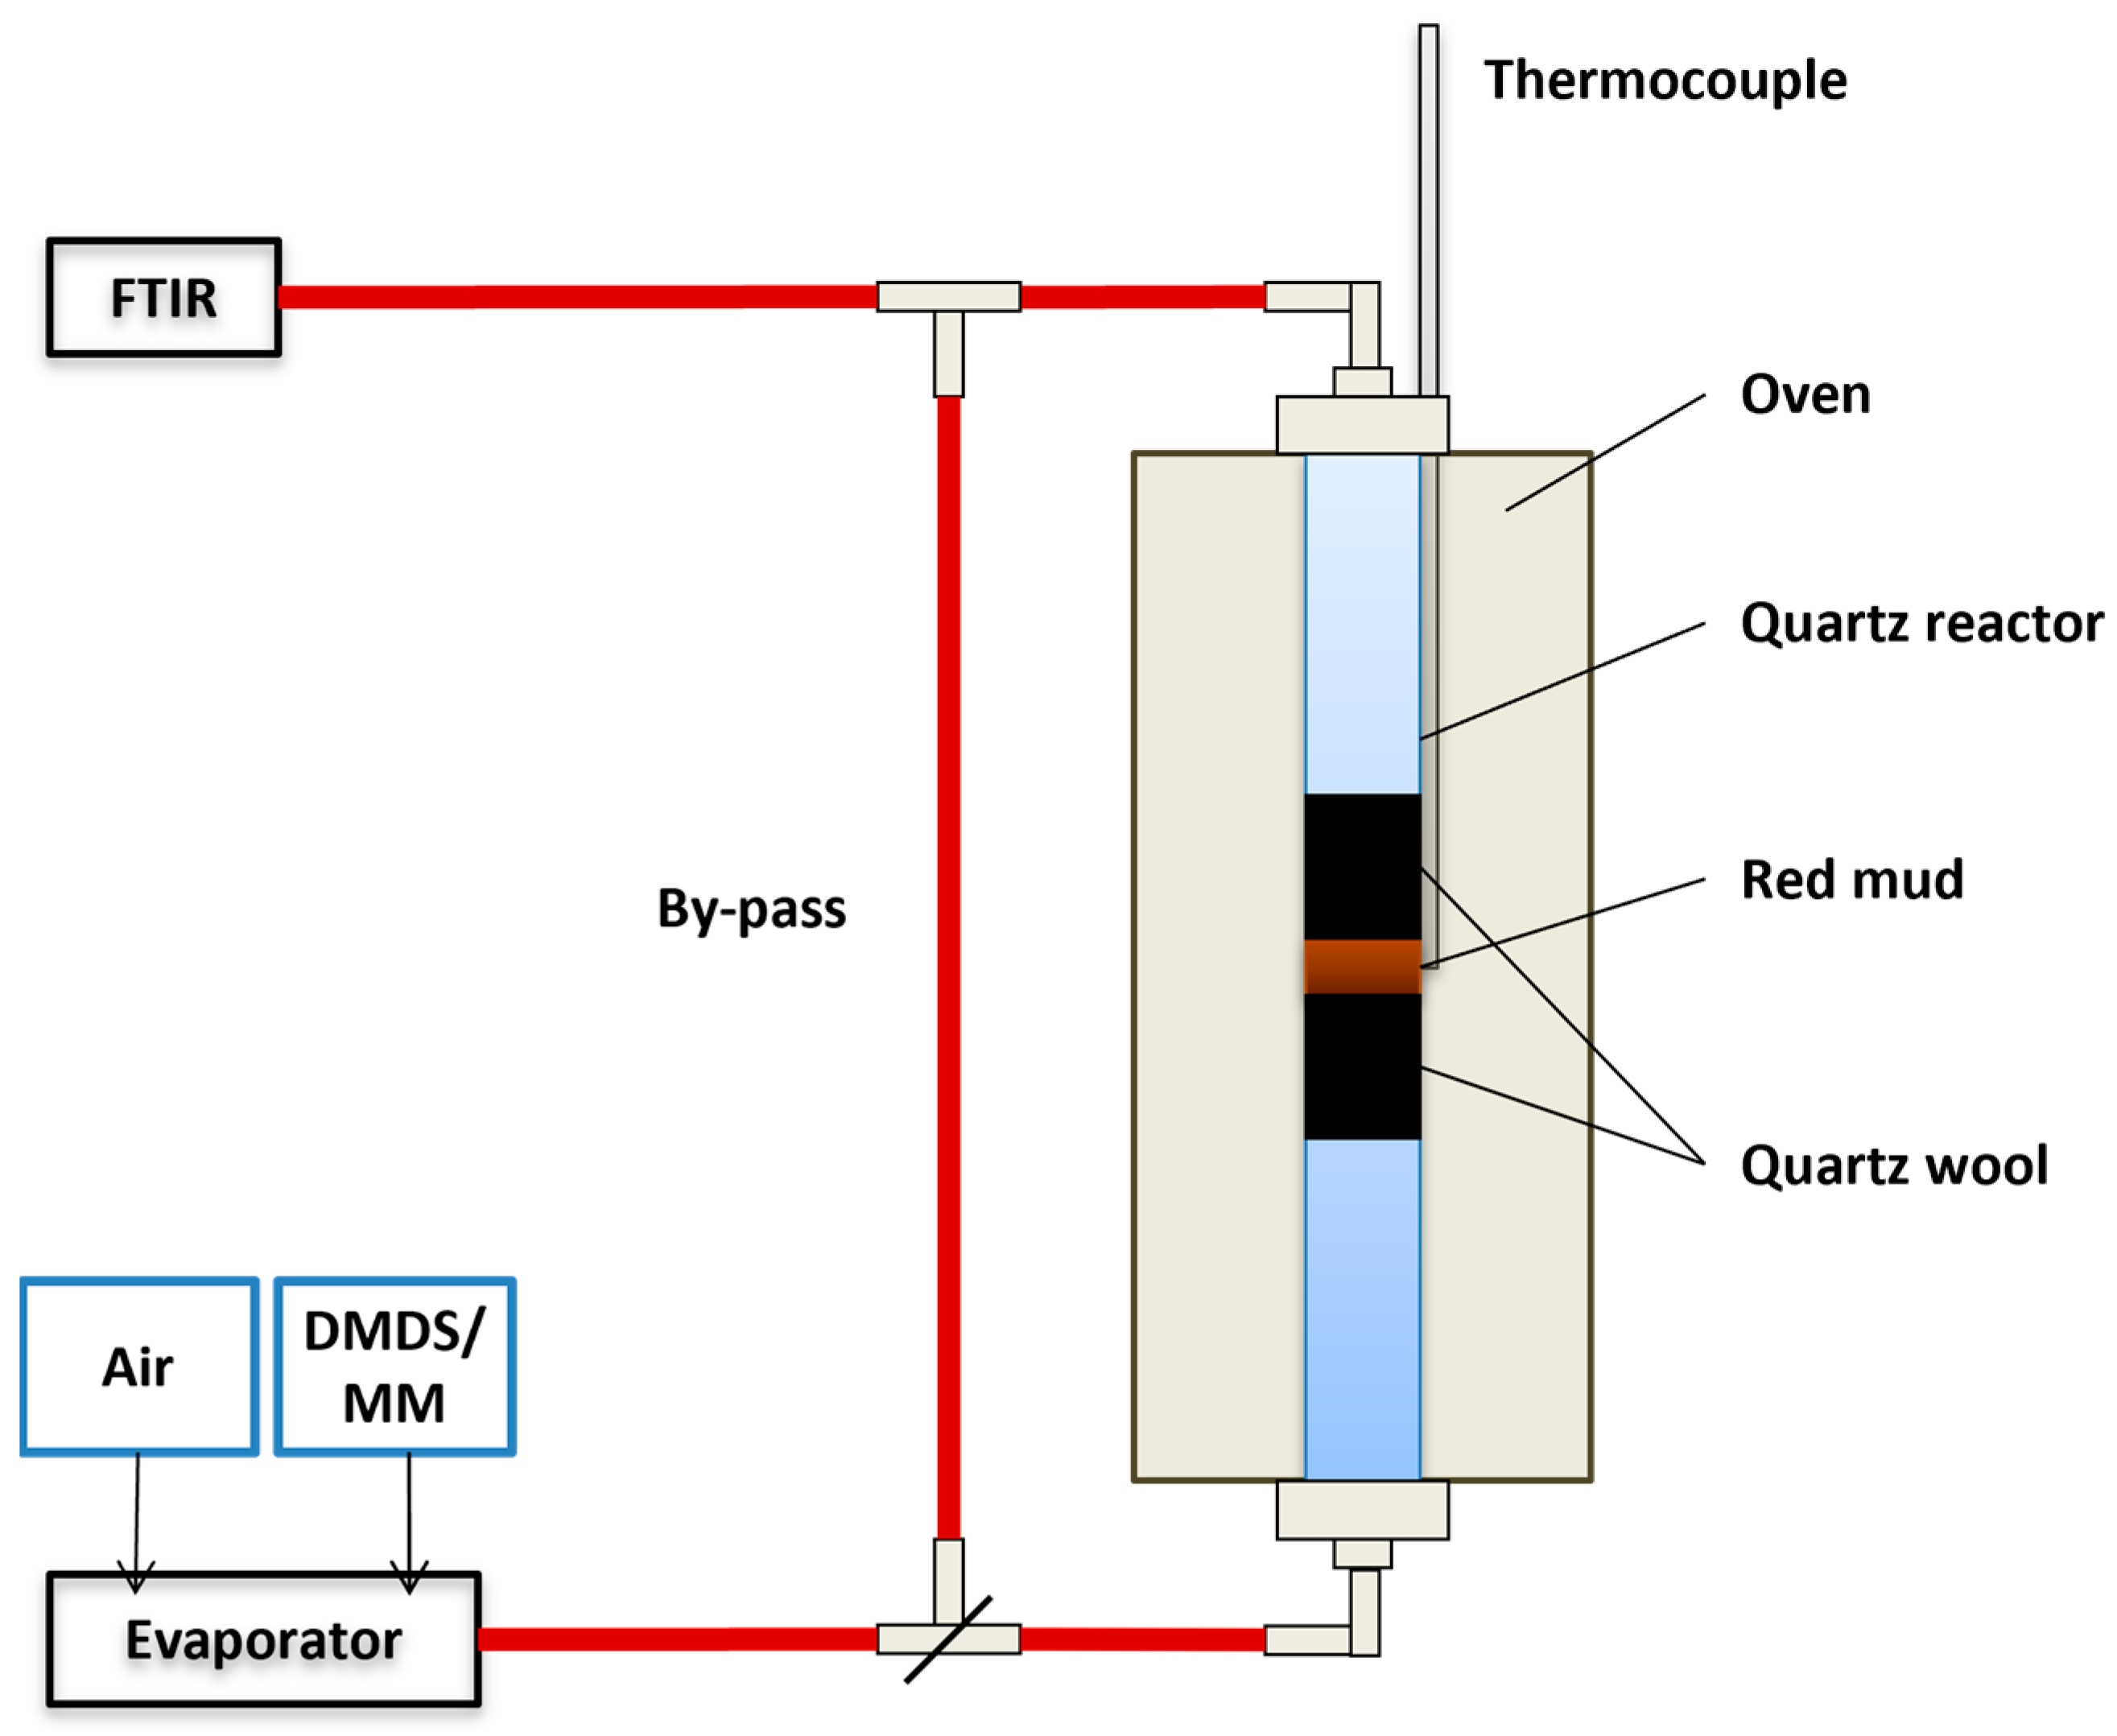
Figure 1.
Illustration of the experimental set-up used in the activity tests (DMDS: dimethyl disulfide, MM: methyl mercaptan).
Figure 1.
Illustration of the experimental set-up used in the activity tests (DMDS: dimethyl disulfide, MM: methyl mercaptan).
Figure 2.
Nitrogen adsorption-desorption isotherms of (a) WRM (washed RM, solid black line) and CRM (calcined RM, grey dashed line) and (b) ARM (HCl-activated RM, solid grey line) and PARM (HCl + H3PO4 -activated RM, black dashed line).
Figure 2.
Nitrogen adsorption-desorption isotherms of (a) WRM (washed RM, solid black line) and CRM (calcined RM, grey dashed line) and (b) ARM (HCl-activated RM, solid grey line) and PARM (HCl + H3PO4 -activated RM, black dashed line).
Figure 3.
Pore-size distributions of (a) WRM (washed RM, solid black line) and CRM (calcined RM, grey dashed line) and (b) ARM (HCl-activated RM, solid grey line) and PARM (HCl + H3PO4 -activated RM, black dashed line).
Figure 3.
Pore-size distributions of (a) WRM (washed RM, solid black line) and CRM (calcined RM, grey dashed line) and (b) ARM (HCl-activated RM, solid grey line) and PARM (HCl + H3PO4 -activated RM, black dashed line).
Figure 4.
Molecules of dimethyl disulfide, DMDS (left), and methyl mercaptan, MM (right) and their evaluated dimensions.
Figure 4.
Molecules of dimethyl disulfide, DMDS (left), and methyl mercaptan, MM (right) and their evaluated dimensions.
Figure 5.
FE-SEM images showing the particle morphology of WRM (washed RM), CRM (calcined RM), ARM (HCl-activated RM), and PARM (HCl + H3PO4 -activated RM).
Figure 5.
FE-SEM images showing the particle morphology of WRM (washed RM), CRM (calcined RM), ARM (HCl-activated RM), and PARM (HCl + H3PO4 -activated RM).
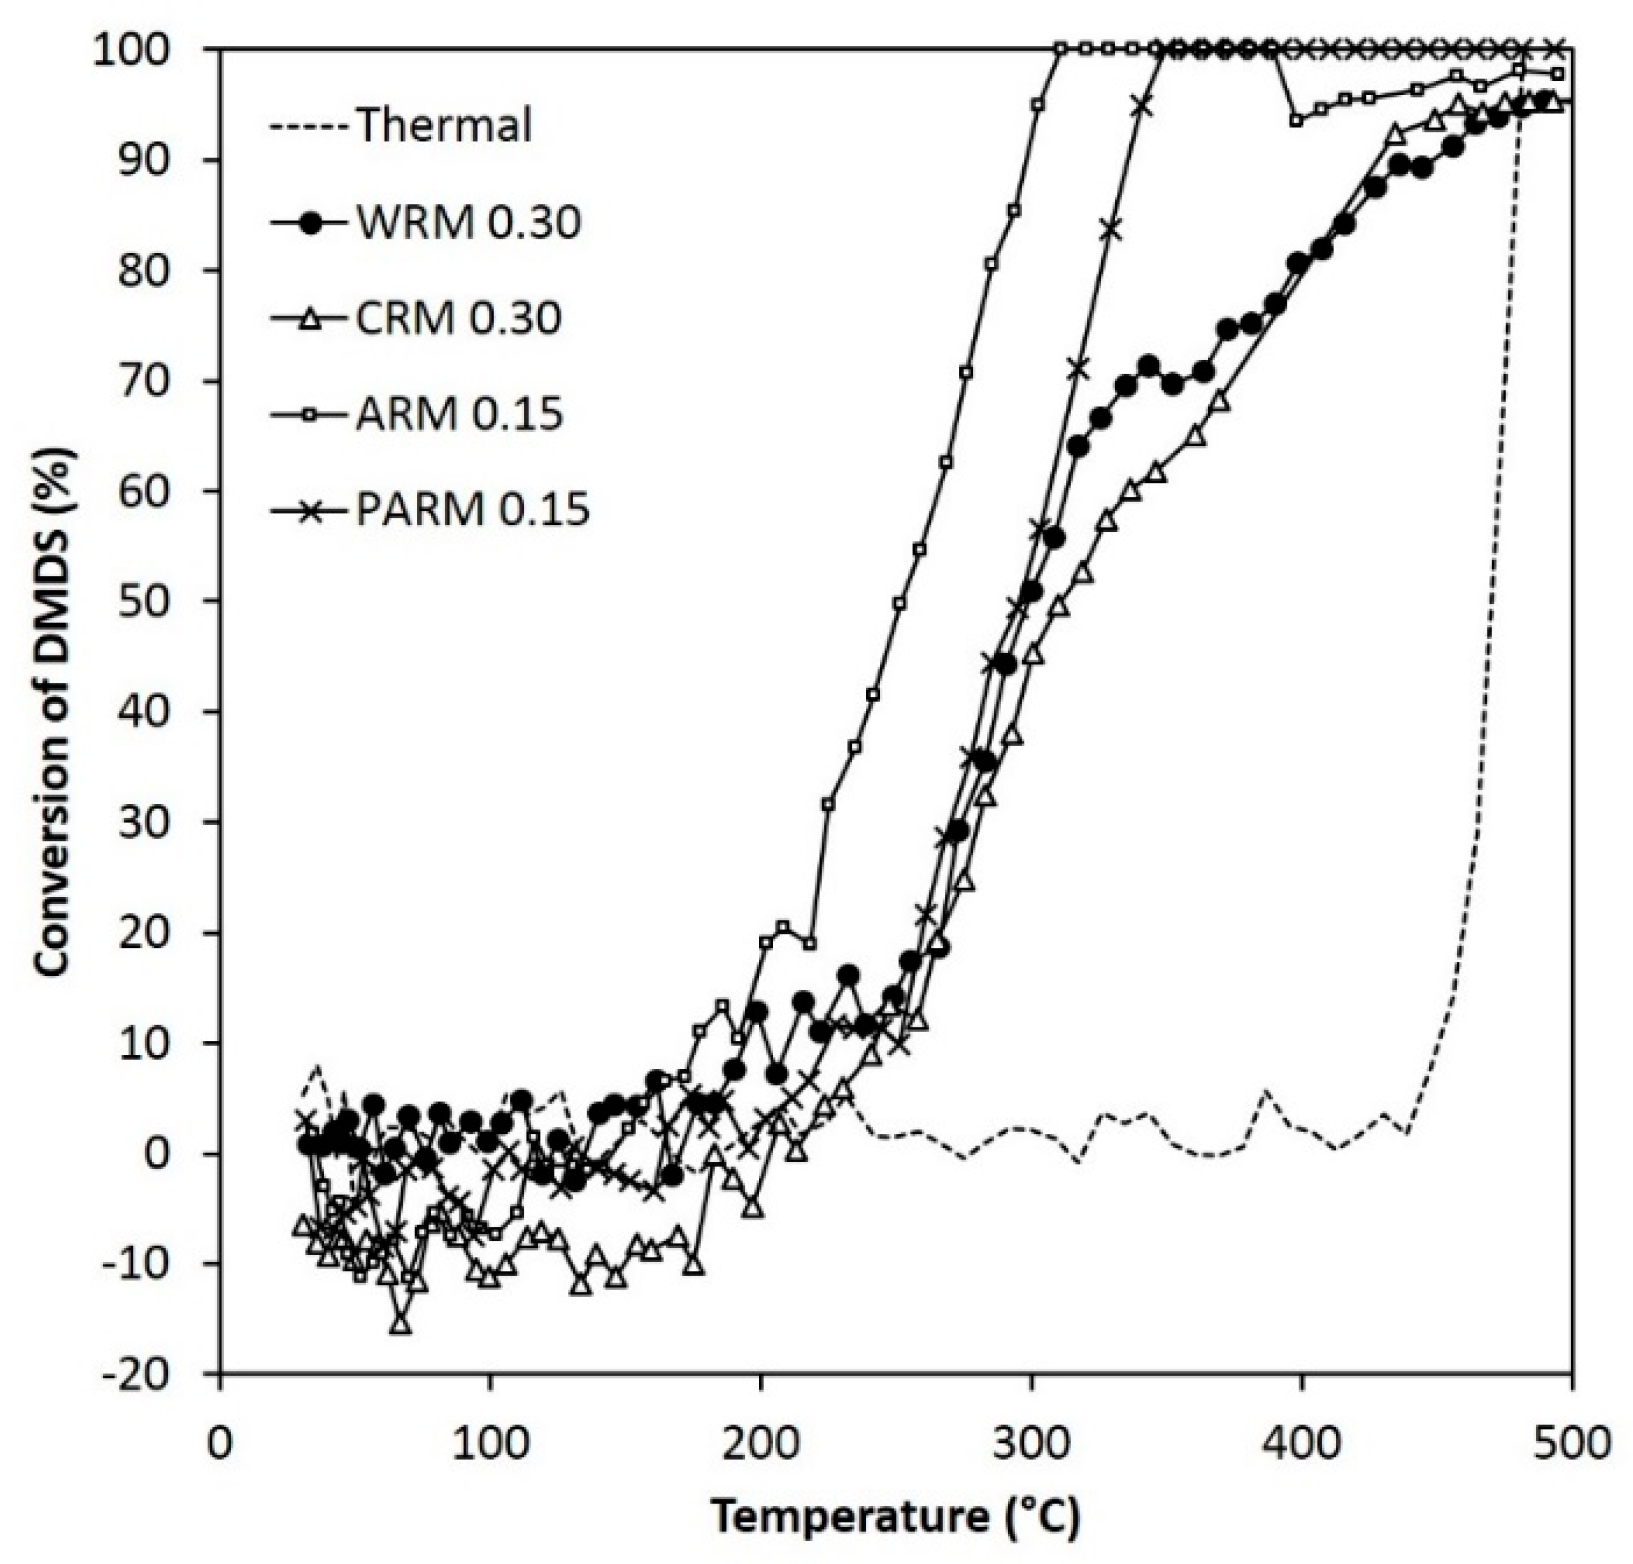
Figure 6.
The activity of WRM, CRM, ARM, and PARM in the DMDS abatement (DMDS 55 ppm, amounts of WRM and CRM 0.30 g, amounts of ARM and PARM 0.15 g) (WRM: washed RM, CRM: calcined RM, ARM: HCl-activated RM, PARM: HCl + H3PO4 -activated RM).
Figure 6.
The activity of WRM, CRM, ARM, and PARM in the DMDS abatement (DMDS 55 ppm, amounts of WRM and CRM 0.30 g, amounts of ARM and PARM 0.15 g) (WRM: washed RM, CRM: calcined RM, ARM: HCl-activated RM, PARM: HCl + H3PO4 -activated RM).
Figure 7.
Conversion of DMDS when using different amounts of ARM (HCl-activated RM, 0.30 g or 0.15 g) and different concentrations of DMDS (55 ppm or 110 ppm).
Figure 7.
Conversion of DMDS when using different amounts of ARM (HCl-activated RM, 0.30 g or 0.15 g) and different concentrations of DMDS (55 ppm or 110 ppm).
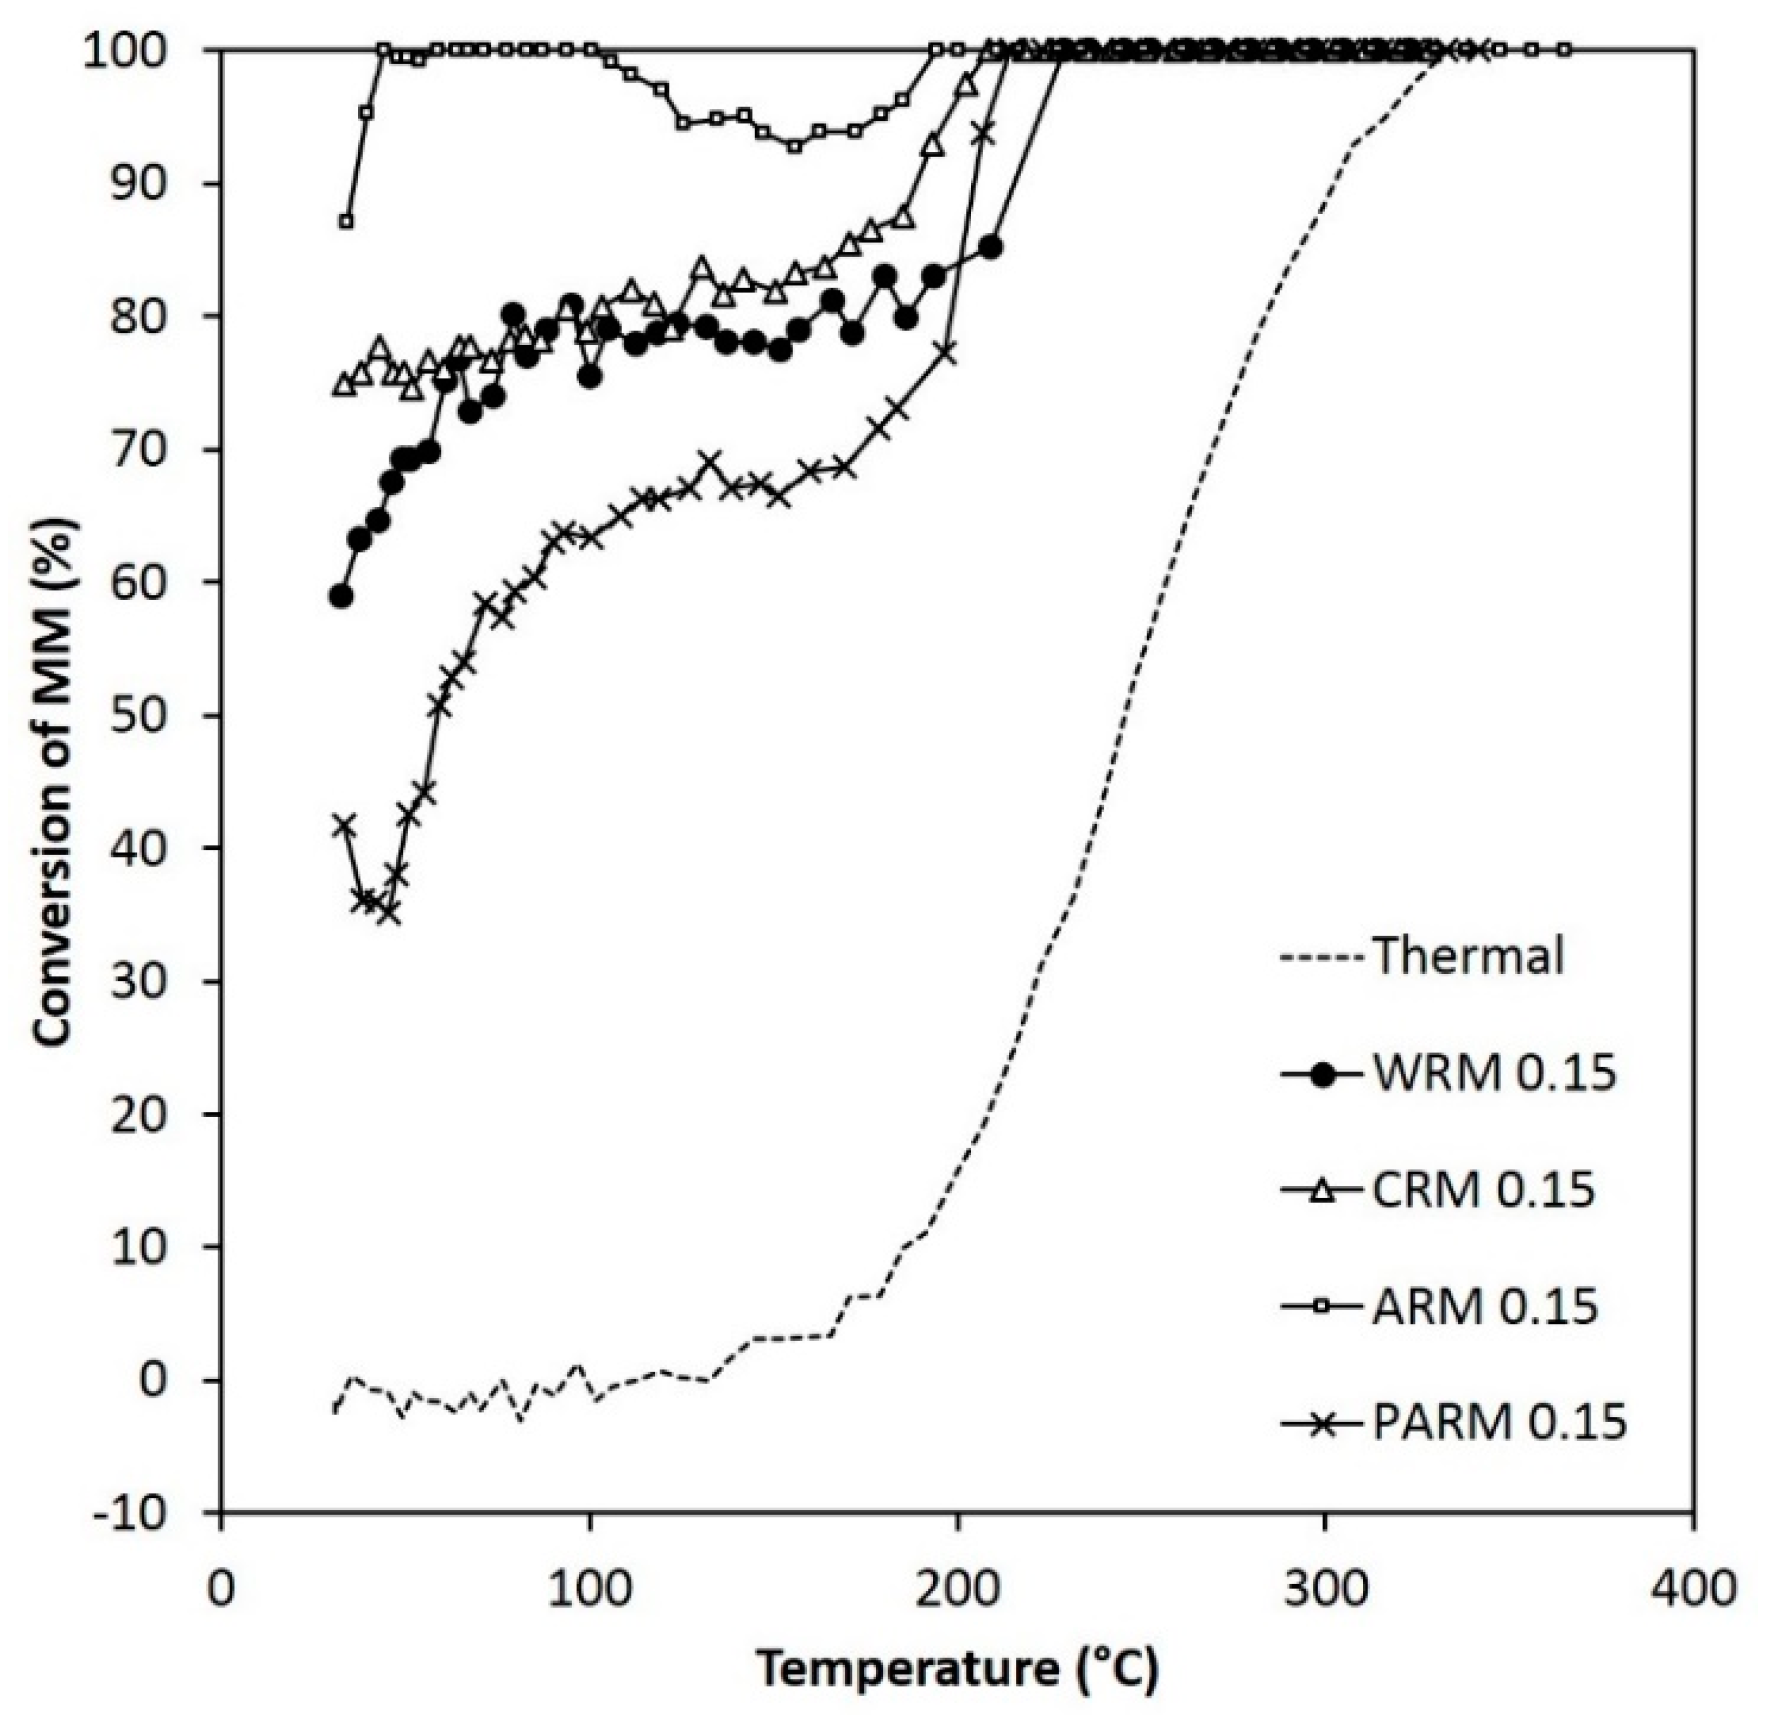
Figure 8.
The activity of WRM, CRM, ARM, and PARM in the MM abatement (MM 120 ppm) (WRM: washed RM, CRM: calcined RM, ARM: HCl-activated RM, PARM: HCl + H3PO4 -activated RM).
Figure 8.
The activity of WRM, CRM, ARM, and PARM in the MM abatement (MM 120 ppm) (WRM: washed RM, CRM: calcined RM, ARM: HCl-activated RM, PARM: HCl + H3PO4 -activated RM).
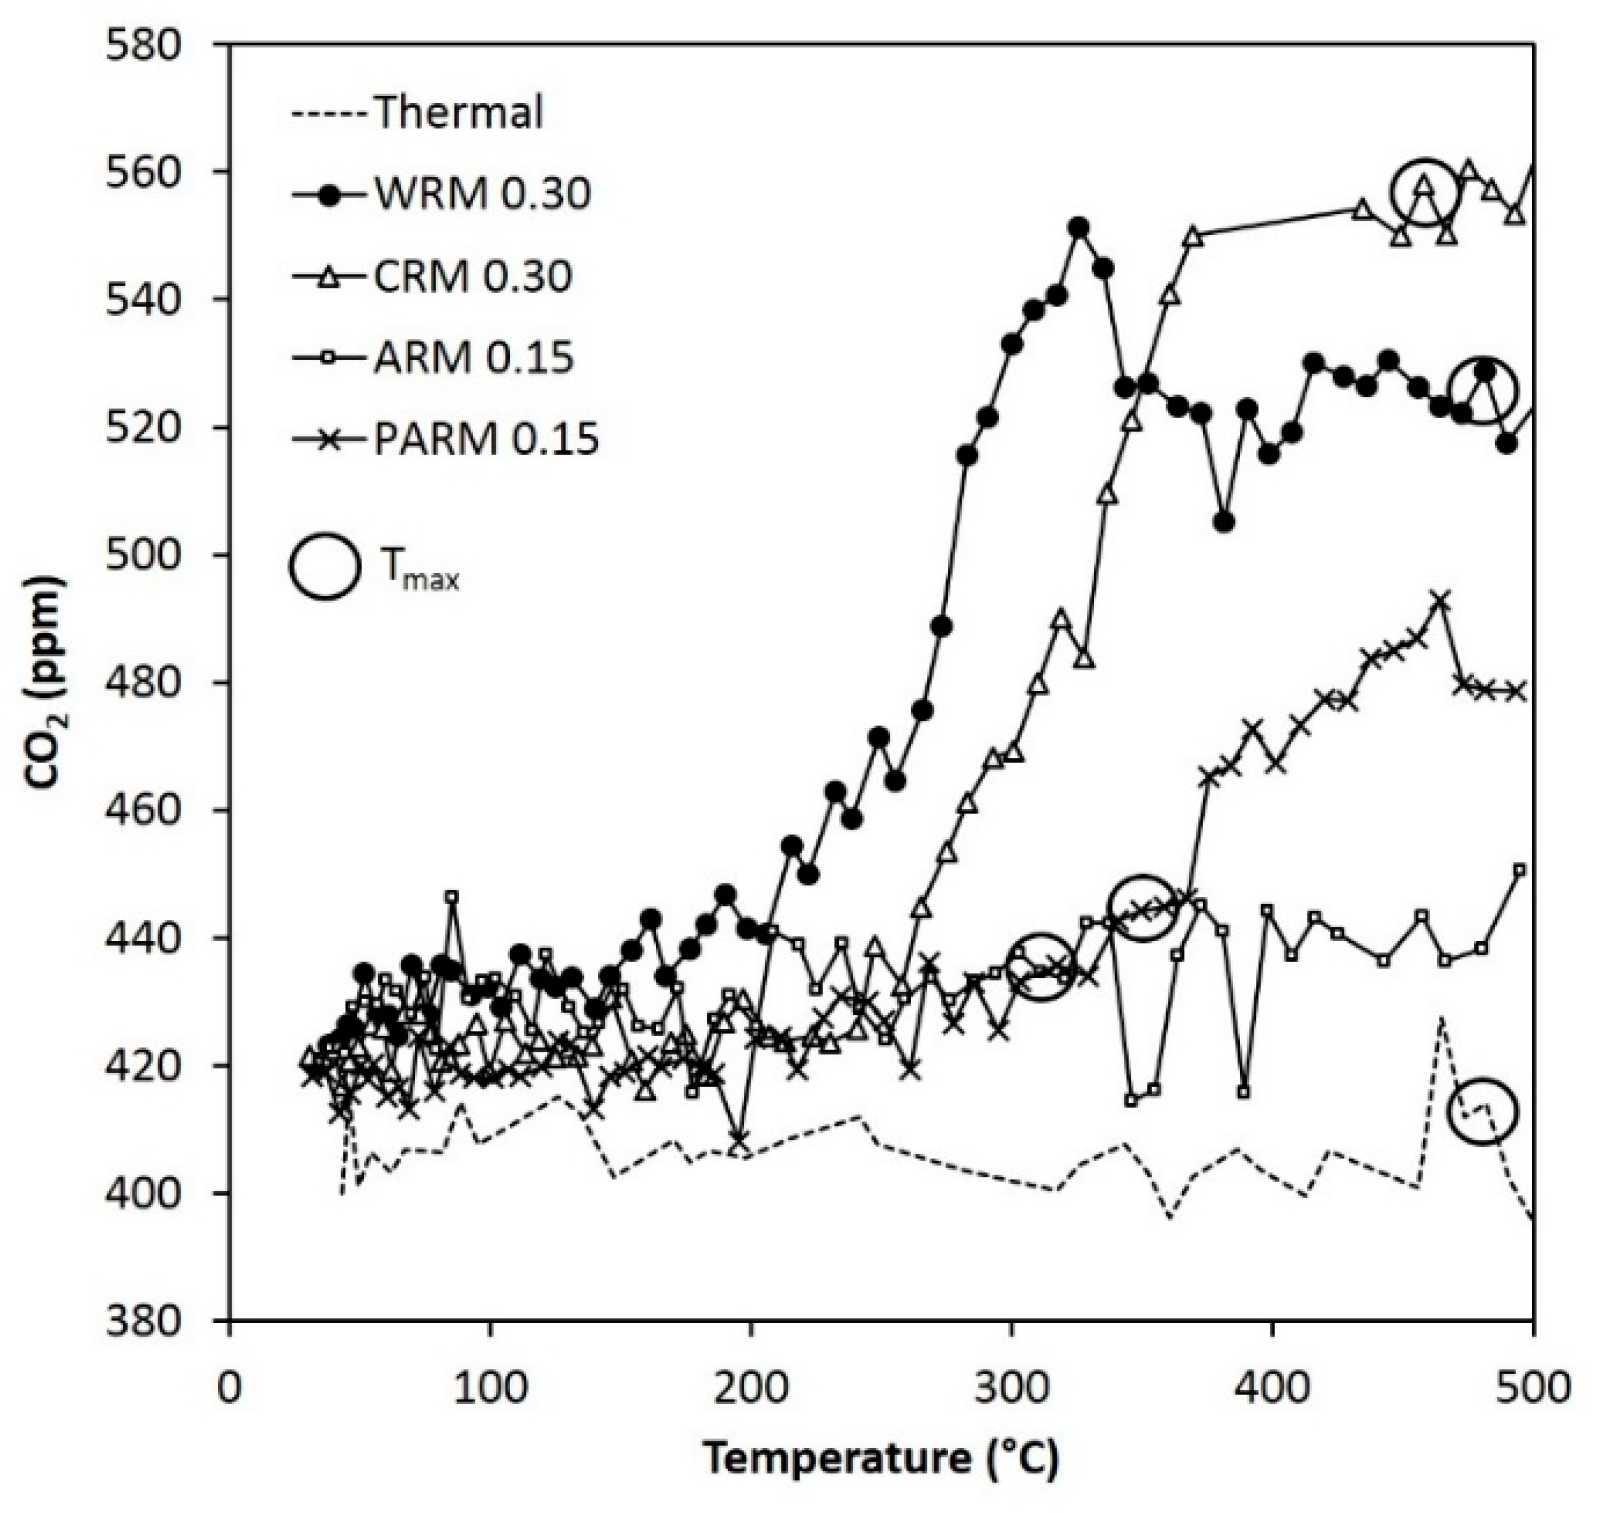
Figure 9.
The concentration of CO
2 during the DMDS experiments (the same conditions as in
Figure 6). T
max points are marked with circles (WRM: washed RM, CRM: calcined RM, ARM: HCl-activated RM, PARM: HCl + H
3PO
4 -activated RM).
Figure 9.
The concentration of CO
2 during the DMDS experiments (the same conditions as in
Figure 6). T
max points are marked with circles (WRM: washed RM, CRM: calcined RM, ARM: HCl-activated RM, PARM: HCl + H
3PO
4 -activated RM).
Figure 10.
The yield of SO
2 during the DMDS experiments (the same conditions as in
Figure 6). T
max points are marked with circles (WRM: washed RM, CRM: calcined RM, ARM: HCl-activated RM, PARM: HCl + H
3PO
4 -activated RM).
Figure 10.
The yield of SO
2 during the DMDS experiments (the same conditions as in
Figure 6). T
max points are marked with circles (WRM: washed RM, CRM: calcined RM, ARM: HCl-activated RM, PARM: HCl + H
3PO
4 -activated RM).
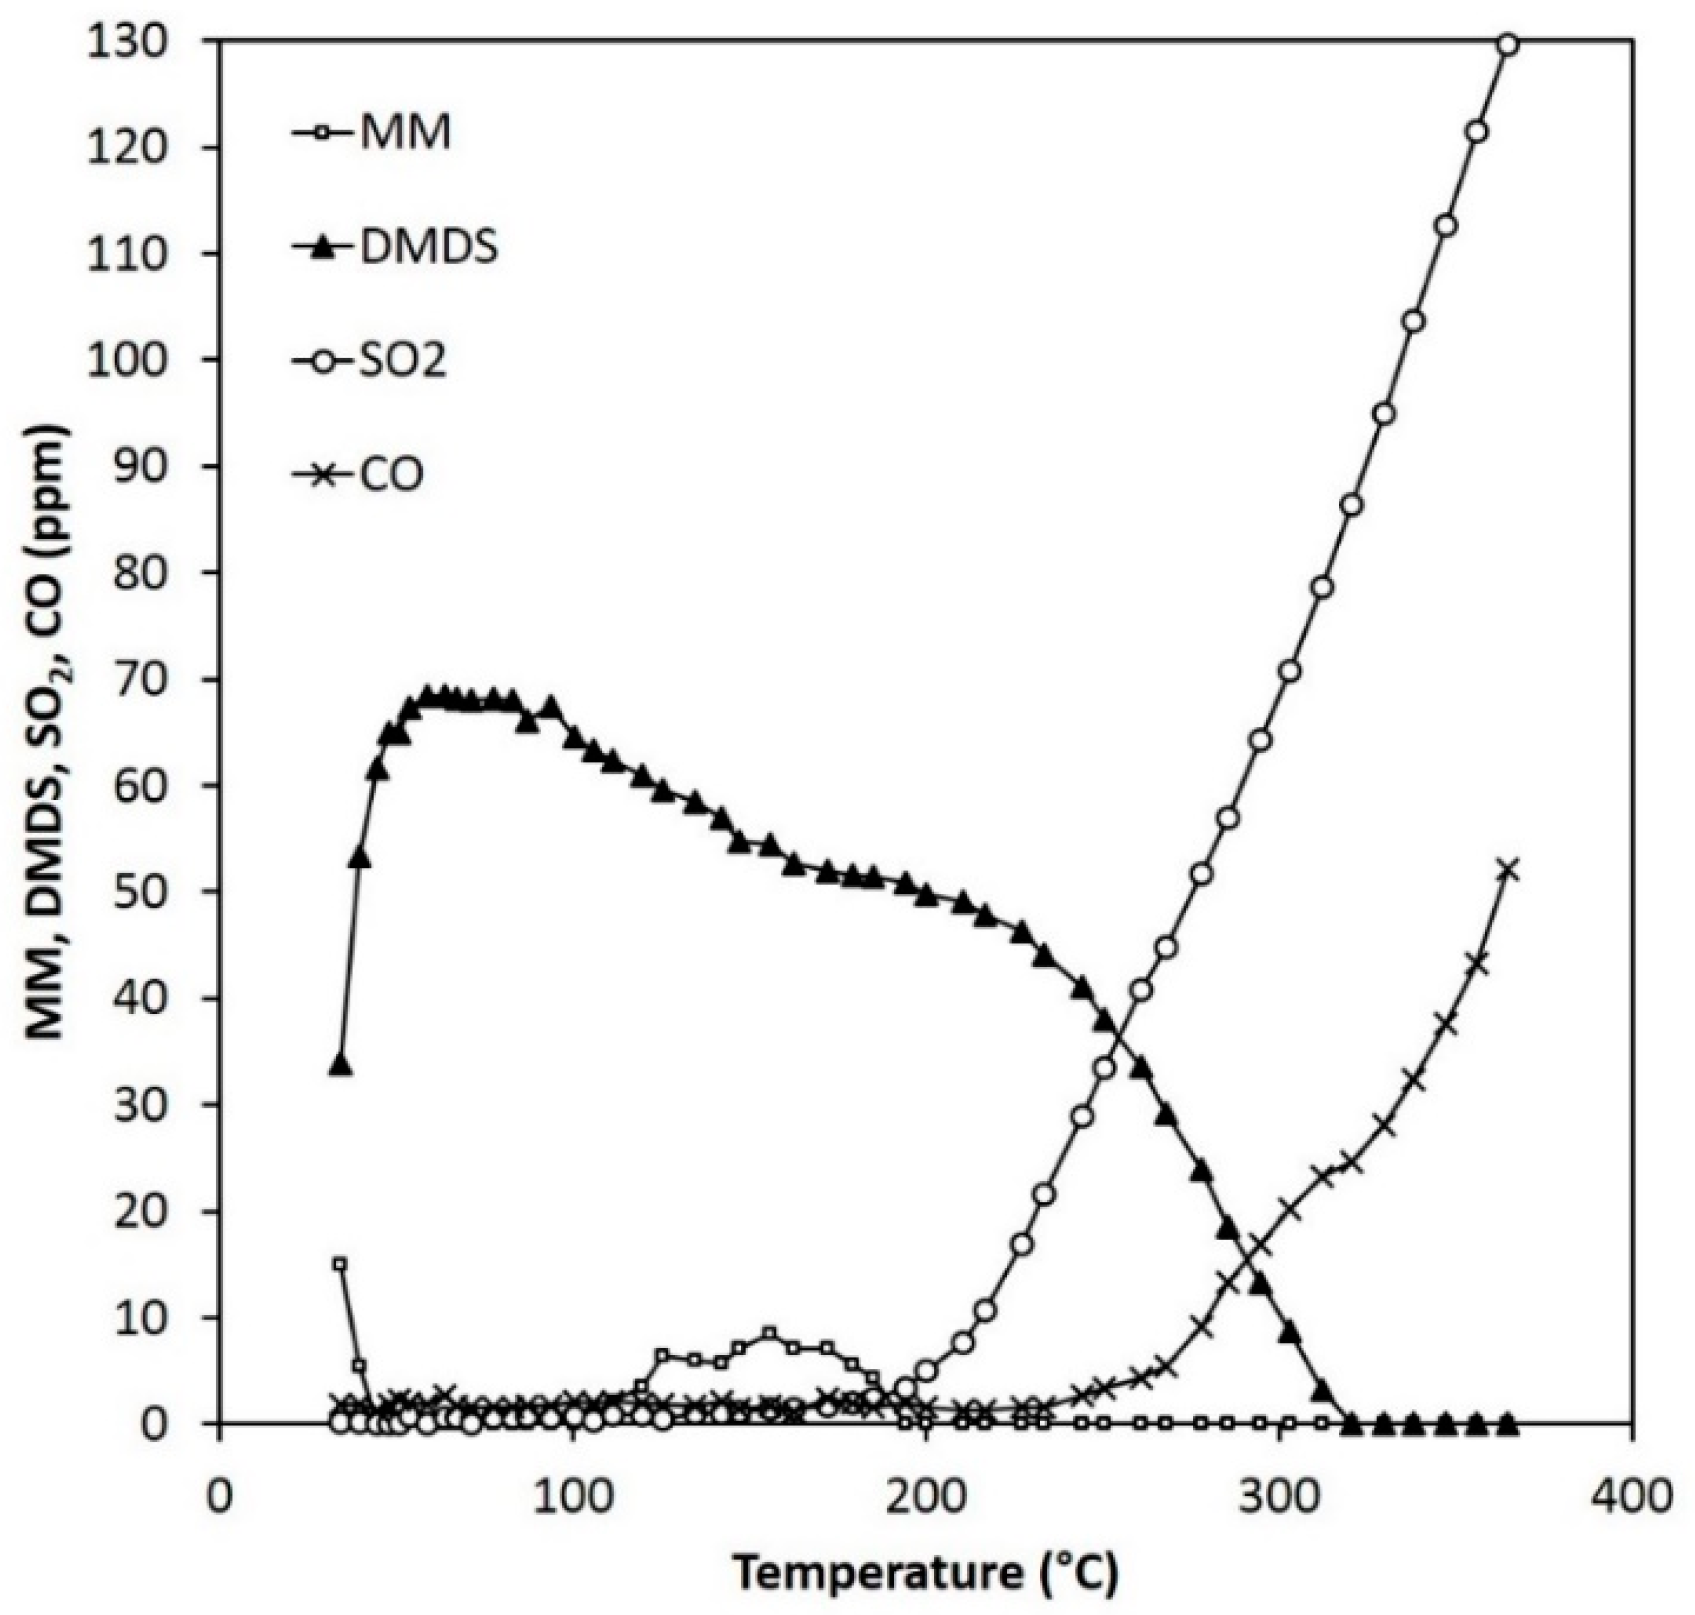
Figure 11.
Reactant and product concentrations during the MM experiments (120 ppm) over 0.15 g of ARM (HCl-activated RM).
Figure 11.
Reactant and product concentrations during the MM experiments (120 ppm) over 0.15 g of ARM (HCl-activated RM).
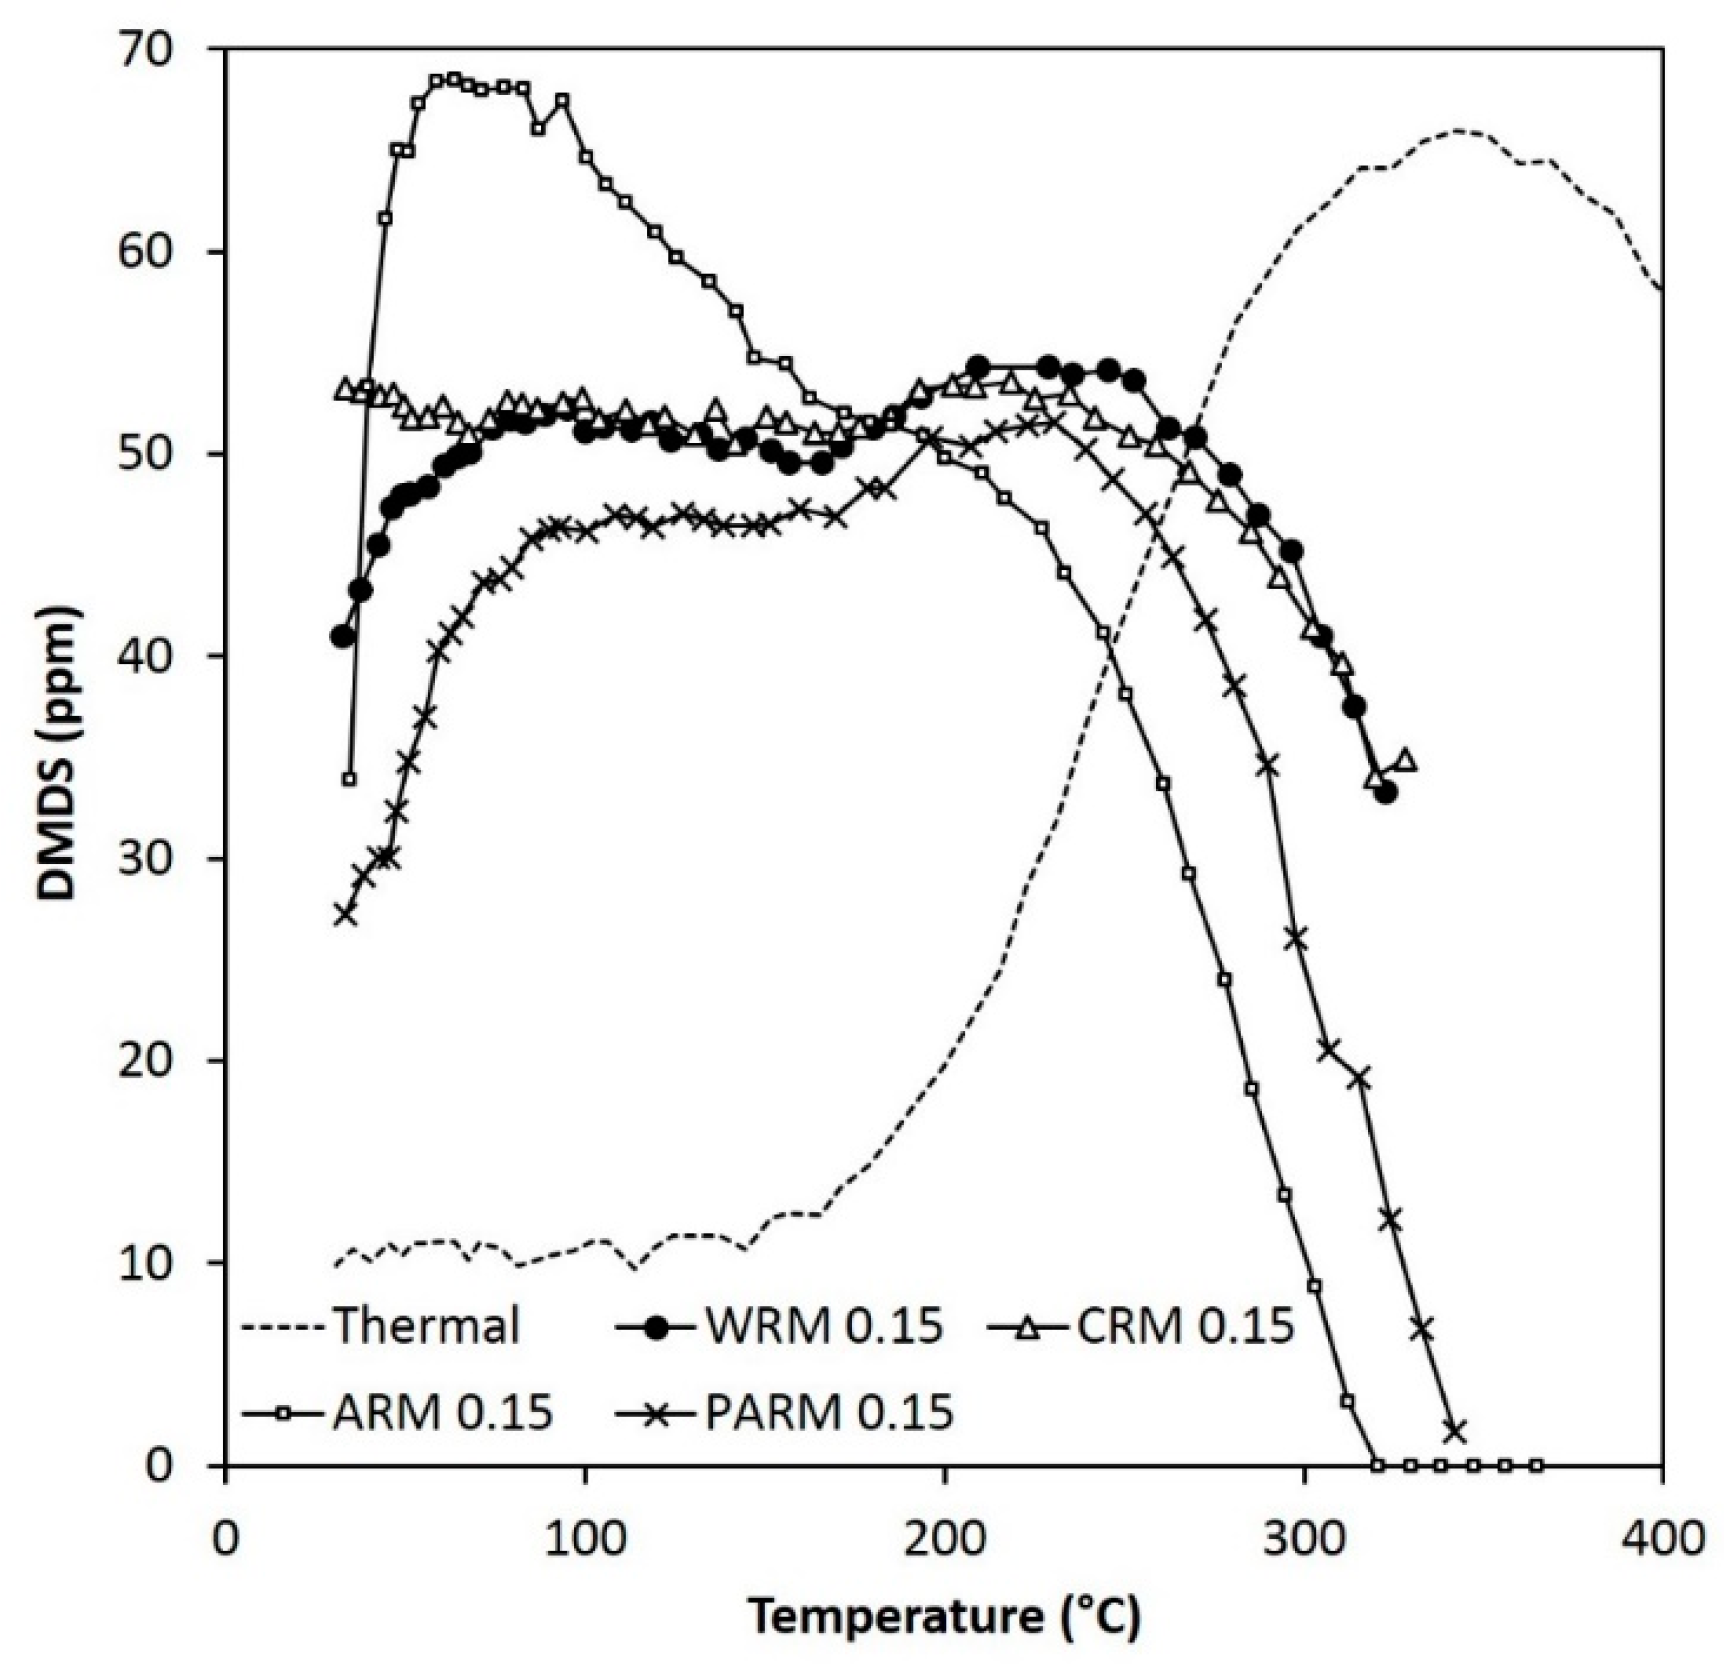
Figure 12.
The concentration of DMDS during the MM experiments (MM feed 120 ppm) (WRM: washed RM, CRM: calcined RM, ARM: HCl-activated RM, PARM: HCl + H3PO4 -activated RM).
Figure 12.
The concentration of DMDS during the MM experiments (MM feed 120 ppm) (WRM: washed RM, CRM: calcined RM, ARM: HCl-activated RM, PARM: HCl + H3PO4 -activated RM).
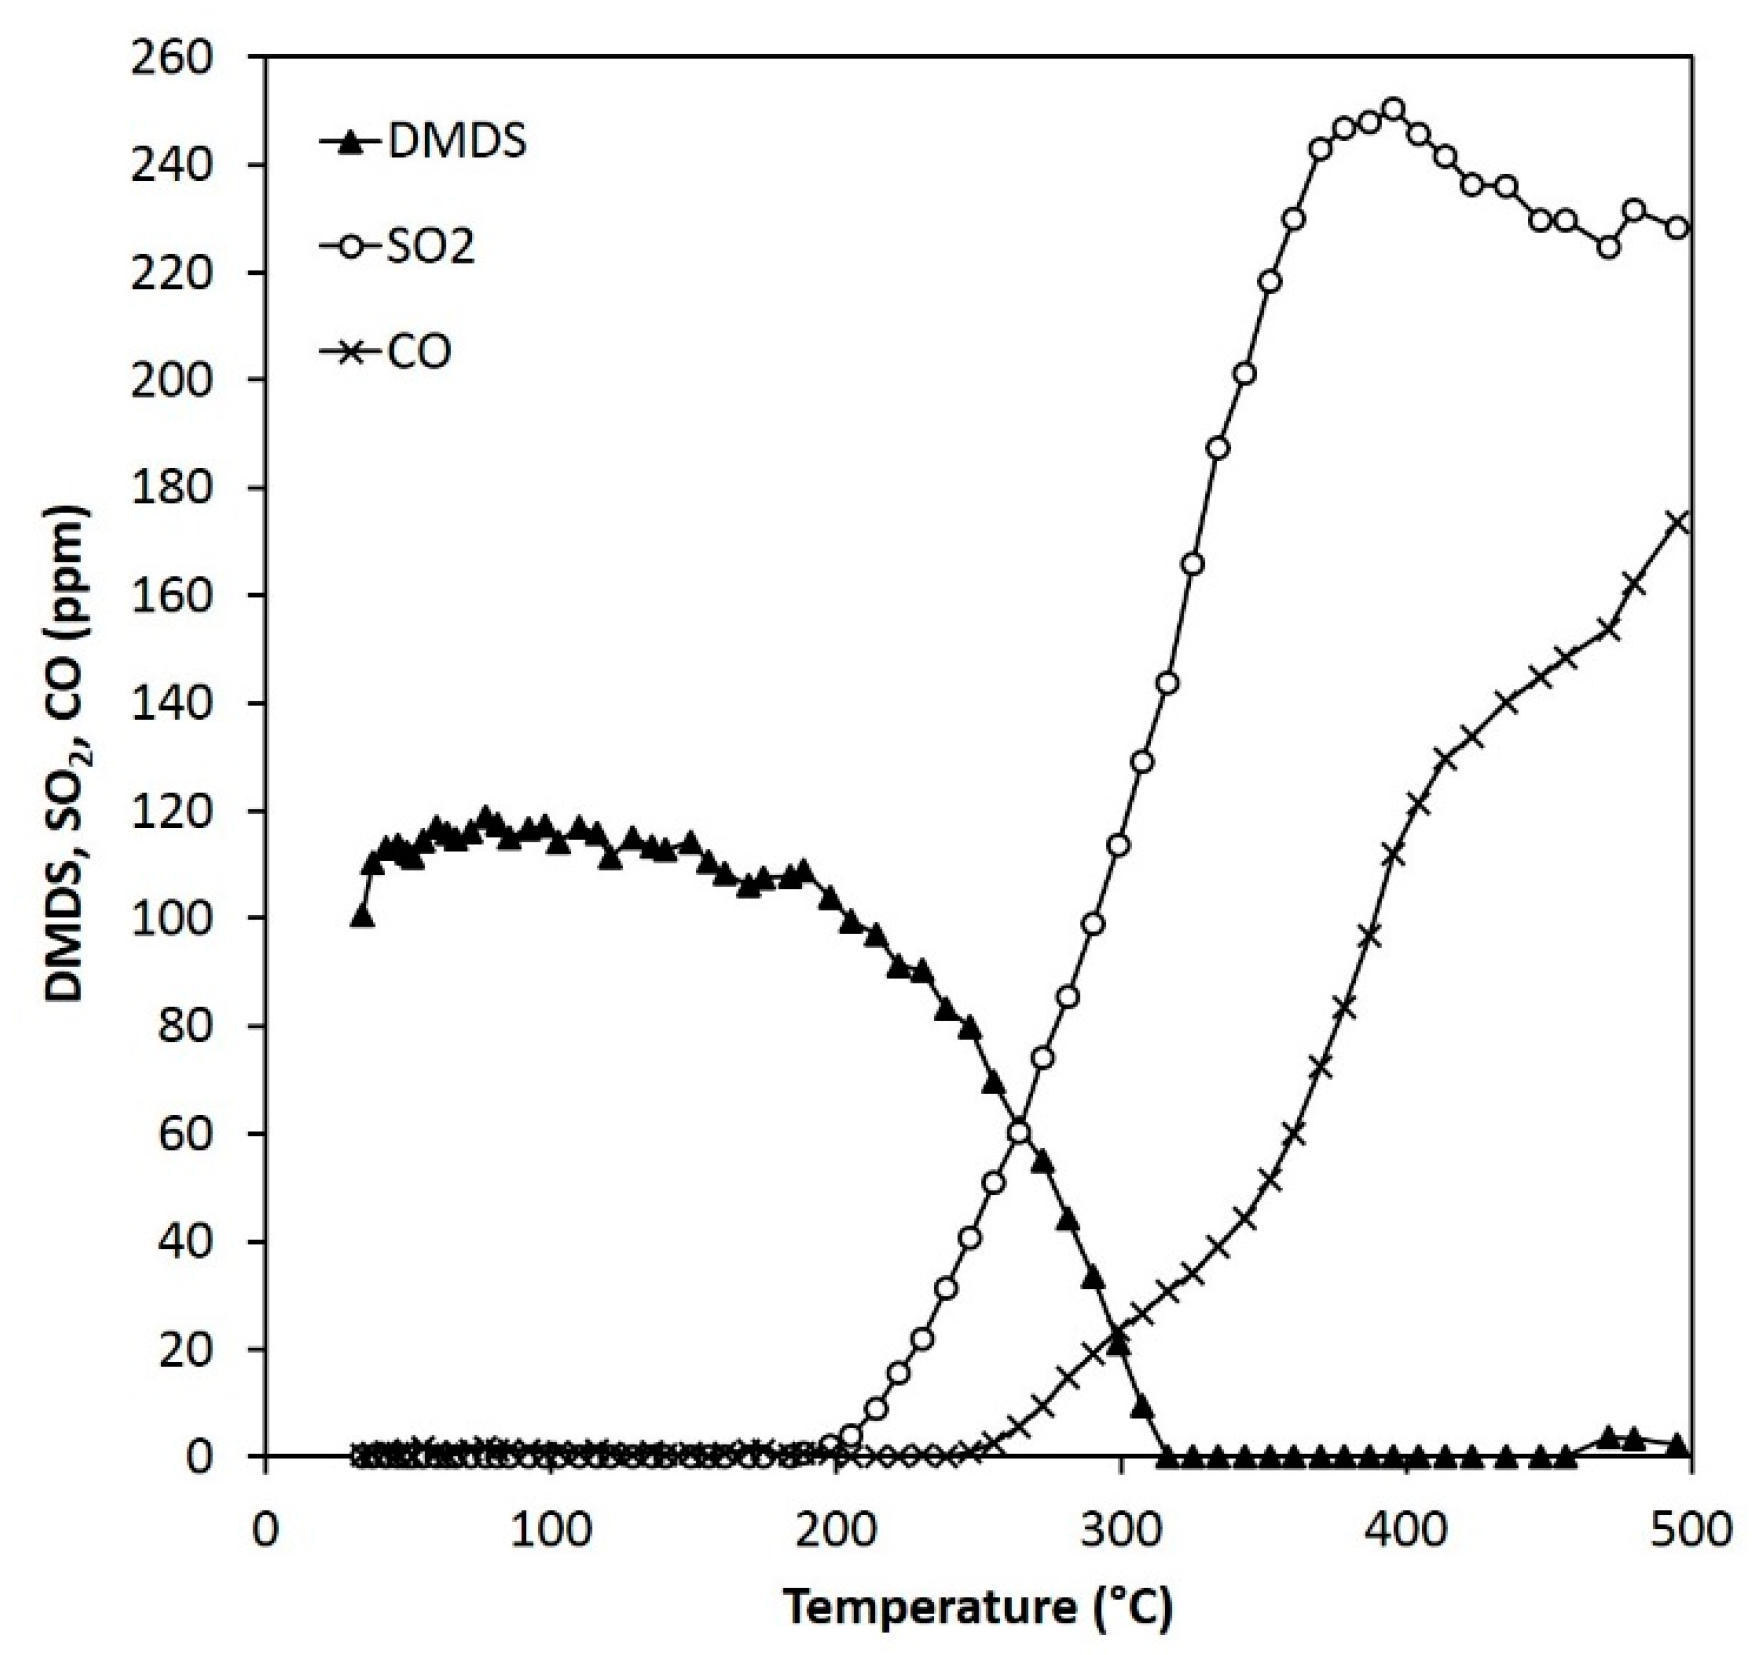
Figure 13.
Reactant and product concentrations during the DMDS experiments (110 ppm) over 0.15 g of ARM (HCl-activated RM).
Figure 13.
Reactant and product concentrations during the DMDS experiments (110 ppm) over 0.15 g of ARM (HCl-activated RM).
Figure 14.
The DRIFT spectra of the fresh RM samples (WRM: washed RM, CRM: calcined RM, ARM: HCl-activated RM, PARM: HCl + H3PO4 -activated RM).
Figure 14.
The DRIFT spectra of the fresh RM samples (WRM: washed RM, CRM: calcined RM, ARM: HCl-activated RM, PARM: HCl + H3PO4 -activated RM).
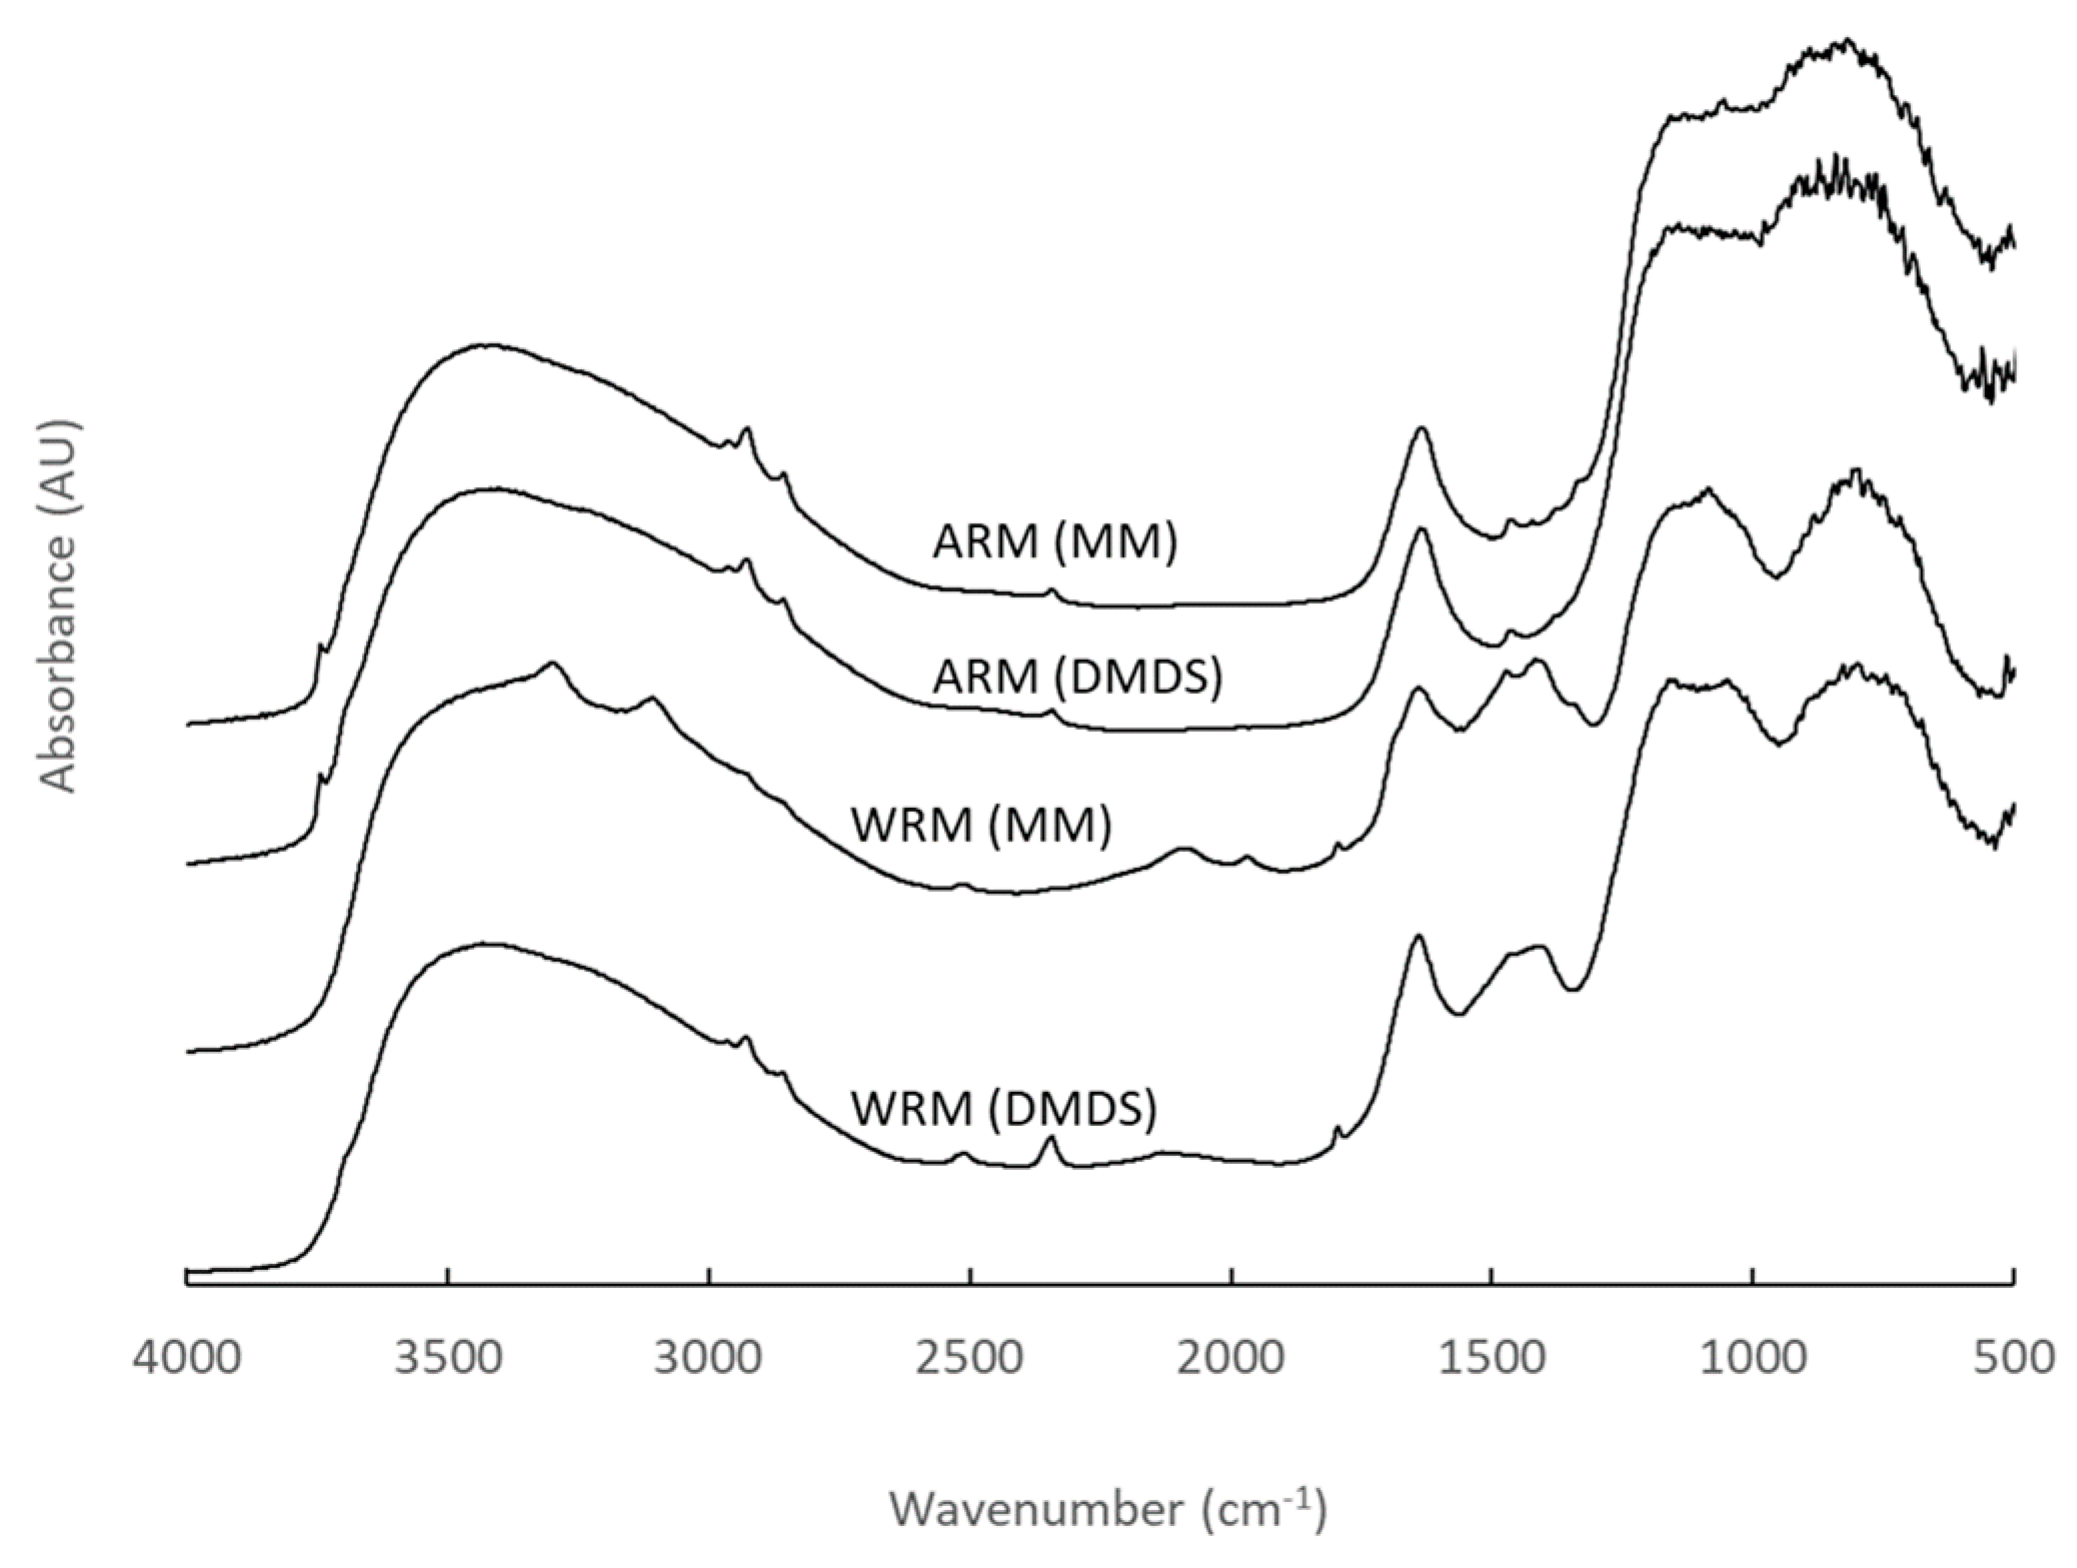
Figure 15.
The DRIFT spectra of the used WRM (washed RM) and ARM (HCl-activated RM) samples after DMDS and MM experiments.
Figure 15.
The DRIFT spectra of the used WRM (washed RM) and ARM (HCl-activated RM) samples after DMDS and MM experiments.
Table 1.
Summary of the pretreatment and activation of red mud (RM).
Table 1.
Summary of the pretreatment and activation of red mud (RM).
| | | | | Pretreatment | | |
|---|
| | | Filtration, Washing, Drying | Acid Treatment HCl | Acid Treatment HCl + H3PO4 | Calcination | Crushing |
|---|
| WRM | Washed RM | x | | | | x |
| CRM | Calcined RM | x | | | x | x |
| ARM | HCl-activated RM | x | x | | x | x |
| PARM | HCl + H3PO4 -activated RM | x | | x | x | x |
Table 2.
Amounts of RM, the feed concentrations, and weight hourly space velocities (WHSV) in the DMDS experiments (WRM: washed RM, CRM: calcined RM, ARM: HCl-activated RM, PARM: HCl + H3PO4 -activated RM).
Table 2.
Amounts of RM, the feed concentrations, and weight hourly space velocities (WHSV) in the DMDS experiments (WRM: washed RM, CRM: calcined RM, ARM: HCl-activated RM, PARM: HCl + H3PO4 -activated RM).
| Experiment | Amount of RM | DMDS Feed | WHSV |
|---|
| | (g) | (ppm) | (L h−1 g−1) |
|---|
| Thermal | - | 55 | - |
| Thermal 110 | - | 110 | - |
| WRM 0.30 | 0.30 | 55 | 200 |
| CRM 0.30 | 0.30 | 55 | 200 |
| ARM 0.30 | 0.30 | 55 | 200 |
| ARM 0.15 | 0.15 | 55 | 400 |
| ARM 0.15 DMDS 110 | 0.15 | 110 | 400 |
| PARM 0.15 | 0.15 | 55 | 400 |
Table 3.
Elemental composition (wt-%) of the RM fractions (WRM: washed RM, CRM: calcined RM, ARM: HCl-activated RM, PARM: HCl + H3PO4 -activated RM).
Table 3.
Elemental composition (wt-%) of the RM fractions (WRM: washed RM, CRM: calcined RM, ARM: HCl-activated RM, PARM: HCl + H3PO4 -activated RM).
| | Major Elements (wt-%) |
|---|
| | WRM | CRM | ARM | PARM |
|---|
| Fe | 40 | 40 | 43 | 37 |
| O | 35 | 35 | 36 | 38 |
| Al | 9.9 | 9.9 | 11 | 11 |
| Ti | 4.1 | 4.1 | 4.3 | 3.8 |
| Ca | 2.9 | 2.9 | 0.4 | 1.5 |
| Na | 2.8 | 3.1 | <0.1 | <0.1 |
| Si | 2.5 | 2.4 | 2.4 | 2.5 |
| P | 0.8 | 0.8 | 0.8 | 4.3 |
| Mn | 0.8 | 0.8 | 0.8 | 0.7 |
| Cr | 0.2 | 0.2 | 0.2 | 0.2 |
| Mg | 0.1 | 0.1 | 0.1 | 0.1 |
| S | 0.1 | 0.1 | 0.1 | 0.0 |
| Cl | 0.1 | 0.1 | 0.3 | 0.1 |
Table 4.
Evaluation of the proportions of different compounds in the RM fractions according to the XRD analysis (Reference Intensity Ratio method, RIR) and the crystallite size of hematite in each fraction calculated with the Scherrer equation (WRM: washed RM, CRM: calcined RM, ARM: HCl-activated RM, PARM: HCl + H3PO4 -activated RM).
| | | Evaluated Percentages in Fractions (%) |
|---|
| | | WRM | CRM | ARM | PARM |
|---|
| Hematite | Fe2O3 | 30 | 59 | 86 | 83 |
| Anatase | TiO2 | 4 | 5 | 9 | 10 |
| Rutile | TiO2 | 3 | 2 | 5 | 7 |
| Gibbsite | Al(OH)3 | 10 | | | |
| Boehmite | AlO(OH) | 8 | | | |
| Goethite | FeO(OH) | 27 | | | |
| Sodium Aluminum Silicate Hydroxide Hydrate | Na8(AlSiO4)6(OH)2·4H2O | 13 | 30 | | |
| Magnesium Titanium Oxide | (Mg0.3Ti2.7)O5 | 4 | | | |
| Calcite | CaCO3 | 4 | 5 | | |
| Crystallite size of hematite | Å (Scherrer) | 312 | 222 | 204 | 214 |
Table 5.
Textural properties of the samples determined by nitrogen physisorption at −196 °C. SBET = specific surface area, Sm = Mesopore surface area, Vµ = Micropore volume, and Vnet = Net pore volume (for p/p0 = 0.988) (WRM: washed RM, CRM: calcined RM, ARM: HCl-activated RM, PARM: HCl + H3PO4 -activated RM).
| Sample | SBET | Sm | Vµ | Vnet |
|---|
| | (m2 g−1) | (m2 g−1) | (mm3liq g−1) | (mm3liq g−1) |
|---|
| WRM | 41 | 25 | 10 | 178 |
| CRM | 59 | 38 | 14 | 211 |
| ARM | 144 | 91 | 34 | 293 |
| PARM | 108 | 70 | 23 | 358 |
Table 6.
T50 and Tmax values and SO2 yields and CO concentrations at Tmax in the DMDS experiments (WRM: washed RM, CRM: calcined RM, ARM: HCl-activated RM, PARM: HCl + H3PO4 -activated RM).
Table 6.
T50 and Tmax values and SO2 yields and CO concentrations at Tmax in the DMDS experiments (WRM: washed RM, CRM: calcined RM, ARM: HCl-activated RM, PARM: HCl + H3PO4 -activated RM).
| Experiment | T50 | Tmax | SO2 | CO |
|---|
| | (°C) | (°C) | (%) | (ppm) |
|---|
| Thermal | 470 | 480 1 | 45 | <10 |
| Thermal 110 | 460 | 480 1 | 65 | 20 |
| WRM 0.30 | 300 | 480 2 | 40 | <10 |
| CRM 0.30 | 310 | 460 2 | 55 | 40 |
| ARM 0.30 | 220 | 280 1 | 55 | 15 |
| ARM 0.15 | 250 | 310 1 | 60 | 20 |
| ARM 0.15 DMDS 110 | 270 | 320 1 | 70 | 30 |
| PARM 0.15 | 300 | 350 1 | 65 | 15 |
Table 7.
T50 and T100 values and DMDS concentrations at T100 in the MM experiments (WRM: washed RM, CRM: calcined RM, ARM: HCl-activated RM, PARM: HCl + H3PO4 -activated RM).
Table 7.
T50 and T100 values and DMDS concentrations at T100 in the MM experiments (WRM: washed RM, CRM: calcined RM, ARM: HCl-activated RM, PARM: HCl + H3PO4 -activated RM).
| Experiment | T50 | T100 | DMDS |
|---|
| | (°C) | (°C) | (ppm) |
|---|
| Thermal | 250 | 330 | 65 |
| WRM 0.15 | 30 1 | 230 | 55 |
| CRM 0.15 | 30 1 | 210 | 55 |
| ARM 0.15 | 30 1 | 190 | 50 |
| PARM 0.15 | 60 | 210 | 50 |

 ,
, 


