Article

Low-Melting Phosphate Glass Coatings for Structural Parts Composed of Depleted Uranium

1
Institute of Macromolecular Chemistry AS CR, Heyrovsky Sq. 1888/2, 162 06 Prague, Czech Republic
2
UJP PRAHA a.s., Nad Kaminkou 1345, 156 10 Prague, Czech Republic
*
Author to whom correspondence should be addressed.
Coatings 2022, 12(10), 1540; https://doi.org/10.3390/coatings12101540
Submission received: 11 August 2022 / Revised: 16 September 2022 / Accepted: 11 October 2022 / Published: 13 October 2022
(This article belongs to the Topic Corrosion and Protection of Metallic Materials)

Abstract

:
The applications of depleted uranium in mechanical engineering are limited by its high susceptibility to corrosion. Among various methods of corrosion protection, painting is usually considered a fast and cost-efficient method; however, organic polymer paints are sensitive to ionizing radiation, which is a limiting factor, e.g., for the fabrication of shielding containers or structural parts. The solution presented in this work is the creation of a glassy inorganic layer on top of the depleted uranium surface. Zinc lead phosphate low-melting glass was investigated for this purpose. Glass frit was obtained as an amorphous solid, as confirmed by differential scanning calorimetry and X-ray diffraction. The frit was easily ground in liquid media down to sizes suitable for spraying onto the surface of depleted uranium. When the glass powder is sprayed onto the surface of a substrate and fired at 440 °C, a partially crystallized continuous film with a complex morphology is formed, which significantly inhibits corrosion. The coating material shows resistance against high doses of γ-irradiation.

Graphical Abstract

1. Introduction

Uranium is an actinide element, which comprises three isotopes: the most abundant nonfissile 238U (99.28%); fissile 235U; and traces of fissile 234U. It possesses an extremely high density of 19.1 g/cm3. The depleted uranium (DU) is obtained after the partial separation of the 235U isotope during the production of enriched uranium. DU possesses lower radioactivity than natural uranium (14.8 Bq/mg vs. 25.4 Bq/mg), and, due to its density and high atomic number of 92, finds applications as a construction and shielding material. Except for military applications, the major uses of DU are counterbalancing weights in aircraft, shielding in radiotherapy sources and containers for the transportation of radioactive materials. However, the industrial applications of DU are limited by its susceptibility to corrosion. When exposed to the ambient atmosphere and water vapor, uranium easily oxidizes to insoluble U(IV) and U(IV) oxides and to highly soluble uranyl species, such as (UO2)3(OH)5+ or UO2(CO3)34− [1,2]. The latter were found to be nephrotoxic [3,4] and prone to accumulate in bones due to the high affinity of uranyl cations to bone proteins and phosphates [5,6]. Therefore, corrosion products of DU represent a hazard to both the environment and human health.
There are several strategies for the corrosion protection of DU: shielding from the environment by embedding into other materials, such as concrete [7,8], curable polymers or stainless steel sleeves [9]; vapor coating with silver, copper or lead [10]; the creation of sacrificial coatings from nickel, zinc [11] or the combination of Al-Zn and Al-Mg [12]; surface passivation by oxidation [13]; the formation of nitride [14] or carbide [15]; and alloying with titanium [12], molybdenum [16] or zirconium [17]. The protective coatings developed to date possess both advantages and drawbacks, such as waste solutions contaminated with uranium from electroplating, high costs of metal vapor deposition, low durability of polymer coatings, especially under ionizing radiation, and inhibited but not entirely eliminated corrosion of alloys and passivated surfaces.
Surface glassy layers are widely used for the creation of protective and decorative coatings due to their hardness and chemical durability. When the coating is realized on the surface of a metal, it is known as enamel. The enameling process comprises the application of glass frit powder, either dry or as slurry, followed by firing at temperatures above 800 °C [18] for the fusion of powder particles into a continuous film. The glass usually comprises the network former—the inorganic polymer anion, bridged through the oxygen atoms (SiO4, AlO4, or BO3 and their combinations), and the network modifier—the metal cation, rupturing the chain of the polymer anion by binding to the terminal oxygen atom (mainly alkali and alkali earth metals) [19,20]. The cations of multivalent metals can act, depending on the concentration, both as a network modifier or network intermediate, by incorporation into the chains of the network former [20]. The amount of modifier and intermediate determines the average chain length of the network former, and, in turn, the glass transition (Tg) and softening (Ts) temperatures of the glass. The common silicate, borate and alumina glass systems usually possess high processing temperatures, with ranging Tg from 450 to 800 °C [21].
Glasses with phosphate network forming anions usually possess a Tg below 400 °C, which is desirable for solder applications [19]. Depending on the ratio of metal oxide to phosphorus oxide (MeO)x·(P2O5)1−x, the glasses are defined as ultraphosphate (x < 50%) and polyphosphate (x > 50%). The degree of the polymerization of phosphate groups is determined by the O/P molar ratio (O/P > 3.5 for isolated orthophosphate groups) [20]. The moisture resistance and overall chemical durability of phosphate glasses strongly depend on the metal cations used [22] but also increase at higher x values and lower O/P ratios [23]. Compared to the binary (MeO)x·(P2O5)1−x glasses, the ternary glasses themselves enable fine tuning of the desired glass properties [24]. Lead zinc phosphate glass is a material with a Tg ranging from 245 to 343 °C depending on the composition [23], high refractive index [25] and a thermal expansion coefficient ranging from 10.1 × 10⁻⁶/°C to 20.8 × 10⁻⁶/°C [23]. At a P2O5 fraction above 50%, the Zn2+ and Pb2+ cations act as glass modifiers, lowering Tg but increasing the glass solubility. At lower P2O5 contents, both ZnO and PbO become intermediates with PbO6, PbO4 or ZnO4 units included in the glass forming network, resulting in more chemically durable glasses with a higher Tg [26].
Lower processing temperature is desired for the coating due to high chemical reactivity of DU. To the best of our knowledge, to date, there has been no reports of ceramic or glass protective coatings on the surface of depleted uranium. There are few reports on formation of the phosphate based protective coating, fired below 500 °C on the surface of Mg alloys [27,28], which possess similar to DU chemical reactivity. The thermal expansion coefficient of uranium (12.0 to 13.6 10−6/°C [29]) matches that for the phosphate glasses Within the current study, we describe new low-cost corrosion protection coatings on DU, based on PbO·ZnO·P2O5 (1:1:3) glass, with Tg = 262 °C, as reported by Liu et al. [23]. The glass powder was sprayed from ethanol onto the DU surface and fired in a vacuum oven. The formation of amorphous glass was confirmed by Fourier-transform infrared spectroscopy (FTIR), Fourier-transform Raman spectroscopy (FT-Raman), differential scanning calorimetry (DSC) and X-ray diffraction. The transformations of the glass powders during wet grinding down to sizes below 20 µm, suitable for spraying, were monitored with scanning electron microscopy (SEM), energy-dispersive X-ray spectroscopy (EDX) and laser diffraction. The changes in the glass layers under γ-irradiation were studied with electron spin resonance (ESR) spectroscopy. Finally, corrosion tests for the DU discs coated with phosphate glass and coating of the DU construction part were performed.

2. Materials and Methods

2.1. Materials

Zinc oxide (99.99%) was purchased from Sigma-Aldrich (St. Louis, MO, SUA); lead (II) oxide (99.9%) and ammonium dihydrogen phosphate (99.0%) were purchased from Merck (Darmstadt, Germany); fine crystalline graphite powder PMM 11 was purchased from Koh-i-noor Grafit, Ltd., České Budějovice, Czech Republic; Cloisite 30B was purchased from Southern Clay Products Inc., Austin, TX, USA; substrates for coating: tungsten and depleted uranium discs were provided by UJP PRAHA a.s (Prague, Czech Republic); ethanol (99.8%) was purchased from Lach-ner (Neratovice, Czech Republic).

2.2. Smelting

The glass frit was prepared according to [30]. Briefly, fine powders of zinc oxide and lead oxide were mixed with ammonium dihydrogen phosphate powder to achieve a PbO:ZnO:P2O5 molar ratio of 1:1:3. The mixture was placed in an alumina crucible and slowly heated first to 475 °C over 2 h. Next, it was aged for 30 min and further heated to 800 °C over 2 h and then spontaneously cooled overnight in the furnace.

2.3. Preparation of Glass Powders

The coarse glass powder was prepared by dry grinding of the initial glass frit and sieving with a 71 µm sieve (Preciselekt, Dolní Loučky, Czech Republic, ISO 3310-1). To obtain fine glass powder with sizes suitable for spraying, the coarse powder was further wet ground with a Pulverisette-5 planetary ball mill (Fritsch GmbH, Weimar, Germany) in agate vessels. Twenty grams of coarse powder was mixed with 4 mL of ethanol and ground at 380 rpm for 90 min. The dispersion of the fine glass powder in ethanol was diluted to 10 wt.% and used for spraying on metal substrates without further processing.
The selected sample of coarse powder was wet ground in an aqueous medium with an in-house-built stirred media mill (see the scheme shown in Figure S1 in Supplementary Materials) to follow the kinetics of grinding and morphology of the ground powder. Twenty grams of a coarse powder was mixed with 180 mL (655 g) of zirconia milling beads type ZY-E 0.4–0.6 mm (Sigmund Lindner GmbH, Warmensteinach, Germany) and 60 mL of water and stirred at 700 rpm for 7, 12 or 24 h in an open vessel. Then, the dispersion of glass powder in water was separated from the milling beads with a 71 µm sieve and dried.

2.4. Coating the Substrates

2.4.1. Casting of a Coarse Glass Powder

Casting was performed from aqueous dispersions of a coarse powder for quick testing of the sintering process. One gram of powder, pure or with 2 or 10 wt.% (0.02 or 0.1 g) of Cloisite 30B or graphite PMM 11 fillers was dispersed in 3 mL of water and cast onto the top of the substrate to achieve a coverage of 20 mg·cm−2. The two substrates were used for the casting of powder: tungsten discs can be used as a nontoxic and nonradioactive replacement for DU for the study of film formation, which is not strongly influenced by the substrate and DU discs.

2.4.2. Spraying of a Fine Glass Powder

The dispersion, obtained from wet grinding in ethanol, was diluted with ethanol to achieve a concentration of 10 wt.%. Then, it was sprayed onto DU substrates of various shapes (discs or shielding prototypes) with the use of a 200 µm nozzle and compressed air at a pressure of 3.2 bars to achieve a coverage of 6.5 mg·cm−2 in a single layer or 13 mg·cm−2 in a double layer. Additionally, for the electron microscopy of the film fractures, the glass powder was sprayed on top of the Si wafer.

2.4.3. Firing

The coated substrate was dried under ambient conditions and fired in a CLASIC 1013L vacuum furnace (CLASIC CZ Ltd., Řevnice, Czech Republic) equipped with a BALZERS DUO 1.1 rotary pump (Pfeiffer Vacuum GmbH, Asslar, Germany; achievable pressure ≥ 1 Pa) at 440 °C according to the heating profile shown in Figure S2 in Supplementary Materials in the ambient atmosphere (tungsten discs and Si wafer) or under vacuum (DU discs and structural parts).

2.5. Analysis

2.5.1. Fourier-Transform Infrared Spectroscopy

Attenuated total reflectance (ATR) FTIR spectra were acquired by accumulating 256 scans with a resolution of 4 cm−1 using a Thermo Nicolet Nexus 870 FTIR spectrometer (Thermo Fischer Scientific, Waltham, MA, USA). The obtained spectra were subjected to baseline and ATR corrections with OMNICTM software ver. 8.3.103 (Thermo Fischer Scientific, Waltham, MA, USA).

2.5.2. Fourier-Transform Raman Spectroscopy

FT-Raman spectra were acquired by accumulating 256 scans with a spectral resolution of 8 cm−1 using an NXR FT-Raman module using a 1064 nm NIR excitation laser attached to a Thermo Nicolet 6700 FTIR spectrometer (Thermo Fischer Scientific, Waltham, MA, USA). The spectra were subjected to a baseline correction in OMNICTM software ver. 8.3.103 (Thermo Fischer Scientific, Waltham, MA, USA).

2.5.3. X-ray Diffraction

XRD patterns were obtained using a high-resolution diffractometer Explorer (GNR Analytical Instruments, Agrate Conturbia, Italy) equipped with a one-dimensional silicon strip detector Mythen 1K (Dectris, Baden-Daettwil, Switzerland). CuKα radiation (wavelength λ = 1.54 Å) was monochromatized with Ni foil (β filter). The measurements were performed in a Bragg-Brentano geometry in the 2θ range of 3–65° with a step size of 0.1°. The exposure time at each step was 15 s.

2.5.4. Differential Scanning Calorimetry

DSC for glass powders was carried out using a Q2000 (TA Instruments, New Castle, DE, USA) in aluminum pans under a nitrogen flow of 50 mL/min. Measurements were carried out in a heating–cooling–heating regime from 30 °C to 400 °C. A heating rate of 20 °C/min was used for the first heating, with a temperature change rate of 10 °C/min used for the cooling and second heating. The transition temperature was evaluated from the second heating curves with TA Instruments Universal Analysis 2000 software version 4.7a (TA Instruments, New Castle, DE, USA).

2.5.5. Electron Microscopy

Scanning electron microscopy and microanalysis were carried out with a high-resolution field emission gun scanning electron microscope MAIA3 (TESCAN, Brno, Czech Republic). The samples were covered with a thin carbon layer (Vacuum evaporation device JEE-4C, JEOL, Akishima, Japan) and visualized using secondary electron imaging (SEM/SE) at an accelerating voltage of 3 kV. Elemental microanalysis (SEM/EDX) was performed with an EDX detector X-MaxN 20 (Oxford Instruments, Abingdon, UK) at an accelerating voltage of 30 kV. SEM micrographs for the coarse glass powder were recorded after 7, 14 and 24 h of wet grinding. The volume-weighted particle size distributions (PSDs) were determined by measuring the linear dimension of at least 200 nanoparticles from SEM micrographs using ImageJ software version 1.52p (National Institutes of Health, Bethesda, MD, USA). The particle size range was divided into 15 equal intervals, and the relative volume (Σdi3/Σdall3) of particles within the i-th interval was calculated. The cumulative particle size distributions were plotted with Origin 9 (OriginLab Corporation, Northampton, MA, USA) and used for the determination of dv50, dv90, dv95 and dv99 diameters (µm).

2.5.6. Light Microscopy (LM)

LM was carried out with a DM 6000 M light microscope (Leica Microsystems, Wetzlar, Germany). The samples were observed “as received” using bright field imaging in reflected light. Selected samples were also visualized using z-stacks where the final micrograph is composed of a series of individual images taken at different vertical positions (z-positions) for the microscopic stage; this method enhances the depth of focus in 2D images and allows for calculation of approximate 3D images together with z-profiles, which show the surface roughness. The surface roughness parameters were defined as Ra—arithmetical mean deviation of the profile height from zero-baseline, Rz—maximum height of the profile, defined as the sum of the largest profile peak height and the largest profile valley depth.

2.5.7. Laser Diffraction

The cumulative volume-weighted particle size distribution for the coarse and ground in ethanol fine glass powders was measured by laser diffraction using a Helos/KF instrument (Sympatec GmbH, Clausthal-Zellerfeld, Germany), and the dv50, dv90, dv95 and dv99 (µm) diameters were calculated.

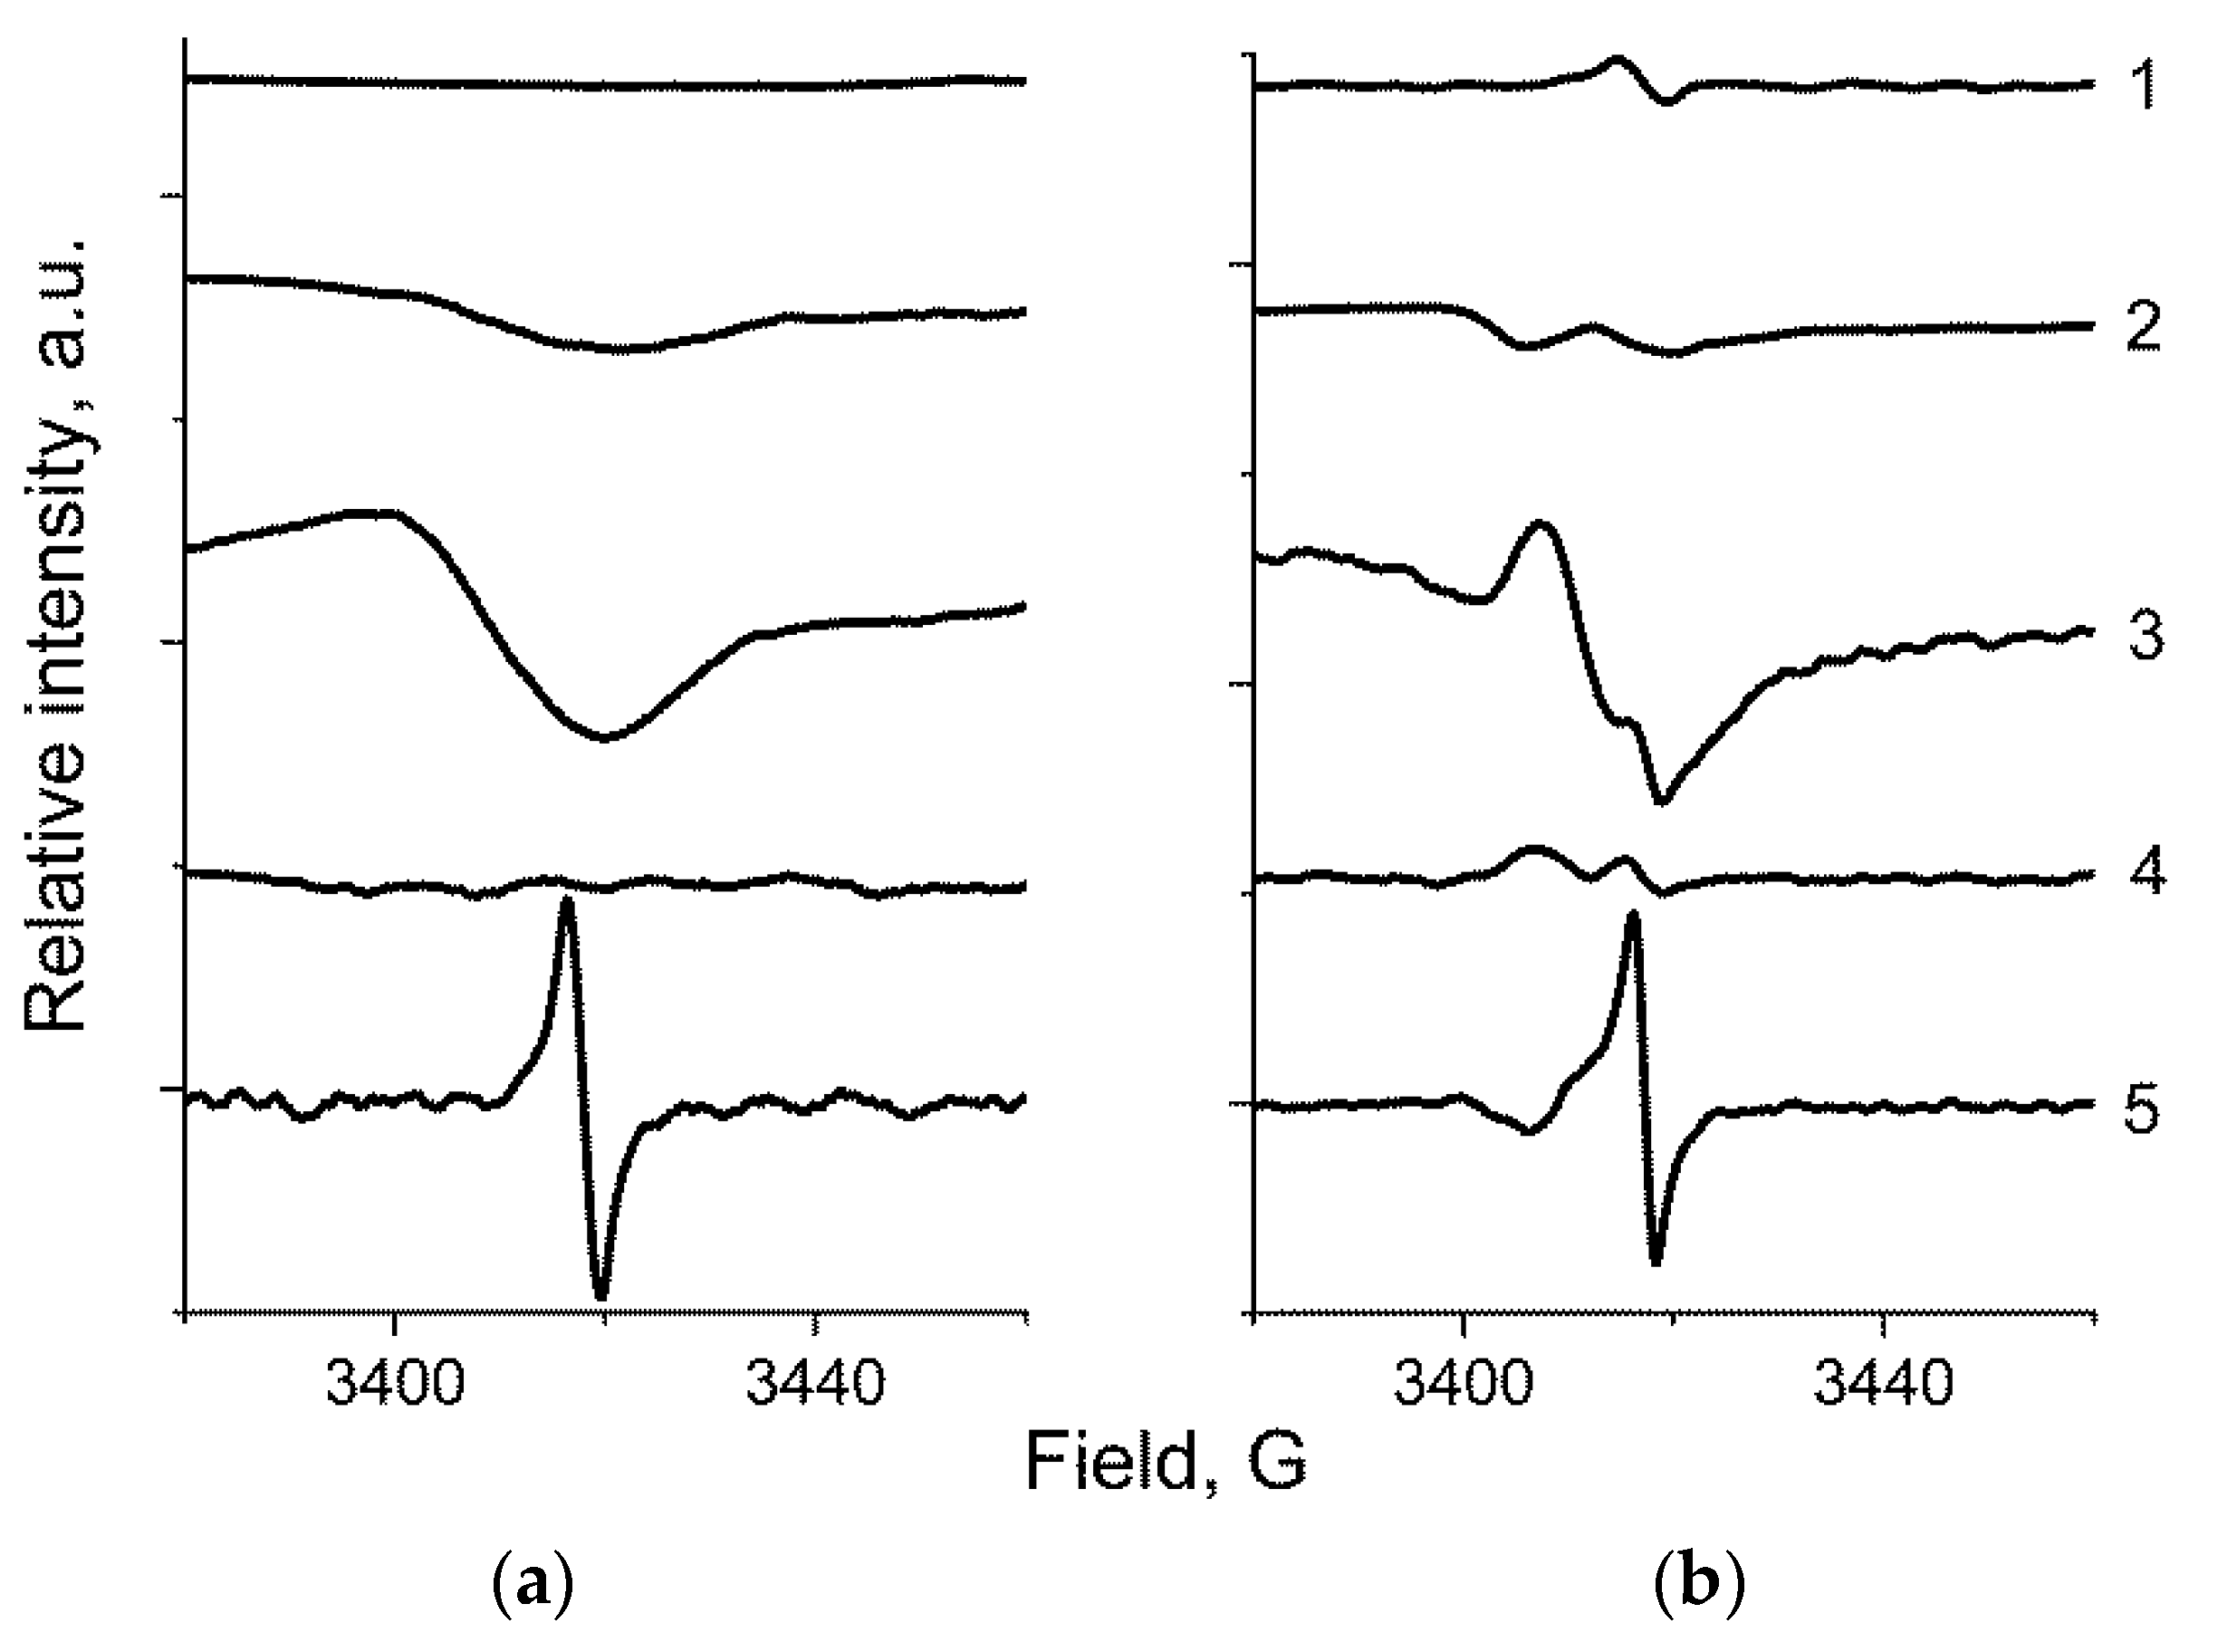
2.5.8. Electron Spin Resonance (ESR)

The glass powder, pure or containing fillers (see Section 2.4.1), was sealed in Pasteur pipettes and fired at 440 °C according to Section 2.4.3. The ESR spectra were recorded using an ELEXSYS E500 X-band spectrometer (Bruker, Billerica, MA, USA) with 100 kHz magnetic field modulation at a microwave output of 6 mW before and after γ-irradiation of the glass in sealed Pasteur pipettes (0.9 MGy, 60Co).

2.5.9. Vickers Hardness Measurement

The Vickers hardness of the glass layers obtained from pure glass or containing fillers (see Section 2.4.1), prepared on tungsten discs, was measured before and after γ-irradiation (0.9 MGy, 60Co). The measurement was performed with a load of 20 or 50 g (HVM20g or HVM50g) on the cone, depending on the roughness of the glass layer surface. The penetration depth was measured using a Reichert MeF2 (Depew, NY, USA) metallographic microscope. Each measurement value for HVM20g or HVM50g was obtained from the average of five measurements.

2.5.10. Accelerated Corrosion Tests

The DU disc with a known surface area, coated with a glass layer, was placed in a ceramic crucible and aged in an ambient atmosphere at 115 °C for 23 days. The weight of the ingot was monitored over time. The corrosion rate was defined as the increase in ingot weight per unit of ingot area with time (mg/cm2·h) obtained from a linear fit to the weight gain per cm2 vs. time plot.

3. Results and Discussion

The glass frit was prepared according to [30]: the mechanical mixture of zinc and lead oxides with ammonium dihydrogen phosphate was first heated to 475 °C and aged for 30 min for the decomposition of NH4H2PO4 to HPO3 and gaseous NH3 with H2O. Further heating to 800 °C resulted in the dehydration of HPO3 and the formation of nonstoichiometric mixed Zn/Pb polypyrophosphates, obtained as a homogeneous transparent solid after cooling. Instead of quenching the hot melt above the crystallization temperature [31], the glass frit was allowed to cool overnight together with the furnace.

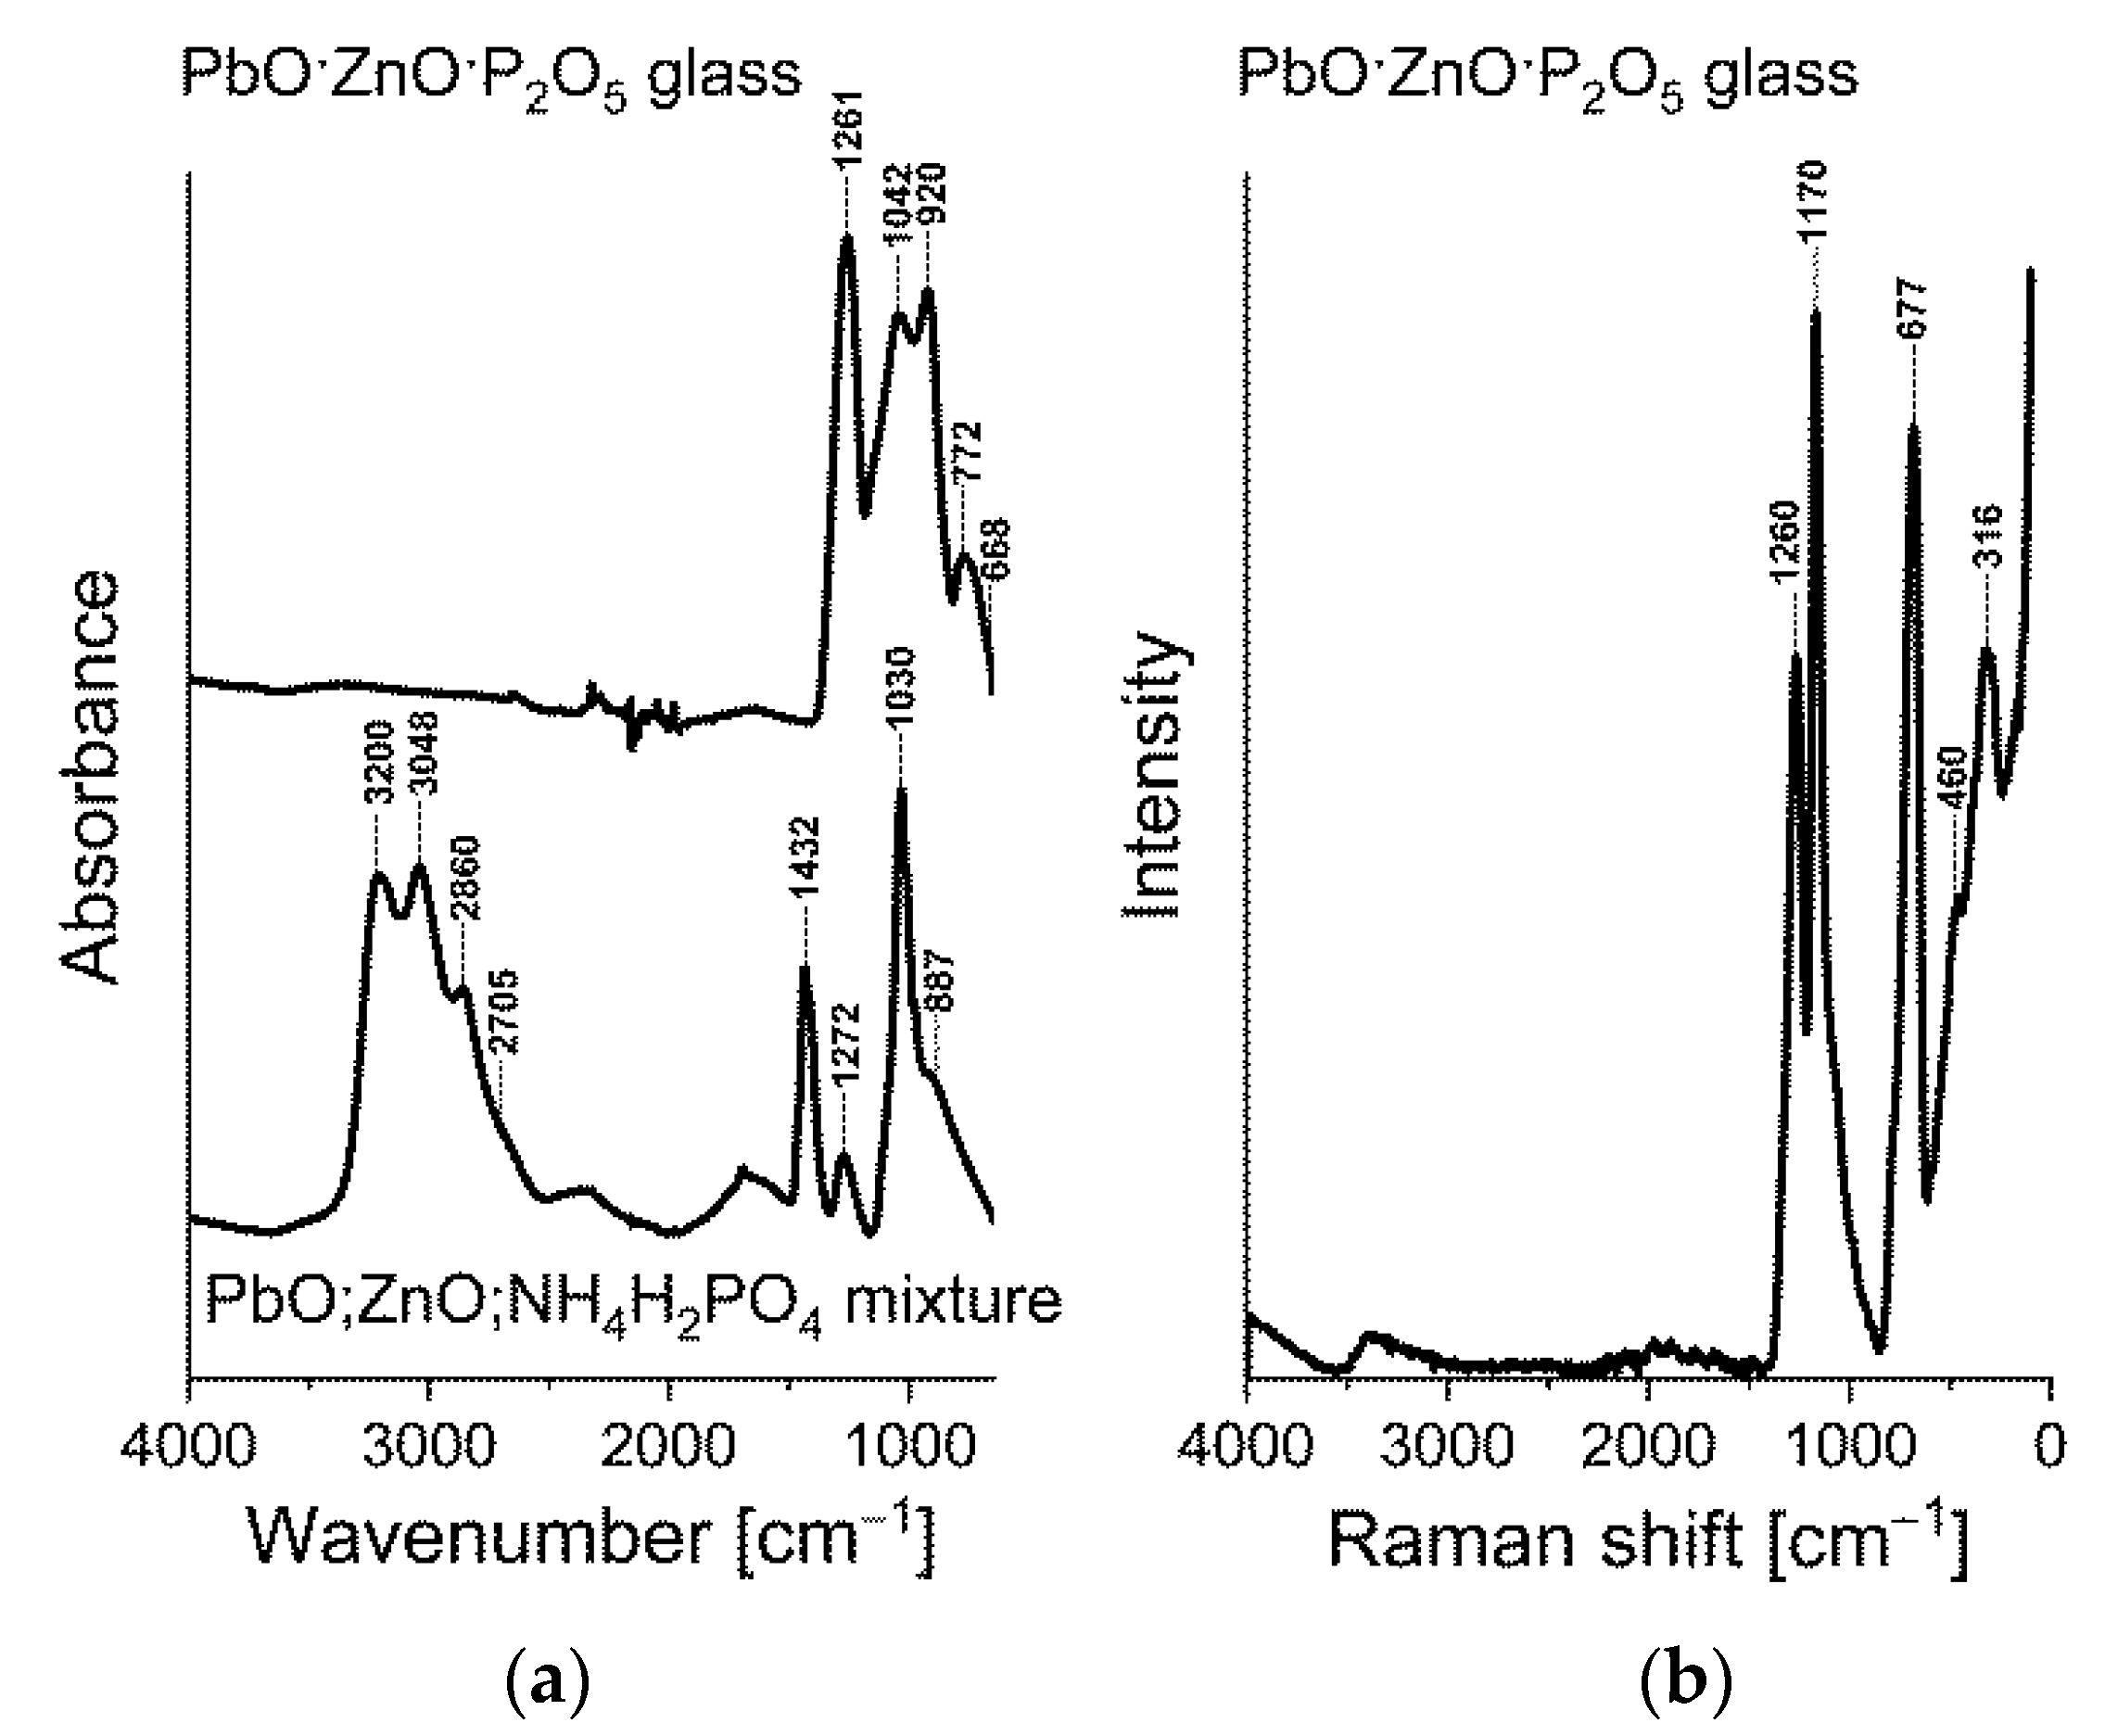
3.1. Molecular Structure of PbO·ZnO·P2O5 Glass Studied by FTIR and FT-Raman Spectroscopy

The FTIR spectrum of the initial mixture before smelting (Figure 1a) contains the characteristic bands of the H2PO4 anion in the crystalline salt: the band at 887 cm−1 is attributed to P–O–H vibrations; the band at 1030 cm−1 to P–O stretching; the band at 1272 cm−1 to a combination of the asymmetric stretching vibration of the PO4 group with the crystal lattice; the band at 1432 cm−1 to bending vibrations of NH4+ cation; and the bands at 3200, 3048, 2860 and 2705 cm−1 to the stretching vibrations of –O–H and N–H bonds in hydroxyl group and ammonium cation [32]. Note that bulk ZnO and PbO are both transparent above 600 cm−1 [25,26]. From the FTIR spectrum obtained for PbO·ZnO·P2O5 glass powder, the bands assigned to –O–H and N–H bonds entirely vanish, and the low-wavenumber region of the spectrum exhibits changes. New bands appear at 772 cm−1 and 920 cm−1. These two bands are attributed to the symmetric and asymmetric stretching vibrations of the P–O–P linkage in the polypyrophosphate chains [23]. The polypyrophosphate chains are glass network formers. The acquired FTIR spectra does provide direct evidence for covalent bonding of P–O–Zn and P–O–Pb, although the shifts in the P–O (1042 cm−1) and P=O (1261 cm−1) bands are often explained by their coordination with metal cations [33]. In the corresponding FT-Raman spectrum for PbO·ZnO·P2O5 glass powder (Figure 1b), the characteristic band at 1260 cm−1 is attributed to P=O vibrations; the bands at 1170 and 677 cm−1 are attributed to the symmetric stretching vibration of the two nonbridging oxygen ions bonded to phosphorus (PO2)2− and to the symmetric P–O–P mode in condensed phosphates, respectively [34]. All the characteristic bands emphasized in the FTIR and FT-Raman spectra for the powder samples are assigned to different vibration modes of the polymer phosphate anion in the formed glass. The absence of any signatures attributed to P–O–Zn or P–O–Pb bonds indicate that ZnO and PbO at the overall molar fraction x = 0.4 in the (MeO)x·(P2O5)1−x structure exist as a network modifier, and the glass belongs to the group of ultraphosphate glasses (x < 0.5) [20].

3.2. The Material Properties of PbO·ZnO·P2O5 Glass Were Studied with XRD and DSC

The coarse and fine glass powders demonstrated typical glass behavior during DSC measurements. The glass composition of PbO·ZnO·P2O5 (1:1:3) is found to show a Tg of 258 °C, which is in agreement with that published elsewhere [23] (Figure 2a). The X-ray diffraction patterns for both coarse and fine powders confirm the amorphous glass structure (Figure 2b), with a shift in the amorphous peak to smaller angles for the fine powder sample.
This amorphous structure for the glass frit was preserved without a melt quenching step, as usually applied for the vitrification of materials by fast cooling. The low glassing temperature is important for the creation of the vitreous layer on the surface of DU under mild firing conditions. However, during firing at 440 °C, both fine and coarse powders partially crystallize. According to Chowdury et al. [33], the crystallization temperature for PbO·ZnO·P2O5 glasses is 430 °C. The XRD patterns for crystalline structures in the fired glass films (Figure 2b) imply that coarse powder mainly crystallizes as a mixed zinc/lead phosphate ZnPbP2O7 (monoclinic, COD 1535782) with an admixture of Zn(PO3)2 (monoclinic, COD 2013738) and some minor quantities of unidentified phases formed when the fine powder crystallizes as a mixture of two separate Zn(PO3)2 and Pb(PO3)2 crystalline phases (monoclinic, COD 2310615). The layers, cast from coarse powder mixed with 2 and 10 wt.% graphite PMM 11 and Cloisite 30B and fired under the same conditions, were crystallized in a complex mixture of phases, with ZnPbP2O7 dominating in the presence of graphite, while a mixture of Zn(PO3)2 and Pb(PO3)2 phases appears in the presence of Cloisite 30B. The crystalline structures of both graphite (hexagonal, COD 9012230) and Coisite 30B (monoclinic, R110052) are preserved during firing (Figure S3 in Supplementary Materials).

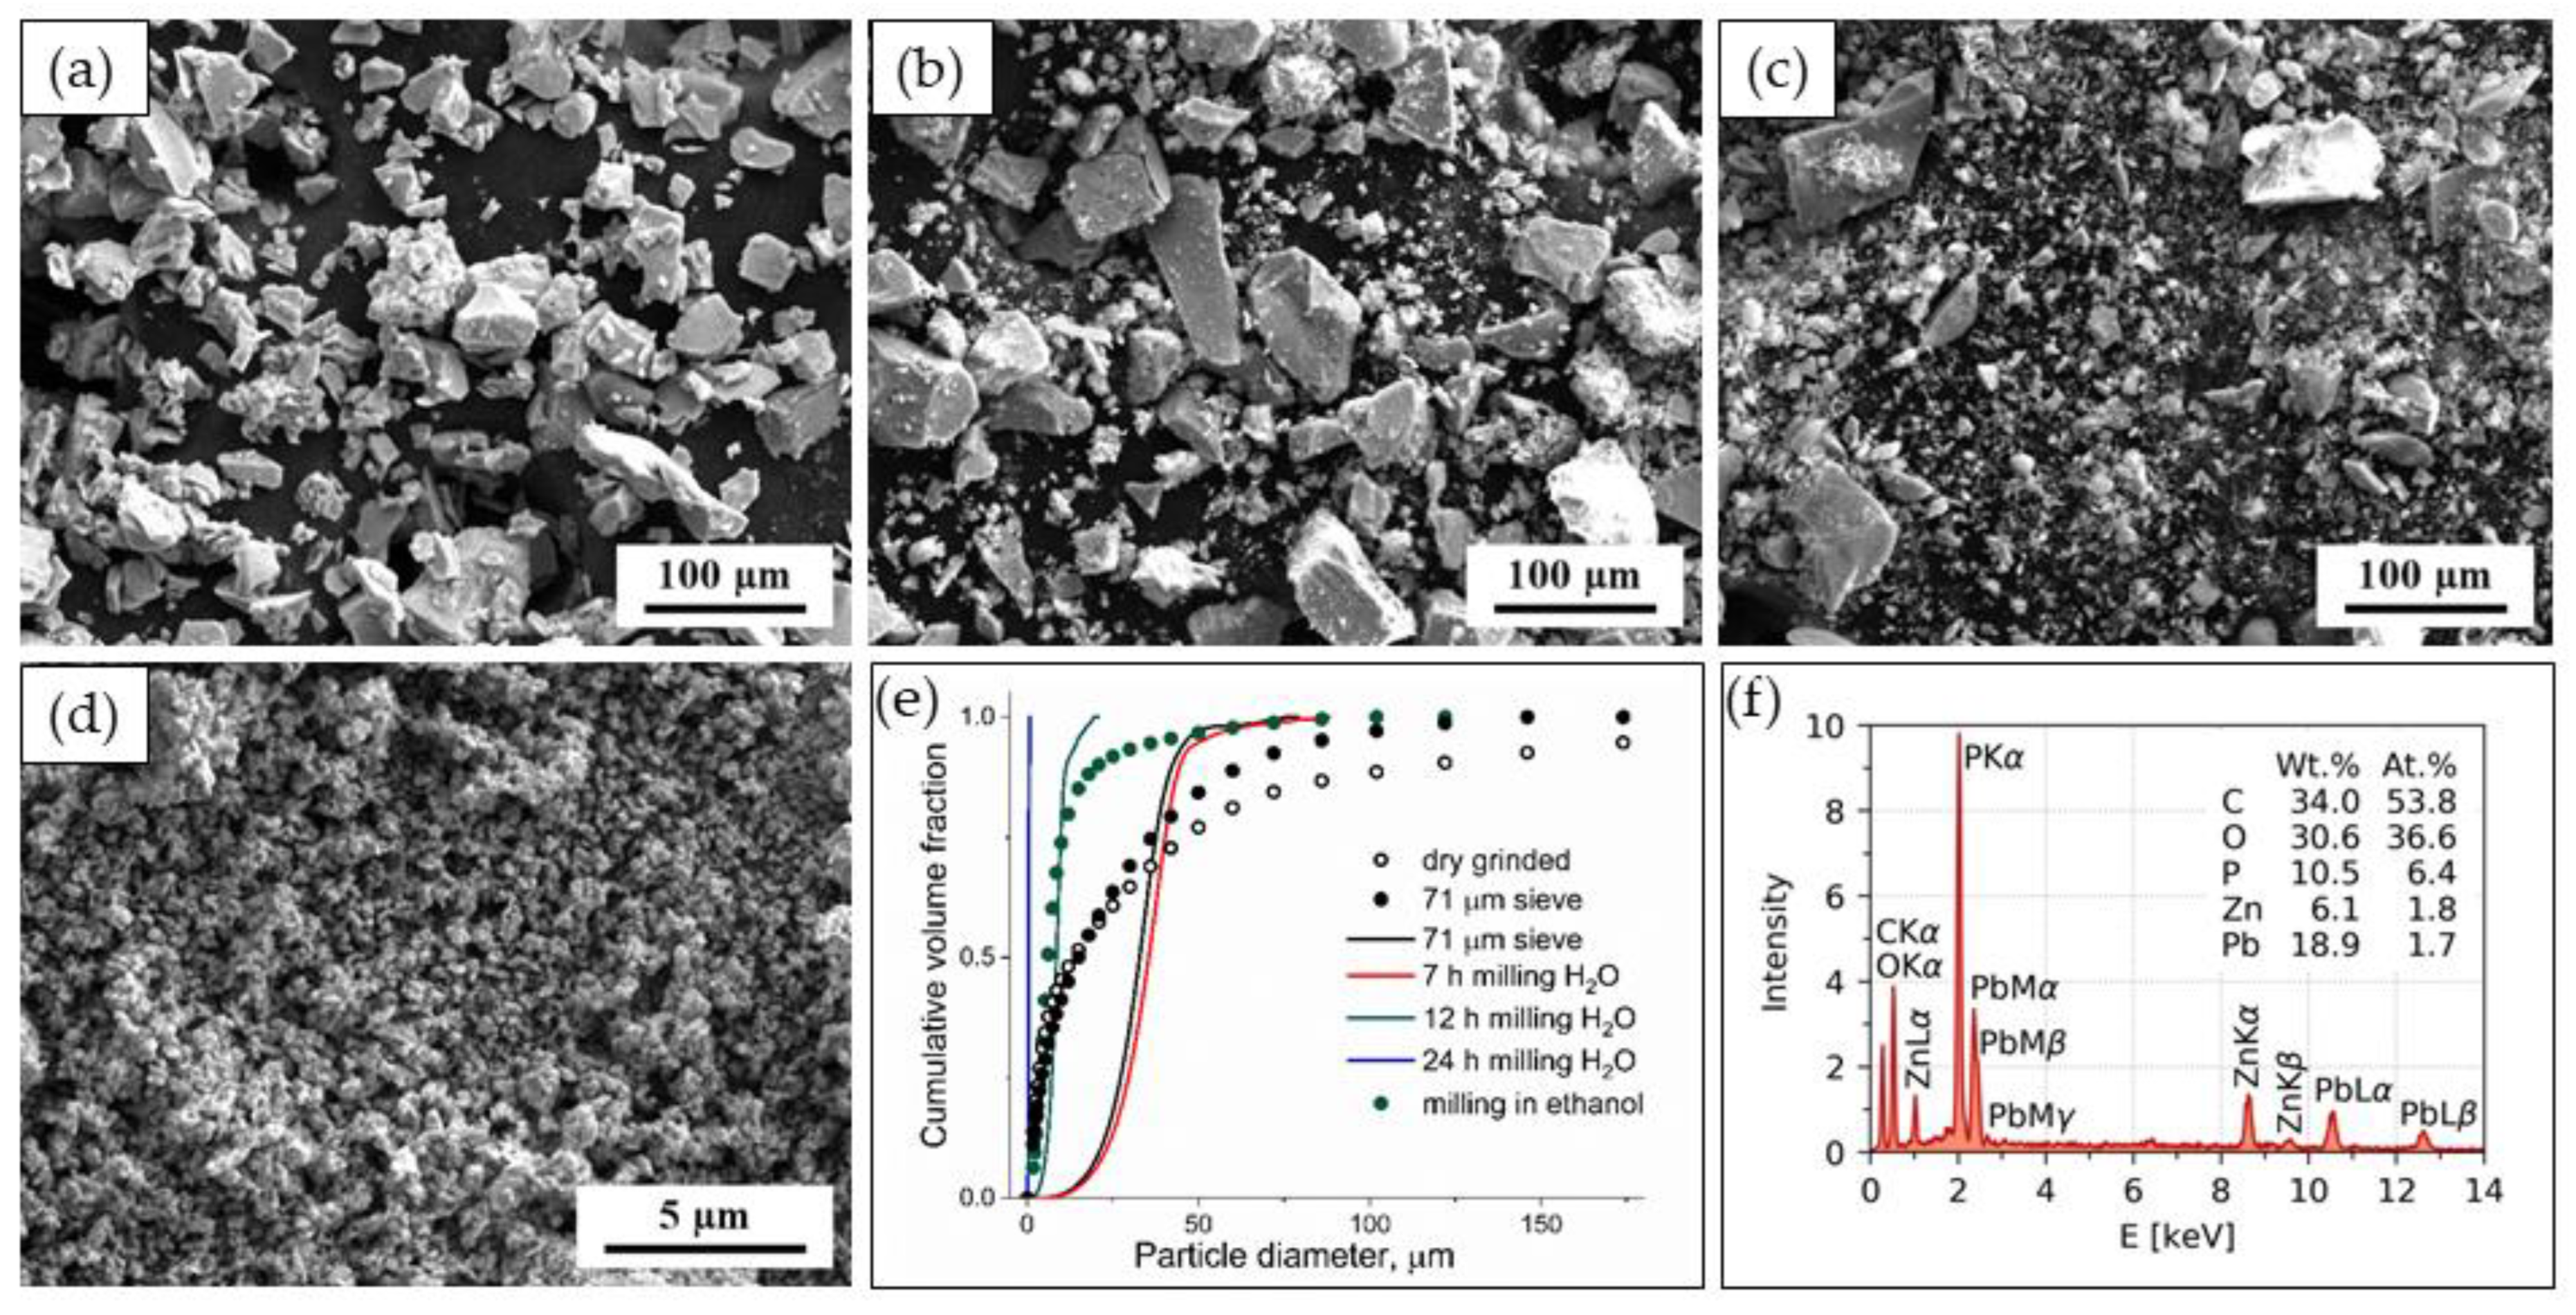
3.3. Composition and Particle Size Distribution of the PbO·ZnO·P2O5 Glass Powders

The presence of Zn, Pb and P in the synthesized glass powders was confirmed using SEM/EDX spectroscopy (the representative EDX spectrum is shown in Figure 3f). Their molar ratio corresponds to the glass composition of PbO·ZnO·P2O5 (1:1:2.2), which is slightly depleted in P compared to the theoretical composition (1:1:3).
The grinding of coarse powder in ethanol using the Pulverisette-5 planetary ball mill enables the determination of the final PSD only. The latter was measured with laser diffraction together with the PSDs for the coarse dry-ground powder before and after sieving (Figure 3e, scatter plots, Table 1). The initial coarse powder comprised particles with a volume mean diameter of dv50 = 14 µm and broad size distribution. The sieving mainly led to a narrowing of the PSD due to the separation of the powder fractions with dv99 > 120 µm (Table 1). After 2 h of wet grinding in ethanol, the dv50 decreased to 6 µm, and the overall PSD narrowed to dv99 = 120 µm.
The grinding of the coarse powder in water using an in-house stirred media mill with zirconia beads in an open vessel allowed for the study of the grinding kinetics. The evolution of the PSD was monitored with SEM microscopy of the probes taken after 7, 12 and 24 h of grinding (Figure 3a–d). The fraction of small particles becomes observable after 7 h of grinding, and after 12 h, a result that is comparable with grinding in ethanol with a planetary ball mill is achieved (Figure 3e, solid lines; Table 1). Submicron-sized glass powder particles were prepared by extending the grinding time to 24 h.
The powders with PSDs of dv50 = 9 µm and dv99 = 19 µm vs. dv50 = 6 µm and dv99 = 76 µm, obtained by wet grinding in water and ethanol, respectively, were both found to be suitable for spraying through a 200 µm nozzle. Despite the wider PSD, the planetary ball mill had the advantage of shorter milling times, and the milling medium could also be used for spraying without additional isolation and purification steps.

3.4. The Morphology and Properties of PbO·ZnO·P2O5 Films

The flake-shaped fillers Cloisite 30B and graphite PMM 11 were added to the glass to study their impact on the barrier properties by increasing the diffusion path for water or oxygen through the film. The fired layers cast from pure coarse glass and mixtures with 2 or 10 wt.% fillers as well as the layers, sprayed from the pure fine glass on top of tungsten discs, are observed to be uniform on the macroscopic scale (see Figure S4 in the Supplementary Materials).
A study of the surface of layers with light microscopy demonstrated the granular structure, with the grain size found to be consistent with the PSD reported in Table 1 (after the 71 µm sieve) for the pure glasses (Figure 4a,c,e) and composites with Cloisite 30 B (d50 = 6 µm, d90 = 13 µm); for the composites with graphite PMM 11, the grain size is accordant with the filler particle size (47 m2/g BET surface, separate grains reaching the size of a few mm—Figure 4b,d). The surface of the glass layers was visualized with z-stacks of images for improving the focus depth (Figure 4d,e), and then the surface roughness was calculated from the z-profiles (Figure 4f). The latter was found to be similar for the layers obtained from coarse and fine powders: Ra = 6.7 µm, Rz = 28.4 µm and Ra = 10.7 µm, Rz = 37.7 µm, respectively. The SEM micrograph of the glass layer formed from coarse powder (Figure 4g) shows a continuous film with asperities, formed by sintered particles with a size ranging from 1 to 5 µm, slightly below the value for xv50 = 15 µm, measured by laser diffraction for coarse powder (Table 1). The dimensions of the asperities correspond to the values for the surface roughness. For the layer prepared by spraying from ethanol, SEM micrographs of the top view (Figure 4h) and of the layer fracture (Figure 4i) demonstrate less dense packing of the grains that form the films, with the size of the voids and surface asperities being larger than the size of the particles. In the layer cast on top of the substrate, the particles sediment faster under gravity than for water evaporation from the slurry, which, therefore, leads to a higher packing density. The layer deposited by spraying is formed during fast evaporation of ethanol, resulting in looser packing of the particles, although the spraying enables the coating of DU structural parts with an arbitrary shape simultaneously from all sides.
The pure coarse glass and mixtures with 2 or 10 wt.% graphite PMM 11 or Cloisite 30B were fired according to the heating profile shown in Figure S2 in sealed Pasteur pipettes to fit the ESR spectrometer cell. Then, together with the layers of the same composition, fired on top of tungsten discs, the samples were γ-irradiated with a total dose of 0.9 MGy. The ESR spectra for the fired layers before γ-irradiation (Figure 5a) show no paramagnetic species in the pure glass, but with the addition of fillers, the paramagnetic species become detectable with ESR. The intensity of the ESR signal increases proportionally to the amount of filler in the glass layer. After γ-irradiation, detectable amounts of paramagnetic species also appear in the pure glass, but again in the presence of the filler, the amount of paramagnetic species further increases (Figure 5b). The exact assignment of paramagnetic species in a pure glass matrix is complex; ESR spectra 2 and 3 can be attributed to the unpaired spin on the carbon in the graphite lattice, similar to that reported by Cataldo et al. [36]. Cloisite 30B is composed of clay intercalated with quaternary alkyl ammonium, which often contains an admixture of Fe3+; therefore, ESR spectra 4 and 5 represent either the slow motion of carbon radicals trapped in the glass matrix from alkyl chains or Fe3+ cations. Although the fraction of the paramagnetic species observed with ESR spectroscopy can be attributed to reactive free radicals, they do not promote visible degradation of the glass, unlike organic radicals in carbon-based polymers. The Vickers microhardness is only measurable for the layer obtained from the pure glass and for the layer with 10 wt.% graphite due to their sufficiently smooth surfaces, and it does not change after γ-irradiation (160 ± 26 vs. 157 ± 40 HVM50g and 30 ± 8 vs. 36 ± 7 HVM20g, respectively). As previously computed by Matori et al. [37], PbO·ZnO·P2O5 glasses possess shielding properties against high-energy photons (from 0.015 to 15 MeV). Taking into account the experimental results discussed above (60Co emits two γ-quants with 1.17 and 1.33 MeV), the PbO·ZnO·P2O5 glass is considered suitable for DU coating and its further application as shielding against ionizing radiation. Similar phosphate-based layers were obtained on the surface of Mg alloys by a sol-gel method [27,28] followed by firing at 400 °C and Ar atmosphere. The obtained films were partially crystalline and, similarly to the film described in the current study, inhibited the corrosion of the substrate.

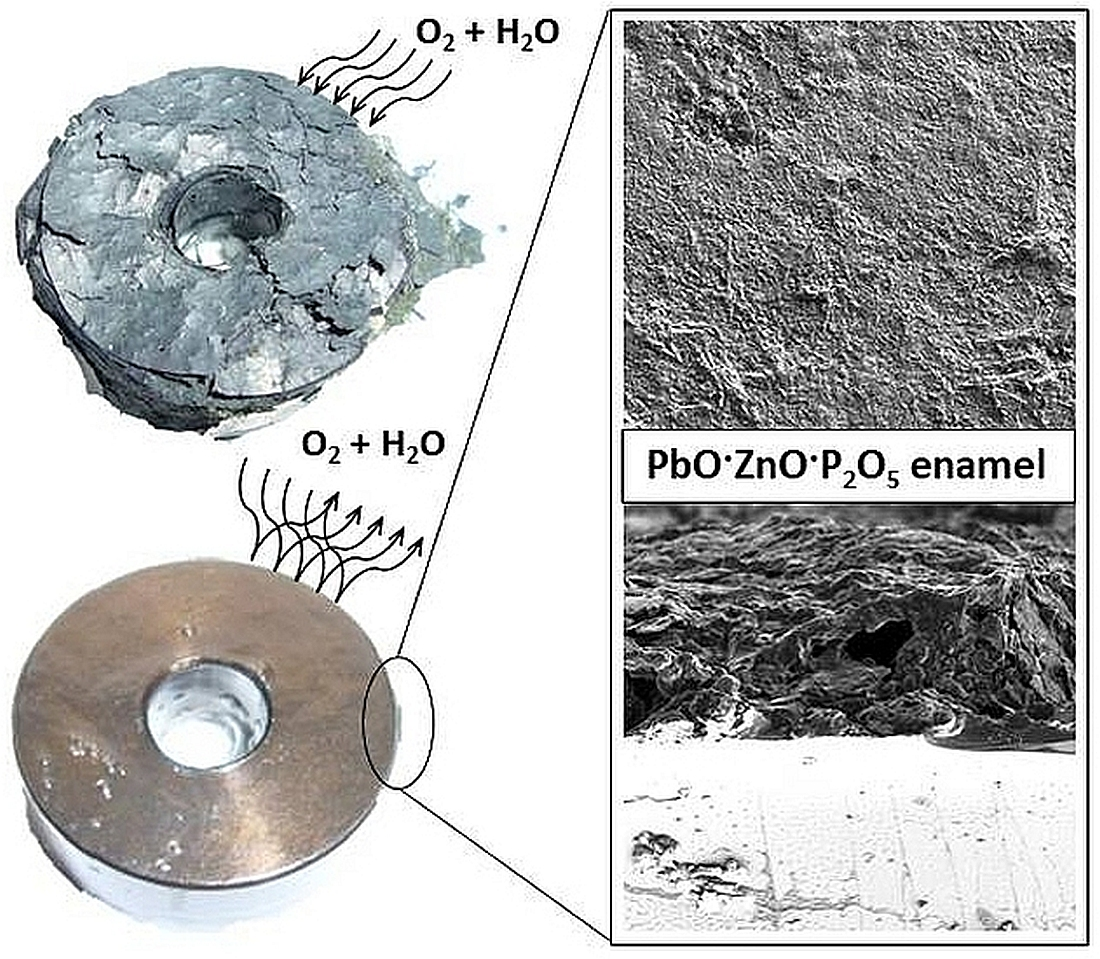
3.5. The Corrosion Tests for DU Discs Coated with PbO·ZnO·P2O5 Glass Layers

As the fillers are the source of paramagnetic species per se, and, additionally, the size of the graphite PMM 11 powder is not suitable for spray coating, the DU discs were coated by the spraying of pure fine glass powder to achieve a coverage of 6.5 mg/cm2 (referred to below as a single layer) and the coverage was doubled to a value of 13 mg/cm2 (referred to below as a double layer). The DU discs, both coated and noncoated, used as a reference, were fired at 440 °C under vacuum and placed in an oven at an elevated temperature of 115 °C for an accelerated corrosion test.
The weight of the reference DU disc is observed to increase linearly over all experimental times, and the corrosion rate is determined to be 304.3 ± 1.2×10⁻⁴ mg/cm2·h (R2 = 0.999) (Figure 6). The DU discs coated with thin and thick layers demonstrate a fivefold inhibition of the corrosion rate during the first 300 h down to 54.7 ± 3.2×10⁻⁴ mg/cm2·h (R2 = 0.979) and 62.6 ± 7.4×10⁻⁴ mg/cm2·h (R2 = 0.921), respectively. After 300 h, the corrosion rate is increased to 272.6 ± 7.6×10⁻⁴ mg/cm2·h (R2 = 0.998) and 221.1 ± 3.8×10⁻⁴ mg/cm2·h (R2 = 0.999) for thin and thick layers, respectively, approaching the value obtained for the reference DU disc. Since there is no significant change in the corrosion rate for the layers of different thicknesses, we conclude that the corrosion of coated DU discs occurs because of the point defects formed in the layer deposited by spraying (Figure 4h,k), rather than a deterioration of the protective properties for the glass material itself.

4. Conclusions

With this work, the authors demonstrate the approach for the coatings of depleted uranium products of arbitrary shapes. A low-melting lead zinc phosphate glass is found to be suitable for the creation of a two-compound mixture for spraying onto the surface of depleted uranium, using ethanol as a liquid phase without binders. The sprayed powders are fired at a relatively low temperature of 440 °C to form a continuous film on the uranium surface, which inhibits corrosion processes in comparison with a noncoated surface. The exact morphology of the enamel layer is complex: initial powder grains are sintered into the film at a temperature above Tg, with the grain cores remaining intact. The material of the glass frit is obtained as an amorphous solid, but it undergoes partial crystallization at the firing temperature, with the film integrity fully preserved. The coating is resistant to high doses of γ-radiation. We achieved a fivefold inhibition of the corrosion rate for depleted uranium.

Supplementary Materials

The following supporting information can be downloaded at https://www.mdpi.com/article/10.3390/coatings12101540/s1, Figure S1: Scheme for the in-house-built stirred media mill; Figure S2: Enamel firing temperature vs. time; Figure S3: XRD patterns for the layers obtained from the coarse glass powder with fillers; Figure S4: Macroscopic images of the layers obtained from the coarse glass powder with fillers on tungsten discs.

Author Contributions

Conceptualization, glass frit cooking, glass comminution, coating of tungsten and uranium, data processing, writing—original draft preparation, V.L.; XRD, M.K.; FTIR and FT-Raman spectroscopy, N.K.; ESR spectroscopy, M.L.; SEM and EDX, J.H.; optical microscopy, M.Š.; resources, project administration, J.P.; conceptualization, writing—review and editing, M.H.; corrosion tests, microhardness tests; preparation of uranium and tungsten ingots, T.C.; conceptualization, funding acquisition, project administration, P.K. All authors have read and agreed to the published version of the manuscript.

Funding

This work was supported by the Ministry of Industry and Trade of CR within the TRIO Program (project FV10164) and by the Ministry of Education, Youth and Sports (project LM2018133).

Institutional Review Board Statement

Not applicable.

Informed Consent Statement

Not applicable.

Data Availability Statement

Not applicable.

Acknowledgments

The authors thank Ing. Pavel Roubíček from České lupkové závody a.s. for wet grinding and laser diffraction experiments and Michaela Vyroubalová for the DSC.

Conflicts of Interest

The authors declare no conflict of interest.

References

  1. Schimmack, W.; Gerstmann, U.; Schultz, W.; Geipel, G. Long-term corrosion and leaching of depleted uranium (DU) in soil. Radiat. Environ. Biophys. 2007, 46, 221–227. [Google Scholar] [CrossRef] [PubMed]
  2. Wang, Y.; Von Gunten, K.; Bartova, B.; Meisser, N.; Astner, M.; Burger, M.; Bernier-Latmani, R. Products of In Situ Corrosion of Depleted Uranium Ammunition in Bosnia and Herzegovina Soils. Environ. Sci. Technol. 2016, 50, 12266–12274. [Google Scholar] [CrossRef] [PubMed] [Green Version]
  3. Malard, V.; Gaillard, J.C.; Bérenguer, F.; Sage, N.; Quéméneur, E. Urine proteomic profiling of uranium nephrotoxicity. Biochim. Biophys. Acta Proteins Proteom. 2009, 1794, 882–891. [Google Scholar] [CrossRef]
  4. Vicente-Vicente, L.; Quiros, Y.; Pérez-Barriocanal, F.; López-Novoa, J.M.; López-Hernández, F.J.; Morales, A.I. Nephrotoxicity of uranium: Pathophysiological, diagnostic and therapeutic perspectives. Toxicol. Sci. 2010, 118, 324–347. [Google Scholar] [CrossRef] [Green Version]
  5. Qi, L.; Basset, C.; Averseng, O.; Quéméneur, E.; Hagège, A.; Vidaud, C. Characterization of UO22+ binding to osteopontin, a highly phosphorylated protein: Insights into potential mechanisms of uranyl accumulation in bones. Metallomics 2014, 6, 166–176. [Google Scholar] [CrossRef]
  6. Bourgeois, D.; Burt-Pichat, B.; Le Goff, X.; Garrevoet, J.; Tack, P.; Falkenberg, G.; Van Hoorebeke, L.; Vincze, L.; Denecke, M.A.; Meyer, D.; et al. Micro-distribution of uranium in bone after contamination: New insight into its mechanism of accumulation into bone tissue. Anal. Bioanal. Chem. 2015, 407, 6619–6625. [Google Scholar] [CrossRef] [PubMed]
  7. Quapp, W.J.; Lessing, P.A. Radiation Shielding Composition. U.S. Patent 6,166,390, 26 December 2000. [Google Scholar]
  8. Mattus, C.H.; Dole, L.R. Durability of depleted uranium aggregates in ducrete shielding applications. In Proceedings of the 10th International Conference on Environmental Remediation and Radioactive Waste Management, ICEM’05, Glasgow, Scotland, 3–8 September 2005; Volume 2005, pp. 1820–1827. [Google Scholar]
  9. Derrington, S.B.; Marsicek, M.J.; Thompson, J.E. Prototype Shield Plug Fabrication at the Oak Ridge Y-12 Plant. In Proceedings of the Sixth Annual International Conference on High Level Radioactive Waste Management, Las Vegas, NV, USA, 30 April–5 May 1995; pp. 707–709. [Google Scholar]
  10. Ryang, H.; Cited, R.; Schofer, P.E.L.; Smith, A.E.T. Method of Making Particulate Uranium for Shaped Charge Liners. U.S. Patent US4592790A, 3 June 1986. [Google Scholar]
  11. Weirick, L.J.; Lynch, C.T. Corrosion Resistant Coatings for Uranium and Uranium Alloys. In Proceedings of the Corrosion/77 NACE Meeting, San Francisco, CA, USA, 14–18 March 1977. [Google Scholar]
  12. Chang, F.; Levy, M.; Jackman, B.; Nowak, W.B. Assessment of corrosion-resistant coatings for a depleted uranium-0.75 titanium alloy. Surf. Coat. Technol. 1991, 48, 31–39. [Google Scholar] [CrossRef]
  13. Schroeder, J.B.; Vaughan, D.A.; Schwartz, C.M. Aqueous Uranium Corrosion at 100 °C. J. Electrochem. Soc. 1959, 106, 486. [Google Scholar] [CrossRef]
  14. Allen, G.C.; Holmes, N.R. The passivation of uranium metal surfaces by nitrogen bombardment—The formation of uranium nitride. J. Nucl. Mater. 1988, 152, 187–193. [Google Scholar] [CrossRef]
  15. Nelson, A.J.; Felter, T.E.; Wu, K.J.; Evans, C.; Ferreira, J.L.; Siekhaus, W.J.; McLean, W. Uranium passivation by C+ implantation: A photoemission and secondary ion mass spectrometry study. Surf. Sci. 2006, 600, 1319–1325. [Google Scholar] [CrossRef]
  16. Parida, S.C.; Dash, S.; Singh, Z.; Prasad, R.; Venugopal, V. Thermodynamic studies on uranium-molybdenum alloys. J. Phys. Chem. Solids 2001, 62, 585–597. [Google Scholar] [CrossRef]
  17. Paukov, M.; Tkach, I.; Huber, F.; Gouder, T.; Cieslar, M.; Drozdenko, D.; Minarik, P.; Havela, L. U-Zr alloy: XPS and TEM study of surface passivation. Appl. Surf. Sci. 2018, 441, 113–119. [Google Scholar] [CrossRef]
  18. Henderson, G.S. The structure of silicate melts: A glass perspective. Can. Mineral. 2005, 43, 1921–1958. [Google Scholar] [CrossRef] [Green Version]
  19. Naito, T.; Aoyagi, T.; Sawai, Y.; Tachizono, S.; Yoshimura, K.; Hashiba, Y.; Yoshimoto, M. Lead-Free Low-Melting and Semiconductive Vanadate Glass Applicable to Low-Temperature Sealing. Jpn. J. Appl. Phys. 2011, 50, 88002. [Google Scholar] [CrossRef]
  20. Brow, R.K. Review: The structure of simple phosphate glasses. J. Non Cryst. Solids 2000, 263, 1–28. [Google Scholar] [CrossRef]
  21. Smedskjaer, M.M.; Mauro, J.C.; Youngman, R.E.; Hogue, C.L.; Potuzak, M.; Yue, Y. Topological principles of borosilicate glass chemistry. J. Phys. Chem. B 2011, 115, 12930–12946. [Google Scholar] [CrossRef]
  22. Day, D.E.; Wu, Z.; Ray, C.S.; Hrma, P. Chemically durable iron phosphate glass wasteforms. J. Non Cryst. Solids 1998, 241, 1–12. [Google Scholar] [CrossRef]
  23. Liu, H.S.; Chin, T.S.; Yung, S.W. FTIR and XPS studies of low-melting PbO-ZnO-P2O5glasses. Mater. Chem. Phys. 1997, 50, 1–10. [Google Scholar] [CrossRef]
  24. Minamf, T.; Mackkenzie, J.D. Thermal Expansion and Chemical Durability of Phosphate Glasses. J. Am. Ceram. Soc. 1977, 60, 232–235. [Google Scholar] [CrossRef]
  25. Dousti, M.R.; Ghoshal, S.K.; Amjad, R.J.; Sahar, M.R.; Nawaz, F.; Arifin, R. Structural and optical study of samarium doped lead zinc phosphate glasses. Opt. Commun. 2013, 300, 204–209. [Google Scholar] [CrossRef]
  26. Dayanand, C.; Sarma, R.V.G.K.; Bhikshamaiah, G.; Salagram, M. Optical properties of lead phosphate glasses. J. Non Cryst. Solids 1994, 167, 122–126. [Google Scholar] [CrossRef]
  27. Wang, X.; Cai, S.; Liu, T.; Ren, M.; Huang, K.; Zhang, R.; Zhao, H. Fabrication and corrosion resistance of calcium phosphate glass-ceramic coated Mg alloy via a PEG assisted sol-gel method. Ceram. Int. 2014, 40, 3389–3398. [Google Scholar] [CrossRef]
  28. Ren, M.; Cai, S.; Liu, T.; Huang, K.; Wang, X.; Zhao, H.; Niu, S.; Zhang, R.; Wu, X. Calcium phosphate glass/MgF2 double layered composite coating for improving the corrosion resistance of magnesium alloy. J. Alloys Compd. 2014, 591, 34–40. [Google Scholar] [CrossRef]
  29. Beghi, G. Gamma Phase Uranium-Molybdenum Alloys; Technical Report of European Atomic Energy Community; EURATOM Joint Nuclear Research Center: Ispra, Italy, 1968. [Google Scholar]
  30. Aboud, H. Enhanced luminescence of Er+3-doped Zinc-Lead-Phosphate Glass embedded SnO2 nanoparticles. J. Nanostruct. 2016, 6, 179–183. [Google Scholar]
  31. Carta, D.; Pickup, D.M.; Knowles, J.C.; Ahmed, I.; Smith, M.E.; Newport, R.J. A structural study of sol-gel and melt-quenched phosphate-based glasses. J. Non Cryst. Solids 2007, 353, 1759–1765. [Google Scholar] [CrossRef]
  32. Sun, C.; Xue, D. In situ iR spectral observation of NH4H2PO4 crystallization: Structural identification of nucleation and crystal growth. J. Phys. Chem. C 2013, 117, 19146–19153. [Google Scholar] [CrossRef]
  33. Chowdhury, S.; Mandal, P.; Ghosh, S. Structural properties of Er3+ doped lead zinc phosphate glasses. Mater. Sci. Eng. B Solid State Mater. Adv. Technol. 2019, 240, 116–120. [Google Scholar] [CrossRef]
  34. Le Saoût, G.; Simon, P.; Fayon, F.; Blin, A.; Vaills, Y. Raman and infrared study of (PbO)x(P2O5)(1−x) glasses. J. Raman Spectrosc. 2002, 33, 740–746. [Google Scholar] [CrossRef]
  35. Lobaz, V.; Konefał, M.; Kotov, N.; Lukešová, M.; Hromádková, J.; Šlouf, M.; Pánek, J.; Hrubý, M.; Chmela, T.; Krupička, P. Low-melting phosphate glass for corrosion protection of depleted uranium. Chem. Listy 2020, 114, 411–415. [Google Scholar]
  36. Cataldo, F.; Putz, M.V.; Ursini, O.; Angelini, G.; Garcia-Hernandez, D.A.; Manchado, A. A new route to graphene starting from heavily ozonized fullerenes: Part 3-An electron spin resonance study. Fuller. Nanotub. Carbon Nanostruct. 2016, 24, 195–201. [Google Scholar] [CrossRef]
  37. Matori, K.A.; Sayyed, M.I.; Sidek, H.A.A.; Zaid, M.H.M.; Singh, V.P. Comprehensive study on physical, elastic and shielding properties oflead zinc phosphate glasses. J. Non-Cryst. Solids 2017, 457, 97–103. [Google Scholar] [CrossRef]
Figure 1. FTIR (a) and FT-Raman (b) spectra for PbO·ZnO·P2O5 glass. Reprinted with permission from [35]. 2020, Czech Chemical Society.
Coatings 12 01540 g001
Figure 2. DSC for coarse powder (a) and XRD for coarse and fine powders and fired layers (b). Reprinted with permission from [35]. 2020, Czech Chemical Society.
Coatings 12 01540 g002
Figure 3. SEM micrographs of initial PbO·ZnO·P2O5 coarse powder (a), after milling in water for 7 h (b) 12 h (c) and 24 h (d); volume weighted cumulative size distributions for glass powders (e) (lines—obtained from SEM micrographs, scatter—obtained from laser diffraction) and typical EDX for coarse powder (f).
Coatings 12 01540 g003
Figure 4. Morphology of fired PbO·ZnO·P2O5 glass layers. LM micrographs for the layers from (a) pure coarse powder, (b) with 2 wt.% graphite, (c) fine powder; the surface roughness maps for the layer from (d) coarse powder with 2 wt.% graphite, (e) fine powder layer and their z-profiles (f); SEM micrographs for the layer from (g) coarse powder, (h) fine powder layer top, and cross-section (i).
Coatings 12 01540 g004
Figure 5. ESR spectra for fired PbO·ZnO·P2O5 coarse glass before (a) and after (b) 0.9 MGy γ-irradiation. 1—pure glass; 2—with 2 wt.% graphite PMM 11; 3—with 10 wt.% graphite PMM 11; 4—with 2 wt.% Cloisite 30B; 5—with 10 wt.% Cloisite 30B.
Coatings 12 01540 g005
Figure 6. Increase in DU disc weight with time at 115 °C and ambient atmosphere (a); prototype DU construction part coated with lead zinc phosphate enamel (b). Reprinted with permission from [35]. 2020, Czech Chemical Society.
Coatings 12 01540 g006
Table 1. Parameters for the volume-weighted cumulative PSDs of PbO·ZnO·P2O5 glass powders prepared after different stages of grinding.
Sampledv50 (µm)dv90 (µm)dv95 (µm)dv99 (µm)
dry ground powder 114117200250
after the 71 µm sieve 1156485120
after 7 h of wet grinding, H2O 235455176
after 12 h of wet grinding, H2O 29111519
after 24 h of wet grinding, H2O 20.480.540.710.83
after 2 h of wet grinding in ethanol 16214076
1 measured by laser diffraction; 2 calculated from SEM micrographs.
Publisher’s Note: MDPI stays neutral with regard to jurisdictional claims in published maps and institutional affiliations.

