Electrochemical Corrosion Behavior of Pure Mg Processed by Powder Metallurgy
by
 , , , and
Jozef Minda
1,*, 
Stanislava Fintová
1,2,
Branislav Hadzima
1,3,
Pavel Doležal
1,4,
Michaela Hasoňová
1,
Leoš Doskočil
1 and
Jaromír Wasserbauer
1 1
Institute of Materials Science, Faculty of Chemistry, Brno University of Technology, Purkyňova 464/118, 612 00 Brno, Czech Republic
2
Institute of Physics of Materials, Czech Academy of Sciences, Žižkova 22, 616 00 Brno, Czech Republic
3
University of Žilina Research Centre, Univerzitná 8215/1, 010 08 Žilina, Slovakia
4
Institute of Materials Science and Engineering, Faculty of Mechanical Engineering, Brno University of Technology, Technická 2896/2, 616 69 Brno, Czech Republic
*
Author to whom correspondence should be addressed.
Coatings 2021, 11(8), 986; https://doi.org/10.3390/coatings11080986
Submission received: 3 June 2021
/
Revised: 11 August 2021
/
Accepted: 16 August 2021
/
Published: 19 August 2021
(This article belongs to the Special Issue Electrochemical and Corrosion Behavior of Promising Metallic Materials in the Field of Recent Research)
Abstract
:Pure Mg samples were prepared by powder metallurgy using the cold and hot compacting methods. Cold compacted pure Mg (500 MPa/RT) was characterized by 5% porosity and the mechanical bonding of powder particles. Hot compacted samples (100 MPa/400 °C and 500 MPa/400 °C) exhibited porosity below 0.5%, and diffusion bonding combined with mechanical bonding played a role in material compaction. The prepared pure Mg samples and wrought pure Mg were subjected to corrosion tests using electrochemical impedance spectroscopy. Similar material corrosion behavior was observed for the samples compacted at 500 MPa/RT and 100 MPa/400 °C; however, hot compacted samples processed at 500 MPa/400 °C exhibited longer corrosion resistance in 0.9% NaCl solution. The difference in corrosion behavior was mainly related to the different binding mechanisms of the powder particles. Cold compacted samples were characterized by a more pronounced corrosion attack and the creation of a porous layer of corrosion products. Hot compacted samples prepared at 500 MPa/400 °C were characterized by uniform corrosion and the absence of a layer of corrosion products on the specimen surface. Powder-based cold compacted samples exhibited lower corrosion resistance compared to the wrought pure Mg, while the corrosion behavior of the hot compacted samples prepared at 500 MPa/400 °C was similar to that of wrought material.
1. Introduction
The Mg-based alloys used in the automotive and aerospace industries exhibit good specific strength [1], and studies on them have focused on the reduction of the weight of the components and the subsequent economic and ecological savings. On the other hand, due to their biocompatibility, biodegradability, and nontoxicity, the Mg-based materials are often used also for biomedical applications. In comparison with other metallic materials used for biomedical applications (stainless steel and Ti alloys) is the biggest advantage of Mg the mechanical properties very similar to the properties of human bones [1,2,3,4]. While the mechanical properties of a material are mostly predetermined by its nature and structure, influencing the material structure by its processing and by mechanical and thermal treatment are the most useful methods for their tailoring [3,5]. One of the methods quite easily used for the production of components with specific structures and thanks to the possibility of processing different materials also with specific chemical composition is powder metallurgy (PM). The PM methods allow the tailoring of component mechanical properties due to the large range of applicable pressures, temperatures, distribution of pores and their sizes or shapes, and finally processing times it employs [1,6].
PM has already been proven to be a suitable method for the preparation of Mg-based materials [7,8,9]. Several approaches of powder production, powder consolidation, and sintering techniques were already published in the literature. In the case of Mg, the gas atomized powder is usually used, while homogeneous blending with alloying elements can be adopted [7]. The powder is usually compacted at high pressure and the green compacts are sintered in a specific (mostly inert) atmosphere under a temperature high enough for diffusion between particles but below the melting point [7] of the used materials. Processing methods such as compression followed by sintering, extrusion, severe plastic deformation (SPD), or spark plasma sintering (SPS) methods often appear in the literature [1,10,11] for Mg-based materials preparation. Mg’s high reactivity is a factor strongly influencing its processing via PM. Since the powder particles react with the atmosphere, a thick layer of oxides is usually present on the surface of the particles (even thicker in the case of the powder prepared by grinding) acting as a barrier against diffusion. The layer is usually damaged during powder compaction and during the sintering, the diffusion is allowed, at least partially [7]. The compacting pressure has to be sufficient to damage the oxide layer created on the particles and to provide plastic deformation of the powder particles ensuring their interlocking. However, it must not be too high to avoid the deformation of the spacer particles, ensuring the requested porosity, if they are used. The sintering time must be short enough to prevent unwanted chemical changes and at the same time long enough to successfully bond the particles and stabilize the system against stresses in the materials [6,12]. Another method of powder compaction is extrusion. In the case of Mg, the elevated temperature has to be used during extrusion [13]. In such a case, the strong texture resulting in final component anisotropy was shown to be suppressed by powder milling before compaction. The temperature has also an effect on the reached structure while higher temperatures can be resulting in the structure coarsening. Thus the choice of processing parameters has a significant effect on the product properties and porosity, and they have to be set precisely according to the demanded properties of the product.
The porosity of the final product depends on the PM processing conditions and can even be enhanced by the addition of pore-forming agents [1]. Porosity can be beneficial in the case of implants with mechanical properties close to those of human bone [6]. Moreover, the introduced porosity enables fluid transport for healing, and new bone tissue can be incorporated into the implant [6]. Porous PM materials are usually prepared with a density of 25–85% of the theoretical mean density [7]. At the same time, porosity has to be considered from the point of view of the mechanical and corrosion properties of the component. The porosity of PM-processed Mg and Mg-based materials decreases mechanical properties and corrosion resistance and increases the corrosion rate by allowing the corrosion environment to penetrate the pores [6,14,15,16,17].
As mentioned above, the PM processing of magnesium is limited by its high affinity to oxygen and high corrosion rate, especially in Cl− containing environments [3]. Mg dissolves many more oxygen atoms compared to other metals, such as titanium; on the other hand, it creates a thermodynamically stable MgO layer [18]. The layer created on Mg powder particles before processing usually contains not only MgO but also Mg(OH)2. The naturally created oxide layer is loose and cannot provide sufficient protection for Mg against corrosion [4]. This layer also has a negative influence on the diffusion process required for the densification of the material during powder sintering (diffusion bonding) [18]. The formation and dissolution of a surface layer of corrosion products are primarily determined by the electrochemical potential of the material. The magnitude of the difference between the electrochemical potential of the material and the corrosive environment expresses the thermodynamic susceptibility to the anodic dissolution of the layer of corrosion products. The anodic polarization of Mg can alter the integrity and stability of the surface layer, making Mg more active or passive. It has been reported that the continuity/integrity of the surface layer can determine the negative difference effect (NDE) or “anodic hydrogen evolution” (AHE) behavior of anodically polarized Mg [19].
Properties of Mg and Mg-based materials can be improved by the preparation of ultrapure Mg and by the alloying of Mg, respectively [3,4,7,13,20,21]. It has already been shown that the zinc content in Mg-based materials and PM-processed materials has a positive effect on their mechanical properties due to grain refinement and the improvement of material corrosion properties [22,23,24]. Mechanical properties can also be improved by the addition of 2 wt.% ytterbium. Likewise, additional mechanical treatment such as hot rolling can lead to improved material mechanical properties [20]. Composites of Mg/Ca prepared from pure magnesium and calcium (1 wt.%) powders using PM had a positive influence on the tensile strength and the corrosion resistance of the material; however, higher Ca content (5 wt.% and 10 wt.%) resulted in a deterioration of the examined material properties [21]. Even though the properties of PM-processed Mg-based materials are improved by the addition of an alloying element, the biocompatibility, biodegradability, and nontoxicity of the final material have to be taken into account for biomedical applications. Thus, the alloying elements have to be chosen carefully. Besides the alloying, also coatings can be used to improve Mg corrosion resistance in the case of bioapplications. Since the MgF2-based coatings were shown to be promising in several works [2,4,22,25,26,27,28,29], PM was already used for the preparation of magnesium Mg-MgF2 composite [30]. Preparation of magnesium-based composites by powder metallurgy could be therefore a suitable option to significantly improve the corrosion properties of magnesium materials [31].
To study and describe the corrosion mechanism of alloyed and coated materials, the influence of the processing parameters—specifically, compacting pressure and temperature—on pure PM-prepared Mg needs to be understood. The goal of this work is to investigate the corrosion behavior of pure Mg materials prepared by PM through cold and hot pressing in an environment of 0.9 wt.% NaCl, this environment being the simplest saline solution to simulate body fluid. Such an approach allows a better understanding of the role of chlorides in the corrosion process and observation of the different corrosion behaviors of materials prepared by PM. The corrosion resistance of cold-compacted samples processed at 500 MPa at room temperature and that of hot-compacted samples processed at 100 MPa at 400 °C and at 500 MPa at 400 °C were analyzed in 0.9 wt.% NaCl solution using electrochemical impedance spectroscopy. The processing parameters were chosen based on the previous studies [16], focused on material porosity and mechanical properties of pure Mg prepared via PM. One sample prepared at RT and one at elevated temperature were chosen for the corrosion properties characterization. The corrosion behavior of these samples was compared to the behavior of wrought pure Mg, considered as reference material with known corrosion behavior and resistance in NaCl solutions.
2. Materials and Methods
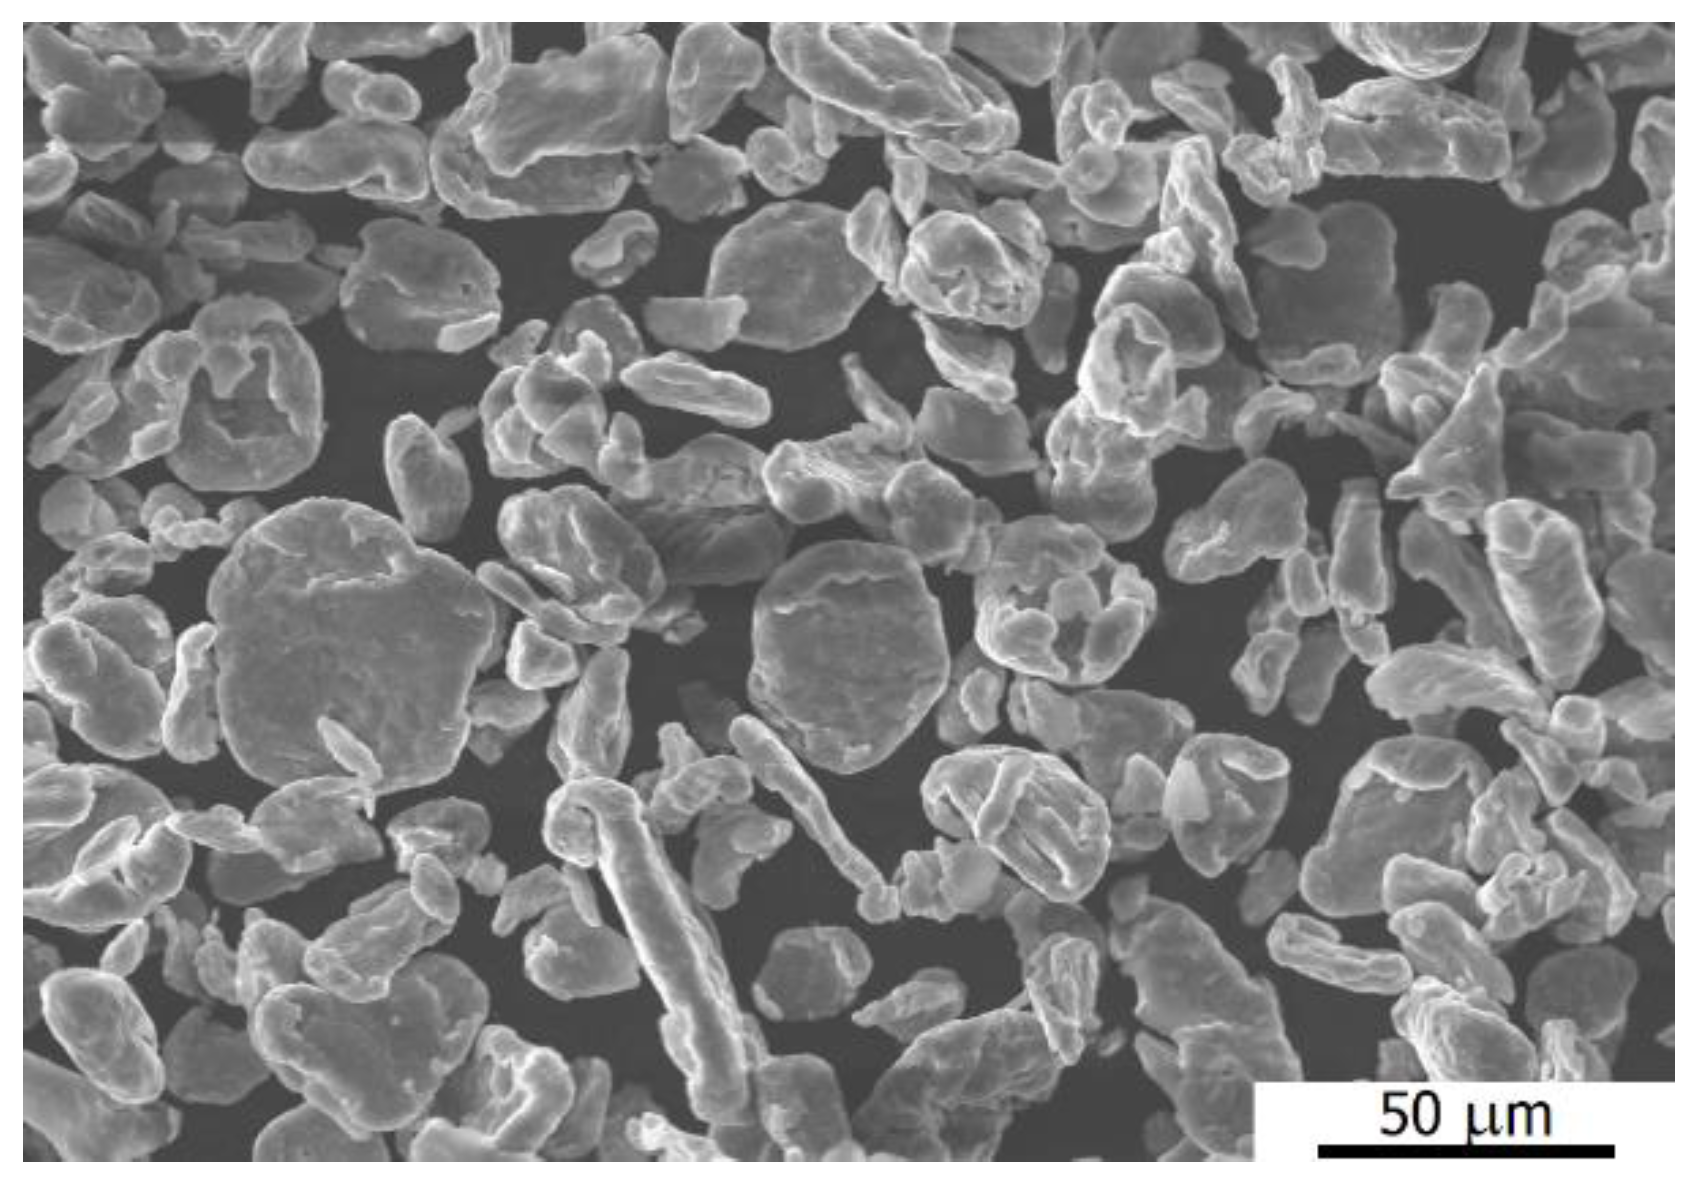
Compacted samples (CS) of pure Mg prepared via PM were used as the experimental material. Scanning electron microscopy (SEM; ZEISS EVO LS 10, Oberkochen, Germany) was used to characterize the powder particles. Irregular shaped Mg powder (99.8% purity declared by the producer, Goodfellow (Huntingdon, UK)) with an average particle size of approximately 30 µm (Figure 1—observed by SEM) was processed by cold compaction (compacted at room temperature (RT)) and hot compaction (400 °C). Due to the contact of the powder with air during powder preparation and transport, the Mg powder particles used for CS production were covered by a thin layer of corrosion products. This layer protected the powder against further reactions with oxygen.
A steel die was employed for the transfer and compaction of Mg powder (2.7 g) used for sample preparation. The steel die was filled with Mg powder in an inert atmosphere of N2 (5.0 purity); then the die was transported to the machine for double-action compaction and pressed with a velocity of 2 mm·min−1. CS (experimental materials) was prepared using a Zwick Z250 Allround-Line machine (Zwick GmbH&Co. KG in Germany, Ulm, Germany) equipped with a MultiXtens sensitive extensometer (Zwick GmbH&Co. KG in Germany, Ulm, Germany) set between the pressing plates. The die filled with Mg powder was pressed for 20 s at RT under a pressure of 500 MPa, or for 1 h at 400 °C under pressures of 100 MPa or 500 MPa. In the case of Mg pressed at an elevated temperature, a heating chamber was arranged on the machine. After processing, the CS was removed from the steel die. The final CS was 20 mm in diameter and 5 mm in height.
Metallographic analysis of the CS was performed using light microscopy (LM, Zeiss Axio Observer Z1m, Zeiss, Oberkochen, Germany) and SEM (ZEISS, Oberkochen, Germany). LM was used for microstructural observation of the prepared samples, to estimate material porosity and its distribution and reveal the corrosion attack and corrosion process mechanism. SEM was used for CS microstructure analysis to specify the powder particle bonding mechanism. Analysis of the layer of corrosion products created on the impacted surface during electrochemical testing was performed using a ZEISS Stemi 2000C stereomicroscope (SM, Zeiss, Oberkochen, Germany). The samples used for microscopical observations were prepared by the standard metallographic procedure involving grinding and polishing using isopropyl alcohol as a cooling medium to prevent Mg CS corrosion during preparation. Nital etchant (5% nitric acid in ethanol) was used to reveal the material microstructure for SEM analysis. The exact value of porosity of the CS was calculated according to the dimensions and mass of the sample and the density of pure Mg.
Electrochemical corrosion testing was conducted using a VSP-300 potentiostat (Biologic, Seyssinet-Pariset, France) three-electrode cell was used for the electrochemical measurement, using a Pt electrode as the counter electrode, a saturated calomel electrode (SCE) as the reference electrode, and the compacted sample (1 cm2 exposed area) as the working electrode. Electrochemical impedance spectroscopy (EIS) was used for the characterization of material electrochemical corrosion behavior. For corrosion experiments, the surfaces of samples were ground with 4000 grit SiC paper; then, the samples were rinsed with distilled water and isopropanol. Hot air was used for drying. Immediately after sample preparation, electrochemical experiments were conducted in a corrosive environment. Measurements were carried out in 0.9% NaCl solution at RT. All measurements were performed in potentiostatic mode at an open circuit potential (OCP), and the used frequency range was from 100 kHz to 10 mHz with 6 points per decade, with a sinusoidal signal input of amplitude 10 mV. EIS measurements were performed at the following time points after the beginning of exposure to the corrosion environment: 0, 1, 2, 4, 8, 12, 24, 48, 72, and 96 h; before each EIS measurement, an OCP step was included, and the measurement started after 5 min of system stabilization. EIS measurements were performed on two CS for each processing method. The models described by King et al. [32] were applied to the analysis of the obtained electrochemical data. Energy-dispersive X-ray spectroscopy (EDS, model OXFORD INSTRUMENTS X-MAX 80 mm2) was used to examine the surface of the samples after electrochemical testing to specify the character of the corrosion products. The crosscuts of the samples after the testing were analyzed in terms of SEM to reveal the corrosion progress within the material bulk.
All the obtained results were compared to the data obtained by analysis of wrought pure Mg (Goodfellow, UK) delivered in a form of an as-drawn rod with a diameter of 50 mm, length of 500 mm with a chemical composition of 99.9 % Mg (provided by the producer).
3. Results
3.1. Microstructural Observation
The analyzed microstructures of wrought magnesium and CS are shown in Figure 2. The inserts in Figure 2 provide information about powder particles boundaries showing the present oxide layer and closed porosity. The wrought Mg microstructure was characterized by polyhedral grains with an average grain size of 55 ± 9 μm (Figure 2a). As a result of material preparation, deformation twins were observed in some grains of wrought pure Mg.
Some differences in the microstructures of the CS can be seen in Figure 2. Increasing the compaction temperature resulted in more pronounced deformation of the powder particles during processing, this effect even more obvious in the case of the higher compaction pressure used.
The details in Figure 2 reveal a change in the powder particle bonding mechanism from mechanical bonding to a combination of mechanical bonding and solid-state diffusion between particles (100 and 500 MPa at 400 °C, Figure 2c,d). In the case of elevated temperature processing, a lower contribution of the diffusion mechanism to Mg powder particle bonding is assumed at the lower compaction pressure (100 MPa) compared to the higher pressure (500 MPa). The change in bonding mechanism at elevated temperature results in better compaction of the material and lower material porosity, Figure 2c,d (SEM details).
The porosity of the cold CS was 4% ± 1%, and the porosity of the hot CS was less than 1.0% ± 0.5%. All of the prepared samples were characterized by closed porosity with a pore size lower than 10 µm. The pores present between compacted Mg powder particles can be seen in SEM details of the microstructures of the prepared samples, shown in Figure 2.
3.2. Electrochemical Corrosion Characteristics
The results of EIS measurements represented by Nyquist plots for individual CS performed for the time series from 0 h (measured after 5 min of stabilization of the system) to 96 h of exposure to 0.9% NaCl solution are shown in Figure 3.
A total of three equivalent circuits (Figure 4) were used to fit the obtained Nyquist plot curves. The values determined for the electrochemical corrosion characteristics of wrought Mg and CS are given in Table 1, Table 2, Table 3 and Table 4.
The equivalent circuits used to describe the corrosion behavior of the analyzed samples consisted of different elements used for the description of different chemical processes. If no inductive response of the material was observed on the polarization curve, a simplified Randles circuit was used for data analysis, as shown in Figure 4a. The equivalent circuit presented in Figure 4a consists of elements representing the solution resistance Rs, the constant phase element (CPE) of the present corrosion layer Q1, and the polarization resistance Rp.
The equivalent circuit shown in Figure 4b consists of components representing the solution resistance Rs, the constant phase element (CPE) of the present corrosion layer Q2, the resistance of the capacitance part R2, the inductance L3 (the time-independent part of the circuit characterizing the inductive loop of the curve), and the resistance R3 of the inductive loop. The resulting polarization resistance Rp is given by Equation (1):
The equivalent circuit shown in Figure 4b describes two corrosion processes simultaneously running on the surface of the sample. R2 and Q2 values characterize the layer of corrosion products created on the sample surface consisting of MgO and/or Mg(OH)2. R3 and L3 values describe the adsorption of intermediate Mg+ or other species occurring in the solution. This can be observed in the Nyquist plot curve as the low-frequency inductive loop. Intermediate Mg+ has its origin in the corrosion reaction of magnesium and the solution and is connected with the phenomenon of the so-called negative difference effect for Mg corrosion (NDE) [33,34].
The equivalent circuit shown in Figure 4c consists of three time-independent loops. There are two capacitance loops (represents by CPE) for high and intermediate frequencies and one low-frequency inductive loop. The element Rs characterizes the solution resistance, and Q2 and R2 CPEs are used in the equivalent circuit and represent the capacitance and resistance of the layer of corrosion products, respectively. Q3 and R3 are CPEs describing the resistance of the inner porous layer. Elements of the low-frequency inductive loop are inductance L4 and the resistance of the inductor R4. The resulting polarization resistance of the system is given by Equation (2):
The third used equivalent circuit described the simultaneous responses of the layer of corrosion products and the base material to the used corrosion environment solution, as seen in Figure 4c. In such a situation, the corrosive medium penetrates through the porous layer of corrosion products, and the sample surface is exposed to the medium. Also, in this case, the inductive element of the circuit describes chemical reactions connected with the NDE. Besides the capacitive loop, there is, on the Nyquist plots, probably a capacitive response between the sample surface and the layer of corrosion products created on it. The two capacitance loops observed on the Nyquist plots could be explained by the creation of a partially stable layer of corrosion products over the inner porous structure of PM-processed Mg CS. The fraction coefficient n indicates the level of corrosion layer stability expressed as a measure of the non-ideality of the capacity response (n = 1 for an ideal capacity response). That is, a value of n below 1 indicates the presence of an imperfect layer of corrosion products, e.g., a layer containing pores filled with electrolyte, or that the surface is not fully covered [35].
The electrochemical corrosion behavior of wrought pure Mg samples was characterized by three types of Nyquist plot curves, as shown in Figure 3a. At the beginning and after 1 h of exposure, the corrosion behavior is described by the model of the circuit in Figure 4c. The Nyquist curve characterizing sample behavior from 2 up to 8 h of exposure to the 0.9% NaCl solution was evaluated using a simplified Randles circuit, shown in Figure 4a. The evaluation showed that no inductive response of the material was observed on the curve. The equivalent circuit shown in Figure 4b was used for the evaluation of the rest of the measured data (16–96 h). The determined electrochemical characteristics are given in Table 1.
The electrochemical corrosion behavior of PM-prepared pure Mg samples compacted at 500 MPa/RT was characterized by two types of Nyquist plot curves, as seen in Figure 3b. At the beginning of the exposure of the samples to 0.9% NaCl solution, three independent loops were observed on the curve, as seen in Figure 3b. The period of exposure between 1 and 4 h was characterized by two measured loops, and from 8 h three loops were present on the measured curve again. The measurement was stopped after 17 h of exposure due to the rapid corrosion attack and its damage. Values for the material polarization resistance, Rp, determined using appropriate equivalent circuits characterizing the obtained curves, are given in Table 2. The Nyquist plots obtained for exposure times of 0, 8, and 12 h were evaluated using the equivalent circuit shown in Figure 4c. The rest of the obtained curves (1, 2, and 4 h) were evaluated using the equivalent circuit shown in Figure 4b.
The electrochemical corrosion behavior of pure Mg CS prepared at 100 MPa/400 °C was characterized by one type of Nyquist plot curve, which can be seen in Figure 3c. From the beginning of the exposure until the end of exposure, the equivalent circuit shown in Figure 4b was used to evaluate the obtained Nyquist plots. Values for the polarization resistance, Rp, determined using the appropriate equivalent circuit are given in Table 3.
Nyquist plots characterizing the electrochemical corrosion behavior of pure Mg CS prepared at 500 MPa/400 °C exhibited two types of curves, as shown in Figure 3d. At the beginning of exposure (0–1 h) to the corrosion environment, three loops were obtained on the curves, and the equivalent circuit shown in Figure 4c was used for data evaluation. The rest of the obtained curves were evaluated using the equivalent circuit shown in Figure 4b. The polarization resistance of the hot compacted Mg samples (500 MPa/400 °C) determined using the appropriate equivalent circuits are given in Table 4.
Wrought pure Mg was characterized by a polarization resistance (Rp) of 142 Ω·cm2 at the beginning of the measurement, as seen in Table 1. This value rapidly decreased to 35 Ω·cm2 after 1 h of exposure to the NaCl solution. Further exposure resulted in an increase to 404 Ω·cm2 after 12 h and a subsequent decrease to 252 Ω·cm2 after 24 h. After this decrease, continuing exposure to the NaCl solution resulted in a further gradual increase in the polarization resistance, with a maximum value of 730 Ω·cm2 obtained after 96 h. The layer of corrosion products created on the material surface (except at 72 and 96 h of exposure) was assumed to exhibit high stability based on high corresponding n values (Table 1). The obtained electrochemical characteristics and the character of the plots indicate the creation of a layer of corrosion products at the beginning of exposure (0 h), with the layer gradually becoming damaged (1 h) and then gradually being recreated (2–8 h). After 12 h of exposure, the layer of corrosion products was created on the material surface, and its protection can be assumed up to 72 h with NDE an accompanying process of the corrosion process. After 96 h of exposure, the plot character changed. This indicates that the layer was damaged and that the revealed surface of the sample was exposed to the environment, causing a new layer of corrosion products to begin to grow.
Cold compacted Mg samples (500 MPa/RT) were characterized by a polarization resistance (Rp) of 43 Ω·cm2 at the beginning of the measurement, as seen in Table 2. The resistance of the samples remained almost unchanged up to 4 h of exposure to 0.9% NaCl solution. From 8 to 12 h of exposure, the polarization resistance increased from 118 to 151 Ω·cm2. As can be seen in Table 2, quite low values of n2 for the layer of corrosion products and n3 for the inner porous layer suggest that these layers created on the PM CS surface were not very stable. The obtained data also indicate the growth of a porous layer of corrosion products on the sample surface at the beginning of the exposure, accompanied by NDE, with a quite compact layer of corrosion products created after 1 h of exposure. Further exposure to the corrosion environment resulted in layer damage, detected after 8 h of exposure. The layer did not grow significantly with increasing exposure time. After 12 h of exposure, a porous layer of corrosion products can be assumed to have been present on the compacted sample surface. The measurement was terminated prematurely after 17 h because the sample was completely corroded.
Hot compacted Mg samples prepared at 100 MPa/400 °C were characterized by a polarization resistance of 79 Ω·cm2 at the beginning of the exposure, as shown in Table 3. This value then increased slowly to 111 Ω·cm2 after 12 h of exposure. As in the previous case, the measurement was terminated prematurely after 12 h due to the complete degradation of the sample. The value of n2 presented in Table 3 indicates quite good stability of the layer of corrosion products up to 2 h of exposure. Increasing the time of contact between the sample surface and the 0.9% NaCl solution resulted in a decrease in the n2 value, corresponding to the lower stability of the created layer. The same character of the plots over the whole of the measurement time indicates the stable response of the CS to the corrosion environment. A layer of corrosion products can be assumed to have been present on the compacted sample surface according to the character of the measured Nyquist plots. The plots’ character indicates the creation of a layer of corrosion products accompanied by NDE.
The polarization resistance of the CS prepared at 500 MPa/400 °C rapidly increased from 40 to 160 Ω·cm2 during early immersion (5 min–1 h), after which it decreased slowly to a value of 102 Ω·cm2, determined after 8 h of exposure. Further exposure resulted in an increase to 307 Ω·cm2 after 12 h. From 24 to 96 h of exposure, the polarization resistance decreased from 116 to 91 Ω·cm2, respectively (Table 4). The electrochemical response of the CS to the corrosion environment indicates the creation of a porous layer of corrosion products at the beginning of exposure, with the layer becoming more stable and compact after 2 h of exposure. The presence of NDE was detected during the entirety of the measurement time.
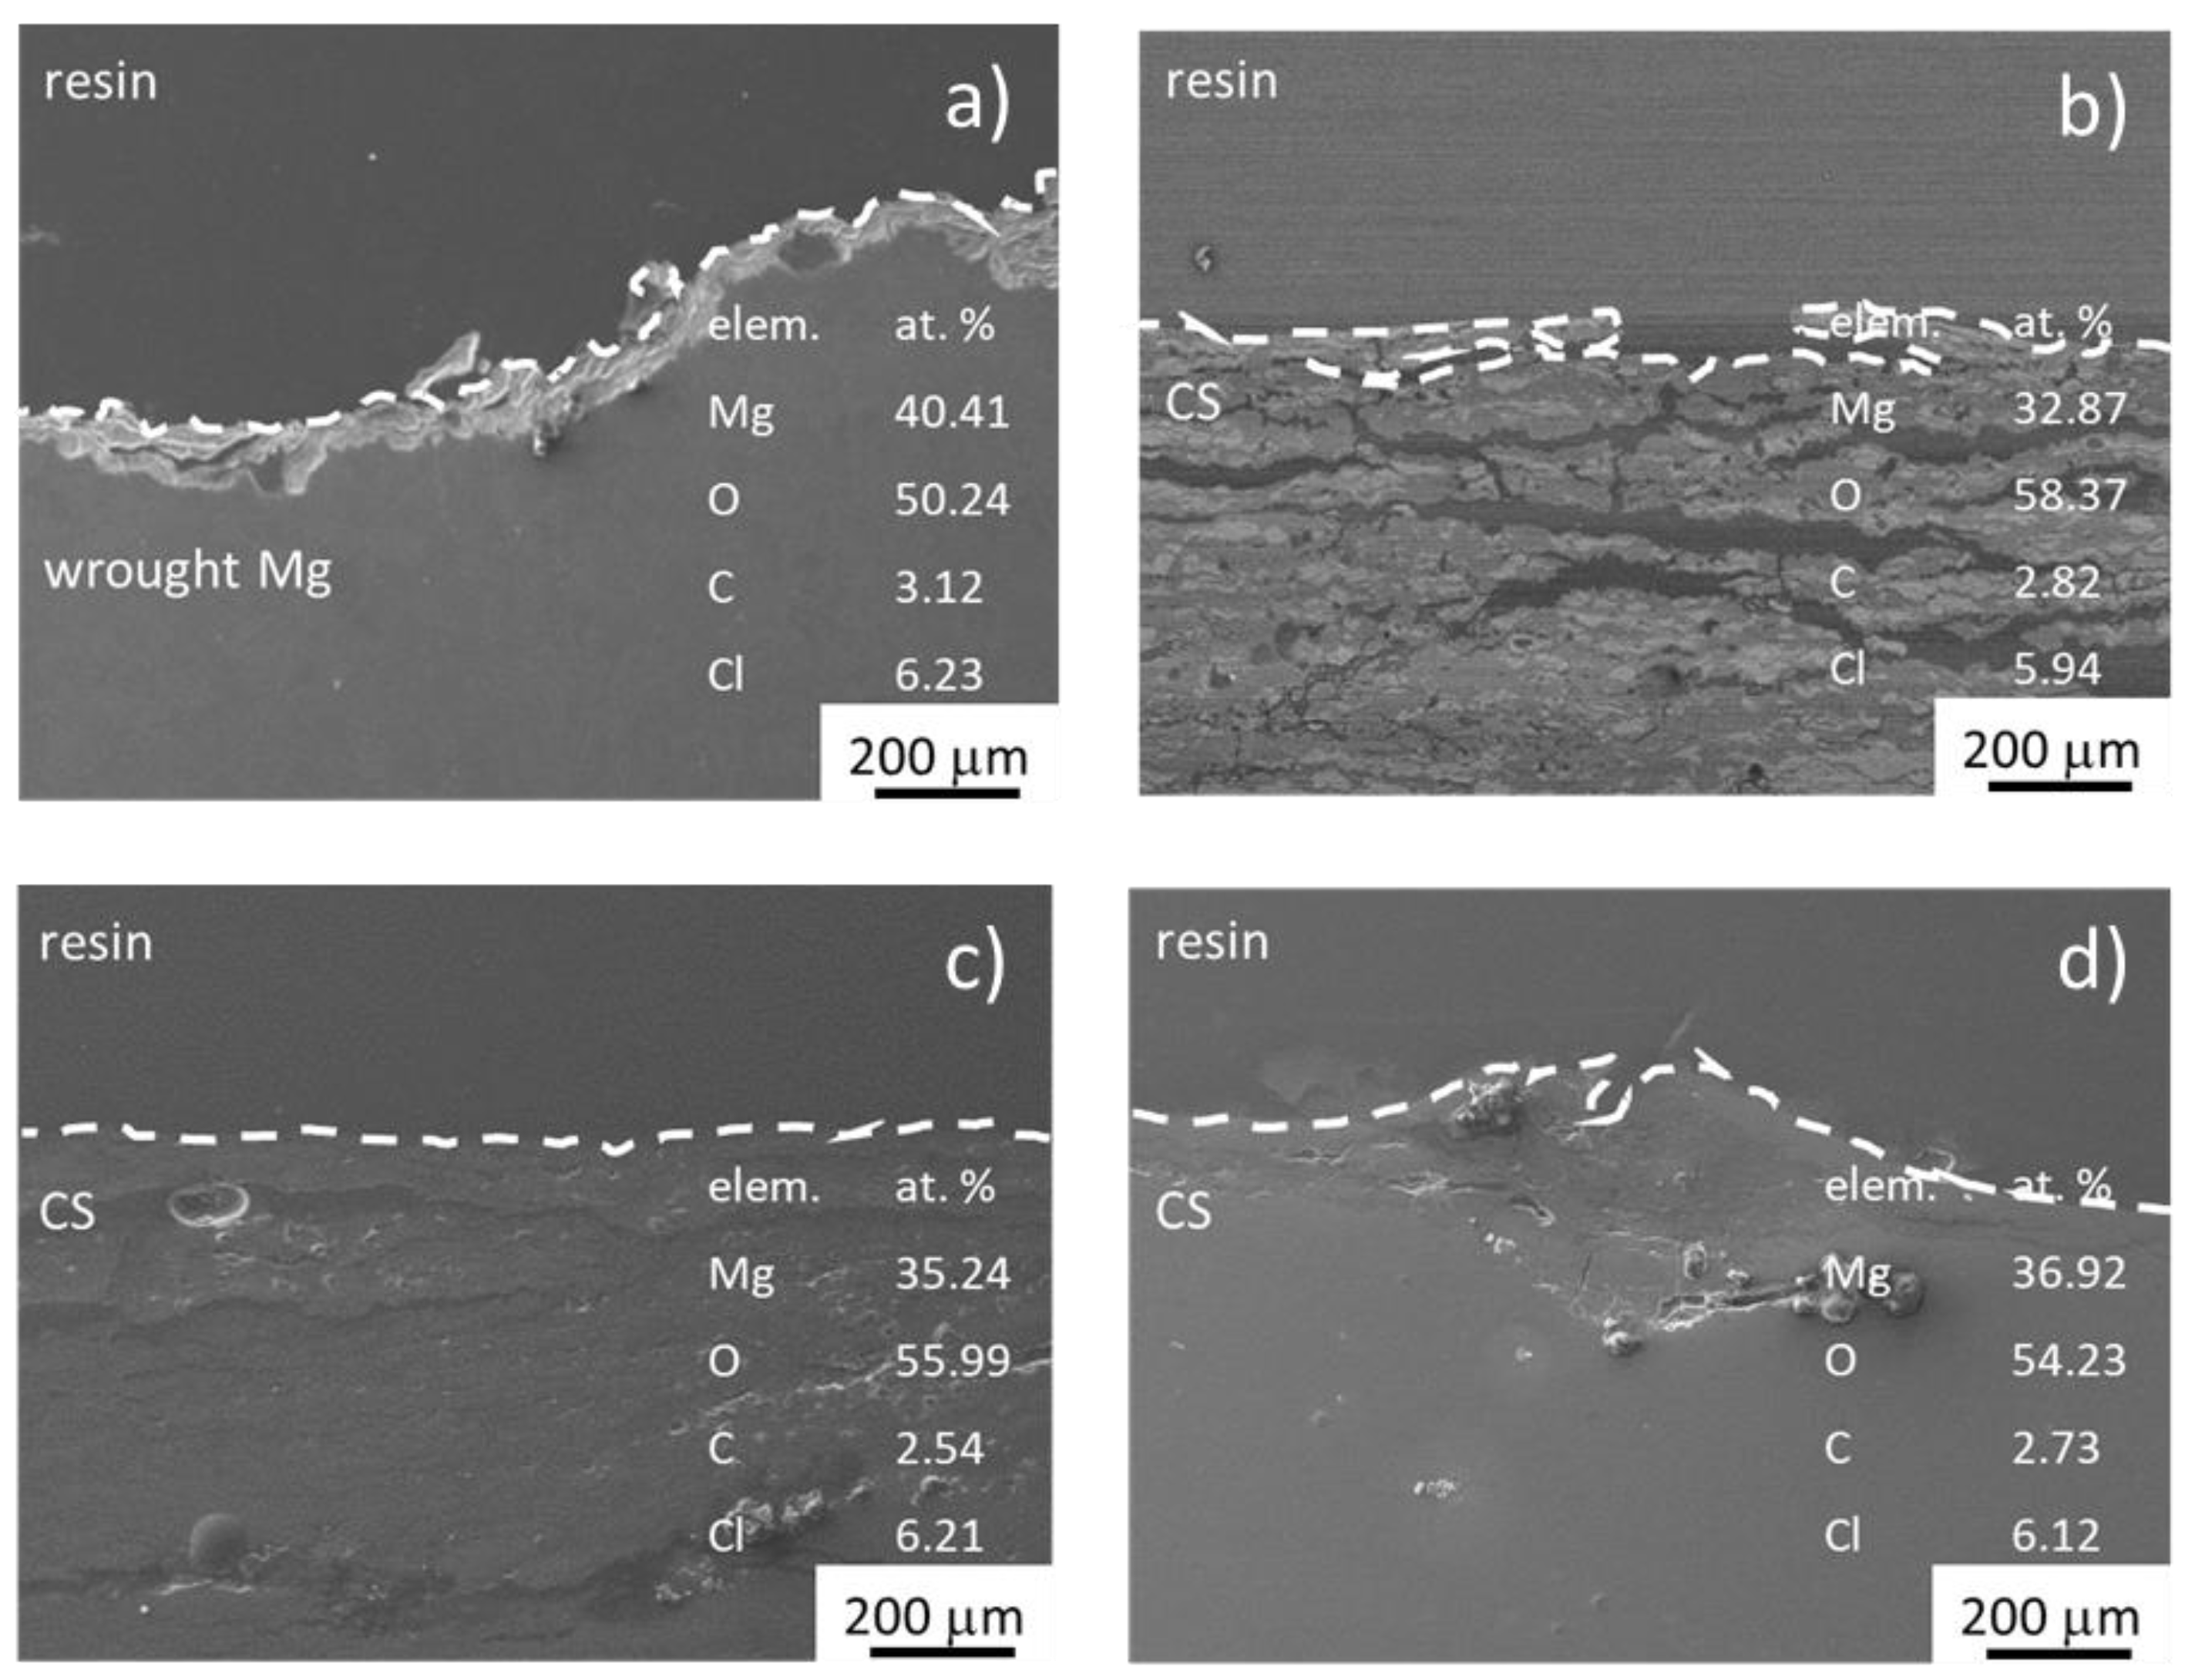
The EDS analysis performed on the surface of the tested specimens revealed the presence of Mg, O, C, and Cl elements in the area of the corrosion attack (corrosion products). Based on the obtained results and in accordance with the literature, the presence of MgO oxides and Mg(OH)2 hydroxides and some amount of MgCl2 is supposed, see Figure 5. Mg(OH)2 can be later transformed to MgCl2 by aggressive Cl– ions attack. The chemical composition of the corrosion products did not differ for the wrought and CS, neither with the CS processing conditions. The only difference was the more homogeneous surface covering in the case of the wrought material when compared to the CS. The results of the EDS performed on the surface of the samples after EIS measurements are provided in Figure 5.
Crosscuts of chosen samples after EIS tests are shown in Figure 5. As can be seen, the corrosion attack was most pronounced for CS prepared at 500 MPa/RT which had the highest porosity -. Delamination of individual layers of material can be seen on the crosscut of the sample (Figure 5b). CS prepared at 400 °C was more resistant to corrosion attack, while the resistance increases with increasing pressure. As can be seen on the crosscut of the CS prepared at 500 MPa/400 °C in Figure 5d, the corrosion attack is much less pronounced comparing to the CS prepared at 100 MPa (Figure 5c) and RT (Figure 5b). In this case, the slight penetration of the corrosive medium into the material through the oxide net created on the surface of powder particles can be assumed. However, the compacting pressure of the 500 MPa and the used temperature resulted in material with low porosity and only the surface layer of the material was attacked by corrosion. On the contrary, the lower pressure (100 MPa) resulted in a more pronounced corrosion attack, as can be seen on the sample crosscut in Figure 5c. In the case of the wrought material, a conventional corrosion attack resulting in the creation of corrosion pits was observed, however, the surface layer of the material can be considered quite compact from the macroscopic point of view, Figure 5a.
4. Discussion
Samples prepared from Mg powder processed by powder metallurgy were analyzed from the electrochemical corrosion point of view. Since powder metallurgy exhibits a potential for preparing components with specific geometries and, more importantly, specific chemical compositions, this achieved by tailoring the component properties via adjustment of the processing parameters, materials prepared by this method remains very interesting. Such materials are promising mainly for biomedical applications; however, their basic corrosion properties in simple corrosion environments such as 0.9% NaCl solution are not known.
Three different processing parameters were used for sample preparation. As a result, different structures were achieved and two bonding mechanisms were observed. In the case of processing at RT, particle deformation due to the applied pressure occurred. Due to the hcp lattice of Mg, in which only a limited number of slip systems are active, only mechanical bonding of the deformed particles occurred. This is in agreement with previous observations [16]. It is also connected to the still present layer of corrosion products on the powder particles and closed porosity, as documented in Figure 2b. The elevated temperature used for sample preparation resulted in the joining of powder particles through a combination of mechanical and diffusion bonding. The positive effect of the used temperature, producing more intense compaction, was more pronounced for the higher pressure used. Even though both samples prepared at 400 °C exhibited a level of porosity below 0.5%, the higher pressure used for sample preparation resulted in the more intense deformation of particles. This is in accord with the higher values of flexural strength and slightly higher values of microhardness reported in the literature [16]. Nevertheless, also in the case of the elevated temperature, the oxide layer on the Mg powder particle surface was still observed to be present, creating an interface between individual particles. This layer creates a barrier and reduces the diffusion during processing [18] and can have a negative influence on material bonding and the resulting mechanical and corrosion properties [16,32]. Besides the temperature, also the positive effect of the compaction pressure on prepared samples was observed in the literature [16]. Application of higher pressure usually results in lower porosity, however, the combined effect of elevated temperature and pressure has to be taken into account not to reach the metal liquidation.
The elevated temperature was shown to have a positive influence on material compaction and porosity, with a positive influence, assumed concerning corrosion resistance. This assumption was proven by EIS measurements The sample prepared at RT was fully corroded after only 12 h of measurement, the polarization resistance achieving a maximum value of 151 Ω·cm2 at the end of the measurement. The layer of corrosion products presents on the sample surface contained cracks, indicating that the layer was not compact and could not provide adequate protection against corrosion (Figure 5b). This was assumed based on the values of n presented in Table 2, these indicating a quite low degree of stability for the corrosion layer. While the corrosive medium penetrated through the cracked layer of corrosion products on the sample surface, the pores present in the sample structure in combination with the oxide layer on the powder particles exhibited sites for corrosion attack and a pathway for its penetration through the sample. The oxide layer present on the powder particles before compaction and subsequently creating a net between the mechanically bonded powder particles was less corrosion resistant than pure Mg. The propagation of the corrosion attack documented in Figure 5b is in agreement with previous results of experiments performed in HBSS and enriched HBSS [16,36]. However, the used HBBS were more aggressive, and more pronounced corrosion degradation of the sample was observed. This, however, could be partially attributed also to the different natures of the created Mg corrosion products resulting from corrosion in NaCl and enriched HBSS.
Using the elevated temperature in combination with lower pressure (100 MPa/400 °C) did not have any influence on sample polarization resistance. This is in contrast to the effect of lower temperature and higher compaction pressure, as seen in the sample prepared at 500 MPa/RT (Figure 5c). Also, the hot compacted sample was fully corroded after 12 h of measurement. The maximum value of the polarization resistance (111 Ω·cm2) was achieved at the end of the measurement. However, in this case, lower values of the polarization resistance were determined at the beginning of the measurement. In this case, a more pronounced corrosion attack exhibited by greater thickness and more pronounced cracking of the corrosion layer was observed after measurement when compared to the RT compacted sample (Figure 5b), this documented in Table 3 by the n value. This could be quite surprising taking into account the partial diffusion bonding of the powder particles during processing and the lower porosity of the sample. On the other hand, the lower compaction pressure applied was not as effective at cracking the initially created oxide layer present on individual powder particles and in the mechanical bonding of the particles. Less effective particle bonding, when compared to the sample prepared at 500 MPa/RT, was shown in [16]. The oxide net acts as a pathway for corrosion progress.
The hot compacted sample prepared at 500 MPa/400 °C exhibited significantly higher resistance against corrosion in comparison with the sample prepared at 100 MPa/400 °C. After 12 h, the sample achieved a polarization resistance of 307 Ω·cm2, this value decreasing to 91 Ω·cm2 after 96 h of EIS measurement. The sampleʹs response indicates the creation of a porous layer of corrosion products that became more stable over time. Different corrosion behavior from the metallographic point of view was observed for this sample. The surface of the compact was attacked by more uniform corrosion and no porous non-compact layer of corrosion products was detected on the compact surface, as seen in Figure 5d. The change in corrosion behavior of the CS can be associated with the elevated temperature and higher pressure used for Mg powder processing. Diffusion processes playing a role in Mg compaction resulted in a more homogenous and compacted bulk material, exhibiting fewer and less active corrosion attack sites such as pores and a less pronounced non-compact layer of corrosion products (oxide layer) at the compacted Mg powder–particle interface. The corrosion process observed here does not fully correspond to the findings presented for HBSS. On the other hand, they correspond to the process observed for enriched HBSS in [16]. Even though in the case of HBSS a layer-like morphology for the corrosion attack was observed, in the case of NaCl and enriched HBSS uniform corrosion attack spreading through the CS bulk material was observed. The values of polarization resistances obtained in different corrosion environments were comparable. The different responses of the samples to the different corrosion media can be attributed to the different chemical compositions of the used solutions and subsequently the different chemical compositions of the corrosion products. While in the Cl containing solutions only MgO oxides and Mg(OH)2 hydroxides, later transformed to MgCl2 by aggressive Cl– ions attack, are created, in the case of HBSS additional corrosion products create. Due to the different chemical compositions of the solution, exposure of Mg materials to HBSS provides conditions also for additional creation of phosphates and hydrogencarbonates [36].
As can be seen in Figure 5, the influence of porosity on the material corrosion properties observed here is in accord with literature: the higher the porosity the lower the corrosion resistance. The negative influence of compacted bulk porosity and layers of corrosion products present on the surfaces of compacted Mg powder particles on material properties was also discussed in [6,14,15,16,18,36].
The polarization resistance of wrought Mg and the prepared CS was comparable at the beginning of EIS measurements. Wrought pure Mg, however, exhibited typical corrosion behavior accompanied by a slight decrease in polarization resistance at the beginning of EIS measurement, due to damage of the created layer of corrosion products, followed by a subsequent increase. The surface of the sample exhibited remains of the corrosion attack in the form of corrosion pits (Figure 5a). The final value of polarization resistance after 96 h was 730 Ω·cm2. Even though this value is higher compared to the one determined for the sample compacted at 500 MPa/400 °C, the corrosion mechanism was similar, though more pronounced for the compacted sample.
Wrought pure Mg achieved much higher values of polarization resistance than the compacted magnesium (Table 1, Table 2, Table 3 and Table 4) because the surface layer was not composed of a pure Mg(OH)2 layer over a pure MgO layer, as found in CS prepared by powder metallurgy. Wrought Mg contains a relatively dense inner layer and a loose outer layer, both consisting of a mixture of MgO and Mg(OH)2, while the inner layer is dominated by MgO and the outer mainly by Mg(OH)2 [20]. Due to the porosity of the layer, it is not fully protecting against corrosion [4]; however, the layer created on the surface of the non-porous material can be assumed to be more stable (n values in Table 1) compared to layers created on CS (Table 2, Table 3 and Table 4).
Corrosion behavior of the Mg-based materials prepared via PM is influenced by processing conditions (resulting in specific microstructure and porosity) and chemical composition. The manuscript deals with description of the influence of individual processing parameters on resulting microstructure and porosity and consequent corrosion behavior. Based on the corrosion behavior of pure Mg processed at different conditions, the influence of added elements could be better described afterwards. Especially because the microstructure of the Mg-based alloyed materials prepared by PM is significantly affected by the original powder particles and subsequent processing. While the powder particles characteristics influence mainly the intensity of the effect of processing parameters, the parameters itself influence mainly the resulting porosity and exact microstructure. The influence of alloying elements in the case of PM is different when compared to the conventional alloys, in some cases resulting in creation of new phases, directly influencing bulk corrosion properties. Knowledge of the corrosion behavior of pure Mg PM materials allows a more reasonable description of the role of individual alloying elements on the bulk corrosion characteristics.
5. Conclusions
Electrochemical corrosion properties of pure Mg processed via powder metallurgy were analyzed by electrochemical impedance spectroscopy, and the corrosion behavior was analyzed in terms of metallographic analysis. The following conclusions can be stated from the obtained results:
- Only mechanical bonding between Mg powder particles was observed for cold compacted Mg (RT), while a combination of mechanical bonding and diffusion bonding was observed for hot compacted Mg samples.
- EIS measurements revealed similar electrochemical corrosion characteristics for samples compacted at 500 MPa/RT and 100 MPa/400 °C, while material compacted at 500 MPa/400 °C achieved higher values of polarization resistance and was characterized by longer resistance to the corrosion environment of 0.9% NaCl (96 h of exposure).
- The corrosion resistance of all CS was lower compared to wrought pure Mg.
- In the case of samples processed at 500 MPa/RT and 100 MPa/400 °C, a different corrosion process was observed relating to the powder particle bonding mechanism. An interparticle corrosion structure was created due to the corrosion attack following powder particle boundaries and pores for both samples. Uniform corrosion attack, comparable to that in wrought pure Mg, was observed in the case of hot CS, where diffusion bonding mechanism plays the main role in particle compaction (500 MPa/400 °C).
Author Contributions
J.M., P.D. and S.F. conceived and designed the experiments; J.M. performed the experiments; J.M., B.H., L.D. and M.H. analyzed the data; P.D., M.H., L.D. and J.W. contributed reagents/materials/analysis tools; J.M., L.D. and S.F. wrote the paper. All authors have read and agreed to the published version of the manuscript.
Funding
This work was supported by Specific University Research at FCH BUT, Project No. FCH-S-21-7553, Ministry of Education, Youth and Sports of the Czech Republic.
Institutional Review Board Statement
Not applicable.
Informed Consent Statement
Not applicable.
Data Availability Statement
The data supporting provided results is contained within the article.
Acknowledgments
Many thanks to J. Zapletal and the Institute of Materials Science and Engineering, Faculty of Mechanical Engineering, Brno University of Technology for the preparation and pressing of the samples used in this work.
Conflicts of Interest
The authors declare no conflict of interest. The sponsors had no role in the design of the study; in the collection, analyses, or interpretation of data; in the writing of the manuscript; or in the decision to publish the results.
References
- Salvetr, P.; Novák, P.; Vojtech, D. Porous magnesium alloys prepared by powder metallurgy. Mater. Tehnol. 2016, 50, 917–922. [Google Scholar] [CrossRef]
- Chen, S.; Tan, L.; Zhang, B.; Xia, Y.; Xu, K.; Yang, K. In vivo study on degradation behavior and histologic response of pure magnesium in muscles. J. Mater. Sci. Technol. 2017, 33, 469–474. [Google Scholar] [CrossRef]
- Avedesian, M.M.; Baker, H. (Eds.) Magnesium and Magnesium Alloys; ASM International: Materials Park, OH, USA, 1999. [Google Scholar]
- Nassif, N.; Ghayad, I. Corrosion protection and surface treatment of magnesium alloys used for orthopedic applications. Adv. Mater. Sci. Eng. 2013, 2013, 532896. [Google Scholar] [CrossRef] [Green Version]
- Adolf, B. Magnesium Und Seine Legierungen; Springer: Berlin/Heidelberg, Germany, 1939. [Google Scholar]
- Čapek, J.; Vojtěch, D. Properties of porous magnesium prepared by powder metallurgy. Mater. Sci. Eng. C 2013, 33, 564–569. [Google Scholar] [CrossRef]
- Alias, J.; Harun, W.S.W.; Ayu, H.M. A review on the preparation of magnesium-based alloys prepared by powder metallurgy and the evolution of microstructure and mechanical properties. In Key Engineering Materials; Trans Tech Publications Ltd.: Freienbach, Switzerland, 2019; Volume 796, pp. 3–10. [Google Scholar]
- Bettles, C.J. Magnesium powder metallurgy: Process and materials opportunities. J. Mater. Eng. Perform. 2008, 17, 297–301. [Google Scholar] [CrossRef]
- Perumal, G.; Ramasamy, B.; Dhanasekaran, S.; Ramasamy, S.; Doble, M. Bilayer nanostructure coated AZ31 magnesium alloy implants: In vivo reconstruction of critical-sized rabbit femoral segmental bone defect. Nanomed. Nanotechnol. Biol. Med. 2020, 29, 102232. [Google Scholar] [CrossRef] [PubMed]
- Garcés, G.; Domínguez, F.; Pérez, P.; Caruana, G.; Adeva, P. Effect of extrusion temperature on the microstructure and plastic deformation of PM-AZ92. J. Alloys Compd. 2006, 422, 293–298. [Google Scholar] [CrossRef]
- Osorio-García, M.; Suárez-Alcántara, K.; Todaka, Y.; Tejeda-Ochoa, A.; Herrera-Ramírez, M.; Hernández-Silva, O.; Cabañas-Moreno, J.G. Low-temperature hydrogenation of Mg-Ni-Nb2O5 alloy processed by high-pressure torsion. J. Alloys Compd. 2021, 878, 160309. [Google Scholar] [CrossRef]
- Garcia-Casas, A.; Toirac, B.; Jiménez-Morales, A. The electrochemical corrosion behavior of metals processed by powder metallurgy: Future perspectives. In Reference Module in Materials Science and Materials Engineering; Elsevier: Amsterdam, The Netherlands, 2021. [Google Scholar]
- Dvorský, D.; Kubásek, J.; Vojtěch, D. Microstructure, mechanical and corrosion properties of extruded milled magnesium powder. Manuf. Technol. 2020, 20, 708–713. [Google Scholar]
- Zhuang, H.; Han, Y.; Feng, A. Preparation, mechanical properties and in vitro biodegradation of porous magnesium scaffolds. Mater. Sci. Eng. C 2008, 28, 1462–1466. [Google Scholar] [CrossRef]
- Lietaert, K.; Weber, L.; Van Humbeeck, J.; Mortensen, A.; Luyten, J.; Schrooten, J. Open cellular magnesium alloys for biodegradable orthopaedic implants. J. Magnes. Alloys 2013, 1, 303–311. [Google Scholar] [CrossRef] [Green Version]
- Březina, M.; Minda, J.; Doležal, P.; Krystýnová, M.; Fintová, S.; Zapletal, J.; Wasserbauer, J.; Ptáček, P. Characterization of powder metallurgy processed pure magnesium materials for biomedical applications. Metals 2017, 7, 461. [Google Scholar] [CrossRef] [Green Version]
- Wen, C.; Yamada, Y.; Shimojima, K.; Chino, Y.; Hosokawa, H.; Mabuchi, M. Compressibility of porous magnesium foam: Dependency on porosity and pore size. Mater. Lett. 2004, 58, 357–360. [Google Scholar] [CrossRef]
- Bram, M.; Ebel, T.; Wolff, M.; Barbosa, A.C.; Tuncer, N. Applications of powder metallurgy in biomaterials. Adv. Powder Metall. 2013, 520–554. [Google Scholar] [CrossRef]
- Song, G.-L.; Unocic, K.A. The anodic surface film and hydrogen evolution on Mg. Corros. Sci. 2015, 98, 758–765. [Google Scholar] [CrossRef] [Green Version]
- Zheng, Y.F.; Gu, X.N.; Xi, Y.L.; Chai, D.L. In vitro degradation and cytotoxicity of Mg/Ca composites produced by powder metallurgy. Acta Biomater. 2010, 6, 1783–1791. [Google Scholar] [CrossRef]
- Krystýnová, M.; Doležal, P.; Fintová, S.; Březina, M.; Zapletal, J.; Wasserbauer, J. Preparation and characterization of zinc materials prepared by powder metallurgy. Metals 2017, 7, 396. [Google Scholar] [CrossRef]
- Wang, Y.; Wei, M.; Gao, J. Improve corrosion resistance of magnesium in simulated body fluid by dicalcium phosphate dihydrate coating. Mater. Sci. Eng. C 2009, 29, 1311–1316. [Google Scholar] [CrossRef]
- Gray, J.; Luan, B. Protective coatings on magnesium and its alloys—A critical review. J. Alloys Compd. 2002, 336, 88–113. [Google Scholar] [CrossRef]
- Annur, D.; Lestari, F.P.; Erryani, A.; Kartika, I. Study of sintering on Mg-Zn-Ca alloy system. In Proceedings of the AIP Conference Proceedings, Maharashtra, India, 5–6 July 2018; Volume 1964, No. 1. p. 020029. [Google Scholar]
- Drábiková, J.; Pastorek, F.; Fintová, S.; Dolezal, P.; Wasserbauer, J. Improvement of bio-compatible AZ61 magnesium alloy corrosion resistance by fluoride conversion coating. Koroze A Ochr. Mater. 2016, 60, 132. [Google Scholar] [CrossRef] [Green Version]
- Drábiková, J.; Fintová, S.; Ptáček, P.; Kuběna, I.; Březina, M.; Wasserbauer, J.; Doležal, P.; Pastorek, F. Structure and growth kinetic of unconventional fluoride conversion coating prepared on wrought AZ61 magnesium alloy. Surf. Coat. Technol. 2020, 399, 126101. [Google Scholar] [CrossRef]
- Fintova, S.; Drabikova, J.; Hadzima, B.; Trško, L.; Březina, M.; Doležal, P.; Wasserbauer, J. Degradation of unconventional fluoride conversion coating on AZ61 magnesium alloy in SBF solution. Surf. Coat. Technol. 2019, 380, 125012. [Google Scholar] [CrossRef]
- Fintová, S.; Drábiková, J.; Pastorek, F.; Tkacz, J.; Kuběna, I.; Trško, L.; Hadzima, B.; Minda, J.; Doležal, P.; Wasserbauer, J.; et al. Improvement of electrochemical corrosion characteristics of AZ61 magnesium alloy with unconventional fluoride conversion coatings. Surf. Coat. Technol. 2019, 357, 638–650. [Google Scholar] [CrossRef]
- Drábiková, J.; Fintová, S.; Tkacz, J.; Doležal, P.; Wasserbauer, J. Unconventional fluoride conversion coating preparation and characterization. Anti-Corros. Methods Mater. 2017, 64, 613–619. [Google Scholar] [CrossRef]
- Dvorsky, D.; Kubasek, J.; Vojtech, D. A new approach in the preparation of biodegradable Mg-MgF2 composites with tailored corrosion and mechanical properties by powder metallurgy. Mater. Lett. 2018, 227, 78–81. [Google Scholar] [CrossRef]
- Jayasathyakawin, S.; Ravichandran, M.; Baskar, N.; Chairman, C.A.; Balasundaram, R. Magnesium matrix composite for biomedical applications through powder metallurgy—Review. Mater. Today. Proc. 2020, 27, 736–741. [Google Scholar] [CrossRef]
- King, A.D.; Birbilis, N.; Scully, J.R. Accurate electrochemical measurement of magnesium corrosion rates; a combined impedance, mass-loss and hydrogen collection study. Electrochim. Acta 2014, 121, 394–406. [Google Scholar] [CrossRef]
- Atrens, A.; Dietzel, W. The negative difference effect and unipositive Mg+. Adv. Eng. Mater. 2007, 9, 292–297. [Google Scholar] [CrossRef] [Green Version]
- Weber, C.R.; Knörnschild, G.; Dick, L.F.P. The negative-difference effect during the localized corrosion of magnesium and of the AZ91HP alloy. J. Braz. Chem. Soc. 2003, 14, 584–593. [Google Scholar] [CrossRef] [Green Version]
- Orazem, M.E.; Tribollet, B. Electrochemical Impedance Spectroscopy; John Wiley & Sons, Inc.: Hoboken, NJ, USA, 2008. [Google Scholar]
- Březina, M.; Doležal, P.; Krystýnová, M.; Minda, J.; Zapletal, J.; Fintová, S.; Wasserbauer, J. Evolution of microstructure and electrochemical corrosion characteristics of cold compacted magnesium. Koroze A Ochr. Mater. 2017, 61, 123. [Google Scholar] [CrossRef] [Green Version]
Figure 1.
Magnesium powder particles; SEM.

Figure 2.
Microstructure of wrought Mg and Mg CS; LM and SEM detail; etched by 5% Nital: (a) wrought pure Mg; (b) 500 MPa/RT; (c) 100 MPa/400 °C; (d) 500 MPa/400 °C; (e) detail of 500 MPa/RT; (f) detail of 100 MPa/400 °C; (g) detail of 500 MPa/400 °C.
Figure 2.
Microstructure of wrought Mg and Mg CS; LM and SEM detail; etched by 5% Nital: (a) wrought pure Mg; (b) 500 MPa/RT; (c) 100 MPa/400 °C; (d) 500 MPa/400 °C; (e) detail of 500 MPa/RT; (f) detail of 100 MPa/400 °C; (g) detail of 500 MPa/400 °C.

Figure 3.
Nyquist plots for pure wrought Mg and Mg CS in 0.9% NaCl: (a) wrought pure Mg (different axis scale); (b) 500 MPa/RT; (c) 100 MPa/400 °C; (d) 500 MPa/400 °C.
Figure 3.
Nyquist plots for pure wrought Mg and Mg CS in 0.9% NaCl: (a) wrought pure Mg (different axis scale); (b) 500 MPa/RT; (c) 100 MPa/400 °C; (d) 500 MPa/400 °C.

Figure 4.
Equivalent circuits used for the Nyquist plot evaluation: (a) simplified Randles circuit; (b) equivalent circuit with one capacitance and one inductive loop; (c) equivalent circuit with two capacitances and one inductive loop.
Figure 4.
Equivalent circuits used for the Nyquist plot evaluation: (a) simplified Randles circuit; (b) equivalent circuit with one capacitance and one inductive loop; (c) equivalent circuit with two capacitances and one inductive loop.

Figure 5.
Samples after EIS measurement. The surface of the corroded samples is outlined for convenience: (a) wrought pure Mg (different axis scale); (b) 500 MPa/RT; (c) 100 MPa/400 °C; (d) 500 MPa/400 °C.
Figure 5.
Samples after EIS measurement. The surface of the corroded samples is outlined for convenience: (a) wrought pure Mg (different axis scale); (b) 500 MPa/RT; (c) 100 MPa/400 °C; (d) 500 MPa/400 °C.


Table 1.
Polarization resistance of wrought pure Mg.
| Time | Rs [Ω·cm2] | R2 [Ω·cm2] | R3 [Ω·cm2] | R4 [Ω·cm2] | Rp [Ω·cm2] | Q2 [µF·sn–1] | Q3 [µF·sn–1] | n2 | n3 | L [H] |
|---|---|---|---|---|---|---|---|---|---|---|
| 0 | 82 | 394 | 223 | NA | 142 | 18.4 | NA | 0.88 | NA | 1068 |
| 1 | 88 | 49 | 1 | 38 | 35 | 145.1 | 11.26 | 0.99 | 0.99 | 87 |
| 2 | 84 | 81 | NA | NA | 81 | 366.8 | NA | 0.93 | NA | NA |
| 4 | 86 | 150 | NA | NA | 140 | 219.1 | NA | 0.95 | NA | NA |
| 8 | 89 | 240 | NA | NA | 276 | 167.6 | NA | 0.94 | NA | NA |
| 12 | 91 | 282 | 122 | NA | 404 | 157.3 | NA | 0.92 | NA | 1708 |
| 24 | 84 | 401 | 54 | NA | 252 | 123.7 | NA | 0.91 | NA | 2001 |
| 48 | 86 | 223 | 315 | NA | 402 | 84.9 | NA | 0.91 | NA | 6926 |
| 72 | 91 | 438 | 270 | NA | 443 | 83.3 | NA | 0.86 | NA | 2501 |
| 96 | 95 | 739 | NA | NA | 730 | 78.3 | NA | 0.83 | NA | 1068 |
NA—not applicable. L is the expression of the values of L3 or L4, depending on the used equivalent circuit (Figure 4).
Table 2.
Polarization resistance of pure Mg compacted at 500 MPa/RT.
| Time | Rs [Ω·cm2] | R2 [Ω·cm2] | R3 [Ω·cm2] | R4 [Ω·cm2] | Rp [Ω·cm2] | Q2 [µF·sn–1] | Q3 [µF·sn–1] | n2 | n3 | L [H] |
|---|---|---|---|---|---|---|---|---|---|---|
| 0 | 59 | 58 | 21 | 96 | 43 | 0.0 | 0.0 | 1.00 | 0.66 | 343 |
| 1 | 60 | 284 | 88 | NA | 45 | 439.0 | NA | 0.65 | NA | 922 |
| 2 | 61 | 81 | 87 | NA | 42 | 514.0 | NA | 0.68 | NA | 1107 |
| 4 | 64 | 931 | 116 | NA | 49 | 677.0 | NA | 0.62 | NA | 1888 |
| 8 | 66 | 62 | 204 | 212 | 118 | 327.0 | 0.5 | 0.24 | 0.97 | 727 |
| 12 | 74 | 132 | 849 | 178 | 151 | 49.4 | 204.0 | 0.55 | 0.67 | 0 |
NA—not applicable. L is the expression of the values of L3 or L4, depending on the used equivalent circuit (Figure 4).
Table 3.
Polarization resistance of pure Mg compacted at 100 MPa/400 °C.
| Time | Rs [Ω·cm2] | R2 [Ω·cm2] | R3 [Ω·cm2] | Rp [Ω·cm2] | Q2 [µF·sn–1] | n2 | L3 [H] |
|---|---|---|---|---|---|---|---|
| 0 | 117 | 298 | 107 | 79 | 36.11 | 0.83 | 2026 |
| 1 | 120 | 247 | 126 | 84 | 61.99 | 0.86 | 2201 |
| 2 | 121 | 227 | 165 | 96 | 90.66 | 0.86 | 3001 |
| 4 | 118 | 187 | 213 | 99 | 180.1 | 0.78 | 3856 |
| 8 | 116 | 141 | 317 | 98 | 252.0 | 0.73 | 5957 |
| 12 | 116 | 141 | 523 | 111 | 236.6 | 0.73 | 8440 |
Table 4.
Polarization resistance of pure Mg compacted at 500 MPa/400 °C.
| Time | Rs [Ω·cm2] | R2 [Ω·cm2] | R3 [Ω·cm2] | R4 [Ω·cm2] | Rp [Ω·cm2] | Q2 [µF·sn–1] | Q3 [µF·sn–1] | n2 | n3 | L [H] |
|---|---|---|---|---|---|---|---|---|---|---|
| 0 | 61 | 6 | 40 | 306 | 40 | 0.0 | 22.2 | 1.00 | 0.88 | 1801 |
| 1 | 64 | 399 | 1617 | 174 | 160 | 28.9 | 1230.0 | 0.89 | 1.00 | 2242 |
| 2 | 64 | 375 | 167 | NA | 115 | 33.0 | NA | 0.89 | NA | 5244 |
| 4 | 63 | 325 | 154 | NA | 105 | 36.1 | NA | 0.90 | NA | 3950 |
| 8 | 60 | 290 | 157 | NA | 102 | 34.3 | NA | 0.92 | NA | 2590 |
| 12 | 59 | 1877 | 367 | NA | 307 | 33.6 | NA | 0.92 | NA | 0 |
| 24 | 65 | 323 | 182 | NA | 116 | 37.3 | NA | 0.91 | NA | 5233 |
| 48 | 63 | 272 | 203 | NA | 116 | 41.7 | NA | 0.88 | NA | 4774 |
| 72 | 68 | 250 | 239 | NA | 122 | 59.8 | NA | 0.84 | NA | 4854 |
| 96 | 68 | 204 | 163 | NA | 91 | 82.9 | NA | 0.81 | NA | 3781 |
NA—not applicable. *—the values are in order 10−6. L is the expression of the values of L3 or L4, depending on the used equivalent circuit (Figure 4).
Publisher’s Note: MDPI stays neutral with regard to jurisdictional claims in published maps and institutional affiliations. |
© 2021 by the authors. Licensee MDPI, Basel, Switzerland. This article is an open access article distributed under the terms and conditions of the Creative Commons Attribution (CC BY) license (https://creativecommons.org/licenses/by/4.0/).
Share and Cite
MDPI and ACS Style
Minda, J.; Fintová, S.; Hadzima, B.; Doležal, P.; Hasoňová, M.; Doskočil, L.; Wasserbauer, J. Electrochemical Corrosion Behavior of Pure Mg Processed by Powder Metallurgy. Coatings 2021, 11, 986. https://doi.org/10.3390/coatings11080986
AMA Style
Minda J, Fintová S, Hadzima B, Doležal P, Hasoňová M, Doskočil L, Wasserbauer J. Electrochemical Corrosion Behavior of Pure Mg Processed by Powder Metallurgy. Coatings. 2021; 11(8):986. https://doi.org/10.3390/coatings11080986
Chicago/Turabian StyleMinda, Jozef, Stanislava Fintová, Branislav Hadzima, Pavel Doležal, Michaela Hasoňová, Leoš Doskočil, and Jaromír Wasserbauer. 2021. "Electrochemical Corrosion Behavior of Pure Mg Processed by Powder Metallurgy" Coatings 11, no. 8: 986. https://doi.org/10.3390/coatings11080986
Note that from the first issue of 2016, this journal uses article numbers instead of page numbers. See further details here.