Strength and Brittleness of Interfaces in Fe-Al Superalloy Nanocomposites under Multiaxial Loading: An ab initio and Atomistic Study


Abstract
:1. Introduction
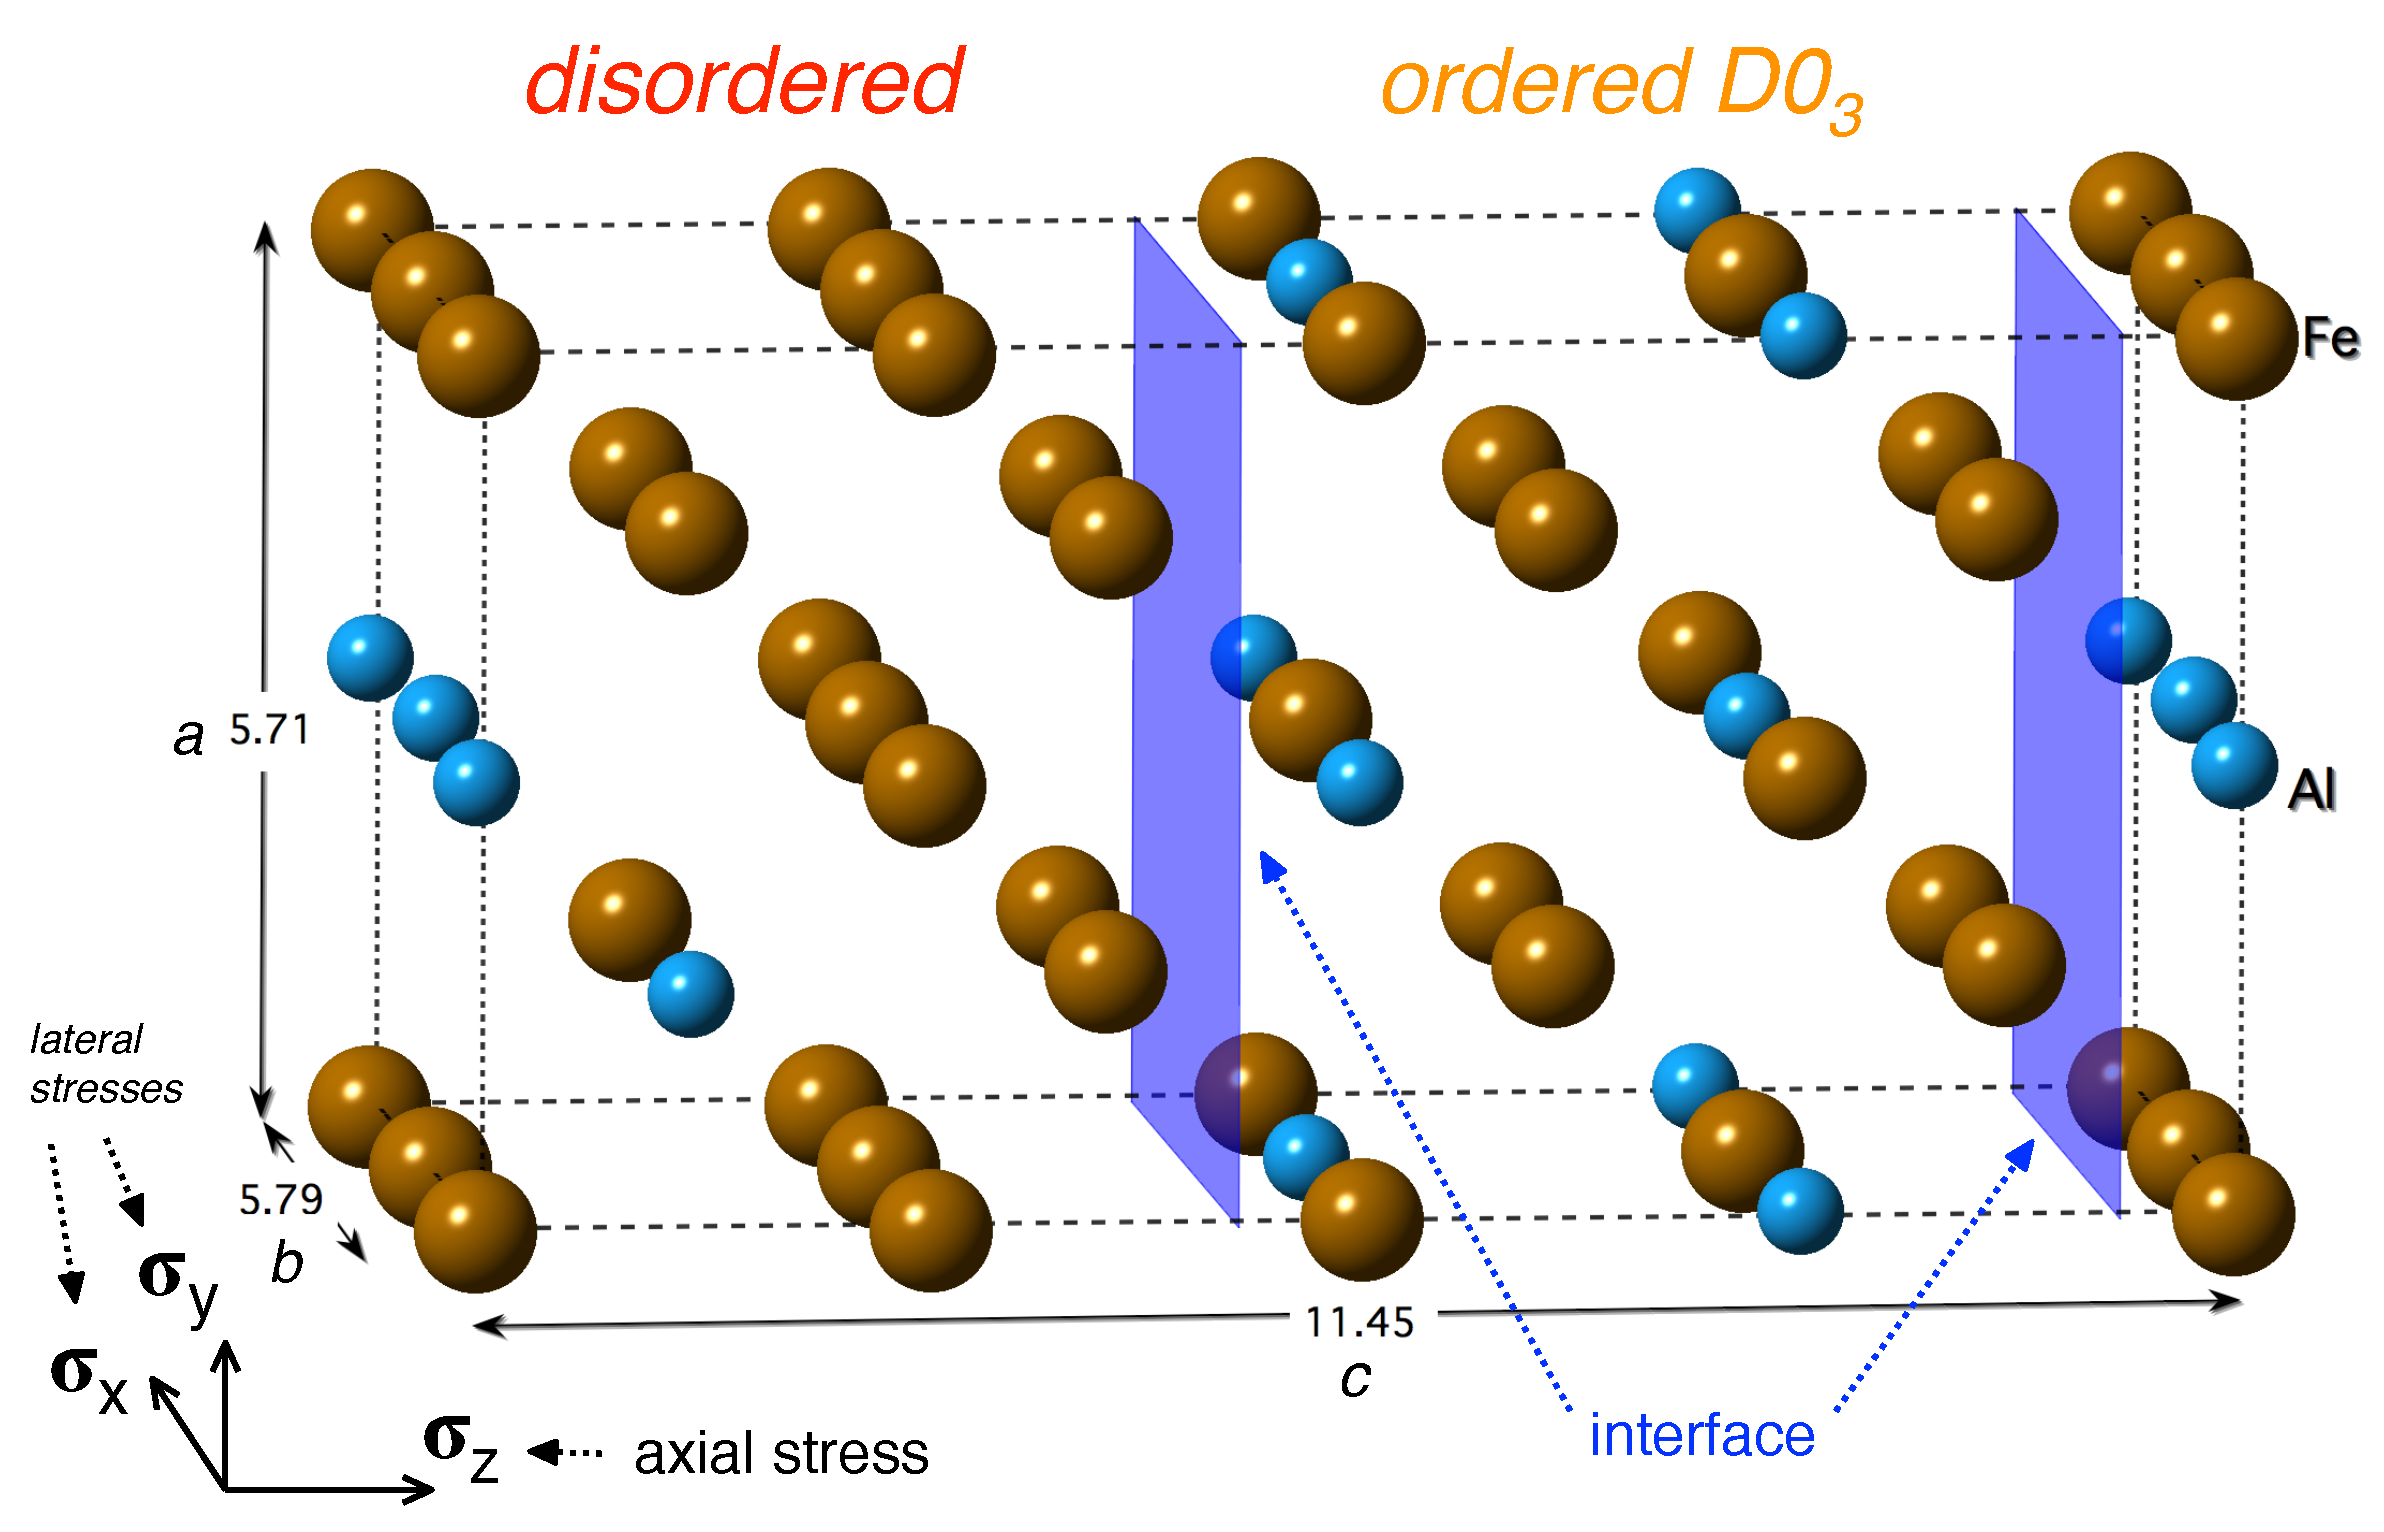
2. Materials and Methods
3. Results
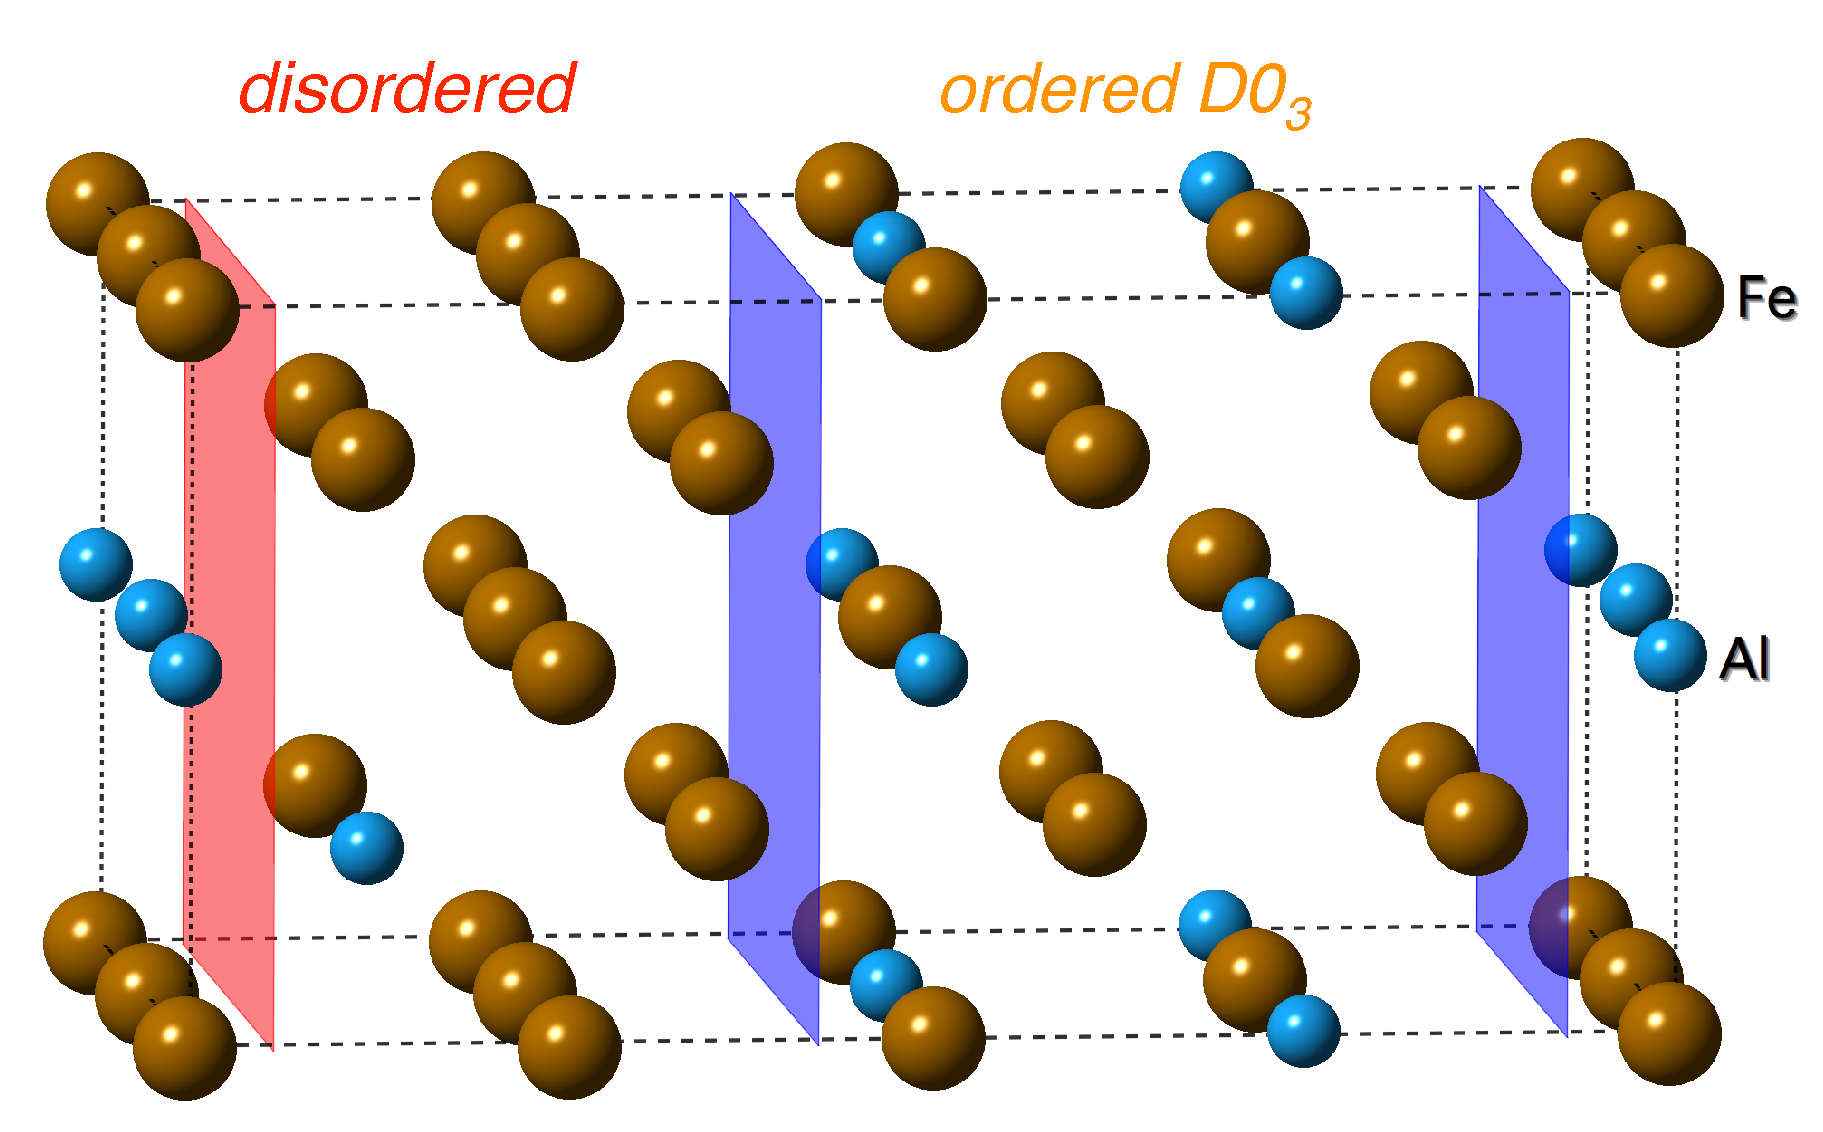
3.1. Mechanical Properties of Individual Phases (D0 and Disordered)
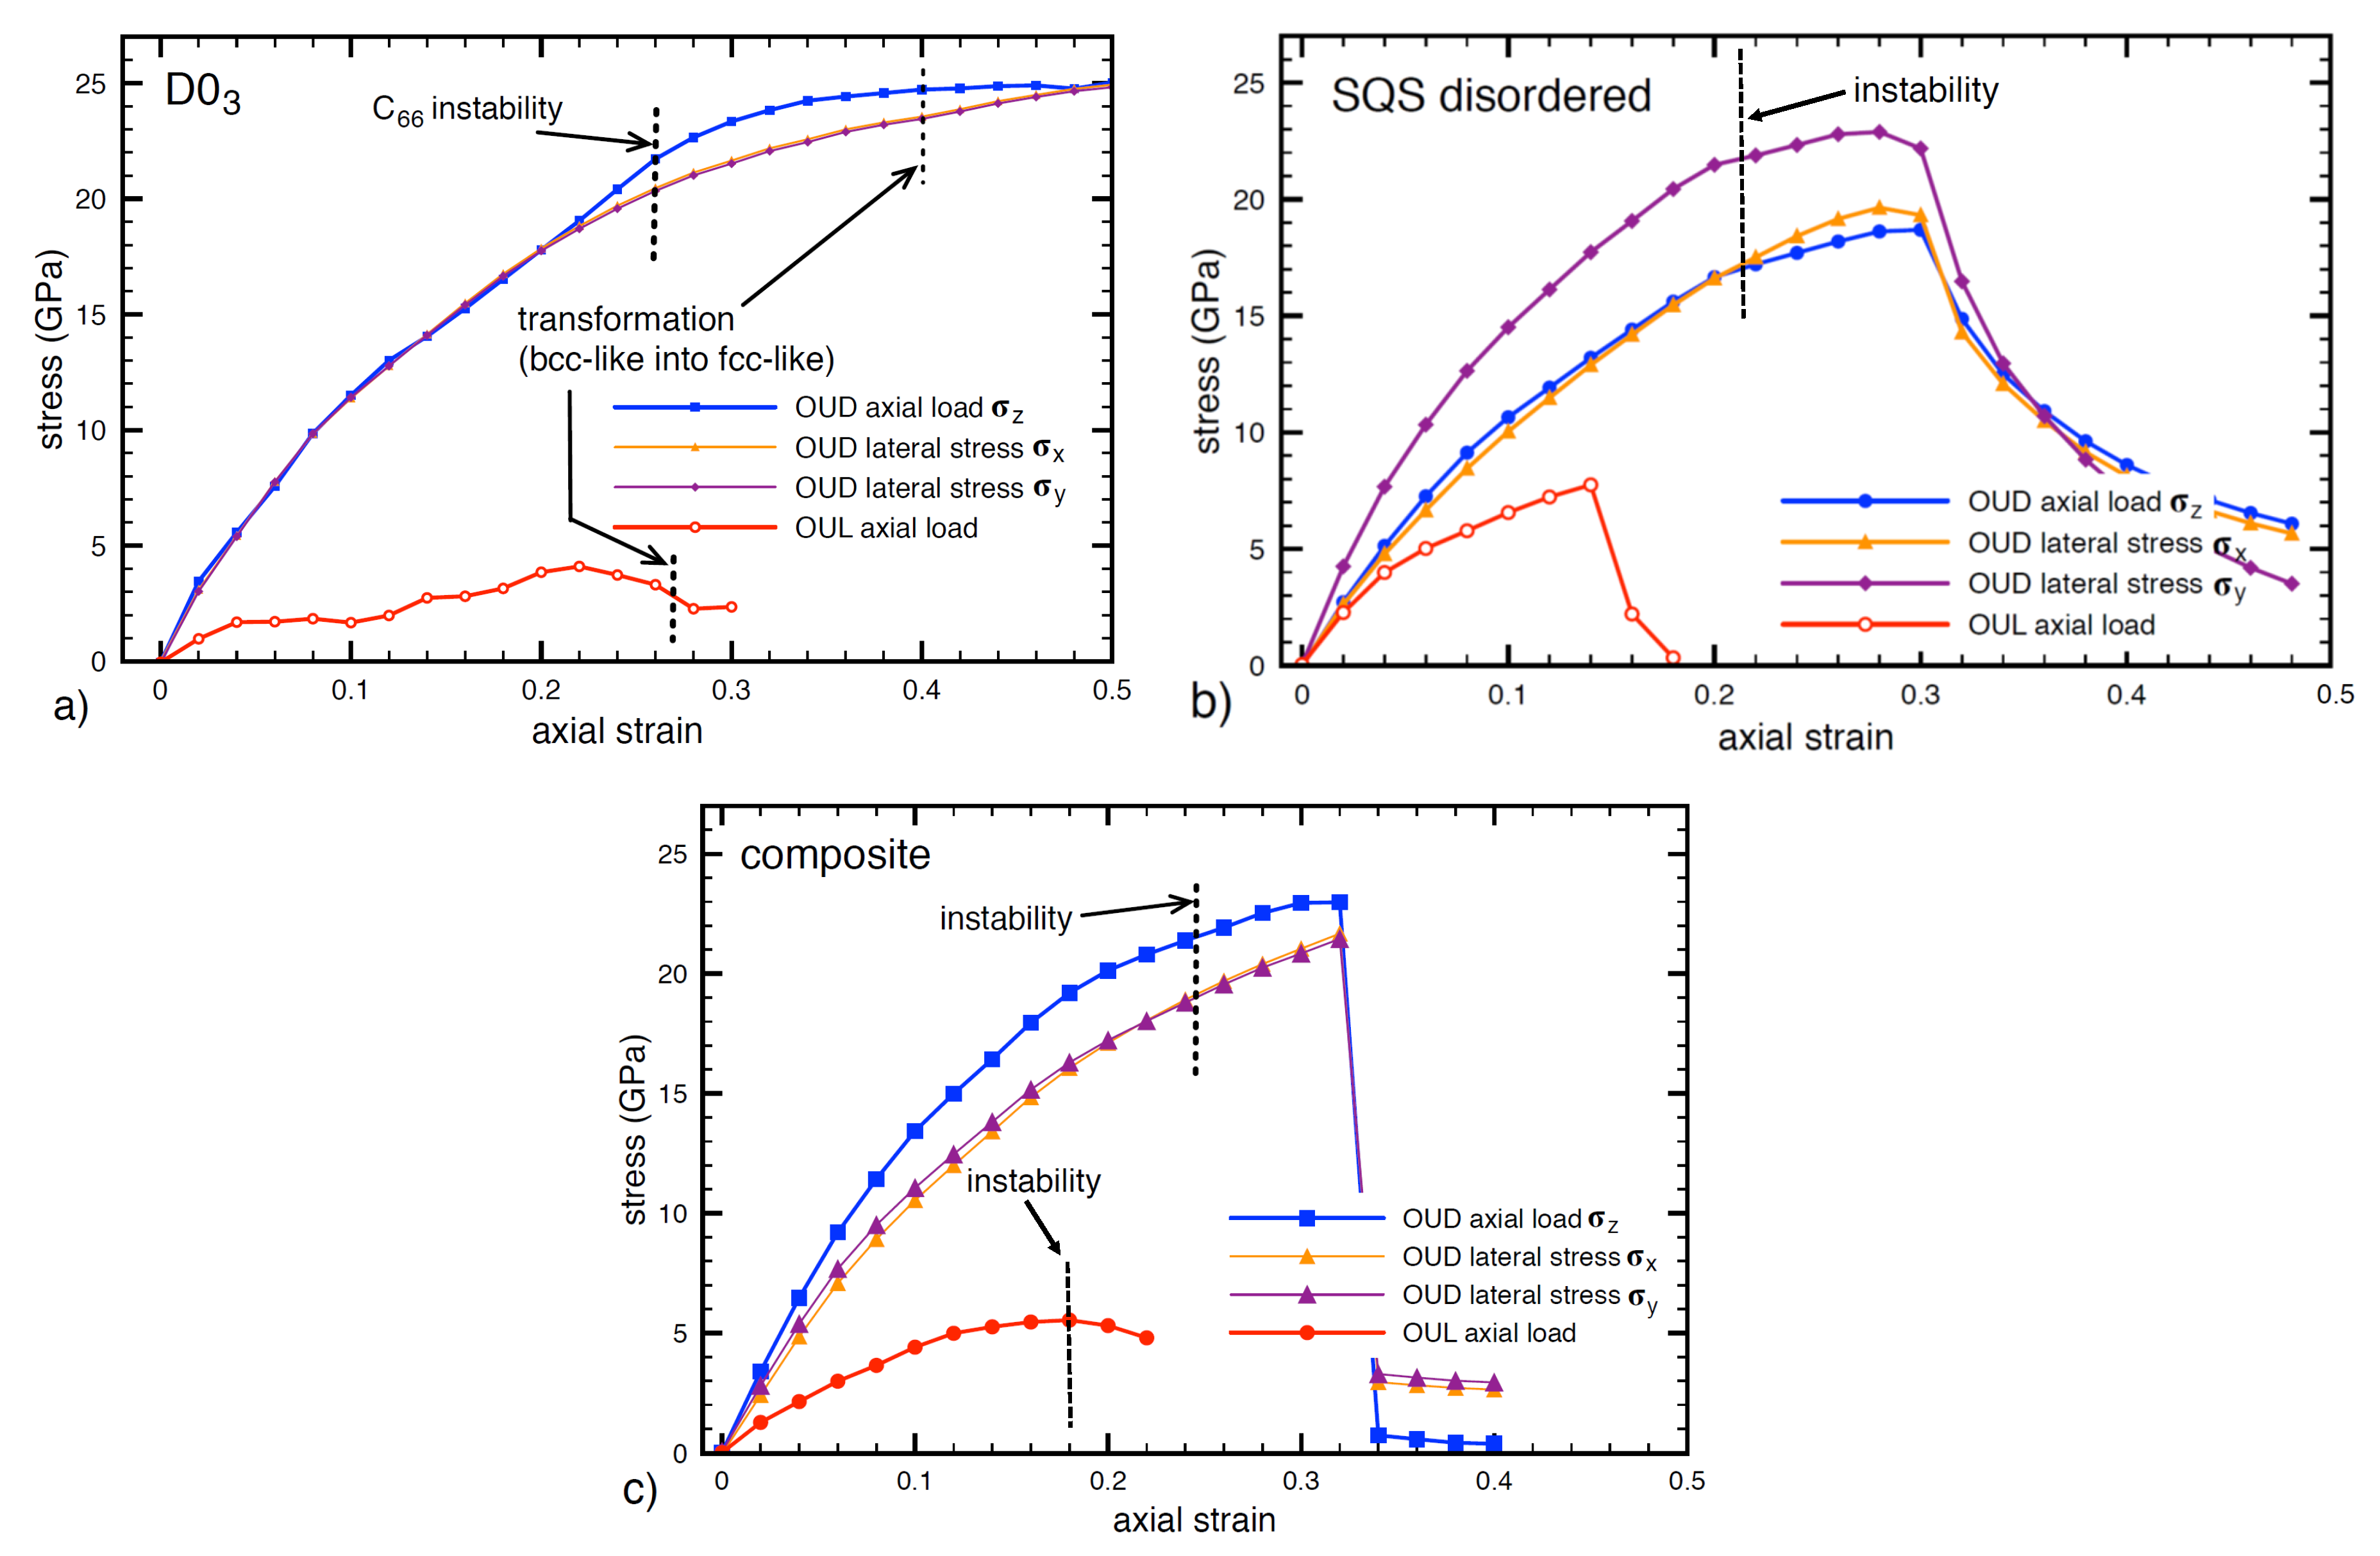
3.2. Mechanical Response of the FeAl/Fe-Al Nanocomposite
3.3. Influence of Lateral Stresses on the Strength
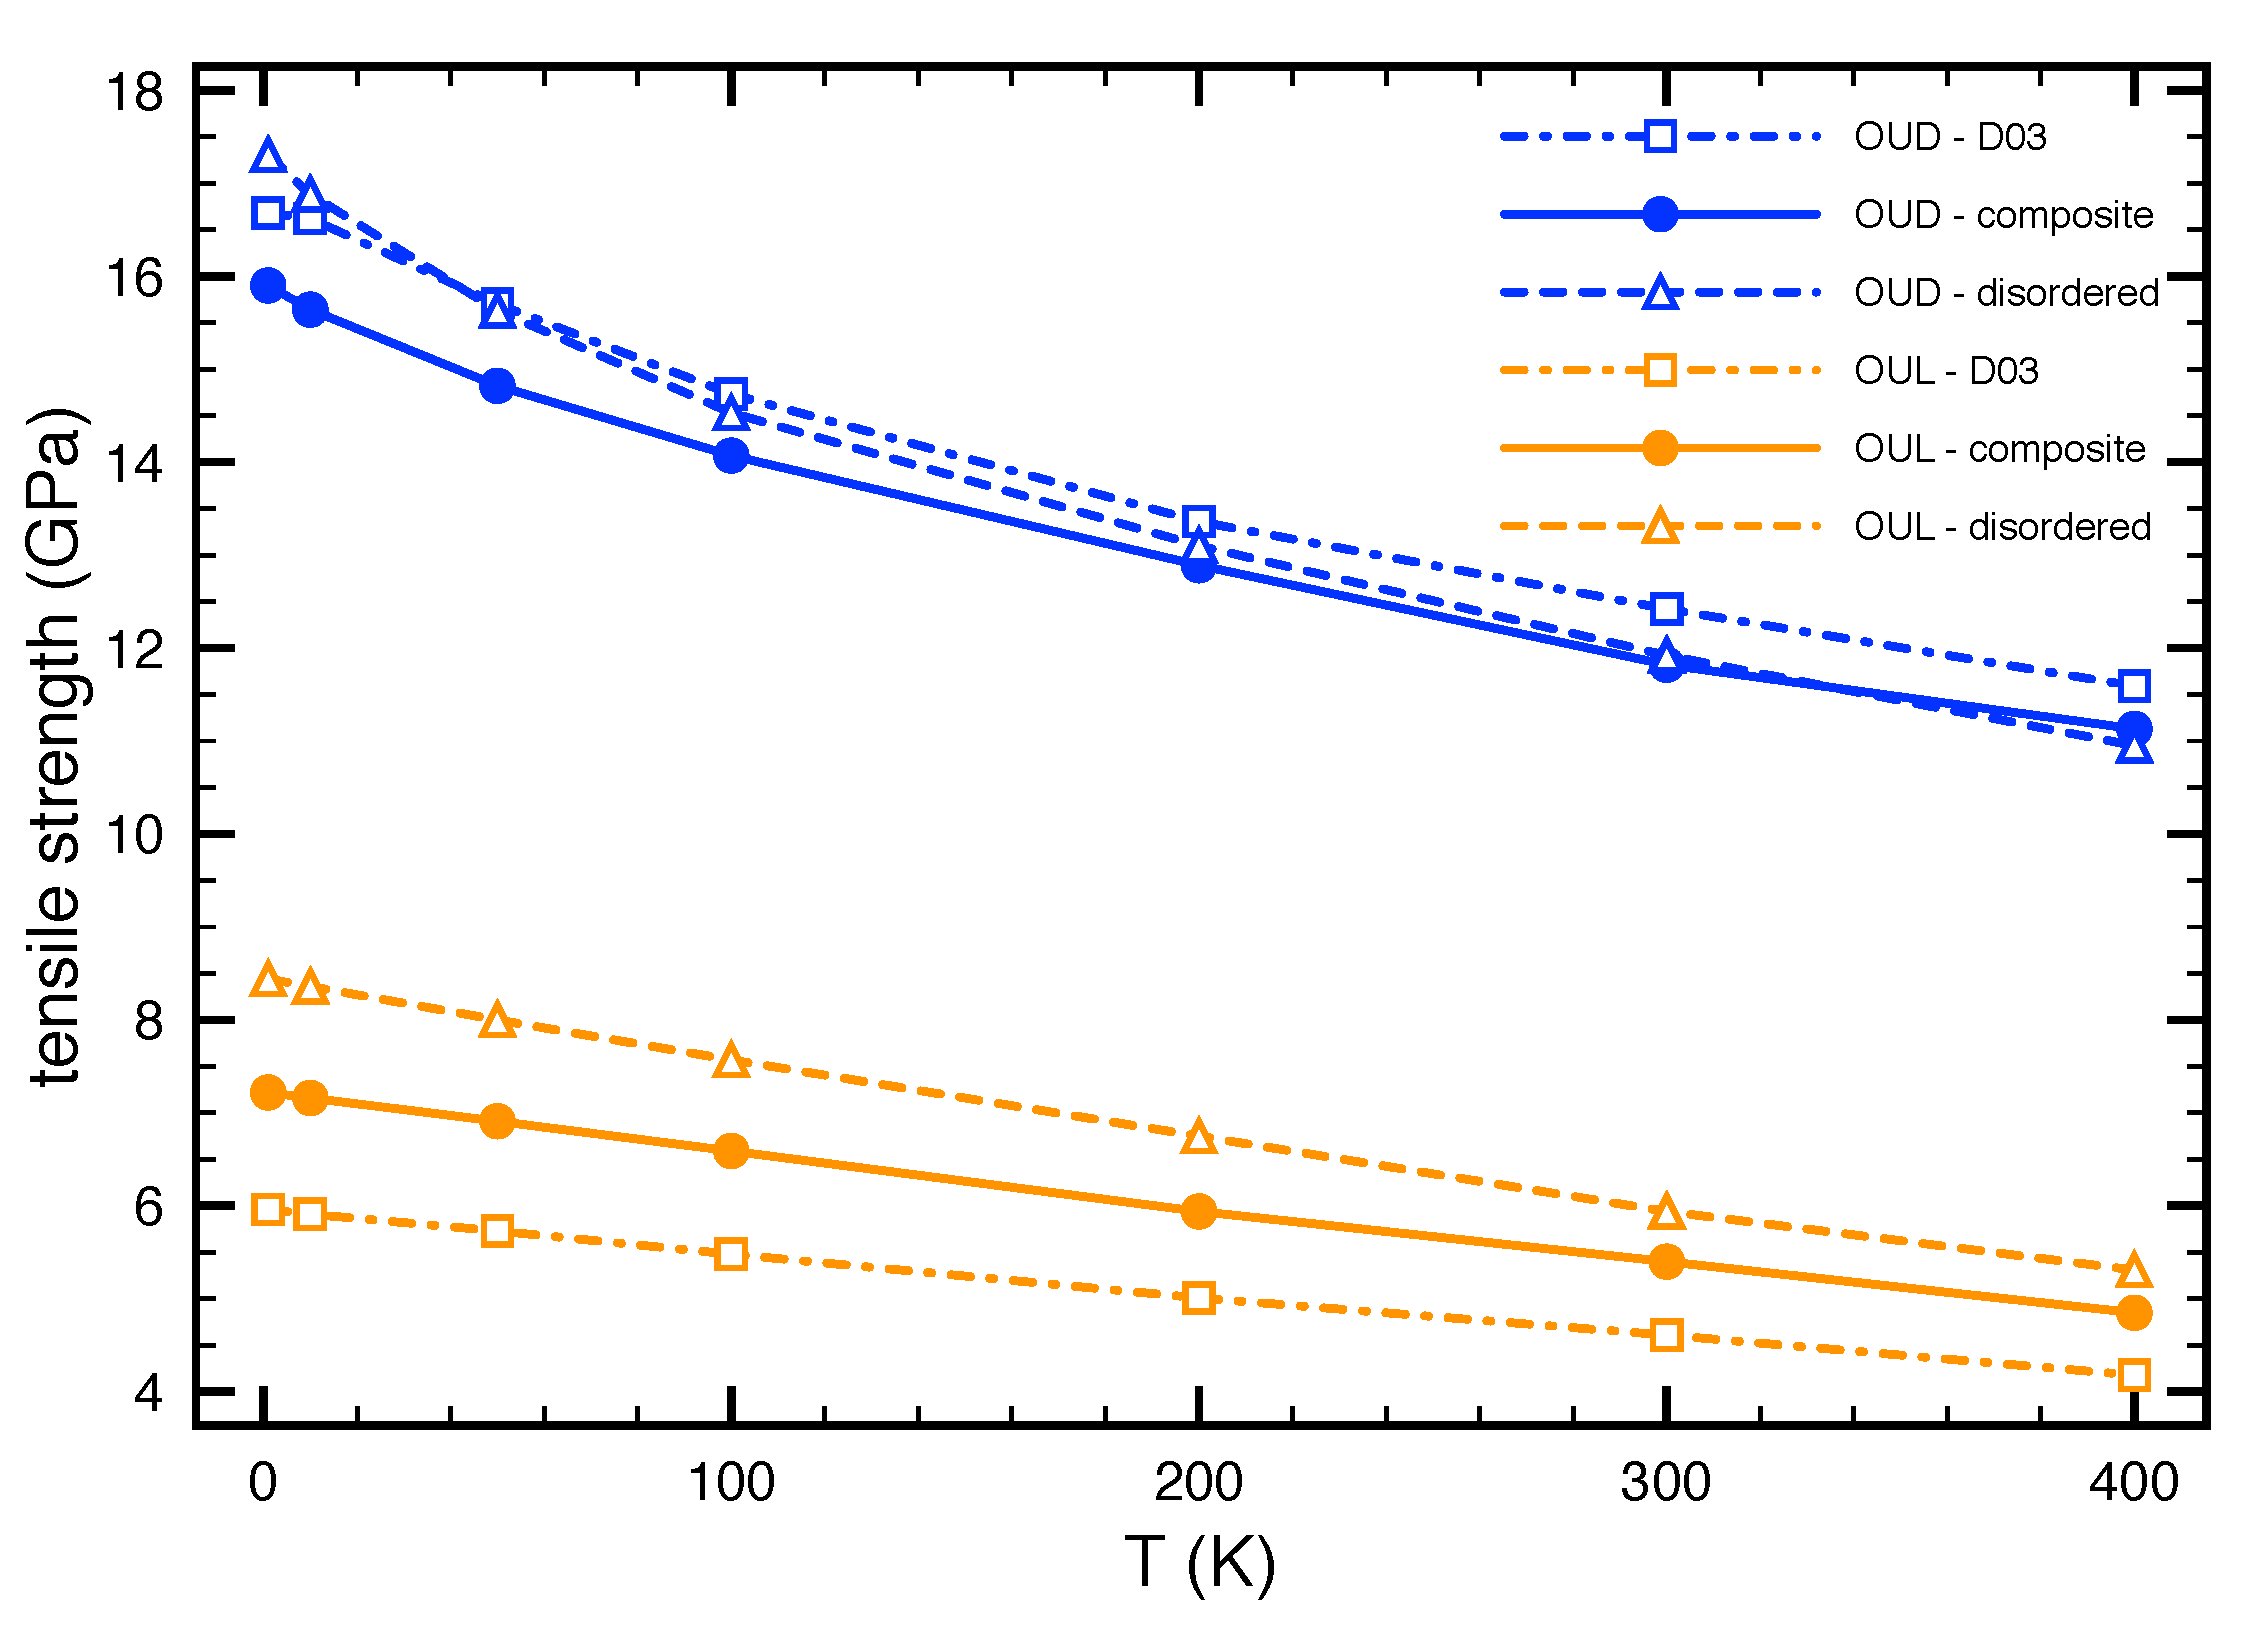
3.4. Temperature Effect on the Tensile Strength
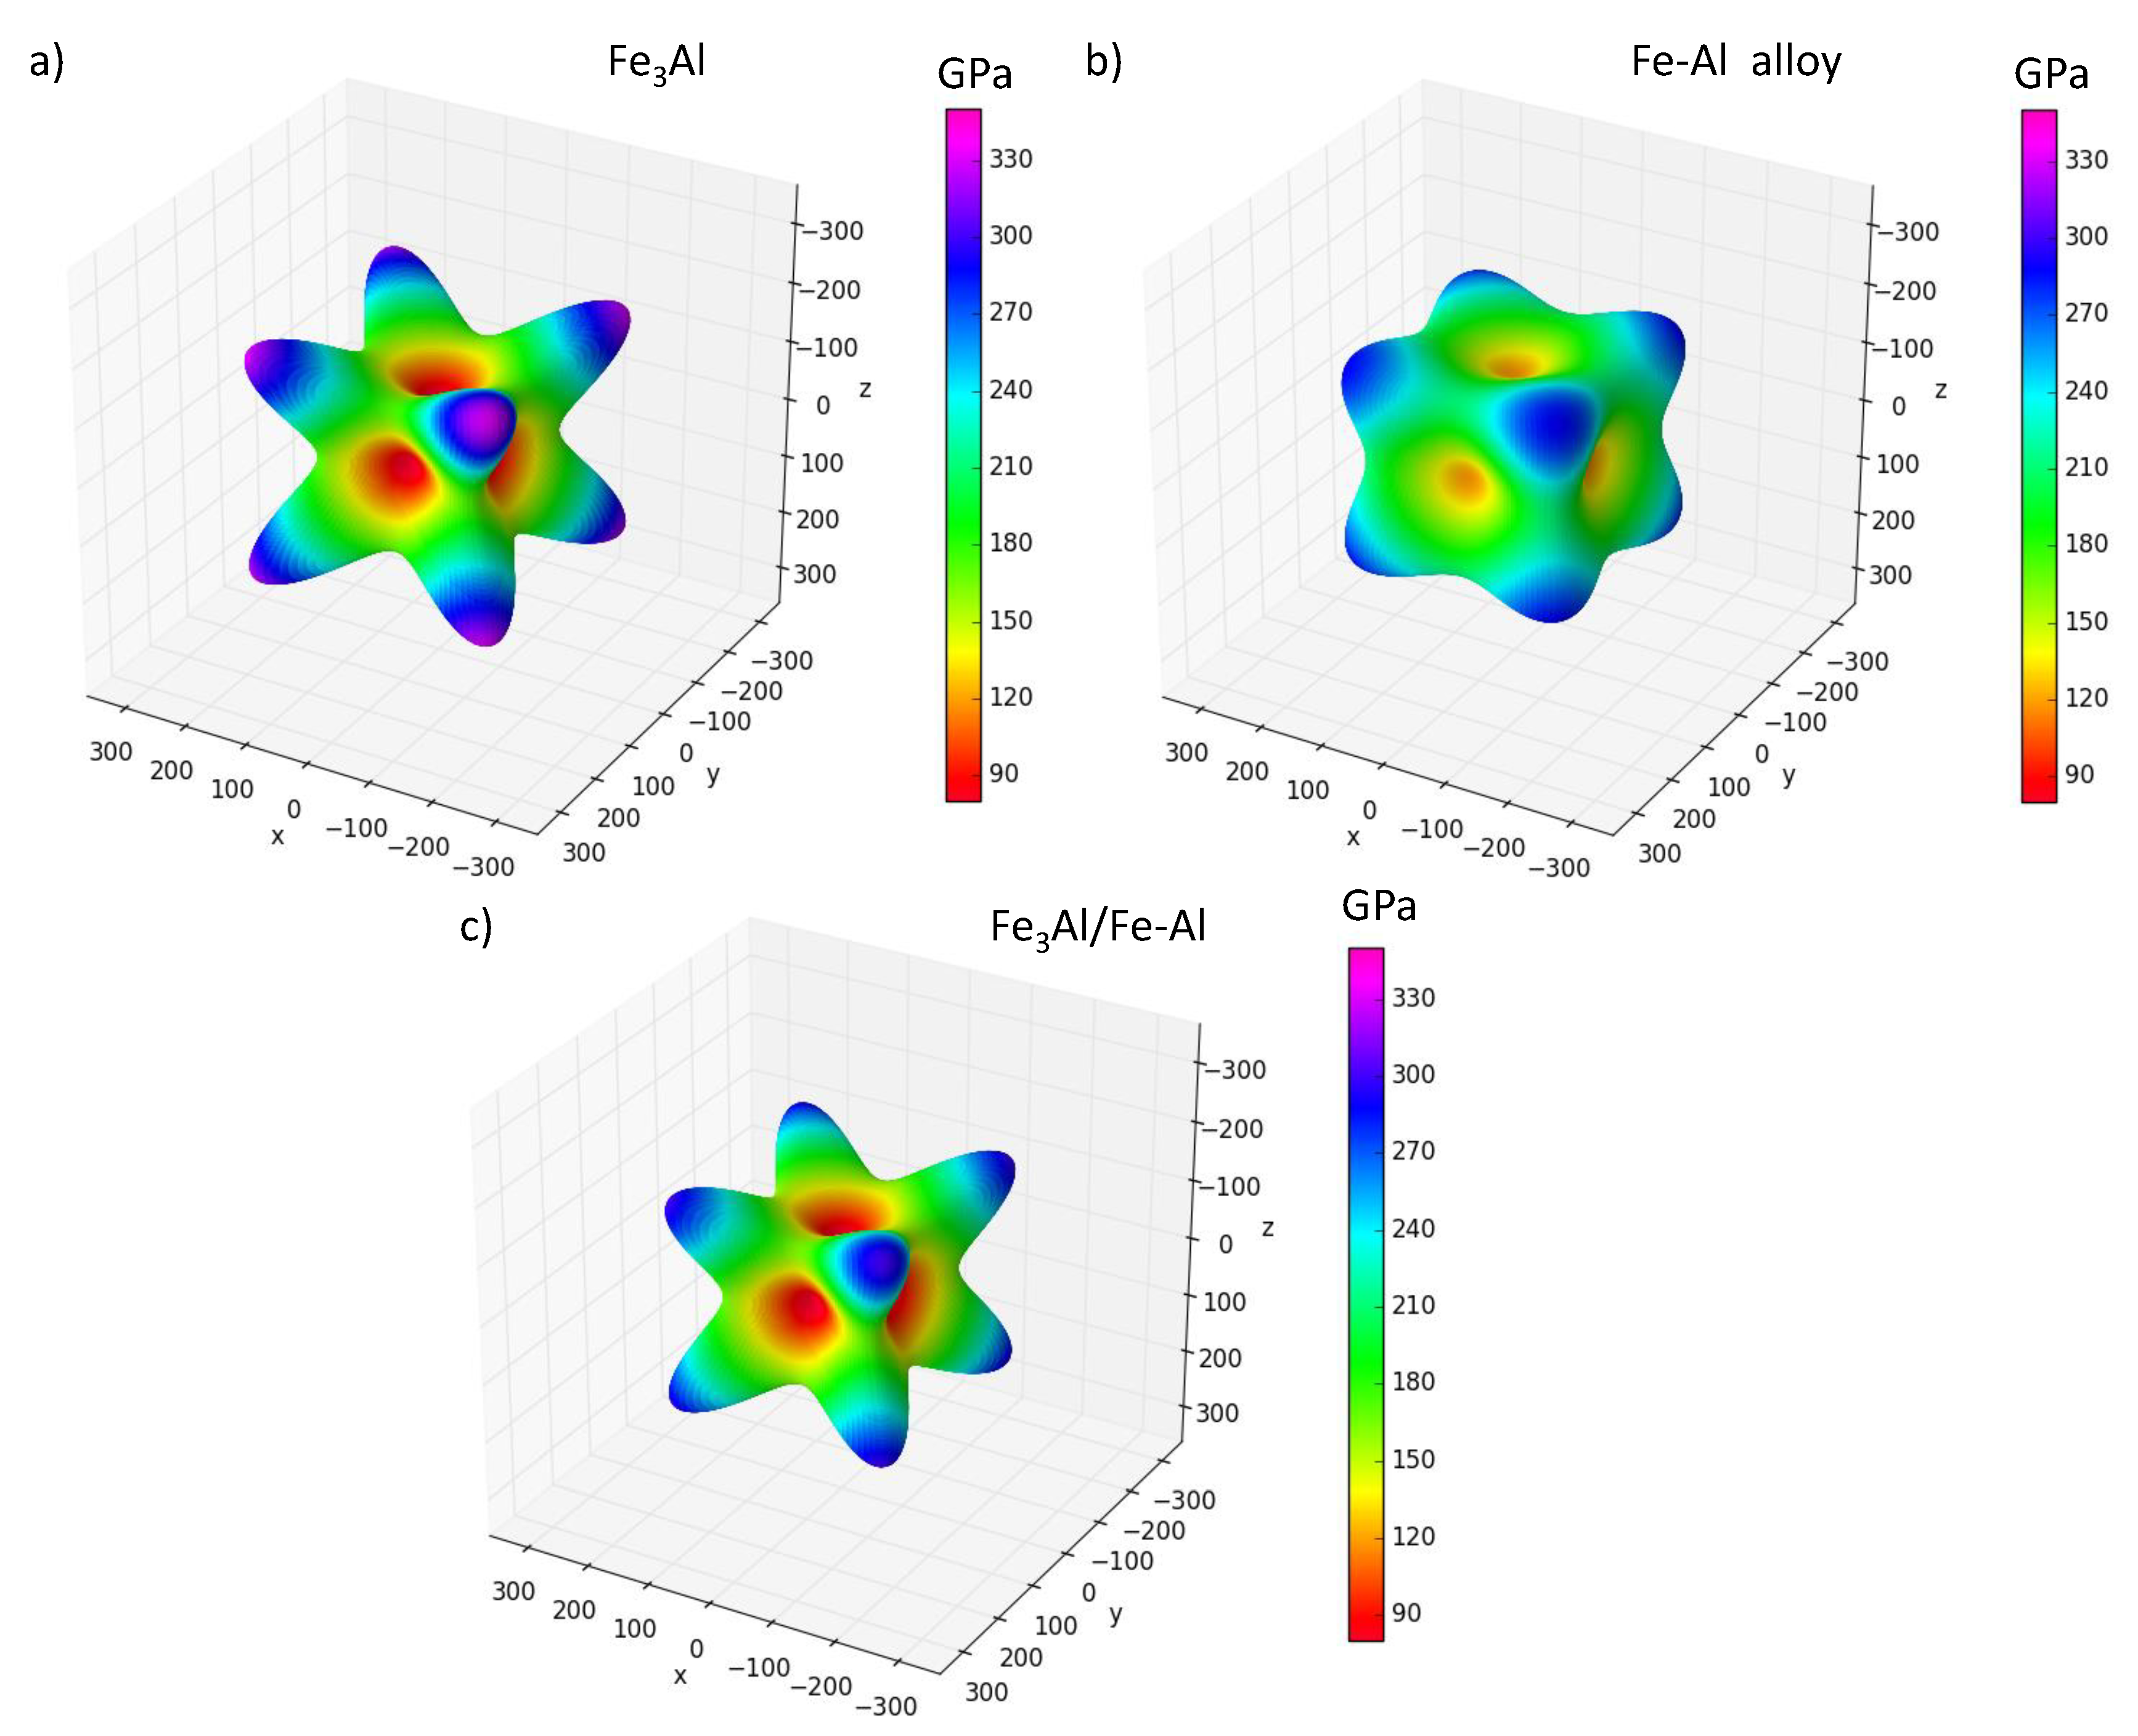
3.5. Elastic Constants
3.6. Fracture of the Nanocomposite upon Loading
4. Conclusions
Author Contributions
Funding
Acknowledgments
Conflicts of Interest
References
- Hotar, A.; Kejzlar, P.; Palm, M.; Minarik, J. The effect of Zr on high-temperature oxidation behaviour of Fe3Al-based alloys. Corros. Sci. 2015, 100, 147–157. [Google Scholar] [CrossRef]
- Brito, P.; Schuller, E.; Silva, J.; Campos, T.; de Araujo, C.R.; Carneiro, J.R. Electrochemical corrosion behaviour of (100), (110) and (111) Fe3A single crystals in sulphuric acid. Corros. Sci. 2017, 126, 366–373. [Google Scholar] [CrossRef]
- Sauthoff, G. Intermetallics; VCH Verlagsgesellschaft: Weinheim, Germany, 1995. [Google Scholar]
- Liu, C.T.; Stringer, J.; Mundy, J.N.; Horton, L.L.; Angelini, P. Ordered intermetallic alloys: An assessment. Intermetallics 1997, 5, 579–596. [Google Scholar] [CrossRef]
- Stoloff, N.S. Iron aluminides: Present status and future prospects. Mater. Sci. Eng. A 1998, 258, 1–14. [Google Scholar] [CrossRef]
- Liu, C.T.; Lee, E.H.; McKamey, C.G. An environmental-effect as the major cause for room-temperature embrittlement in FeAl. Scr. Metall. 1989, 23, 875–880. [Google Scholar] [CrossRef]
- Lynch, R.J.; Heldt, L.A.; Milligan, W.W. Effects of alloy composition on environmental embrittlement of B2 ordered iron aluminides. Scr. Metall. 1991, 25, 2147–2151. [Google Scholar] [CrossRef]
- Liu, C.T.; McKamey, C.G.; Lee, E.H. Environmental-effects on room-temperature ductility and fracture in Fe3Al. Scr. Metall. 1990, 24, 385–389. [Google Scholar] [CrossRef]
- Lynch, R.J.; Gee, K.A.; Heldt, L.A. Environmental embrittlement of single-crystal and thermomechanically processed B2-ordered iron aluminides. Scr. Metall. 1994, 30, 945–950. [Google Scholar] [CrossRef]
- Li, X.; Prokopcakova, P.; Palm, M. Microstructure and mechanical properties of Fe-Al-Ti-B alloys with additions of Mo and W. Mater. Sci. Eng. A Struct. Mater. Prop. Microstruct. Process. 2014, 611, 234–241. [Google Scholar] [CrossRef]
- Azmi, S.A.; Michalcova, A.; Sencekova, L.; Palm, M. Microstructure and mechanical properties of Fe-Al-Nb-B alloys. MRS Adv. 2017, 2, 1353–1359. [Google Scholar] [CrossRef]
- Lazinska, M.; Durejko, T.; Czujko, T.; Bojar, Z. The Effect of the Traverse Feed Rate on the Microstructure and Mechanical Properties of Laser Deposited Fe3Al (Zr,B) Intermetallic Alloy. Materials 2018, 11, 792. [Google Scholar] [CrossRef] [PubMed]
- Kratochvil, P.; Danis, S.; Minarik, P.; Pesicka, J.; Kral, R. Strengthening of Fe3Al Aluminides by One or Two Solute Elements. Metall. Mater. Trans. A Phys. Metall. Mater. Sci. 2017, 48A, 4135–4139. [Google Scholar] [CrossRef]
- Zamanzade, M.; Barnoush, A.; Motz, C. A Review on the Properties of Iron Aluminide Intermetallics. Crystals 2016, 6, 10. [Google Scholar] [CrossRef]
- Dobeš, F.; Dymáček, P.; Friák, M. Small punch creep of Fe-Al-Cr alloy with Ce addition and its relation to uniaxial creep tests. Kov. Mater. Metal. Mater. 2018, 56, 205–212. [Google Scholar] [CrossRef]
- Friák, M.; Oweisová, S.; Pavlů, J.; Holec, D.; Šob, M. An ab initio study of thermodynamic and mechanical stability of Heusler-based Fe2AlCo polymorphs. Materials 2018, 11, 1543. [Google Scholar] [CrossRef] [PubMed]
- Slávik, A.; Miháliková, I.; Friák, M.; Všianská, M.; Šob, M. Quantum-mechanical study of magnetic properties of superalloy nanocomposite phase Fe2AlTi. In Proceedings of the NANOCON 2017 Conference Proceedings (9th International Conference on Nanomaterials—Research & Application, Brno, Czech Republic, 18–20 October 2017; Tanger Ltd.: Ostrava, Czech Republic, 2018; pp. 63–68. [Google Scholar]
- Miháliková, I.; Friák, M.; Slávik, A.; Všianská, M.; Koutná, N.; Holec, D.; Šob, M. First-principles study of interface energies in Fe-Al-based superalloy nanocomposites. In Proceedings of the NANOCON 2017 Conference Proceedings (9th International Conference on Nanomaterials—Research & Application, Brno, Czech Republic, 18–20 October 2017; Tanger Ltd.: Ostrava, Czech Republic, 2018; pp. 69–74. [Google Scholar]
- Friák, M.; Slávik, A.; Miháliková, I.; Holec, D.; Všianská, M.; Šob, M.; Palm, M.; Neugebauer, J. Origin of the low magnetic moment in Fe2AlTi: An ab initio study. Materials 2018, 11, 1732. [Google Scholar] [CrossRef] [PubMed]
- Kratochvil, P.; Pesicka, J.; Kral, R.; Svec, M.; Palm, M. Evaluation of solid-solution hardening of Fe-27 at. pct Al by vanadium and comparison to precipitation strengthening by vanadium carbides. Metall. Mater. Trans. A Phys. Metall. Mater. Sci. 2015, 46A, 5091–5094. [Google Scholar] [CrossRef]
- Sencekova, L.; Palm, M.; Pesicka, J.; Vesely, J. Microstructures, mechanical properties and oxidation behaviour of single-phase Fe3Al (D03) and two-phase α-Fe-Al (A2) + Fe3Al (D03) Fe-Al-V alloys. Intermetallics 2016, 73, 58–66. [Google Scholar] [CrossRef]
- Shahid, R.N.; Scudino, S. Strengthening of Al-Fe3Al composites by the generation of harmonic structures. Sci. Rep. 2018, 8. [Google Scholar] [CrossRef] [PubMed]
- Verona, M.N.; Setti, D.; Cortes Paredes, R.S. Microstructure and Properties of Fe3Al-Fe3AlC (x) Composite Prepared by Reactive Liquid Processing. Metall. Mater. Trans. B Process Metall. Mater. Process. Sci. 2018, 49, 529–536. [Google Scholar] [CrossRef]
- Prakash, U. Intermetallic matrix composites based on iron aluminides. In Intermetallic Matrix Composites: Properties and Applications; Mitra, R., Ed.; Woodhead Publishing Series in Composites Science and Engineering; Elsevier Science: Amsterdam, The Netherlands, 2018; pp. 21–35. [Google Scholar]
- Sharifitabar, M.; Khaki, J.V.; Sabzevar, M.H. Formation mechanism of TiC-Al2O3-Fe3Al composites during self-propagating high-temperature synthesis of TiO2-Al-C-Fe system. Ceram. Int. 2016, 42, 12361–12370. [Google Scholar] [CrossRef]
- Duan, X.; Gao, S.; Dong, Q.; Zhou, Y.; Xi, M.; Xian, X.; Wang, B. Reinforcement mechanism and wear resistance of Al2O3/Fe-Cr-Mo steel composite coating produced by laser cladding. Surf. Coat. Technol. 2016, 291, 230–238. [Google Scholar] [CrossRef]
- Kong, J.; Wei, Y.; Li, J.; Huang, J.; Wang, T. Microwave-assisted combustion synthesis of Fe3Al bulk nanocrystalline intermetallic matrix composites. Adv. Powder Technol. 2015, 26, 778–782. [Google Scholar] [CrossRef]
- Imandoust, A.; Zarei-Hanzaki, A.; Ou, K.L.; Yu, C.H. D03 Ordered Phase Strengthening in Dual Phase Twinning-Induced Plasticity Steel. J. Mater. Eng. Perform. 2015, 24, 2085–2090. [Google Scholar] [CrossRef]
- Cheng, J.; Yin, B.; Qiao, Z.; Yang, J.; Liu, W. Mechanical and dry-sliding tribological properties of Fe3Al based composites reinforced by novel W0.5Al0.5C0.5 particulates. Mater. Des. 2015, 66, 67–76. [Google Scholar] [CrossRef]
- Molina, A.; Torres-Islas, A.; Serna, S.; Acosta-Flores, M.; Rodriguez-Diaz, R.A.; Colin, J. Corrosion, Electrical and Mechanical Performance of Copper Matrix Composites Produced by Mechanical Alloying and Consolidation. Int. J. Electrochem. Sci. 2015, 10, 1728–1741. [Google Scholar]
- Bai, Y.; Xing, J.; Guo, Y.; Li, J.; He, Y.; Ma, S. Effect of Cr on Microstructure, Mechanical Properties, and Wear Behavior of In Situ 20 wt.%Al2O3/Fe-25Al Composites. J. Mater. Eng. Perform. 2015, 24, 936–945. [Google Scholar] [CrossRef]
- Panda, D.; Kumar, L.; Alam, S.N. Development of Al-Fe3Al Nanocomposite by Powder Metallurgy Route. Mater. Today Proc. 2015, 2, 3565–3574. [Google Scholar] [CrossRef]
- Dobes, F.; Kratochvil, P.; Kejzlar, P. Creep of three-phase alloy Fe-30%Al-5.2%Zr. Kovove Mater. Metal. Mater. 2015, 53, 127–132. [Google Scholar] [CrossRef]
- Jiraskova, Y.; Pizurova, N.; Titov, A.; Janickovic, D.; Friak, M. Phase separation in Fe-Ti-Al alloy - Structural, magnetic, and Mossbauer study. J. Magn. Magn. Mater. 2018, 468, 91–99. [Google Scholar] [CrossRef]
- Kattner, U.; Burton, B. Al-Fe (Aluminium-Iron). In Phase Diagrams of Binary Iron Alloys; Okamoto, H., Ed.; ASM International: Geauga County, OH, USA, 1993; pp. 12–28. [Google Scholar]
- Sundman, B.; Ohnuma, I.; Dupin, N.; Kattner, U.R.; Fries, S.G. An assessment of the entire Al-Fe system including D0(3) ordering. Acta Mater. 2009, 57, 2896–2908. [Google Scholar] [CrossRef]
- Allen, S.; Cahn, J. Mechanisms of phase-transformations within miscibility gap of Fe-rich Fe-Al alloys. Acta Metall. Mater. 1976, 24, 425–437. [Google Scholar] [CrossRef]
- Oguma, R.; Matsumura, S.; Eguchi, T. Kinetics of B2-and D03 type ordering and formation of domain structures in Fe-Al alloys. J. Phys. Condens. Matter 2008, 20, 275225. [Google Scholar] [CrossRef] [PubMed]
- Watson, R.E.; Weinert, M. Transition-metal aluminide formation: Ti, V, Fe, and Ni aluminides. Phys. Rev. B 1998, 58, 5981–5988. [Google Scholar] [CrossRef]
- Gonzales-Ormeno, P.; Petrilli, H.; Schon, C. Ab-initio calculations of the formation energies of BCC-based superlattices in the Fe-Al system. Calphad 2002, 26, 573–582. [Google Scholar] [CrossRef]
- Perdew, J.P.; Burke, K.; Ernzerhof, M. Generalized Gradient Approximation Made Simple. Phys. Rev. Lett. 1996, 77, 3865–3868. [Google Scholar] [CrossRef] [PubMed]
- Lechermann, F.; Welsch, F.; Elsässer, C.; Ederer, C.; Fähnle, M.; Sanchez, J.M.; Meyer, B. Density-functional study of Fe3Al: LSDA versus GGA. Phys. Rev. B 2002, 65. [Google Scholar] [CrossRef]
- Lechermann, F.; Fähnle, M.; Meyer, B.; Elsässer, C. Electronic correlations, magnetism, and structure of Fe-Al subsystems: An LDA+U study. Phys. Rev. B 2004, 69. [Google Scholar] [CrossRef]
- Connetable, D.; Maugis, P. First principle calculations of the kappa-Fe3AlC perovskite and iron-aluminium intermetallics. Intermetallics 2008, 16, 345–352. [Google Scholar] [CrossRef] [Green Version]
- Amara, H.; Fu, C.C.; Soisson, F.; Maugis, P. Aluminum and vacancies in α-iron: Dissolution, diffusion, and clustering. Phys. Rev. B 2010, 81, 174101. [Google Scholar] [CrossRef]
- Liu, S.; Duan, S.; Ma, B. First-principles calculation of vibrational entropy for Fe-Al compounds. Phys. Rev. B 1998, 58, 9705–9709. [Google Scholar]
- Kulikov, N.I.; Postnikov, A.V.; Borstel, G.; Braun, J. Onset of magnetism in B2 transition-metal aluminides. Phys. Rev. B 1999, 59, 6824–6833. [Google Scholar] [CrossRef]
- Friák, M.; Neugebauer, J. Ab initio study of the anomalous volume-composition dependence in Fe-Al alloys. Intermetallics 2010, 18, 1316–1321. [Google Scholar] [CrossRef]
- Fähnle, M.; Drautz, R.; Lechermann, F.; Singer, R.; Diaz-Ortiz, A.; Dosch, H. Thermodynamic properties from ab-initio calculations: New theoretical developments, and applications to various materials systems. Phys. Status Solidi B-Basic Solid State Phys. 2005, 242, 1159–1173. [Google Scholar] [CrossRef]
- Friák, M.; Deges, J.; Krein, R.; Frommeyer, G.; Neugebauer, J. Combined ab initio and experimental study of structural and elastic properties of Fe3Al-based ternaries. Intermetallics 2010, 18, 1310. [Google Scholar] [CrossRef]
- Kirklin, S.; Saal, J.E.; Hegde, V.I.; Wolverton, C. High-throughput computational search for strengthening precipitates in alloys. Acta Mater. 2016, 102, 125–135. [Google Scholar] [CrossRef] [Green Version]
- Airiskallio, E.; Nurmi, E.; Heinonen, M.H.; Vayrynen, I.J.; Kokko, K.; Ropo, M.; Punkkinen, M.P.J.; Pitkanen, H.; Alatalo, M.; Kollar, J.; et al. High temperature oxidation of Fe-Al and Fe-Cr-Al alloys: The role of Cr as a chemically active element. Corros. Sci. 2010, 52, 3394–3404. [Google Scholar] [CrossRef]
- Medvedeva, N.I.; Park, M.S.; Van Aken, D.C.; Medvedeva, J.E. First-principles study of Mn, Al and C distribution and their effect on stacking fault energies in fcc Fe. J. Alloy Compd. 2014, 582, 475–482. [Google Scholar] [CrossRef]
- Kresse, G.; Joubert, D. From ultrasoft pseudopotentials to the projector augmented-wave method. Phys. Rev. B 1999, 59, 1758–1775. [Google Scholar] [CrossRef]
- Kresse, G.; Furthmüller, J. Efficient iterative schemes for ab initio total-energy calculations using a plane-wave basis set. Phys. Rev. B 1996, 54, 11169–11186. [Google Scholar] [CrossRef]
- Čížek, J.; Lukáč, F.; Procházka, I.; Kužel, R.; Jirásková, Y.; Janičkovič, D.; Anwand, W.; Brauer, G. Characterization of quenched-in vacancies in Fe-Al alloys. Phys. B 2012, 407, 2659–2664. [Google Scholar] [CrossRef]
- Ipser, H.; Semenova, O.; Krachler, R. Intermetallic phases with D0(3)-structure: A statistical-thermodynamic model. J. Alloy. Compd. 2002, 338, 20–25. [Google Scholar] [CrossRef]
- Kellou, A.; Grosdidier, T.; Raulot, J.M.; Aourag, H. Atomistic study of magnetism effect on structural stability in Fe3Al and Fe3AlX (X = H, B, C, N, O) alloys. Phys. Status Solidi B Basic Solid State Phys. 2008, 245, 750–755. [Google Scholar] [CrossRef]
- Perdew, J.P.; Wang, Y. Accurate and simple analytic representation of the electron-gas correlation energy. Phys. Rev. B 1992, 45, 13244–13249. [Google Scholar] [CrossRef]
- Monkhorst, H.J.; Pack, J.D. Special points for Brillouin-zone integrations. Phys. Rev. B 1976, 13, 5188–5192. [Google Scholar] [CrossRef]
- Zunger, A.; Wei, S.; Ferreira, L.; Bernard, J. Special quasirandom structures. Phys. Rev. Lett. 1990, 65, 353–356. [Google Scholar] [CrossRef] [PubMed] [Green Version]
- Plimpton, S. Fast Parallel Algorithms for Short-Range Molecular Dynamics. J. Comput. Phys. 1995, 117, 1–19. [Google Scholar] [CrossRef] [Green Version]
- Mendelev, M.; Srolovitz, D.; Ackland, G.; Han, S. Effect of Fe Segregation on the Migration of a Non-Symmetric Σ5 Tilt Grain Boundary in Al. J. Mater. Res. 2005, 20, 208–218. [Google Scholar] [CrossRef]
- Pokluda, J.; Černý, M.; Šob, M.; Umeno, Y. Ab initio calculations of mechanical properties: Methods and applications. Prog. Mater. Sci. 2015, 73, 127–158. [Google Scholar] [CrossRef]
- Černý, M.; Šesták, P.; Řehák, P.; Všianská, M.; Šob, M. Ab initio tensile tests of grain boundaries in the fcc crystals of Ni and Co with segregated sp-impurities. Mater. Sci. Eng. A 2016, 669, 218–225. [Google Scholar] [CrossRef]
- Černý, M.; Šesták, P.; Řehák, P.; Všianská, M.; Šob, M. Atomistic approaches to cleavage of interfaces. 2018; submitted. [Google Scholar]
- Šob, M.; Wang, L.G.; Vitek, V. Local stability of higher-energy phases in metallic materials and its relation to the structure of extended defects. Comput. Mater. Sci. 1997, 8, 100–106. [Google Scholar] [CrossRef]
- Wang, L.G.; Šob, M.; Zhang, Z. Instability of higher-energy phases in simple and transition metals. J. Phys. Chem. Solids 2003, 64, 863–872. [Google Scholar] [CrossRef] [Green Version]
- Šob, M.; Wang, L.G.; Vitek, V. Ab initio calculation of the ideal tensile strength in copper and nickel aluminide. Kov. Mater. Metal. Mater. 1998, 36, 145–152. [Google Scholar]
- Legut, D.; Šob, M. Ideal Tensile Strength of Ni3Al and Fe3Al with D03 Structure; Book Series; Materials Science Forum: Zurich, Switzerland, 2008; Volume 567–568, pp. 77–80. [Google Scholar]
- Friák, M.; Šob, M.; Vitek, V. Ab initio calculation of tensile strength in iron. Philos. Mag. 2003, 83, 3529–3537. [Google Scholar] [CrossRef]
- Černý, M.; Pokluda, J. Influence of superimposed biaxial stress on the tensile strength of perfect crystals from first principles. Phys. Rev. B 2007, 76, 024115. [Google Scholar] [CrossRef]
- Černý, M.; Pokluda, J. Ideal tensile strength of cubic crystals under superimposed transverse biaxial stresses from first principles. Phys. Rev. B 2010, 82, 174106. [Google Scholar] [CrossRef]
- Friák, M.; Šob, M.; Vítek, V. Proceedings of the International Conference Juniormat-01; Brno University of Technology: Brno, Czech Republic, 2001; pp. 117–120. [Google Scholar]
- Clatterbuck, D.M.; Chrzan, D.C.; Morris, J.W., Jr. The inherent tensile strength of iron. Philos. Mag. Lett. 2002, 82, 141–147. [Google Scholar] [CrossRef]
- Clatterbuck, D.M.; Chrzan, D.C.; Morris, J.W., Jr. The ideal strength of iron in tension and shear. Acta Mater. 2003, 51, 2271–2283. [Google Scholar] [CrossRef] [Green Version]
- Šob, M.; Friák, M.; Legut, D.; Vítek, V. Complex Inorganic Solids: Structural, Stability, and Magnetic Properties of Alloys; Turchi, P.E.A., Gonis, A., Rajan, K., Meike, A., Eds.; Springer: New York, NY, USA, 2005. [Google Scholar]
- Yue-Lin, L.; Ying, Z.; Rong-Jie, H.; Guang-Hong, L. Study of the theoretical tensile strength of Fe by a first-principles computational tensile test. Chin. Phys. B 2009, 18, 1923. [Google Scholar] [CrossRef]
- Li, W.; Wang, T. Ab initio investigation of the elasticity and stability of aluminium. J. Phys. Condens. Matter 1998, 10, 9889–9904. [Google Scholar] [CrossRef] [Green Version]
- Clatterbuck, D.M.; Krenn, C.R.; Cohen, M.L.; Morris, J.W., Jr. Phonon Instabilities and the Ideal Strength of Aluminum. Phys. Rev. Lett. 2003, 91, 135501. [Google Scholar] [CrossRef] [PubMed]
- Řehák, P.; Černý, M.; Pokluda, J. The [100] Compressive Strength of Perfect Cubic Crystals under Superimposed Biaxial Stresses. Key Eng. Mater. 2011, 465, 183–186. [Google Scholar] [CrossRef]
- Černý, M.; Pokluda, J. The theoretical tensile strength of fcc crystals predicted from shear strength calculations. J. Phys. Condens. Matter 2009, 21, 145406. [Google Scholar] [CrossRef] [PubMed]
- Yang, R.; Tang, B.; Gao, T. A comparison of mechanical properties between Al and Al3Mg. Int. J. Mod Phys. B 2016, 30, 1550243. [Google Scholar] [CrossRef]
- Simmons, G.; Wang, H. Single Crystal Elastic Constants and Calculated Aggregate Properties: A Handbook; MIT Press: Cambridge, MA, USA, 1971; ISBN 0262190923. [Google Scholar]
- Moakher, M.; Norris, A.N. The Closest Elastic Tensor of Arbitrary Symmetry to an Elasticity Tensor of Lower Symmetry. J. Elast. 2006, 85, 215–263. [Google Scholar] [CrossRef] [Green Version]
- Zhou, L.; Holec, D.; Mayrhofer, P.H. First-principles study of elastic properties of cubic Cr1-xAlxN alloys. J. Appl. Phys. 2013, 113. [Google Scholar] [CrossRef]
- Mouhat, F.; Coudert, F.X. Necessary and sufficient elastic stability conditions in various crystal systems. Phys. Rev. B 2014, 90, 224104. [Google Scholar] [CrossRef]
- Titrian, H.; Aydin, U.; Friák, M.; Ma, D.; Raabe, D.; Neugebauer, J. Self-consistent Scale-bridging Approach to Compute the Elasticity of Multi-phase Polycrystalline Materials. MRS Proc. 2013, 1524. [Google Scholar] [CrossRef]
- Friák, M.; Counts, W.A.; Ma, D.; Sander, B.; Holec, D.; Raabe, D.; Neugebauer, J. Theory-Guided Materials Design of Multi-Phase Ti-Nb Alloys with Bone-Matching Elastic Properties. Materials 2012, 5, 1853–1872. [Google Scholar] [CrossRef] [Green Version]
- Zhu, L.-F.; Friák, M.; Lymperakis, L.; Titrian, H.; Aydin, U.; Janus, A.M.; Fabritius, H.-O.; Ziegler, A.; Nikolov, S.; Hemzalová, P.; et al. Ab initio study of single-crystalline and polycrystalline elastic properties of Mg-substituted calcite crystals. J. Mech. Behav. Biomed. Mater. 2013, 20, 296–304. [Google Scholar] [CrossRef] [PubMed]
- Tasnádi, F.; Abrikosov, I.A.; Rogström, L.; Almer, J.; Johansson, M.P.; Oden, M. Significant elastic anisotropy in Ti1-xAlxN alloys. Appl. Phys. Lett. 2010, 97. [Google Scholar] [CrossRef]
- Tasnádi, F.; Odén, M.; Abrikosov, I.A. Ab initio elastic tensor of cubic Ti0.5Al0.5N alloys: Dependence of elastic constants on size and shape of the supercell model and their convergence. Phys. Rev. B 2012, 85. [Google Scholar] [CrossRef]
- von Pezold, J.; Dick, A.; Friak, M.; Neugebauer, J. Generation and performance of special quasirandom structures for studying the elastic properties of random alloys: Application to Al-Ti. Phys. Rev. B 2010, 81. [Google Scholar] [CrossRef]
- Holec, D.; Tasnádi, F.; Wagner, P.; Friák, M.; Neugebauer, J.; Mayrhofer, P.H.; Keckes, J. Macroscopic elastic properties of textured ZrN-AlN polycrystalline aggregates: From ab initio calculations to grainscale interactions. Phys. Rev. B 2014, 90. [Google Scholar] [CrossRef]
- Koutná, N.; Holec, D.; Friák, M.; Mayrhofer, P.H.; Šob, M. Stability and elasticity of metastable solid solutions and superlattices in the MoN–TaN system: First-principles calculations. Mater. Des. 2018, 144, 310–322. [Google Scholar] [CrossRef]
- Park, N.; Lee, S.C.; Cha, P.R. Effects of alloying elements on the stability and mechanical properties of Fe3Al from first-principles calculations. Comput. Mater. Sci. 2018, 146, 303–309. [Google Scholar] [CrossRef]
- Niu, X.L.; Wang, L.J. Effect of transition-metal substitution on electronic and mechanical properties of Fe3Al: First-principles calculations. Comput. Mater. Sci. 2012, 53, 128–132. [Google Scholar] [CrossRef]
- Liu, Y.; Chong, X.; Jiang, Y.; Zhou, R.; Feng, J. Mechanical properties and electronic structures of Fe-Al intermetallic. Phys. B Condens. Matter 2017, 506, 1–11. [Google Scholar] [CrossRef]
- Leamy, H.; Gibson, E.; Kayser, F. Elastic stiffness coefficients of iron-aluminum alloys. I. experimental results and thermodynamic analysis. Acta Metall. 1967, 15, 1827. [Google Scholar] [CrossRef]
- Shaojun, L.; Suqing, D.; Benkun, M. First-principles calculation of vibrational entropy for Fe-Al compounds. Phys. Rev. B 1998, 58, 9705–9709. [Google Scholar] [CrossRef]
- Voigt, W. Lehrbuch der Kristallphysik; Teubner: Stuttgart, Germany, 1928. [Google Scholar]
- Reuss, A. Account of the liquid limit of mixed crystals on the basis of the plasticity condition for single crystal. Z. Angew. Math. Mech. 1929, 9, 49–58. [Google Scholar] [CrossRef]
- Hershey, A.V. The elasticity of an isotropic aggregate of anisotropic cubic crystals. J. Appl. Mech. 1954, 21, 236–240. [Google Scholar]
- Friák, M.; Hickel, T.; Grabowski, B.; Lymperakis, L.; Udyansky, A.; Dick, A.; Ma, D.; Roters, F.; Zhu, L.F.; Schlieter, A.; et al. Methodological challenges in combining quantum-mechanical and continuum approaches for materials science applications. Eur. Phys. J. Plus 2011, 126, 101. [Google Scholar] [CrossRef]
- Pugh, S. Relations between the elastic moduli and the plastic properties of polycrystalline pure metals. Philos. Mag. 1954, 45, 823–843. [Google Scholar] [CrossRef]
- Pettifor, D. Theoretical predictions of structure and related properties of intermetallics. Mater. Sci. Technol. 1992, 8, 345–349. [Google Scholar] [CrossRef]


| ab initio | ab initio + ei | MD (qs) | MD (1 K) | |
|---|---|---|---|---|
| FeAl OUD | 24.7 | 22.0 | 18.6 | 16.7 |
| FeAl OUL | 4.1 | 4.1 | 6.0 | 6.0 |
| Fe-Al disordered OUD | 22.9 | - | 17.7 | 17.3 |
| Fe-Al disordered OUL | 7.8 | - | 8.5 | 8.4 |
| nanocomposite OUD | 23.0 | 21.4 | 16.6 | 16.0 |
| nanocomposite OUL | 5.6 | 5.5 | 7.0 | 7.2 |
| elemental Fe (bcc) | 0.63 [72] | 0.67 [72] | 12.7 [71,74,77], 14.2 [75], 12.6 [76], 12.4 [72,78] |
| elemental Al (fcc) | 0.00 | 0.73 | 12.6 [79], 12.1* [79], 12.92 [80] |
| 9.20** [80], 11.6 [81], 9.0* [82], 11.33 [83], 11.4 | |||
| Fe-Al - nanocomposite | 0.82 | 0.86 | 5.5 |
| FeAl - D0 | 0.89 | 0.87 | 4.1 |
| Fe-Al - disordered | 0.79 | 0.75 | 7.8 |
| B | G | ||||
|---|---|---|---|---|---|
| ordered FeAl-D0 | 211 | 161 | 139 | 178 | 73 |
| 225 [96] | 160 [96] | 147 [96] | 180 [96] | 101 [96] | |
| 283 [97] | 206 [97] | 149 [97] | 232 [97] | 87 [97] | |
| 285 [98] | 208 [98] | 151 [98] | 233 [98] | 88 [98] | |
| 159 [100] | 138 [100] | 138 [100] | 144* [100], 170** [100] | – | |
| experiment | 179 [99] | 131 [99] | 138 [99] | 147 [99] | – |
| disordered Fe-Al | 217 | 131 | 120 | 160 | 80 |
| nanocomposite | 193 | 144 | 127 | 160 | 68 |
| E | B/G | – | |||
| ordered FeAl-D0 | 193 | 0.319 | 2.438 | 22 | |
| 347 [96] | 0.179 [96] | 1.782 [96] | 13 [96] | ||
| – | 0.400 [97] | 2.632 [97] | 57 [97] | ||
| 234 [98] | 0.333 [98] | 2.65 [98] | 57 [98] | ||
| disordered Fe-Al | 206 | 0.285 | 2.000 | 11 | |
| nanocomposite | 178 | 0.314 | 2.353 | 17 |
© 2018 by the authors. Licensee MDPI, Basel, Switzerland. This article is an open access article distributed under the terms and conditions of the Creative Commons Attribution (CC BY) license (http://creativecommons.org/licenses/by/4.0/).
Share and Cite
Šesták, P.; Friák, M.; Holec, D.; Všianská, M.; Šob, M. Strength and Brittleness of Interfaces in Fe-Al Superalloy Nanocomposites under Multiaxial Loading: An ab initio and Atomistic Study. Nanomaterials 2018, 8, 873. https://doi.org/10.3390/nano8110873
Šesták P, Friák M, Holec D, Všianská M, Šob M. Strength and Brittleness of Interfaces in Fe-Al Superalloy Nanocomposites under Multiaxial Loading: An ab initio and Atomistic Study. Nanomaterials. 2018; 8(11):873. https://doi.org/10.3390/nano8110873
Chicago/Turabian StyleŠesták, Petr, Martin Friák, David Holec, Monika Všianská, and Mojmír Šob. 2018. "Strength and Brittleness of Interfaces in Fe-Al Superalloy Nanocomposites under Multiaxial Loading: An ab initio and Atomistic Study" Nanomaterials 8, no. 11: 873. https://doi.org/10.3390/nano8110873