Article

Metallic Effects on p-Hydroxyphenyl Porphyrin Thin-Film-Based Planar Optical Waveguide Gas Sensor: Experimental and Computational Studies

1
Institute of Applied Chemistry, College of Chemistry, Xinjiang University, Urumqi 830046, China
2
Chip Research Center, Chemistry Division, School of Science and Technology, University of Camerino, 62032 Camerino, Italy
3
Laboratory of Structural Biology and Bioinformatics, Institute of Microbiology of the Czech Academy of Sciences, Zamek 136, 37333 Nove Hrady, Czech Republic
4
Key Laboratory of Coal Cleaning Conversion and Chemical Engineering Process, College of Chemistry and Chemical Engineering, Xinjiang University, Urumqi 830046, China
*
Authors to whom correspondence should be addressed.
Nanomaterials 2022, 12(6), 944; https://doi.org/10.3390/nano12060944
Submission received: 23 December 2021 / Revised: 2 March 2022 / Accepted: 10 March 2022 / Published: 13 March 2022
(This article belongs to the Special Issue Nanostructured Materials for Gas Sensor Applications)

Abstract

:
Metal effects on the gas sensing behavior of metal complexes of 5,10,15,20-tetrakis(4-hydroxyphenyl)porphyrin (THPP) thin film was investigated in terms of detecting NO2 gas by the planar optical waveguide. For this purpose, several THPP and metal complexes were synthesized with different central metal ions: Co(II), Ni(II), Cu(II), and Zn(II). Planar optical gas sensors were fabricated with the metalloporphyrins deposited on K+ ion-exchanged soda-lime glass substrate with the spin coating method serving as host matrices for gas interaction. All of the THPP complex’s films were fully characterized by UV-Vis, IR and XPS spectroscopy, and the laser light source wavelength was selected at 520 and 670 nm. The results of the planar optical waveguide sensor show that the Zn–THPP complex exhibits the strongest response with the lowest detectable gas concentration of NO2 gas for both 520 nm and 670 nm. The Ni–THPP and Co–THPP complexes display good efficiency in the detection of NO2, while, on the other hand, Cu–THPP shows a very low interaction with NO2 gas, with only 50 ppm and 200 ppm detectable gas concentration for 520 nm and 670 nm, respectively. In addition, molecular dynamic simulations and quantum mechanical calculations were performed, proving to be coherent with the experimental results.

Graphical Abstract

1. Introduction

As one of the nonlinear optical limiters, porphyrin is a potential choice to fabricate a guiding wave-light system. Based on the electron-rich properties and macromolecular structure, this type of molecule attracts research interest and is applied in detecting gases and volatile organic compounds. Central metal effects on the nonlinear optical behavior and the excited state dynamics of tetrahydroxyphenylporphyrins (THPPs) with Fe, Co, Ni, Zn metals were investigated utilizing open aperture Z-scan technique and pump-probe experiments [1].
Odorants interact with tissues in living creatures, and metalloproteins are regarded as the sensing part of the olfactory system [2]. Therefore, colorimetric sensor arrays were developed as an optoelectronic nose to “see the smells”—differentiating volatile organic compounds in a facile way with an ordinary scanner based on metal substituted porphyrins [3]. Metalloporphyrins were also used as one of the responsive materials in the colorimetric sensor array to identify combustion residues according to the color change [4], which is also used to identify explosives due to the ligand ability of metalloporphyrins [5]. Moreover, volatiles emitted from fungi and metabolism changes after the addition of fungicides was also observed with this array [6]. This type of sensor was studied to assess the freshness of meat such as beef, shrimp, fish, chicken, and pork [7] and to identify coffee aroma [8]. Selected responsive dyes deposited on a hydrophobic membrane in a colorimetric sensor array were used to analyze beers [9], drinks such as Pepsi [10], and to detect sweeteners at millimolar concentrations [11]. Furthermore, Zn-substituted, bis-pocketed porphyrins, based on ortho-substitution of the tetraphenylporphyrin (TPP), were used to discriminate volatiles according to their size and shape [12].
Planar optical waveguide sensor (OWGS) is a facile method to detect molecules due to the interaction between sensing materials and evanescent fields formed with laser lights [13,14]. Different research studies focus on the fabrication of different types of sensors applying pH indicators [15], polyacrylate resin thin film [16], cyclodextrin polymer films [17], metal oxides, and [18] porphyrin dyes [19]. The film–analyte interaction mechanism and output light intensity has been restricted to the macroscopic view. Recently, our studies have focused on the effect of substituents from a microscopic view using molecular simulation [20]. In this work, the effect of metal centers in p-hydroxyphenyl substituted porphyrin thin film, with various transition metals, in optical waveguide towards NO2 gas, was studied with instrumental ways, molecular dynamics simulation, and quantum mechanical calculation.

2. Materials and Methods

2.1. Fabrication of THPP Metalloporphyrin Thin Film

5,10,15,20-tetrakis(4-hydroxyphenyl)porphyrin (THPP) was purchased from Sigma-Aldrich (Shanghai, China), and the metalloporphyrins, M–THPP (M = Co, Ni, Cu, and Zn), was synthesized using the procedure [21]. Thin films of the Co-, Ni-, Cu-, and Zn–THPP porphyrin complexes were fabricated, depositing each solution onto a side of K+ ion-exchanged soda-lime glass to improve waveguide forming ability. The ion-exchanged glass substrate with K+ ion-exchanged layer depth, approximately 1–2 μm, was prepared using soda-lime glass (76 × 26 × 1 mm) stored in melted KNO3 at 400 °C for 40 min to exaggerate the refractive index of the upper layer and help to form guiding light under the sensing film in optical waveguide detection system.
Spin coater was set (500 rpm, 5 s) as the first rotating speed and (1300 rpm, 25 s) as the second, simultaneously providing a vacuum condition. Thin-film width was 1 mm for all the metalloporphyrins. The porphyrin films and solutions were characterized by UV-Vis spectroscopy, and each film was characterized by UV-1780 ultraviolet spectrophotometer (SHIMADZU, Kyoto, Japan) and FT-IR spectroscopy (Alpha II, Bruker Co., Karlsruhe, Germany)

2.2. Characterization of Metalloporphyrin Film-Gas Interaction

Optical waveguide detecting experiment was operated on a self-assembled detection system (Figure 1) by using the metal-complexes porphyrin thin film as sensor. In order to reduce the optical loss, a coupling diiodomethane material (n = 1.74) was used between the prisms (n = 1.79) and the substrate waveguide (n = 1.52). For the interaction between the gases and the film, a gas chamber with 2 cm3 of volume was used, and the injection of the gas was performed with a plastic syringe. The concentration of the gas inside the chamber was adjusted by the addition of dry air. In order to restore the initial state of the metalloporphyrins, air atmosphere was used after the interaction with the gases, for restoring Zn-THPP Trimethylamine (TMA) was used.
Semiconductor laser tubes (520 nm and 670 nm, 10 mW, Shenzhen Gainlaser Laser Technology Co., Ltd., Shenzhen, China) and a gas detection tube (working range: 2–200 ppm, Gastec, Beijing Municipal Institute, Beijing, China) were used.

2.3. Molecular Dynamic Simulations and Quantum Mechanical Calculations

Classical molecular dynamics (MD) simulations and quantum mechanical calculations (QM) have been used to understand the interaction of NO2 gas with THPP porphyrin with different metal ions at the molecular level.
MD simulations were performed in slab geometry in a box with the size of 5 × 5 × 20 (nm)3 with one porphyrin molecule and 2000 molecules of NO2. By performing MD simulations, we would like to investigate the affinity of porphyrin molecule toward different NO2 gas when the porphyrin molecule have complexed with different metal ions, namely Zn2+, Co2+, Ni2+, and Cu2+. From MD simulations, possible orientation and conformations could be captured during the simulations, which can be used for higher accuracy quantum mechanical calculations. As different metal ions are used to form complexes with porphyrin, the complexes may have different affinities due to the different electronic structures of metal ions in interaction with NO2 gas.
For performing MD simulations, the General Amber Force Field (GAFF) model [22] shows good properties for inorganic and organic gases and liquid molecules [23,24,25,26,27].
Ab initio geometry optimization using the Gaussian 09 package [28] employing the B3LYP/cc-pVDZ method flowed by Restrained Electrostatic Potential (RESP) [29] using the Antechamber program [30] was used to calculate the partial charges of porphyrin and NO2 molecules. Each system with different metal ions was prepared by putting single porphyrin and 2000 NO2 molecules into the simulation randomly by application of Packmol program [31,32].
Steepest descent minimization procedure was used for minimization of all systems. After minimization, 500 ps NVT ensemble (Canonical ensemble) and NPT (isothermal–isobaric ensemble), restrained simulations were used to equilibrate the systems. Systems obtained after NPT simulation were used to build slab geometries. Linear constraint solver (LINCS) algorithm [33] was employed for all bonds involving hydrogen atoms. The short-range non-bonded interactions were truncated with the cutoff distance of 1.2 nm, and the long-range part of the electrostatic interactions was treated by the particle mesh Ewald method [34]. All the molecules in all systems, according to Maxwell–Boltzmann distribution at 300 K, were used to produce initial results [35] with the coupling constant of 0.1 ps to ensure constant temperature and pressure. Simulations were run for the production phase in NVT ensemble for 50 ns at 300 K with a time step of 2 fs. All simulations were performed employing Gromacs 4.6.5 program package (University of Groningen, Groningen, Netherlands) [36,37,38]. A Visual molecular dynamics (VMD) program was used for visualizations of the trajectory and preparation of snapshots [39].
For further investigation of the NO2 interaction with porphyrin molecules, which are complexed with different metal ions, namely Zn2+, Co2+, Ni2+, and Cu2+, quantum mechanical calculations have been performed.
For Zn metal ion complex of porphyrin with NO2 molecules, two different conformations were extracted from MD simulations were optimized by the density functional theory (DFT) method with B3LYP functional using 6-31G * basis set in Gaussian09 program(Gaussian, Inc., Carnegie Mellon University, Pittsburgh, PA, USA) [28]. The two conformations were capturing situations where nitrogen of NO2 was interacting with Zn2+ (conformation 1) or oxygen from NO2 was interacting with Zn2+ (conformation 2). The resulting structures were used as models for the preparation of other complexes. For other metal ion complexes, Cu2+, Co2+, and Ni2+ ions substituted the Zn2+ metal ion. Additionally, the structure with no metal ion present in the structure of porphyrin was prepared for the comparison of the interactions where the system is negatively charged. The geometries of the systems were optimized by the DFT method with B3LYP functional using 6–31G * basis set. The spin multiplicity of the systems was set to take into account the NO2 radical as well as spin multiplicity of metal-porphyrin complexes [40]. The interaction energies were calculated by the DFT method with B3LYP functional using 6–31G * basis set. Basis set superposition error (BSSE) was corrected using the counterpoise method of Boys and Bernardi [41].

3. Results and Discussion

3.1. Characterization of THPP Metalloporphyrin Complex

The UV-Vis absorption spectra of free-base THPP and the relative metal complexes with Co, Ni, Cu, and Zn in DMF are shown in Figure 2. All the complexes exhibit the B band (Soret band) at around 400 nm and two Q bands (β and α bands) in the range of 500–700 nm; the obtained spectra indicate the successful complexation of THPP.
In the free-base porphyrin, the Q bands are due to the transitions from the ground state to the two vibrational states of the excited state Q (0,0) and Q (1,0), and the presence of two hydrogen atoms in the free-porphyrin ring split the Q bands into four bands due to the vibrational modes: Qx (0,0), Qy (0,0), Qx (1,0) and Qy (1,0) (Figure 2a,c). In metalloporphyrins, the presence of a metal in the porphyrin ring leads to a change in geometry from D2h to D4h and degeneration of the x and y components, with the final result of only two bands in the Q region (Figure 2b,c) [42,43].
The molar extinction coefficient (ε) of each THPP–metal complex was calculated and reported in Table 1.
Among the four metal–THPP complexes, Zn–THPP presents the highest molar extinction coefficient (5 × 10⁸ M−1 cm−1), which is thousands of times higher than other metalloporphyrins (105 M−1 cm−1), indicating that it has outstanding light absorption ability and potential application in optical gas sensor fabrication. At the same time, in the DMF solution, the wavelength of the Soret band of Zn–THPP is longer than that of other metalloporphyrins, as shown in Figure 2, showing that the HOMO-LUMO energy level varies to a different extent. Moreover, the observation of the Q region shows that the two Q bands, typical of the metal complexes of porphyrins, show differences with Zn–THPP, where the Q-band at lower energy is more pronounced with respect to the other THPP complexes. These results suggest a different molecular configuration of the zinc complex with respect to copper, cobalt, and nickel metalloporphyrins. The relative intensities of the Q bands can therefore correlate with the stability of the metal complex.
As shown in Figure 3, when metal–THPP complexes were deposited as films on the surface of K+ ion-exchanged glass substrate, Soret bands are red-shifted and widened for different degrees compared with each solution state. All the spectroscopic data for the metal–THPP film related to Soret bands are resumed in Table 2. Meanwhile, Q bands shifted to a longer wavelength synchronously. The observed spectral change of the Soret Band of all metalloporphyrins is due to the formation of J-aggregates on the glass surface [43]. Without changing their shape, the shifts in the Q-bands towards a higher wavelength demonstrate that the metalation of the porphyrin ring remains stable after the deposition on surfaces of glass.
The infrared spectrum of each metalloporphyrin is shown in Figure 4. It was found the presence of the bands at around 3300 cm−1 relative to -NH, -CH phenyl, and -CH pyrrole stretching and of two bands at 1600 and 1350 cm−1 due to the vibration of the benzene ring. At 1510 cm−1 and, always, at 1350 cm−1, the bands are assigned to the vibrations of C = N and C−N bonds, respectively [44]. The bands relative to the in-plane δ N−H and out of plane N−H for THPP porphyrin are at 973 and 710 cm−1. When a metal ion is inserted into the porphyrin ring, these bands disappear, and the characteristic functional groups of the metal-N bond are observed from the formation of new bands at around 1000 cm−1; this band corresponds to the skeletal ring vibration of the metal porphyrin [45,46]. Furthermore, the band at around 1600 cm−1, which corresponds to angular deformation in the N−H plane of the pyrrole ring, should disappear, but, in this case, this cannot be observed because at this frequency, this type of vibration overlap with the band of the benzene ring vibrations. In the IR spectra of all porphyrin complexes, there is a new band at around 1660 cm−1; this is probably due to the carbonyl group of DMF that was used as a solvent for the dissolution of the complexes.
The morphology of cobalt, nickel, copper, zinc metalloporphyrin on the K+ ion-exchanged glass substrate is shown in Figure 5.
The metalloporphyrins, when DMF solvent vaporized, form aggregates by intermolecular force, mainly by hydrogen bond and coordination bonds on the surface of the glass [47]. All the THPP complexes show a uniform distribution but, for all the samples, are present large aggregates with distinct shapes: cubes for Co–THPP (Figure 5a), cubes and irregular shapes for Ni–THPP (Figure 5b), large cubes aggregates for the Cu–THPP (Figure 5c) while, for Zn–THPP (Figure 5d), large spheres aggregates are evident on the film. The X-ray photoelectron spectra are reported in Figure 6.
The O1s, N1sm, and C1s signals are very similar for all the M–THPP and are reported to the relative spectra in Figure 6a–c. In free-base porphyrin, N1s XPS spectrum shows two signals relative to iminic and pyrrolic nitrogens; in this case, after the metalation, as reported in Figure 6a, the nitrogen atoms become more similar, and only a single peak at around 398.5−398.6 eV is detected for all the porphyrin complexes [48]. The C1s XPS signal, reported in Figure 6b, shows different contributions at 284.8, 286, 287.2 and 289.4 eV assigned to C−C sp2, C = N, C−N and π−π * [49]. O1s for all the porphyrin complexes show a main peak centered at 532.80 eV relative to C−O and a smaller peak at 533.6 eV relative to -OH (Figure 6c). For Co–THPP, the Co2p3/2 XPS spectrum shows a main peak centered on 780.5 eV accompanied by a satellite structure at higher binding energies (Figure 6d), typical for a multilayer porphyrin film [50,51]. Cu XPS spectrum (Figure 6e) for the Cu–THPP shows two components for Cu2p1/2 and Cu2p3/2. The main peak at 935 eV is related to the 2p3d10L final state, and two satellites at 941.4 and 944 eV ascribed to a 2p3d9 final state. The Cu2p1/2 component shows the main peak at 955 eV and a satellite at higher binding energy 963 eV [52]. Ni–THPP XPS spectrum, reported in Figure 6f, shows a peak centered at 855.4 eV ascribed to Ni2p3/2 component typical for a multilayer porphyrin coverage film [53].In the case of Zn–THPP, the XPS spectrum in Figure 6g clearly shows the Zn 2p3/2 and Zn2p1/2 components at 1021.9 and 1045 eV, demonstrating the presence of the Zn–THPP porphyrin on the glass [54]. In conclusion, all the XPS spectra demonstrate the presence of the complexes in the film state, confirming that the metalation of the porphyrin ring remains stable, even after the evaporation of the solvent.

3.2. Interaction Analysis of Metalloporphyrin Film and NO2 Gas

The UV-Vis spectrum of each metalloporphyrin film before and after interaction with CO2, H2S, HCl, and NO2 (1000 ppm) is shown in Figure 7, and the obtained results are reported in Table 3. After the exposure with CO2, H2S, and HCl gases, Co–THPP, Ni–THPP, and Cu–THPP, did not show any differences in the UV-vis absorption spectra, with negligible change in shape and positions of the Soret bands and Q-bands, suggesting a very low interaction between cobalt, nickel, and copper complex films with the studied gases. However, the exposure of these porphyrin complex films with NO2 gas promotes changes in the shape and the position of the Soret absorption bands with an important decrease in absorbance (Figure 7a−c).
When Zn–THPP film is exposed to CO2, H2S, HCl, different spectral changes can be observed; the Soret band shifts from 440 nm to 470 nm (Δλ = 30 nm), while the two Q bands at 550−650 nm disappeared with the formation of a strong Q band at around 720−730 nm (Figure 7d). The observed spectral change, after the Zn–THPP film reacts with various acid gases, suggests that the Zn-complex is less stable under acidic conditions; in fact, the changed spectra is probably due to the characteristic protonation of porphyrin rings [43,55]. In the case of NO2 gas, the Soret band of Zn–THPP became broadened and shifted to a higher wavelength with a large Q-band at 700 nm, suggesting an interaction of the complex with the NO2 gas molecule.
Based on the interaction results of metalloporphyrin films with various acidic gases, all films were used as sensitive layers to detect NO2 gas with different concentrations. According to the spectral changes after interaction with NO2, considering the laboratory conditions, and in combining all the wavelengths with the largest changes before and after the interaction, two wavelengths of 520 nm and 670 nm were selected as excitation light sources for the optical waveguide experiment. The gas detection results of four metalloporphyrin-film-based planar optical waveguides are reported in Figure 8.
The obtained results show that, when the wavelength of 520 nm is used as light source, the gas concentration of NO2 that can be detected by Co–THPP and Cu–THPP porphyrin complexes is 50 ppm, the lowest concentration can be detected by Ni–THPP and Zn–THPP porphyrin complexes and is 10 ppm.
However, when a 670 nm laser is used as a light source, as shown in Figure 9, 10 ppm NO2 gas can be detected by Co–THPP and Ni–THPP, 500 ppm by Cu–THPP, and 1 ppm by the Zn–THPP complex.
As shown in Figure 8 and Figure 9, when NO2-atmosphere was switched to the air atmosphere, it takes short time periods to recover naturally for Co–THPP, Ni–THPP, Cu–THPP complexes when gas concentration is lower than 1000 ppm; while in terms of the Zn–THPP complex, the NO2 gas exposed film is unable to recover thoroughly even after 30 min for gas concentration as low as 10 ppm, thus, in this case, it was used TMA vapor to restore the complex, confirming the reversibility of the process.
When two wavelengths are used as light sources, and the detection results of planar optical waveguide are compared (Figure 10), it is possible to observe that low concentration (1 ppm) of NO2 gas can be detected only when the planar optical waveguide is fabricated with a 670 nm laser as a light source and Zn–THPP film as sensitive material.

3.3. Molecular Dynamic Simulations and Quantum Mechanical Calculations Analysis

For analyzing the MD data, to reveal the interaction of porphyrin molecule complexed by different metal ions with NO2, the radial distribution function (RDF) was used. The radial distribution function describes the distribution of certain atoms or molecules around specific sites in particular atoms or molecules in the system. Our objective is to explore whether the change of metal ion can change the strength of interaction of NO2 to porphyrin molecule; therefore, we calculated the distribution of NO2 around different sites of porphyrin molecule in all systems.
Figure 11 shows the radial distribution function of NO2 molecules around the N atoms of porphyrin molecule in complexes with different metal ions. RDF shows that for Zn2+ and Co2+ ions, peaks with strong intensity appear at 0.3 nm, while for Ni2+ and Cu2+, much weaker peaks in intensity appear at 0.31–0.37 nm. The weaker intensities of peaks for Ni2+ and Cu2+ show a weaker interaction of NO2 molecules with the porphyrin molecule complexed with Ni2+ and Cu2+ metal ions. By careful investigation of the RDF, it can be concluded that the peaks with lower intensity with the broader area, which start from 0.31 nm to 0.37 nm, prove that the NO2 molecule can interact with a metal center in different conformations. As QM calculations showed, different energies are in accordance with different conformations. Therefore, it can be argued that in different conformers, the NO2 have different distances to the metal center; thus, broader peaks appear for complexes by Ni2+ and Cu2+ with porphyrin molecule.
In order to correlate the structural features of complexes of porphyrin molecules with different metal ions and the influence of conformations on the interaction energy of NO2 molecules in different complexes, we have calculated the interaction energy for all complexes.
The optimized geometry of THPP with Zn2+ and NO2 in conformation one, where N atom interacts with metal, is presented in Figure 12.
In conformation one, the geometry of the complexes with the other metal ions Ni2+, Co2+, and Cu2+ has not been significantly changed after their geometrical re-optimization. The optimized geometry of THPP porphyrin with Zn2+ metal ion and NO2 in conformation two, where oxygen atom interacts with Zn2+ metal ions, is presented in Figure 13. The gas-phase interaction energies of the complexes between THPP porphyrin and NO2 molecule calculated for different conformations are presented in Table 4.
From the results, it can be concluded that for the complexes at the same geometrical conformation, the Cu–THPP does not interact with NO2 in conformation one, while the strongest interaction was observed for Ni–THPP with NO2. However, in conformation two, where O atom interacts with metal ions, QM calculations revealed that all complexes have lower interaction energies, even the Cu–THPP, which shows very low interaction with NO2; with this conformation, the strongest interaction occurs for Co–THPP and Zn–THPP.

4. Conclusions

Four complexes of THPP porphyrin (Co, Cu, Ni, and Zn) were deposited as film on K+-exchanged glass and used in planar optical waveguides for the investigation on the detection of several gases such as HCl, H2S, CO2, and NO2 at 20 °C. UV−Vis absorption spectra of these thin films exposed to analyte gases showed that all these films display remarkable absorption change with NO2, whereas not observable difference with other gases except for the Zn–THPP complex, which exhibits obvious changes with HCl, H2S, CO2 gas exposures as well. Since Cu–THPP, Co–THPP, and Ni–THPP complexes are not sensitive to other gas, except for NO2, in this work, we focused on the response behavior of the four complexes towards NO2 gas. With the fabricated devices, the amount of the lowest detectable NO2 gas differs as 50 ppm with Co–THPP and Cu–THPP complexes, while 10 ppm with the Ni–THPP complex and the Zn–THPP complex under 520 nm laser light illumination. When the laser illumination was at 670 nm, the device with the Zn–THPP complex was able to detect 1 ppm, while Co–THPP-, Ni–THPP- and Cu–THPP-based devices were able to detect 10 ppm, 50 ppm, and 500 ppm of NO2 gas, respectively. By combining the results of the molecular dynamics simulation and quantum mechanical calculation, it is possible to observe that the Cu–THPP complex shows the least affinity toward NO2 gas molecules, demonstrated by the binding energies that are close to zero, suggesting there is a very low or no interaction between copper complex and NO2. Compared with other M–THPP metalloporphyrins, the affinity of Cu–THPP to NO2 is very low by the optical waveguide detection, in agreement with MD and quantum mechanical calculation.
Nickel, cobalt, and zinc complexes display good sensitivity in the UV-Vis spectrum leading to sensible absorbance changes at 520 nm or 670 nm wavelength after NO2 exposure. This is inconsistent with the binding energy calculation of these three complexes interacting with NO2 molecules, that is, Ni–THPP −14.9 kcal/mol, Co–THPP −11.8 kcal/mol, Zn–THPP −11.0 kcal/mol in configuration one, and Ni–THPP −19.9 kcal/mol, Co–THPP −30.6 kcal/mol and Zn–THPP −29.7 kcal/mol in terms of the configuration 2. In optical waveguide detection, Co–THPP and Ni–THPP show a lower response than Zn–THPP; this could be ascribed to the higher absorbance changes for Zn–THPP at 520 and 670 nm after NO2 interaction. All experimental results show that the better wavelength to detect the interaction between M–THPP and NO2 gas is 670 nm, which demonstrating the lowest detectable amount of NO2 gas for all the THPP complexes.

Author Contributions

Conceptualization, N.K., S.A. and A.Y.; methodology, A.Y. and S.A.; validation, N.K. and M.Z.; formal analysis, N.K., B.M., S.A. and M.Z.; investigation, A.Y., B.M., D.Ř. and S.A.; resources, A.Y. and R.G.; Molecular Dynamic Simulations, quantum mechanical calculation and data interpretation, D.Ř. and B.M. writing—original draft preparation, N.K. and M.Z.; writing—review and editing, M.Z., R.G., B.M., supervision A.Y., S.A. and R.G.; project administration, A.Y. funding acquisition, A.Y. All authors have read and agreed to the published version of the manuscript.

Funding

This research was funded by Xinjiang Province Science and Technology Innovation Project for Graduates (No. XJGRI201611), Xinjiang University Innovation Project for Graduates (No. XJUBSCX-2016008), and the National Natural Science Foundation of China (No. 21765021).

Institutional Review Board Statement

Not applicable.

Informed Consent Statement

Not applicable.

Data Availability Statement

The data that support the findings of this study are available from the corresponding author, upon reasonable demand.

Acknowledgments

Babak Minofar thanks computational resources which were supplied by the project “e-Infrastruktura CZ” (e-INFRA LM2018140) provided within the program Projects of Large Research, Development and Innovations Infrastructures.

Conflicts of Interest

The authors declare no conflict of interest.

References

  1. Doğan, N.; Dumanoğulları, F.M.; Hayvalı, M.; Yılmaz, H.; Kürüm, U.; Yaglioglu, H.G.; Elmali, A. Nonlinear absorption behaviors of filled and unfilled d shell metal complexes of 5, 10, 15, 20-tetrakis(4-hydroxyphenyl)porphyrin. Chem. Phys. Lett. 2011, 508, 265–269. [Google Scholar] [CrossRef]
  2. Rosenblatt, M.M.; Wang, J.; Suslick, K.S. De novo designed cyclic-peptide heme complexes. Proc. Natl. Acad. Sci. USA 2003, 100, 13140. [Google Scholar] [CrossRef] [PubMed] [Green Version]
  3. Suslick, K.S.; Rakow, N.A.; Sen, A. Colorimetric sensor arrays for molecular recognition. Tetrahedron 2004, 60, 11133–11138. [Google Scholar] [CrossRef]
  4. Li, Z.; Jang, M.; Askim, J.R.; Suslick, K.S. Identification of accelerants, fuels and post-combustion residues using a colorimetric sensor array. Analyst 2015, 140, 5929–5935. [Google Scholar] [CrossRef] [PubMed]
  5. Askim, J.R.; Li, Z.; LaGasse, M.K.; Rankin, J.M.; Suslick, K.S. An optoelectronic nose for identification of explosives. Chem. Sci. 2016, 7, 199–206. [Google Scholar] [CrossRef] [PubMed] [Green Version]
  6. Zhang, Y.; Askim, J.R.; Zhong, W.; Orlean, P.; Suslick, K.S. Identification of pathogenic fungi with an optoelectronic nose. Analyst 2014, 139, 1922–1928. [Google Scholar] [CrossRef] [PubMed] [Green Version]
  7. Li, Z.; Suslick, K.S. Portable Optoelectronic Nose for Monitoring Meat Freshness. ACS Sens. 2016, 1, 1330–1335. [Google Scholar] [CrossRef]
  8. Suslick, B.A.; Feng, L.; Suslick, K.S. Discrimination of Complex Mixtures by a Colorimetric Sensor Array: Coffee Aromas. Anal. Chem. 2010, 82, 2067–2073. [Google Scholar] [CrossRef] [PubMed] [Green Version]
  9. Zhang, C.; Bailey, D.P.; Suslick, K.S. Colorimetric Sensor Arrays for the Analysis of Beers:  A Feasibility Study. J. Agric. Food Chem. 2006, 54, 4925–4931. [Google Scholar] [CrossRef] [PubMed]
  10. Zhang, C.; Suslick, K.S. Colorimetric Sensor Array for Soft Drink Analysis. J. Agric. Food Chem. 2007, 55, 237–242. [Google Scholar] [CrossRef]
  11. Musto, C.J.; Lim, S.H.; Suslick, K.S. Colorimetric Detection and Identification of Natural and Artificial Sweeteners. Anal. Chem. 2009, 81, 6526–6533. [Google Scholar] [CrossRef] [PubMed] [Green Version]
  12. Suslick, K.S. An Optoelectronic Nose:“Seeing” Smells by Means of Colorimetric Sensor Arrays. MRS Bull. 2004, 29, 720–725. [Google Scholar] [CrossRef] [PubMed] [Green Version]
  13. Yimit, A.; Rossberg, A.G.; Amemiya, T.; Itoh, K. Thin film composite optical waveguides for sensor applications: A review. Talanta 2005, 65, 1102–1109. [Google Scholar] [CrossRef] [PubMed]
  14. Sergey, S.S.; Michael, J.C.; Courtney, B.; Darnell, E.D.; James, G.G.; Frank Kenneth, H. Planar optical waveguide sensor of ammonia. Proc. SPIE 2004, 5586, 33–44. [Google Scholar]
  15. Dilbar, A.; Erkin, T.; Xawkat, A.; Abliz, Y. Fabrication of Composite Optical Waveguides Based on Thin Films Consisted of Iron Phosphate Nanoparticles and Their Applications as Ammonia Gas Sensor. Chin. J. Appl. Chem. 2010, 27, 965–969. [Google Scholar] [CrossRef]
  16. Kadir, R.; Yimit, A.; Ablat, H.; Mahmut, M.; Itoh, K. Optical Waveguide BTX Gas Sensor Based on Polyacrylate Resin Thin Film. Environ. Sci. Technol. 2009, 43, 5113–5116. [Google Scholar] [CrossRef] [PubMed]
  17. Yasin, P.; Yimit, A.; Rahman, E.; Nizamidin, P. Cyclodextrin Polymer Films Optical Waveguide Sensor for Volatile Organic Gas Detection. Chem. Res. Chin. Univ. 2012, 4, 682–685. [Google Scholar]
  18. Mohemati, M.; Yimit, A.; Turahun, Y. Zinc Oxide Thin Film/Tin-diffused Optical Waveguide Sensor for Chlorobenzene Gas Detection. Chin. J. Anal. Chem. 2011, 39, 120–124. [Google Scholar] [CrossRef]
  19. Mamtmin, G.; Kari, N.; Abdurahman, R.; Nizamidin, P.; Yimit, A. 5, 10, 15, 20-tetrakis-(4-methoxyphenyl) porphyrin film/K+ ion-exchanged optical waveguide gas sensor. Opt. Laser Technol. 2020, 128, 106260. [Google Scholar] [CrossRef]
  20. Kari, N.; Zannotti, M.; Mamtmin, G.; Giovannetti, R.; Minofar, B.; Řeha, D.; Maimaiti, P.; Kutilike, B.; Yimit, A. Substituent Effect on Porphyrin Film-Gas Interaction by Optical Waveguide: Spectrum Analysis and Molecular Dynamic Simulation. Materials 2020, 13, 5613. [Google Scholar] [CrossRef]
  21. Adler, A.D.; Longo, F.R.; Kampas, F.; Kim, J. On the preparation of metalloporphyrins. J. Inorg. Nucl. Chem. 1970, 32, 2443–2445. [Google Scholar] [CrossRef]
  22. Case, D.A.; Darden, T.A.; Cheatham, T.E.I.; Simmerling, C.L.; Wang, J.; Duke, R.E.; Luo, R.; Merz, K.M.; Wang, B.; Pearlman, D.A.; et al. Amber 8; University of California: San Francisco, CA, USA, 2004. [Google Scholar]
  23. Ghahremanpour, M.M.; Van Maaren, P.; Van der Spoel, D. Alexandria Library; Zenodo, Ed.; 2017; Available online: https://zenodo.org/record/1004711#.Yi1nVjURVPZ (accessed on 22 December 2021). [CrossRef]
  24. Ghahremanpour, M.M.; van Maaren, P.J.; Ditz, J.C.; Lindh, R.; van der Spoel, D. Large-scale calculations of gas phase thermochemistry: Enthalpy of formation, standard entropy, and heat capacity. J. Chem. Phys. 2016, 145, 114305. [Google Scholar] [CrossRef] [Green Version]
  25. Ghahremanpour, M.M.; van Maaren, P.J.; van der Spoel, D. The Alexandria library, a quantum-chemical database of molecular properties for force field development. Sci. Data 2018, 5, 180062. [Google Scholar] [CrossRef] [PubMed] [Green Version]
  26. Ghahremanpour, M.M.; van Maaren, P.J.; Caleman, C.; Hutchison, G.R.; van der Spoel, D. Polarizable Drude Model with s-Type Gaussian or Slater Charge Density for General Molecular Mechanics Force Fields. J. Chem. Theory Comput. 2018, 14, 5553–5566. [Google Scholar] [CrossRef] [PubMed]
  27. Walz, M.-M.; Ghahremanpour, M.M.; van Maaren, P.J.; van der Spoel, D. Phase-Transferable Force Field for Alkali Halides. J. Chem. Theory Comput. 2018, 14, 5933–5948. [Google Scholar] [CrossRef] [PubMed]
  28. Frisch, M.J.; Trucks, G.W.; Schlegel, H.B.; Scuseria, G.E.; Robb, M.A.; Cheeseman, J.R.; Montgomery, J.A.; Vreven, T.; Kudin, K.N.; Burant, J.C.; et al. Gaussian 03, Revision D.01; Gaussian Inc: Wallingford, CT, USA, 2004. [Google Scholar]
  29. Bayly, C.I.; Cieplak, P.; Cornell, W.; Kollman, P.A. A well-behaved electrostatic potential based method using charge restraints for deriving atomic charges: The RESP model. J. Phys. Chem. 1993, 97, 10269–10280. [Google Scholar] [CrossRef]
  30. Wang, J.; Wang, W.; Kollman, P.A.; Case, D.A. Automatic atom type and bond type perception in molecular mechanical calculations. J. Mol. Graph. Model. 2006, 25, 247–260. [Google Scholar] [CrossRef] [PubMed]
  31. Martínez, J.M.; Martínez, L. Packing optimization for automated generation of complex system’s initial configurations for molecular dynamics and docking. J. Comput. Chem. 2003, 24, 819–825. [Google Scholar] [CrossRef] [PubMed]
  32. Martínez, L.; Andrade, R.; Birgin, E.G.; Martínez, J.M. PACKMOL: A package for building initial configurations for molecular dynamics simulations. J. Comput. Chem. 2009, 30, 2157–2164. [Google Scholar] [CrossRef] [PubMed]
  33. Hess, B.; Bekker, H.; Berendsen, H.J.C.; Fraaije, J.G.E.M. LINCS: A linear constraint solver for molecular simulations. J. Comput. Chem. 1997, 18, 1463–1472. [Google Scholar] [CrossRef]
  34. Darden, T.; York, D.; Pedersen, L. Particle mesh Ewald: An N⋅log(N) method for Ewald sums in large systems. J. Chem. Phys. 1993, 98, 10089–10092. [Google Scholar] [CrossRef] [Green Version]
  35. Bussi, G.; Donadio, D.; Parrinello, M. Canonical sampling through velocity rescaling. J. Chem. Phys. 2007, 126, 014101. [Google Scholar] [CrossRef] [PubMed] [Green Version]
  36. Van Der Spoel, D.; Lindahl, E.; Hess, B.; Groenhof, G.; Mark, A.E.; Berendsen, H.J.C. GROMACS: Fast, flexible, and free. J. Comput. Chem. 2005, 26, 1701–1718. [Google Scholar] [CrossRef] [PubMed]
  37. Lindahl, E.; Hess, B.; van der Spoel, D. GROMACS 3.0: A package for molecular simulation and trajectory analysis. Mol. Model. Annu. 2001, 7, 306–317. [Google Scholar] [CrossRef]
  38. Berendsen, H.J.C.; van der Spoel, D.; van Drunen, R. GROMACS: A message-passing parallel molecular dynamics implementation. Comput. Phys. Commun. 1995, 91, 43–56. [Google Scholar] [CrossRef]
  39. Humphrey, W.; Dalke, A.; Schulten, K. VMD: Visual molecular dynamics. J. Mol. Graph. 1996, 14, 33–38. [Google Scholar] [CrossRef]
  40. Zwaans, R.; van Lenthe, J.H.; den Boer, D.H.W. Ab initio calculations on first-row transition metal porphyrins Part 2. Ground state spin multiplicities, calculated ionisation potentials and electron affinities and their relation to catalytic activity. J. Mol. Struct. THEOCHEM 1996, 367, 15–24. [Google Scholar] [CrossRef]
  41. Boys, S.F.; Bernardi, F. The calculation of small molecular interactions by the differences of separate total energies. Some procedures with reduced errors. Mol. Phys. 1970, 19, 553–566. [Google Scholar] [CrossRef]
  42. Maximiano, R.V.; Piovesan, E.; Zílio, S.C.; Machado, A.E.H.; de Paula, R.; Cavaleiro, J.A.S.; Borissevitch, I.E.; Ito, A.S.; Gonçalves, P.J.; Barbosa Neto, N.M. Excited-state absorption investigation of a cationic porphyrin derivative. J. Photochem. Photobiol. A Chem. 2010, 214, 115–120. [Google Scholar] [CrossRef]
  43. Zannotti, M.; Giovannetti, R.; Minofar, B.; Řeha, D.; Plačková, L.; D’Amato, C.A.; Rommozzi, E.; Dudko, H.V.; Kari, N.; Minicucci, M. Aggregation and metal-complexation behaviour of THPP porphyrin in ethanol/water solutions as function of pH. Spectrochim. Acta Part A Mol. Biomol. Spectrosc. 2018, 193, 235–248. [Google Scholar] [CrossRef] [PubMed]
  44. Wu, J.; Wang, W.; Wang, Z. Porphin-Based Carbon Dots for “Turn Off–On” Phosphate Sensing and Cell Imaging. Nanomaterials 2020, 10, 326. [Google Scholar] [CrossRef] [PubMed] [Green Version]
  45. Castro, K.A.D.F.; Silva, S.; Pereira, P.M.R.; Simões, M.M.Q.; Neves, M.d.G.P.M.S.; Cavaleiro, J.A.S.; Wypych, F.; Tomé, J.P.C.; Nakagaki, S. Galactodendritic Porphyrinic Conjugates as New Biomimetic Catalysts for Oxidation Reactions. Inorg. Chem. 2015, 54, 4382–4393. [Google Scholar] [CrossRef] [PubMed]
  46. Bandgar, P.B.; Gujarathi, B.P. Synthesis and characterization of new meso-substituted unsymmetrical metalloporphyrins. J. Chem. Sci. 2008, 120, 259–266. Available online: https://www.ias.ac.in/article/fulltext/jcsc/120/02/0259-0266 (accessed on 22 December 2021). [CrossRef]
  47. Lu, G.; Zhang, X.; Cai, X.; Jiang, J. Tuning the morphology of self-assembled nanostructures of amphiphilic tetra(p-hydroxyphenyl)porphyrins with hydrogen bonding and metal–ligand coordination bonding. J. Mater. Chem. 2009, 19, 2417–2424. [Google Scholar] [CrossRef]
  48. Diller, K.; Papageorgiou, A.C.; Klappenberger, F.; Allegretti, F.; Barth, J.V.; Auwärter, W. In vacuo interfacial tetrapyrrole metallation. Chem. Soc. Rev. 2016, 45, 1629–1656. [Google Scholar] [CrossRef] [PubMed] [Green Version]
  49. Kumar, N.A.; Gaddam, R.R.; Suresh, M.; Varanasi, S.R.; Yang, D.; Bhatia, S.K.; Zhao, X.S. Porphyrin–graphene oxide frameworks for long life sodium ion batteries. J. Mater. Chem. A 2017, 5, 13204–13211. [Google Scholar] [CrossRef]
  50. Bai, Y.; Sekita, M.; Schmid, M.; Bischof, T.; Steinrück, H.-P.; Gottfried, J.M. Interfacial coordination interactions studied on cobalt octaethylporphyrin and cobalt tetraphenylporphyrin monolayers on Au(111). Phys. Chem. Chem. Phys. 2010, 12, 4336–4344. [Google Scholar] [CrossRef] [PubMed]
  51. Lukasczyk, T.; Flechtner, K.; Merte, L.R.; Jux, N.; Maier, F.; Gottfried, J.M.; Steinrück, H.-P. Interaction of Cobalt(II) Tetraarylporphyrins with a Ag(111) Surface Studied with Photoelectron Spectroscopy. J. Phys. Chem. Chem. 2007, 111, 3090–3098. [Google Scholar] [CrossRef]
  52. Mangione, G.; Carlotto, S.; Sambi, M.; Ligorio, G.; Timpel, M.; Vittadini, A.; Nardi, M.V.; Casarin, M. Electronic structures of CuTPP and CuTPP(F) complexes. A combined experimental and theoretical study I. Phys. Chem. Chem. Phys. 2016, 18, 18727–18738. [Google Scholar] [CrossRef] [PubMed]
  53. Fatayer, S.; Veiga, R.G.A.; Prieto, M.J.; Perim, E.; Landers, R.; Miwa, R.H.; de Siervo, A. Self-assembly of NiTPP on Cu(111): A transition from disordered 1D wires to 2D chiral domains. Phys. Chem. Chem. Phys. 2015, 17, 18344–18352. [Google Scholar] [CrossRef] [PubMed] [Green Version]
  54. Garg, M.; Naik, T.R.; Pathak, C.S.; Nagarajan, S.; Rao, V.R.; Singh, R. Significant improvement in the electrical characteristics of Schottky barrier diodes on molecularly modified Gallium Nitride surfaces. Appl. Phys. Lett. 2018, 112, 163502. [Google Scholar] [CrossRef]
  55. Lee, C.-H.; Lee, S.; Yoon, H.; Jang, W.-D. Strong Binding Affinity of a Zinc–Porphyrin-Based Receptor for Halides through the Cooperative Effects of Quadruple C—H Hydrogen Bonds and Axial Ligation. Chem.—A Eur. J. 2011, 17, 13898–13903. [Google Scholar] [CrossRef] [PubMed]
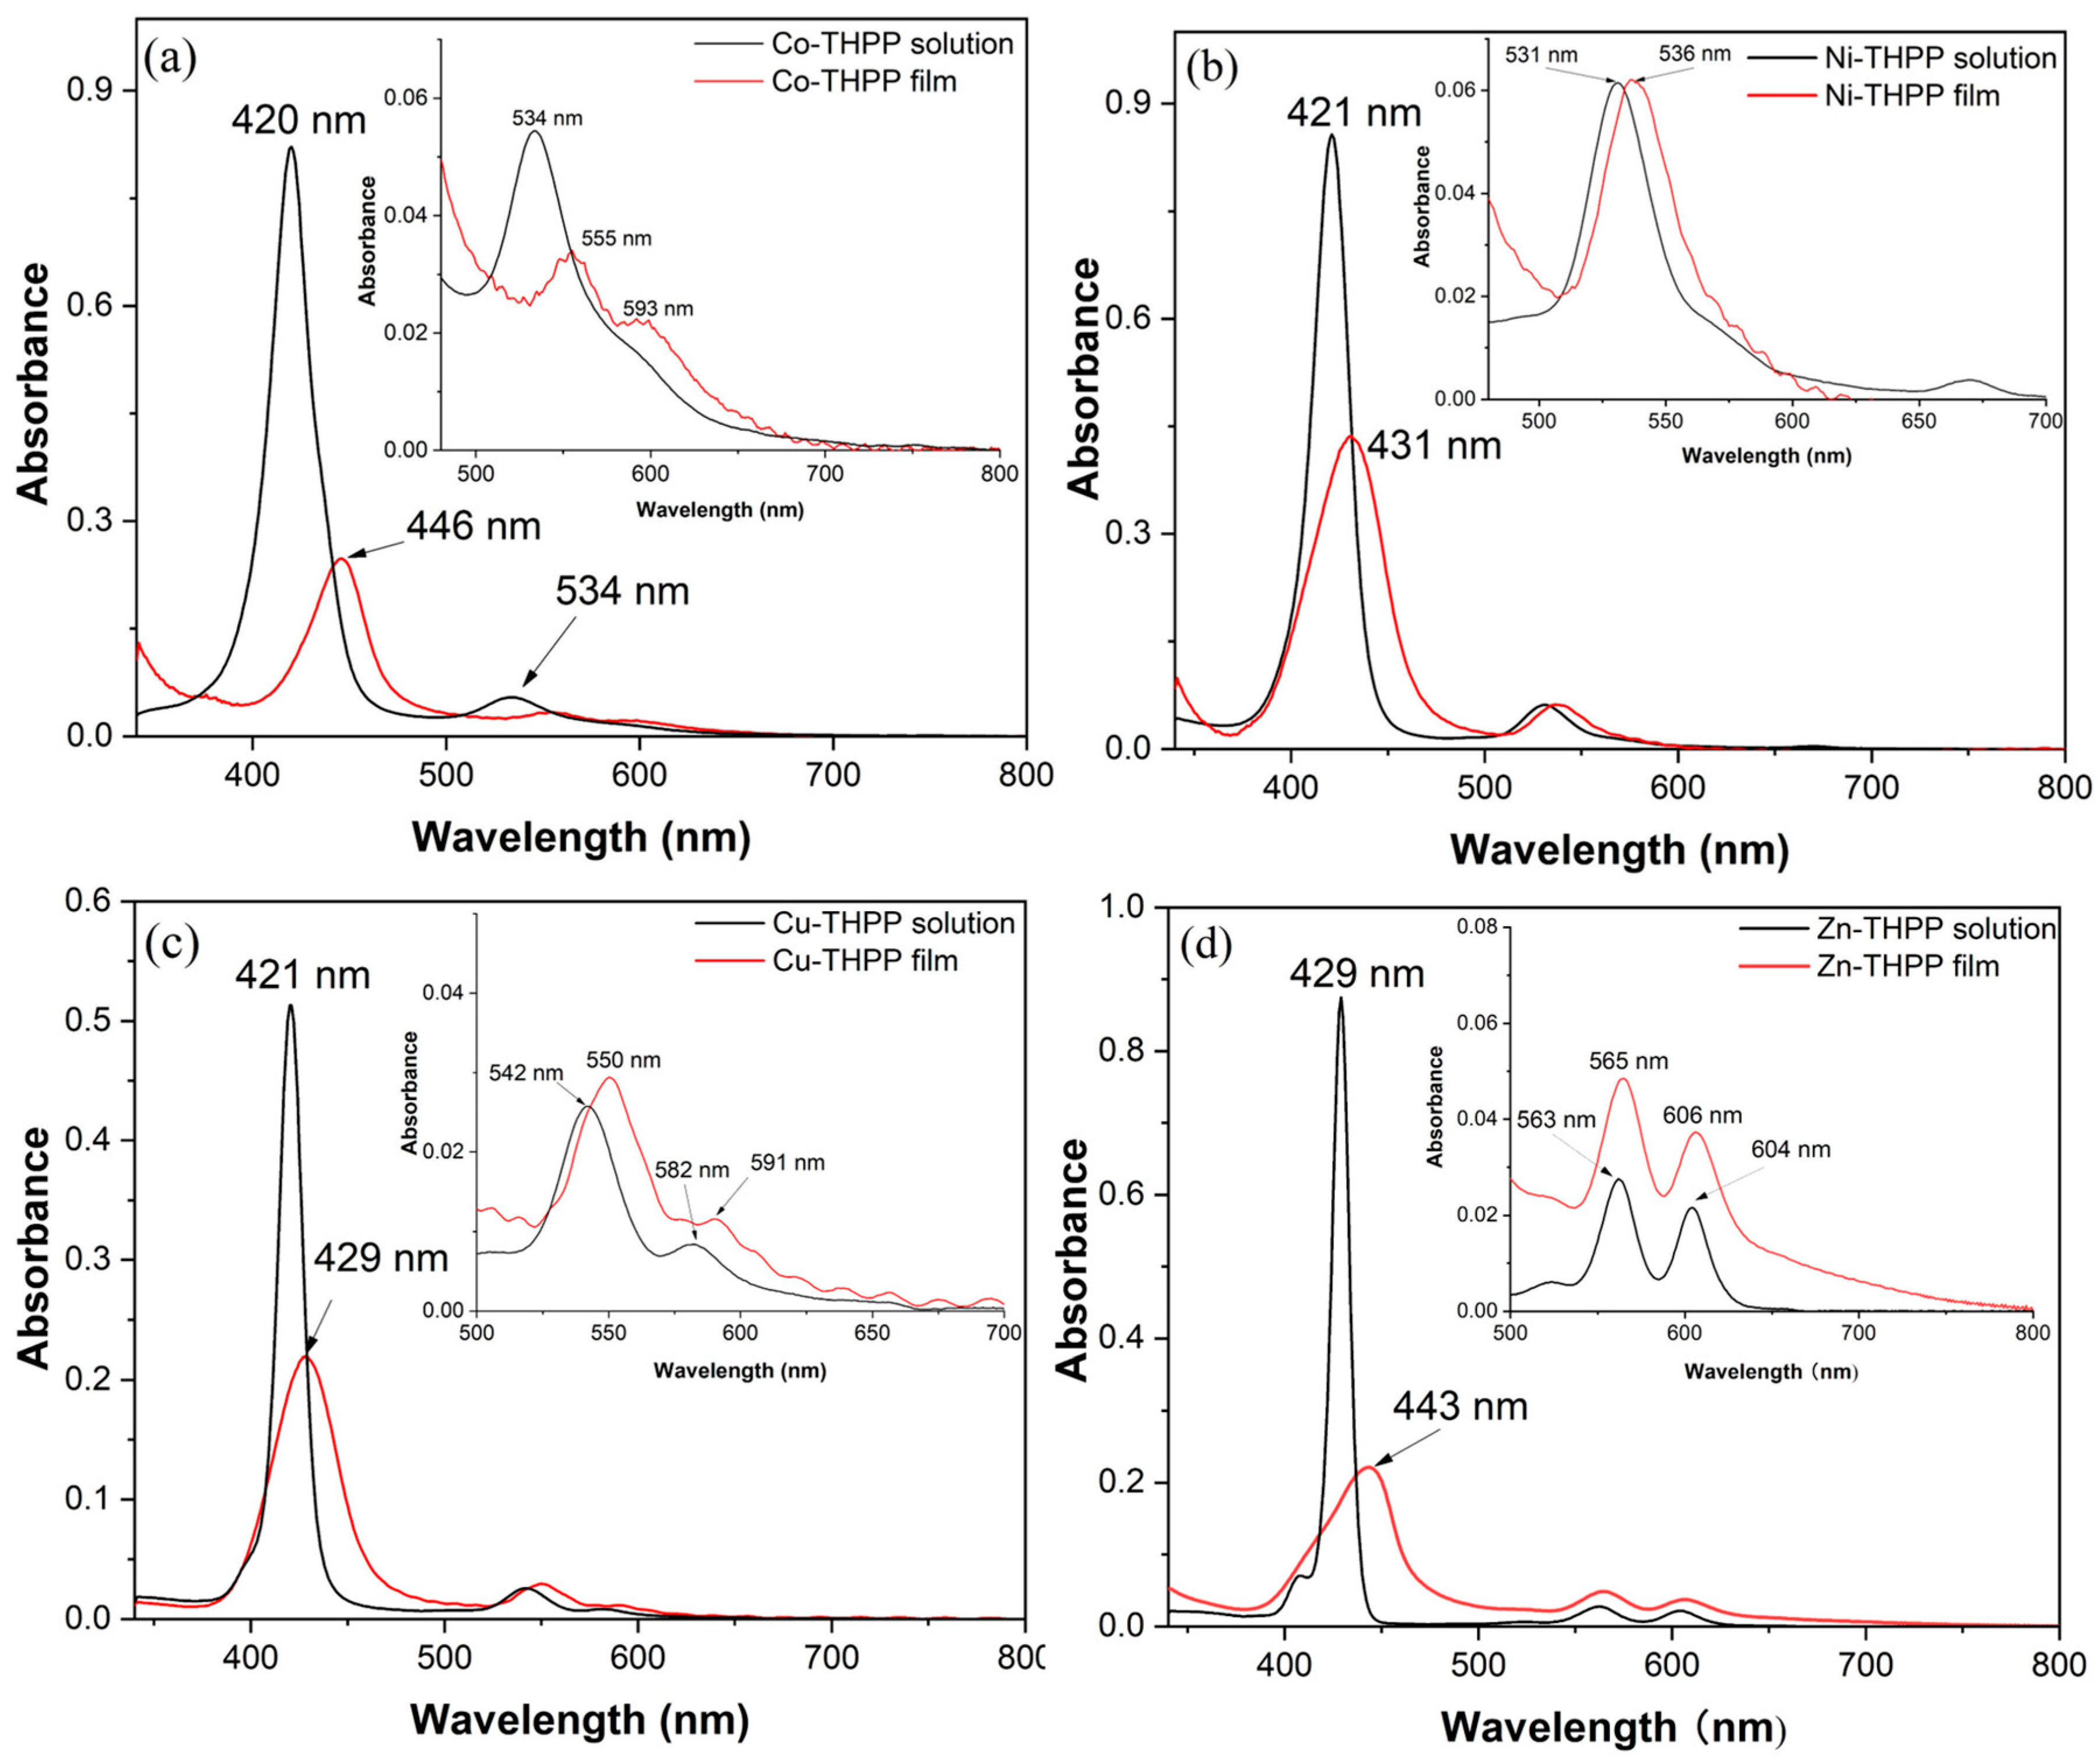
Figure 1. Self-assembled optical waveguide detection system based on THPP porphyrin film.
Nanomaterials 12 00944 g001
Figure 2. UV-Vis absorption spectra of (a) THPP-free porphyrin, (b) M–THPP (M = Co, Ni, Cu, Zn) complexes in DMF solution, (c) Q- bands magnification of THPP and metal complexes in DMF.
Nanomaterials 12 00944 g002
Figure 3. UV-Vis absorption spectrum of (a) Co–THPP, (b) Ni–THPP, (c) Cu–THPP and (d) Zn–THPP complex in solution (DMF) and in film state.
Nanomaterials 12 00944 g003
Figure 4. FT-IR spectrum of Co, Ni, Cu, Zn porphyrin complexes and THPP powder.
Nanomaterials 12 00944 g004
Figure 5. FE-SEM morphology of (a) Co–THPP, (b) Ni–THPP, (c) Cu–THPP and (d) Zn–THPP complex films deposited on glass substrate.
Nanomaterials 12 00944 g005
Figure 6. XPS spectra of porphyrin complexes (a) N1s, (b) C1s, (c) O1s, (d) Co2p3/2, (e) Cu2p, (f) Ni 2p3/2 and (g) Zn2p.
Nanomaterials 12 00944 g006
Figure 7. Absorption spectrum of (a) Co-THPP, (b) Ni-THPP, (c) Cu-THPP and (d) Zn-THPP complex films before and after acidic gas (1000 ppm) exposure.
Nanomaterials 12 00944 g007
Figure 8. Planar optical waveguide (520 nm light source) response curve of (a) Co–THPP, (b) Ni–THPP, (c) Cu–THPP and (d) Zn–THPP porphyrin complex films exposed to NO2 gas with different concentration (1–1000 ppm).
Nanomaterials 12 00944 g008
Figure 9. Planar optical waveguide (670 nm light source) response curve of (a) Co–THPP, (b) Ni–THPP, (c) Cu–THPP and (d) Zn–THPP porphyrin complex films exposed to NO2 gas with different concentration (1–1000 ppm).
Nanomaterials 12 00944 g009
Figure 10. Response histogram of output light intensity on planar optical waveguide of Co, Ni, Cu, Zn porphyrin complex thin films interacting with different concentrations of NO2 gas (a) 520 nm light source (b) 670 nm light source.
Nanomaterials 12 00944 g010
Figure 11. Radial distribution function of NO2 molecules around the center of mass of N atoms of THPP complexes with different metal ions.
Nanomaterials 12 00944 g011
Figure 12. The optimized geometry of THPP porphyrin with Zn2+ and NO2 in conformation 1.
Nanomaterials 12 00944 g012
Figure 13. The optimized geometry of THPP porphyrin with Zn2+ and NO2 in conformation 2.
Nanomaterials 12 00944 g013
Table 1. Absorption spectrum data and calculated molar extinction coefficient results of porphyrin complexes in DMF solution.
Soret BandQ Band
Complexesλ (nm)ε (M−1 cm−1)Λ (nm)ε (M−1 cm−1)Λ (nm)ε (M−1 cm−1)
Co–THPP4202.87 × 1055341.09 × 1045903.19 × 103
Ni–THPP4211.38 × 1055319.15 × 1045702.01 × 103
Cu–THPP4219.38 × 1055424.42 × 1045821.30 × 104
Zn–THPP4295.00 × 1085621.46 × 1076041.14 × 107
Table 2. UV-vis spectrum properties of porphyrin complexes in solution (DMF) and film state.
ComplexesλSoret Solution (nm)λSoret Film (nm)Shift Δλ (nm)
Co–THPP42044626
Ni–THPP42143110
Cu–THPP4214298
Zn–THPP42944011
Table 3. Absorption analysis of THPP complex films with NO2 gas (1000 ppm) exposure.
Soret BandQ Band
ComplexesBeforeAfter NO2BeforeAfter NO2
Co–THPP445455553, 596-
Cu–THPP427448550-
Ni–THPP431474536-
Zn–THPP440474563, 607700
Table 4. The Interaction energies between THPP complexes and NO2 calculated at B3LYP/6-31G* level.
SystemInteraction Energy [kcal/mole]Interaction Energy [kcal/mole]
Conformation 1Conformation 2
NO2—Zn–THPP−11.0−29.7
NO2—Cu–THPP+0.33−2.98
NO2—Co–THPP−11.8−30.6
NO2—Ni–THPP−14.9−19.9
Publisher’s Note: MDPI stays neutral with regard to jurisdictional claims in published maps and institutional affiliations.

