
Testing Strategies of the In Vitro Micronucleus Assay for the Genotoxicity Assessment of Nanomaterials in BEAS-2B Cells

Abstract
:1. Introduction
2. Materials and Methods
2.1. Preparation of NMs
2.2. Characterisation of NMs
2.3. Cell Cultivation and Treatment Conditions
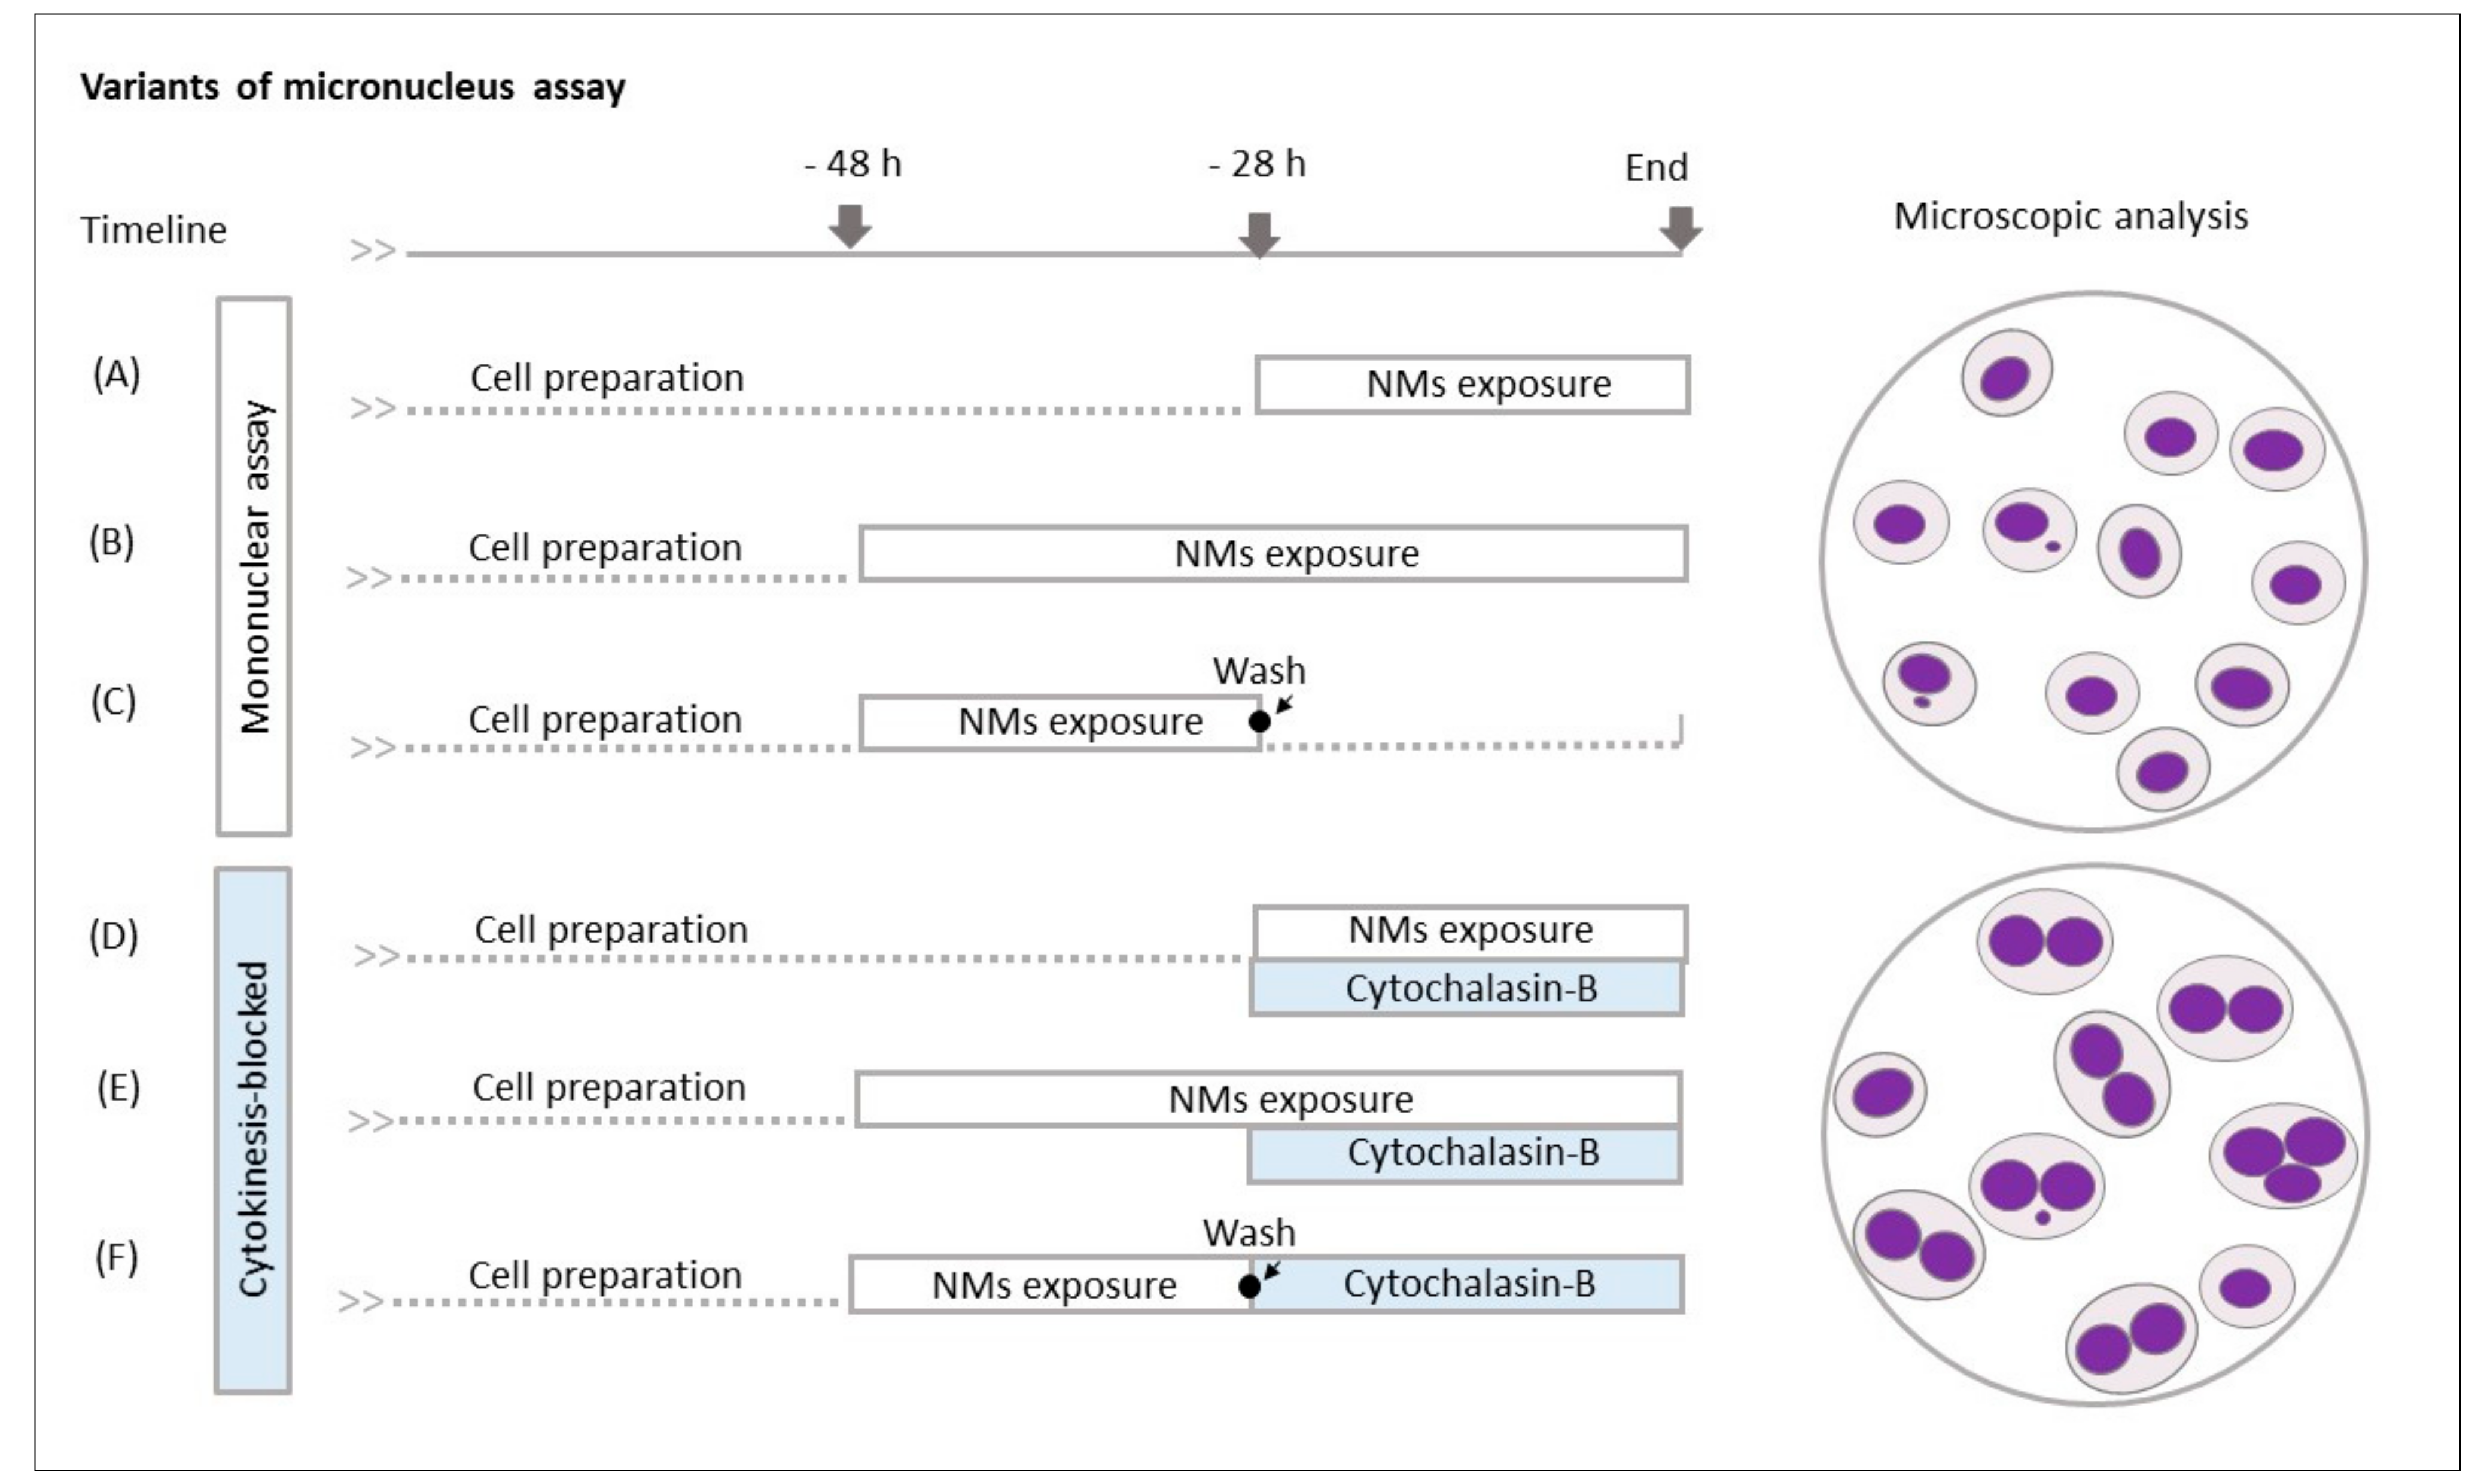
2.4. Micronucleus Analysis
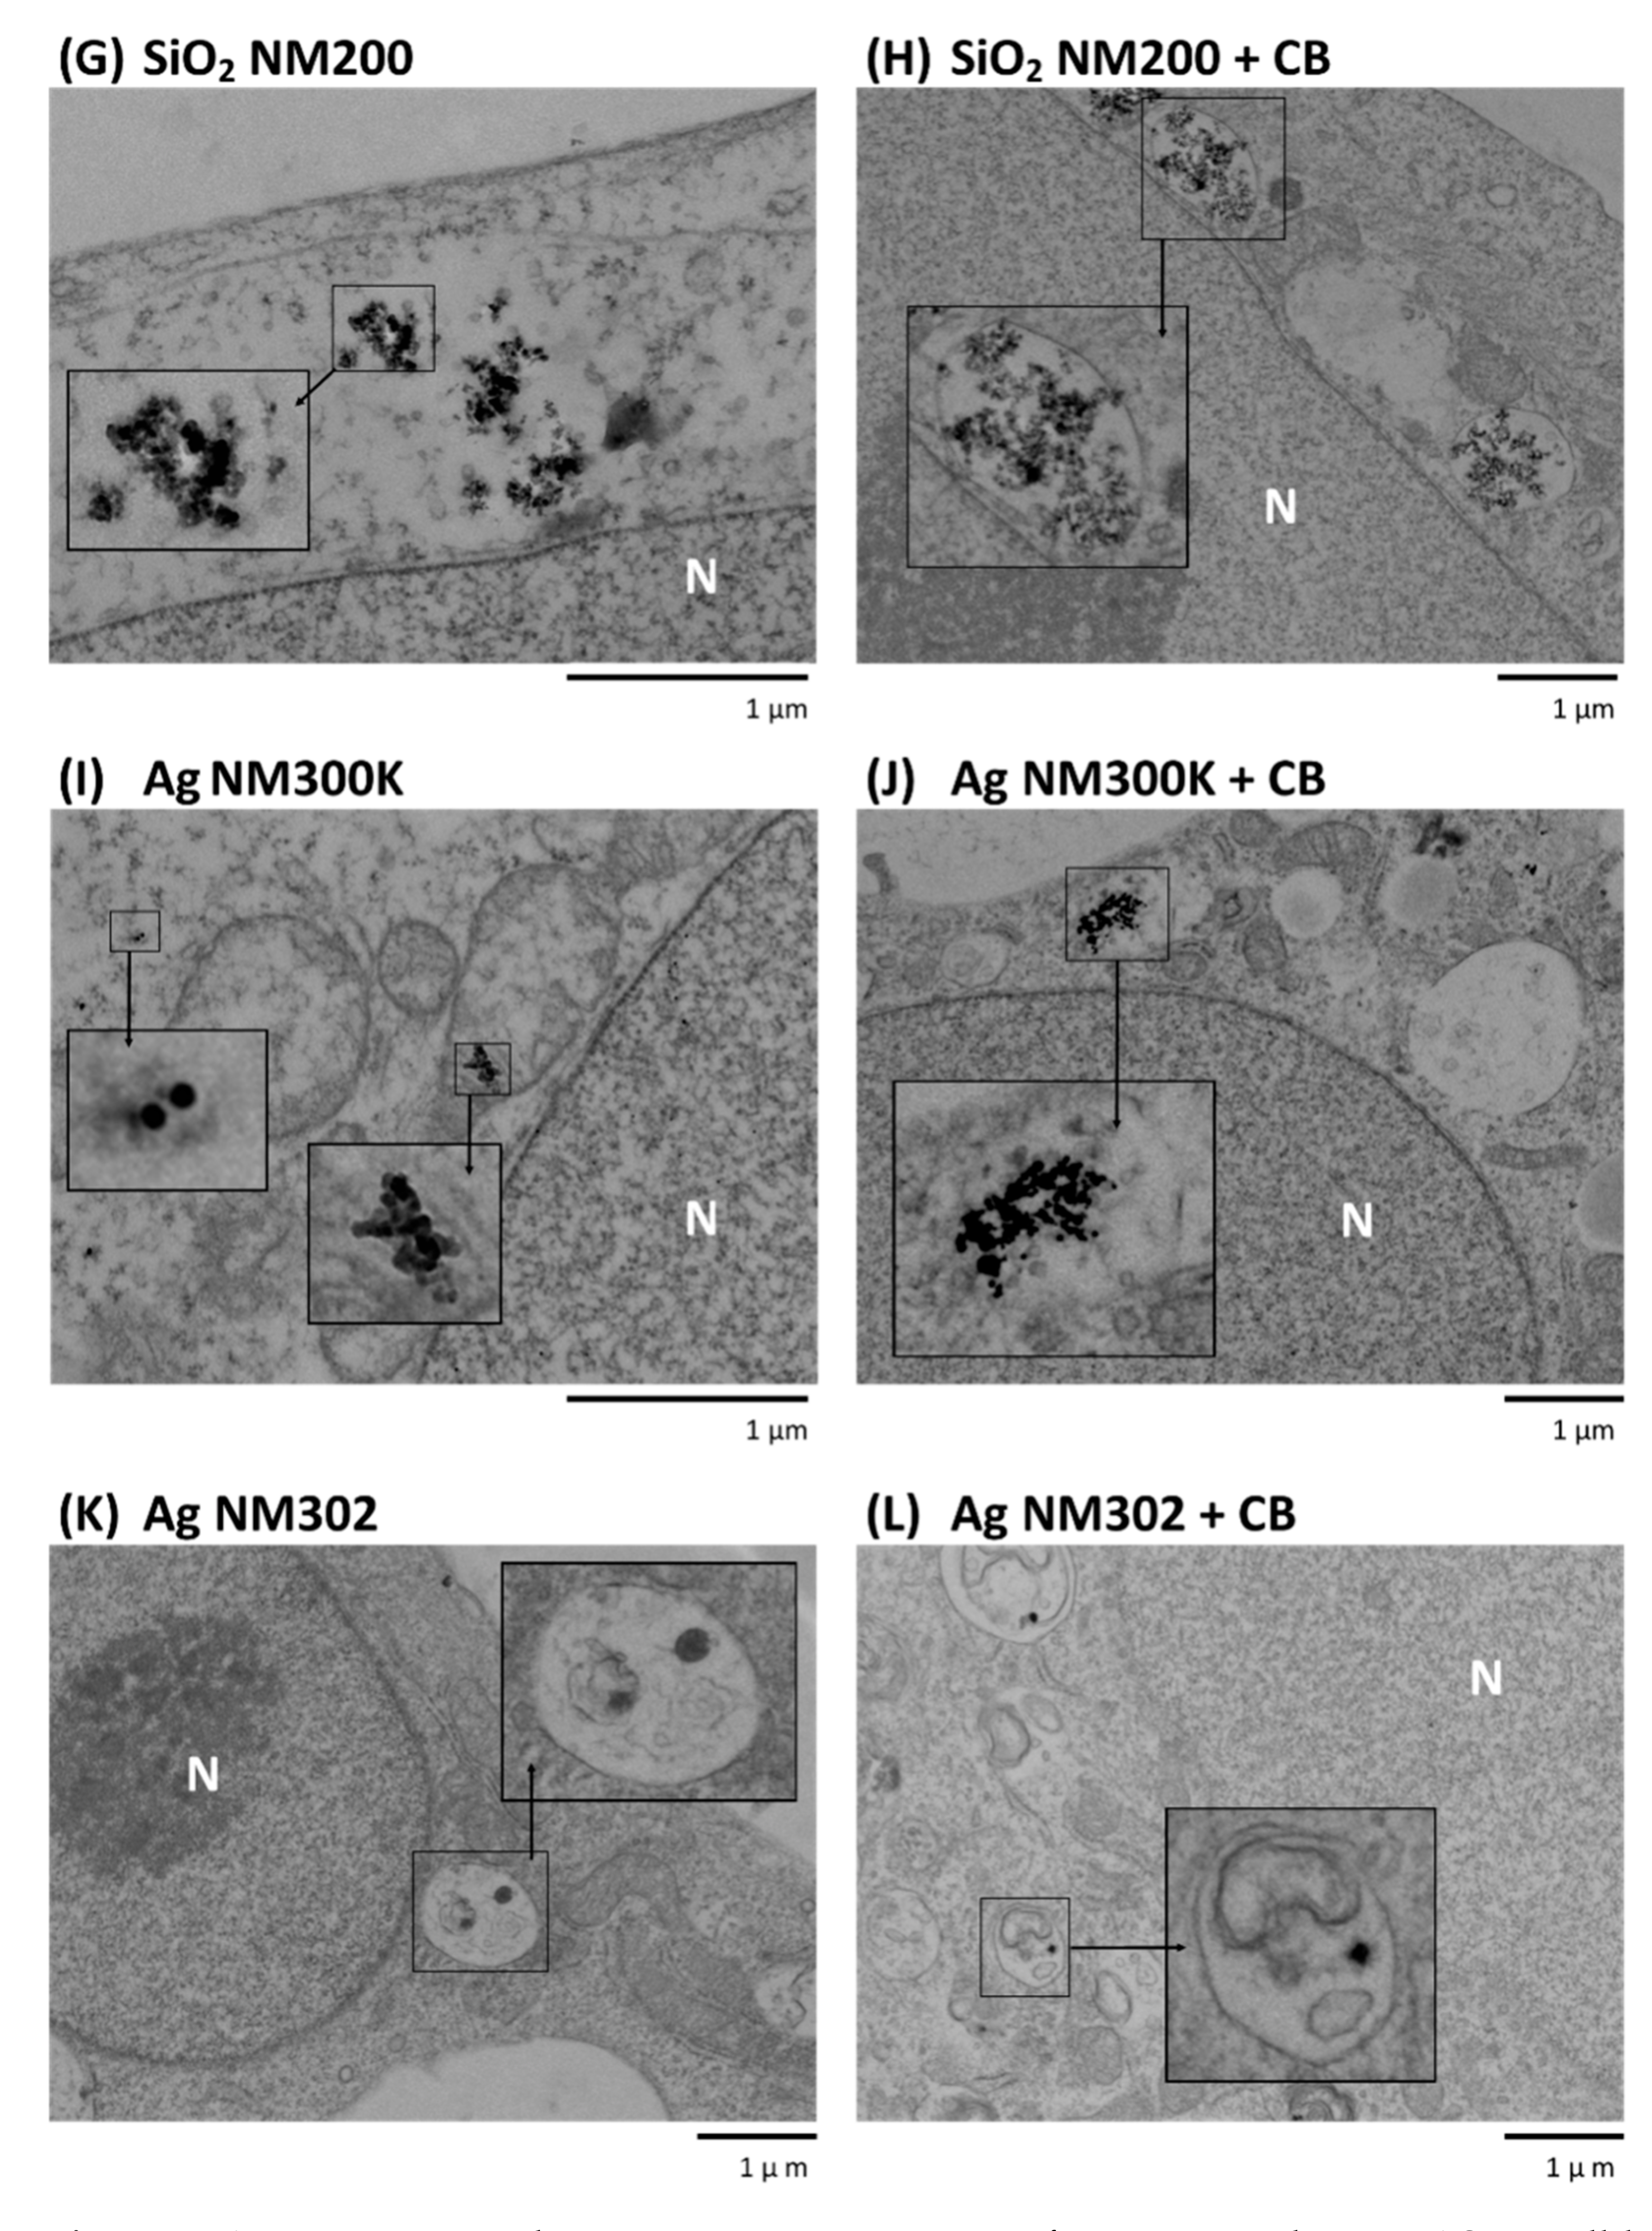
2.5. Transmission Electron Microscopy
2.6. Statistical Analysis
3. Results
3.1. Characterisation of NMs
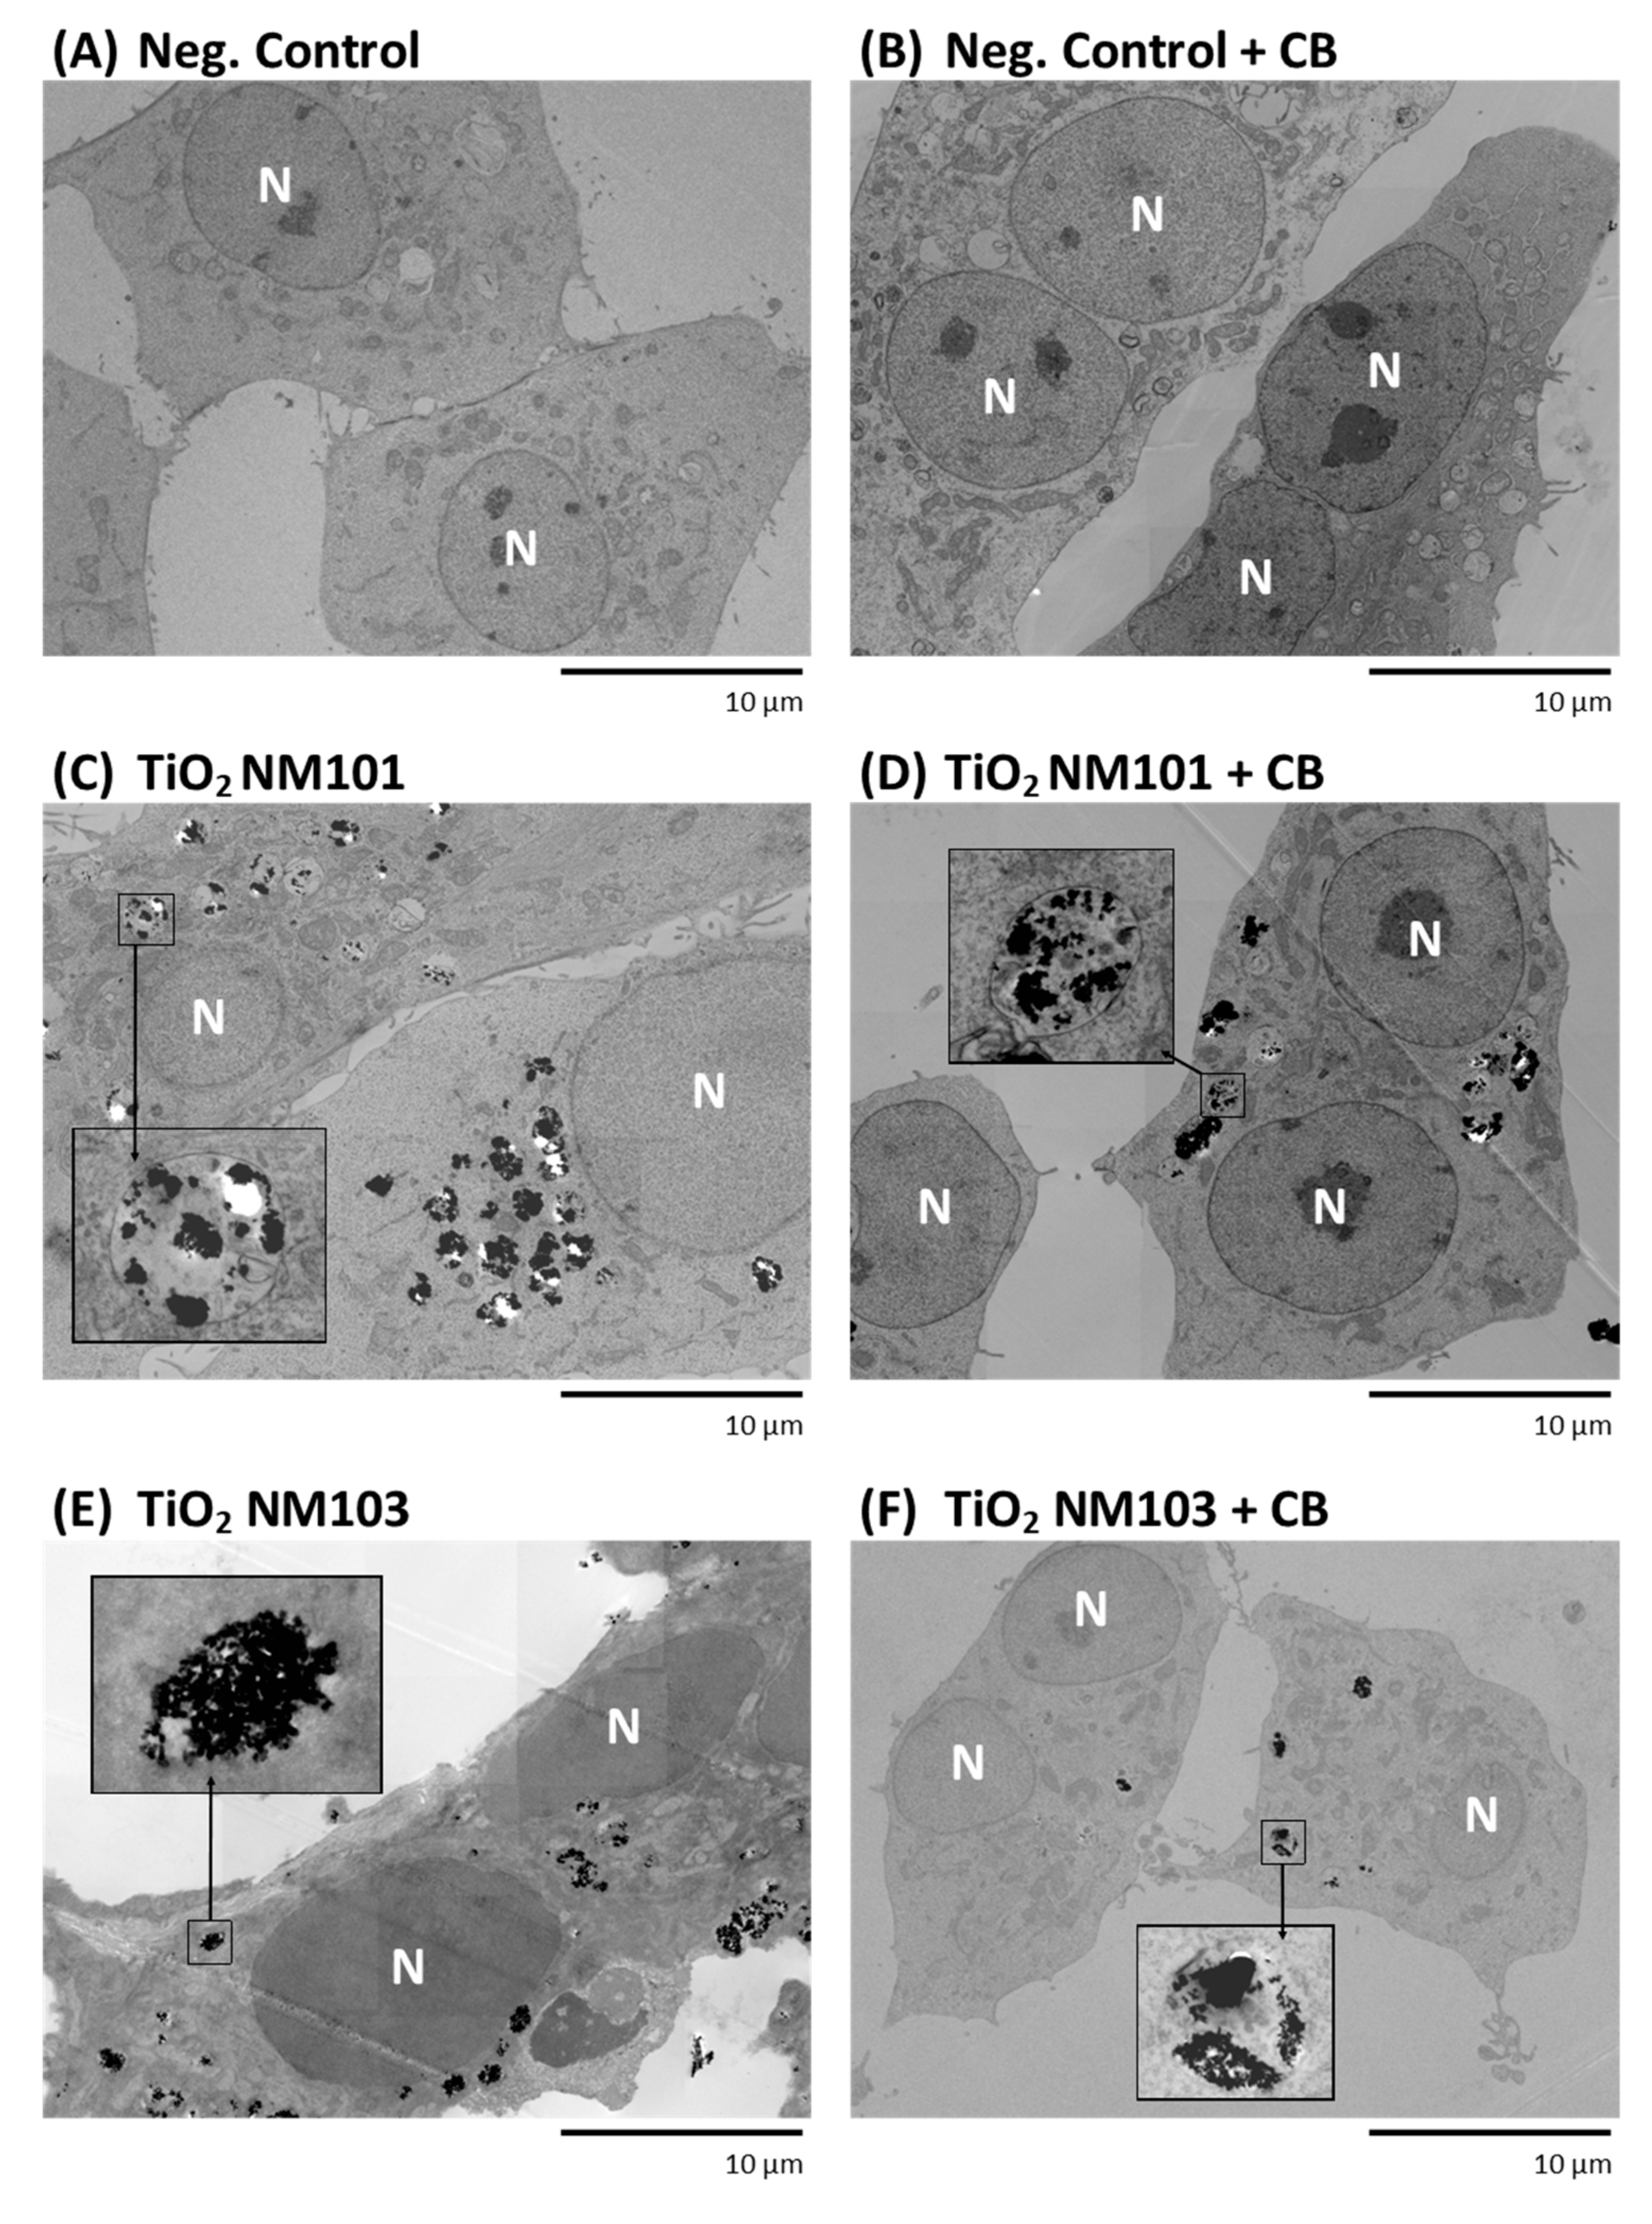
3.2. Transmission Electron Microscopy
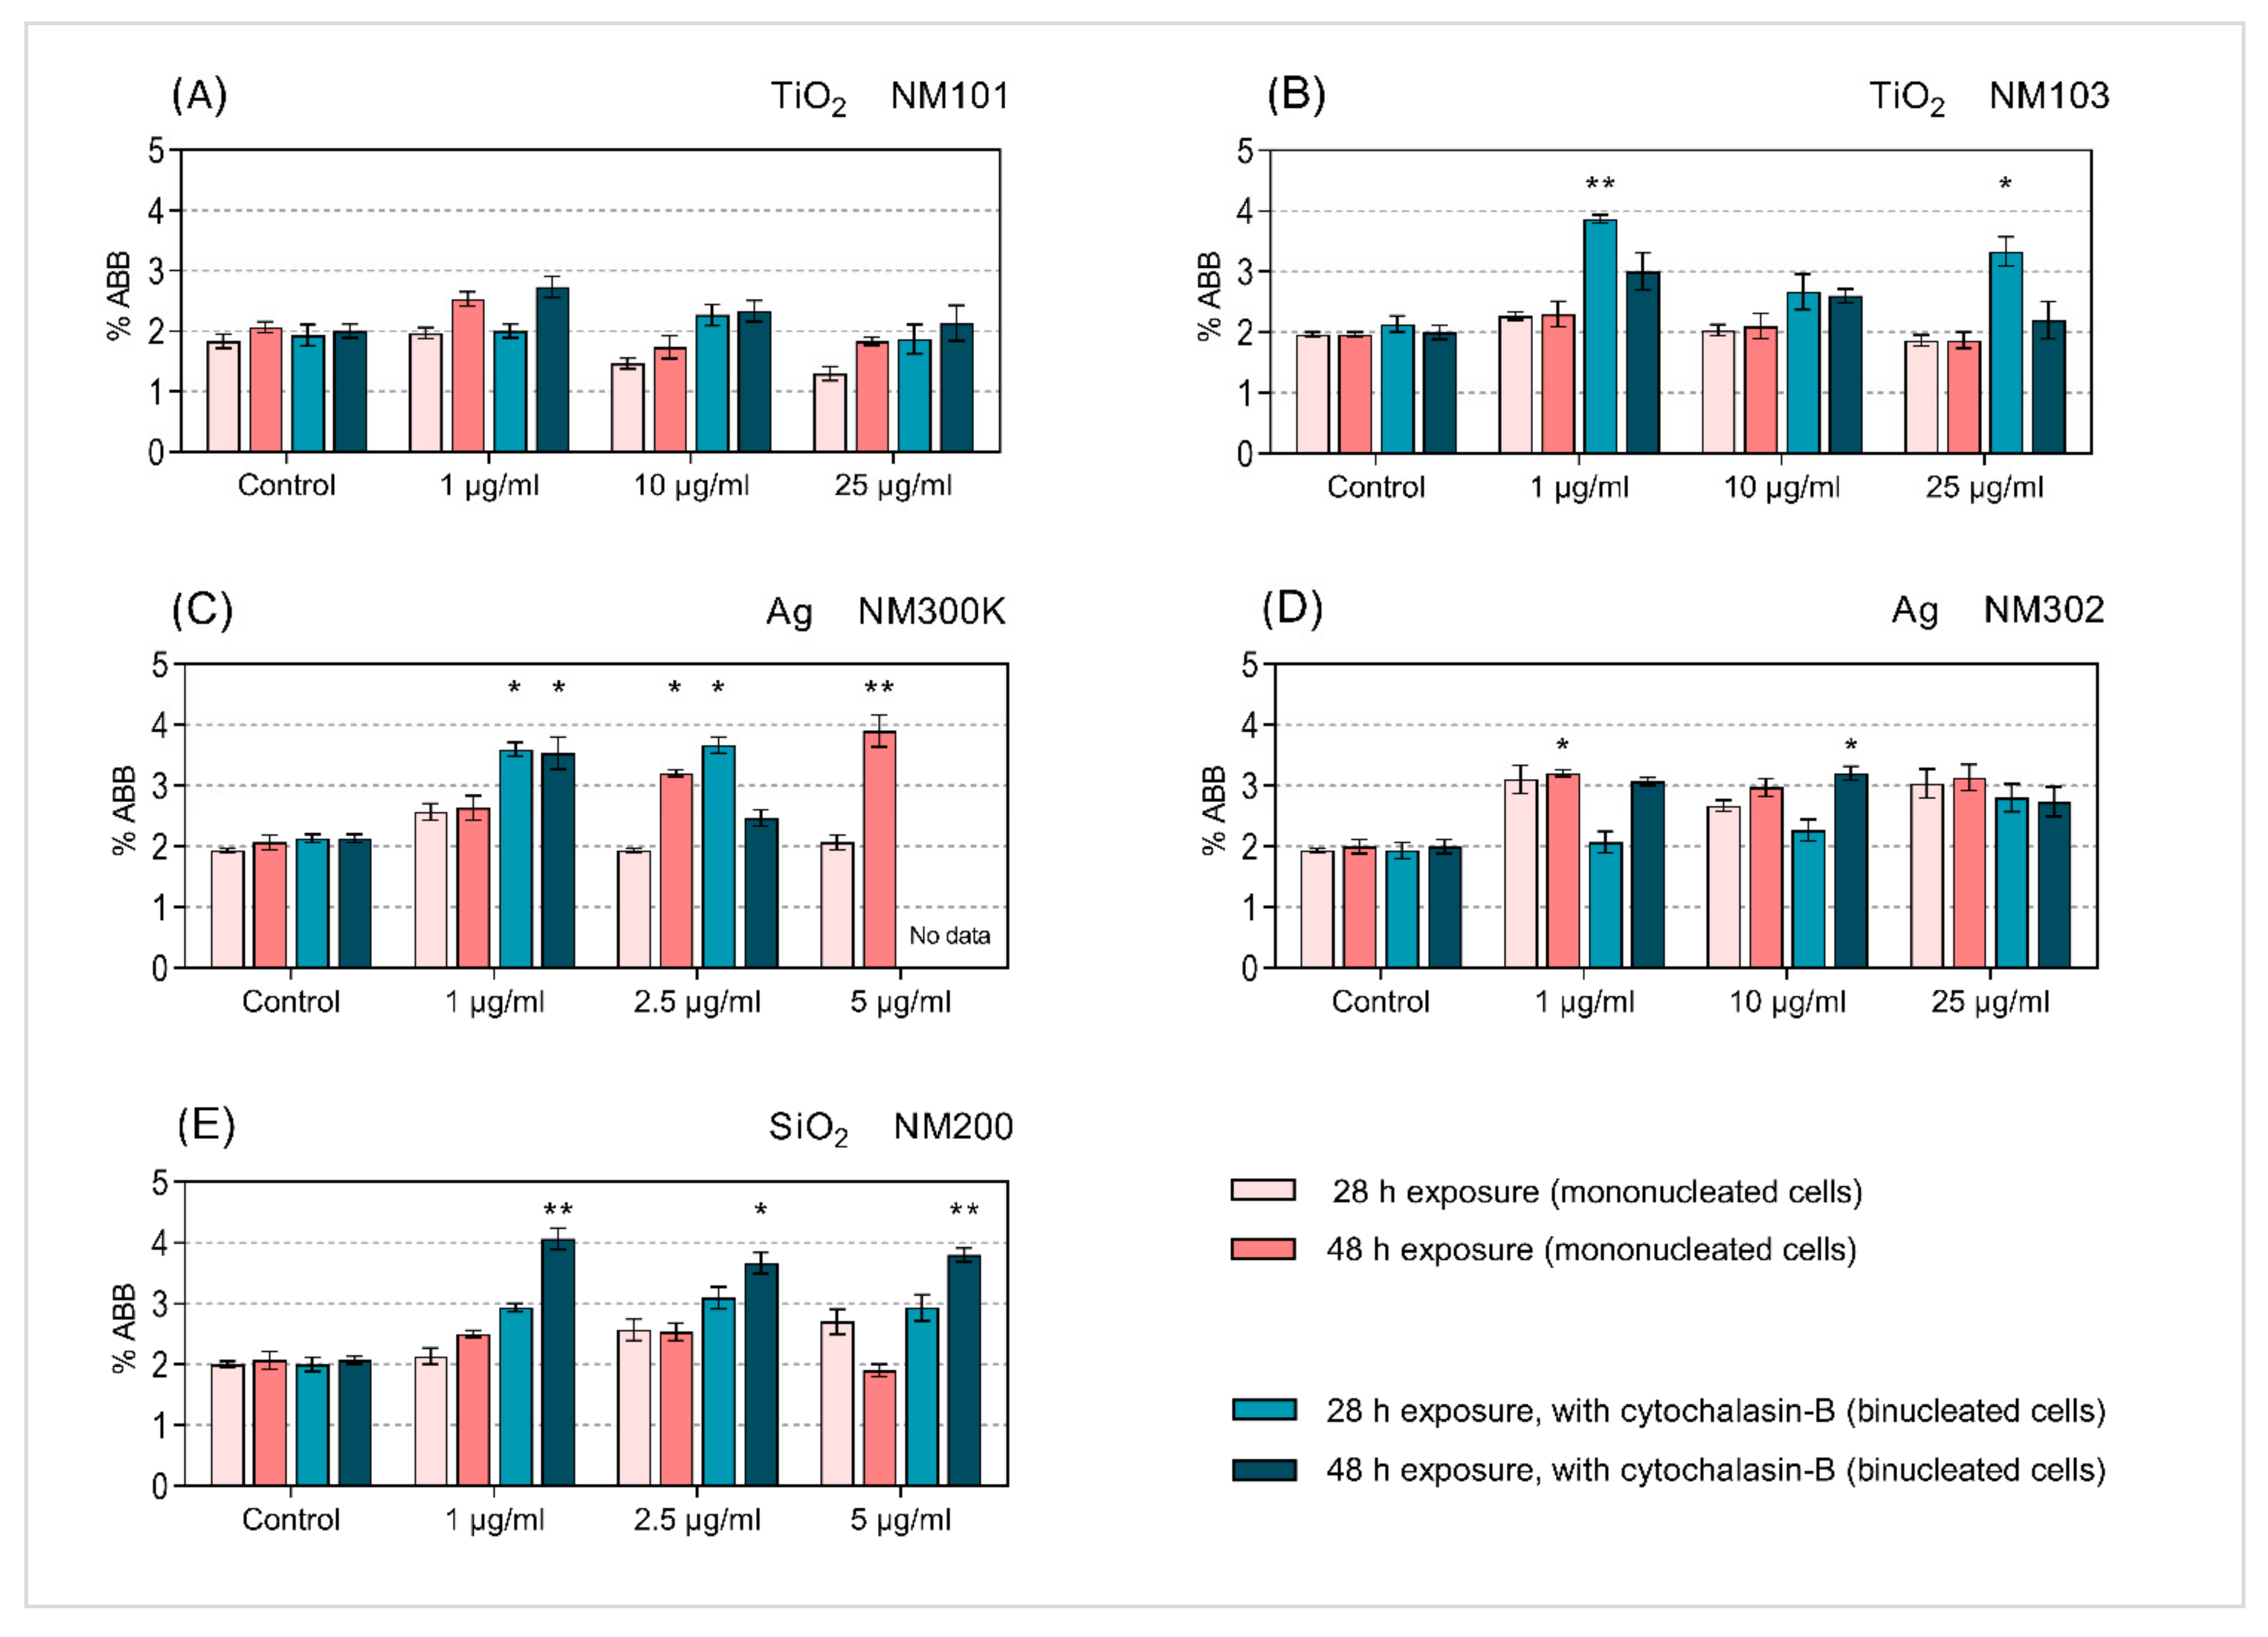
3.3. Micronucleus Analysis
4. Discussion
5. Conclusions
Supplementary Materials
Author Contributions
Funding
Data Availability Statement
Conflicts of Interest
Abbreviations
References
- Commission Recommendation of 18 October 2011 on the Definition of Nanomaterial (2011/696/EU). Off. J. Eur. Union 2011, L275, 38–40.
- Gupta, R.; Xie, H. Nanoparticles in Daily Life: Applications, Toxicity and Regulations. J. Environ. Pathol. Toxicol. Oncol. 2018, 37, 209–230. [Google Scholar] [CrossRef]
- Lewinski, N.; Colvin, V.; Drezek, R. Cytotoxicity of Nanopartides. Small 2008, 4, 26–49. [Google Scholar] [CrossRef] [PubMed]
- Singh, N.; Manshian, B.; Jenkins, G.J.S.; Griffiths, S.M.; Williams, P.M.; Maffeis, T.G.G.; Wright, C.J.; Doak, S.H. NanoGenotoxicology: The DNA Damaging Potential of Engineered Nanomaterials. Biomaterials 2009, 30, 3891–3914. [Google Scholar] [CrossRef] [PubMed]
- Lozano-Fernández, T.; Ballester-Antxordoki, L.; Pérez-Temprano, N.; Rojas, E.; Sanz, D.; Iglesias-Gaspar, M.; Moya, S.; González-Fernández, Á.; Rey, M. Potential Impact of Metal Oxide Nanoparticles on the Immune System: The Role of Integrins, L-Selectin and the Chemokine Receptor CXCR4. Nanomed. Nanotechnol. Biol. Med. 2014, 10, 1301–1310. [Google Scholar] [CrossRef]
- Khanna, P.; Ong, C.; Bay, B.H.; Baeg, G.H. Nanotoxicity: An Interplay of Oxidative Stress, Inflammation and Cell Death. Nanomaterials 2015, 5, 1163–1180. [Google Scholar] [CrossRef] [PubMed] [Green Version]
- Pelclova, D.; Zdimal, V.; Kacer, P.; Vlckova, S.; Fenclova, Z.; Navratil, T.; Komarc, M.; Schwarz, J.; Zikova, N.; Makes, O.; et al. Markers of Nucleic Acids and Proteins Oxidation among Office Workers Exposed to Air Pollutants Including (Nano)TiO2 Particles. Neuroendocrinol. Lett. 2016, 37, 13–16. [Google Scholar]
- Sima, M.; Vrbova, K.; Zavodna, T.; Honkova, K.; Chvojkova, I.; Ambroz, A.; Klema, J.; Rossnerova, A.; Polakova, K.; Malina, T.; et al. The Differential Effect of Carbon Dots on Gene Expression and Dna Methylation of Human Embryonic Lung Fibroblasts as a Function of Surface Charge and Dose. Int. J. Mol. Sci. 2020, 21, 4763. [Google Scholar] [CrossRef]
- Pelclova, D.; Zdimal, V.; Fenclova, Z.; Vlckova, S.; Turci, F.; Corazzari, I.; Kacer, P.; Schwarz, J.; Zikova, N.; Makes, O.; et al. Markers of Oxidative Damage of Nucleic Acids and Proteins among Workers Exposed to TiO2(Nano) Particles. Occup. Environ. Med. 2016, 73, 110–118. [Google Scholar] [CrossRef]
- Pelclova, D.; Zdimal, V.; Kacer, P.; Fenclova, Z.; Vlckova, S.; Syslova, K.; Navratil, T.; Schwarz, J.; Zikova, N.; Barosova, H.; et al. Oxidative Stress Markers Are Elevated in Exhaled Breath Condensate of Workers Exposed to Nanoparticles during Iron Oxide Pigment Production. J. Breath Res. 2016, 10, 016004. [Google Scholar] [CrossRef]
- Fatkhutdinova, L.M.; Khaliullin, T.O.; Vasil’yeva, O.L.; Zalyalov, R.R.; Mustafin, I.G.; Kisin, E.R.; Birch, M.E.; Yanamala, N.; Shvedova, A.A. Fibrosis Biomarkers in Workers Exposed to MWCNTs. Toxicol. Appl. Pharmacol. 2016, 299, 125–131. [Google Scholar] [CrossRef] [Green Version]
- Rossnerova, A.; Honkova, K.; Pelclova, D.; Zdimal, V.; Hubacek, J.A.; Chvojkova, I.; Vrbova, K.; Rossner, P.; Topinka, J.; Vlckova, S.; et al. DNA Methylation Profiles in a Group of Workers Occupationally Exposed to Nanoparticles. Int. J. Mol. Sci. 2020, 21, 2420. [Google Scholar] [CrossRef] [Green Version]
- Novotna, B.; Pelclova, D.; Rossnerova, A.; Zdimal, V.; Ondracek, J.; Lischkova, L.; Vlckova, S.; Fenclova, Z.; Klusackova, P.; Zavodna, T.; et al. The Genotoxic Effects in the Leukocytes of Workers Handling Nanocomposite Materials. Mutagenesis 2020, 35, 331–340. [Google Scholar] [CrossRef]
- Fenech, M.; Morley, A.A. Measurement of Micronuclei in Lymphocytes. Mutat. Res. Mutagen. Relat. Subj. 1985, 147, 29–36. [Google Scholar] [CrossRef]
- Nersesyan, A.; Fenech, M.; Bolognesi, C.; Mišík, M.; Setayesh, T.; Wultsch, G.; Bonassi, S.; Thomas, P.; Knasmüller, S. Use of the Lymphocyte Cytokinesis-Block Micronucleus Assay in Occupational Biomonitoring of Genome Damage Caused by in Vivo Exposure to Chemical Genotoxins: Past, Present and Future. Mutat. Res. Rev. Mutat. Res. 2016, 770, 1–11. [Google Scholar] [CrossRef] [PubMed]
- Gonzalez, L.; Kirsch-Volders, M. Reprint of “Biomonitoring of Genotoxic Effects for Human Exposure to Nanomaterials: The Challenge Ahead". Mutat. Res. Rev. Mutat. Res. 2016, 770, 204–216. [Google Scholar] [CrossRef]
- Rossnerova, A.; Pelclova, D.; Zdimal, V.; Rossner, P.; Elzeinova, F.; Vrbova, K.; Topinka, J.; Schwarz, J.; Ondracek, J.; Kostejn, M.; et al. The Repeated Cytogenetic Analysis of Subjects Occupationally Exposed to Nanoparticles: A Pilot Study. Mutagenesis 2019, 34, 253–263. [Google Scholar] [CrossRef]
- Rössnerová, A.; Pelclová, D.; Ždímal, V.; Elzeinová, F.; Margaryan, H.; Chvojková, I.; Topinka, J.; Schwarz, J.; Ondráček, J.; Koštejn, M.; et al. Males-Females Differences in the Spectrum of Chromosomal Aberrations in the Group of Nanocomposites Production Workers. In Proceedings of the NANOCON Conference Proceedings–International Conference on Nanomaterials, Brno, Czech Republic, 16–18 October 2019; Volume 2020, pp. 502–507. [Google Scholar] [CrossRef]
- Kazimirova, A.; Baranokova, M.; Staruchova, M.; Drlickova, M.; Volkovova, K.; Dusinska, M. Titanium Dioxide Nanoparticles Tested for Genotoxicity with the Comet and Micronucleus Assays in Vitro, Ex Vivo and in Vivo. Mutat. Res. Genet. Toxicol. Environ. Mutagen. 2019, 843, 57–65. [Google Scholar] [CrossRef]
- Doak, S.H.; Griffiths, S.M.; Manshian, B.; Singh, N.; Williams, P.M.; Brown, A.P.; Jenkins, G.J.S. Confounding Experimental Considerations in Nanogenotoxicology. Mutagenesis 2009, 24, 285–293. [Google Scholar] [CrossRef] [Green Version]
- Gonzalez, L.; Sanderson, B.J.S.; Kirsch-Volders, M. Adaptations of the in Vitro MN Assay for the Genotoxicity Assessment of Nanomaterials. Mutagenesis 2011, 26, 185–191. [Google Scholar] [CrossRef]
- Chou, L.Y.T.; Ming, K.; Chan, W.C.W. Strategies for the Intracellular Delivery of Nanoparticles. Chem. Soc. Rev. 2011, 40, 233–245. [Google Scholar] [CrossRef] [PubMed]
- Rasmussen, K.; Mast, J.; De Temmerman, P.-J.; Verleysen, E.; Waegeneers, N.; Van Steen, F.; Pizzolon, J.C.; De Temmerman, L.; Van Doren, E.; Jensen, K.A.; et al. Titanium Dioxide, NM-100, NM-101, NM-102, NM-103, NM-104, NM-105: Characterisation and Physico- Chemical Properties; Science and Policy Report by the Joint Research Centre of the European Commission: Luxembourg, 2014. [Google Scholar] [CrossRef]
- Rasmussen, K.; Mech, A.; Mast, J.; de Temmerman, P.-J.; Waegeneers, N.; Van Steen, F.; Pizzolon, J.C.; de Temmerman, L.; van Doren, E.; Jensen, A.; et al. Synthetic Amorphous Silicon Dioxide (NM-200, NM-201, NM-202, NM-203, NM-204): Characterisation and Physico-Chemical Properties; Science and Policy Report by the Joint Research Centre of the European Commission: Luxembourg, 2013. [Google Scholar] [CrossRef]
- Klein, C.L.; Comero, S.; Stahlmecke, B.; Romazanov, J.; Kuhlbusch, T.A.J.; Van Doren, E.; Mast, P.-J.D.T.J.; Wick, P.; Krug, H.; Locoro, G.; et al. NM-Series of Representative Manufactured Nanomaterials, NM-300 Silver Characterisation, Stability, Homogeneity; Science and Policy Report by the Joint Research Centre of the European Commission: Luxembourg, 2011. [Google Scholar] [CrossRef]
- Robinson, K.; Tantra, R.; Fry, T.; Sarantaridis, D.; Gohli, D.; Allen, C.; Quincy, P.; Minelli, C. Global NanoMappp Report: Physico-Chemical Properties of NM 302 Nano-Silver Reference Material; National Physical Laboratory: Teddington, UK, 2014. [Google Scholar] [CrossRef]
- Jensen, K.A.; Kembouche, Y.; Christiansen, E.; Jacobsen, N.R.; Wallin, H.; Guiot, C.; Spalla, O.; Witschger, O.; Jakobsen, N.R.; Eallin, H.; et al. NANOGENOTOX Dispersion Protocol–Standard Operation Procedure (SOP); The National Research Centre for the Working Environment: Copenhagen, Denmark, 2011. [Google Scholar]
- Reddel, R.R.; Ke, Y.; Gerwin, B.I.; McMenamin, M.G.; Lechner, J.F.; Su, R.T.; Brash, D.E.; Park, J.B.; Rhim, J.S.; Harris, C.C. Transformation of Human Bronchial Epithelial Cells by Infection with SV40 or Adenovirus-12 SV40 Hybrid Virus, or Transfection via Strontium Phosphate Coprecipitation with a Plasmid Containing SV40 Early Region Genes. Cancer Res. 1988, 48, 1904–1909. [Google Scholar] [PubMed]
- OECD. OECD Guideline for Testing of Chemicals No. 487; Intergovernmental Panel on Climate Change, Ed.; Cambridge University Press: Cambridge, UK, 2016. [Google Scholar] [CrossRef]
- Fenech, M. Cytokinesis-Block Micronucleus Cytome Assay. Nat. Protoc. 2007, 2, 1084–1104. [Google Scholar] [CrossRef] [Green Version]
- Brzicova, T.; Sikorova, J.; Milcova, A.; Vrbova, K.; Klema, J.; Pikal, P.; Lubovska, Z.; Philimonenko, V.; Franco, F.; Topinka, J.; et al. Nano-TiO2 Stability in Medium and Size as Important Factors of Toxicity in Macrophage-like Cells. Toxicol. Vitr. 2019, 54, 178–188. [Google Scholar] [CrossRef]
- Cervena, T.; Rossnerova, A.; Sikorova, J.; Beranek, V.; Vojtisek-Lom, M.; Ciganek, M.; Topinka, J.; Rossner, P. DNA Damage Potential of Engine Emissions Measured In Vitro by Micronucleus Test in Human Bronchial Epithelial Cells. Basic Clin. Pharmacol. Toxicol. 2016, 1–7. [Google Scholar] [CrossRef] [PubMed] [Green Version]
- Kirsch-Volders, M.; Sofuni, T.; Aardema, M.; Albertini, S.; Eastmond, D.; Fenech, M.; Ishidate, M.; Kirchner, S.; Lorge, E.; Morita, T.; et al. Report from the in Vitro Micronucleus Assay Working Group. Mutat. Res. Genet. Toxicol. Environ. Mutagen. 2003, 540, 153–163. [Google Scholar] [CrossRef]
- Dynamic Light Scattering: Common Terms Define. MALVERN PANALYTICAL; Malvern Instruments: Malvern, UK, 2011.
- Agrawal, Y.; Patel, V. Nanosuspension: An Approach to Enhance Solubility of Drugs. J. Adv. Pharm. Technol. Res. 2011, 2, 81–87. [Google Scholar] [CrossRef]
- Bhattacharjee, S. DLS and Zeta Potential–What They Are and What They Are Not? J. Control. Release 2016, 235, 337–351. [Google Scholar] [CrossRef]
- Ling, C.; An, H.; Li, L.; Wang, J.; Lu, T.; Wang, H.; Hu, Y.; Song, G.; Liu, S. Genotoxicity Evaluation of Titanium Dioxide Nanoparticles In Vitro: A Systematic Review of the Literature and Meta-Analysis. Biol. Trace Elem. Res. 2021. [Google Scholar] [CrossRef]
- Rodriguez-Garraus, A.; Azqueta, A.; Vettorazzi, A.; de Cerain, A.L. Genotoxicity of Silver Nanoparticles. Nanomaterials 2020, 10, 251. [Google Scholar] [CrossRef] [Green Version]
- IARC Monographs on the Evaluation of Carcinogenic Risks to Humans. IARC Monogr. Eval. Carcinog. Risks Hum. 2010, 93, 9–38. [CrossRef] [Green Version]
- Xu, Y.; Wei, M.T.; Ou-Yang, H.D.; Walker, S.G.; Wang, H.Z.; Gordon, C.R.; Guterman, S.; Zawacki, E.; Applebaum, E.; Brink, P.R.; et al. Exposure to TiO2 Nanoparticles Increases Staphylococcus Aureus Infection of HeLa Cells. J. Nanobiotechnol. 2016, 14, 29–31. [Google Scholar] [CrossRef] [Green Version]
- Gurr, J.R.; Wang, A.S.S.; Chen, C.H.; Jan, K.Y. Ultrafine Titanium Dioxide Particles in the Absence of Photoactivation Can Induce Oxidative Damage to Human Bronchial Epithelial Cells. Toxicology 2005, 213, 66–73. [Google Scholar] [CrossRef]
- Kang, S.J.; Kim, B.M.; Lee, Y.J.; Chung, H.W. Titanium Dioxide Nanoparticles Trigger P53-Mediated Damage Response in Peripheral Blood Lymphocytes. Environ. Mol. Mutagen. 2008, 49, 399–405. [Google Scholar] [CrossRef]
- Shi, Y.; Zhang, J.-H.; Jiang, M.; Zhu, L.-H.; Tan, H.-Q.; Lu, B. Synergistic Genotoxicity Caused by Low Concentration of Titanium Dioxide Nanoparticles and p,p ′-DDT in Human Hepatocytes. Environ. Mol. Mutagen. 2009, 405, 192–204. [Google Scholar] [CrossRef] [PubMed]
- Demir, E.; Akça, H.; Turna, F.; Aksakal, S.; Burgucu, D.; Kaya, B.; Tokgün, O.; Vales, G.; Creus, A.; Marcos, R. Genotoxic and Cell-Transforming Effects of Titanium Dioxide Nanoparticles. Environ. Res. 2015, 136, 300–308. [Google Scholar] [CrossRef] [PubMed]
- Wang, J.J.; Sanderson, B.J.S.; Wang, H. Cytotoxicity and Genotoxicity of Ultrafine Crystalline SiO2 Particulate in Cultured Human Lymphoblastoid Cells. Environ. Mol. Mutagen. 2007, 48, 151–157. [Google Scholar] [CrossRef] [PubMed]
- Gonzalez, L.; Thomassen, L.C.J.; Plas, G.; Rabolli, V.; Napierska, D.; Decordier, I.; Roelants, M.; Hoet, P.H.; Kirschhock, C.E.A.; Martens, J.A.; et al. Exploring the Aneugenic and Clastogenic Potential in the Nanosize Range: A549 Human Lung Carcinoma Cells and Amorphous Monodisperse Silica Nanoparticles as Models. Nanotoxicology 2010, 4, 382–395. [Google Scholar] [CrossRef]
- AshaRani, P.V.; Mun, G.L.K.; Hande, M.P.; Valiyaveettil, S. Cytotoxicity and Genotoxicity of Silver Nanoparticles in Human Cells. ACS Nano 2009, 3, 279–290. [Google Scholar] [CrossRef] [PubMed]
- Guo, X.; Li, Y.; Yan, J.; Ingle, T.; Jones, M.Y.; Mei, N.; Boudreau, M.D.; Cunningham, C.K.; Abbas, M.; Paredes, A.M.; et al. Size- and Coating-Dependent Cytotoxicity and Genotoxicity of Silver Nanoparticles Evaluated Using in Vitro Standard Assays. Nanotoxicology 2016, 10. [Google Scholar] [CrossRef]
- Yin, H.; Casey, P.S.; McCall, M.J.; Fenech, M. Size-Dependent Cytotoxicity and Genotoxicity of ZnO Particles to Human Lymphoblastoid (WIL2-NS) Cells. Environ. Mol. Mutagen. 2015, 56, 767–776. [Google Scholar] [CrossRef]
- Roszak, J.; Catalán, J.; Järventaus, H.; Lindberg, H.K.; Suhonen, S.; Vippola, M.; Stępnik, M.; Norppa, H. Effect of Particle Size and Dispersion Status on Cytotoxicity and Genotoxicity of Zinc Oxide in Human Bronchial Epithelial Cells. Mutat. Res. Toxicol. Environ. Mutagen. 2016, 805, 7–18. [Google Scholar] [CrossRef] [PubMed]
- Xia, Q.; Li, H.; Liu, Y.; Zhang, S.; Feng, Q.; Xiao, K. The Effect of Particle Size on the Genotoxicity of Gold Nanoparticles. J. Biomed. Mater. Res. Part A 2017, 105, 710–719. [Google Scholar] [CrossRef] [PubMed]
- Li, Y.; Doak, S.H.; Yan, J.; Chen, D.H.; Zhou, M.; Mittelstaedt, R.A.; Chen, Y.; Li, C.; Chen, T. Factors Affecting the in Vitro Micronucleus Assay for Evaluation of Nanomaterials. Mutagenesis 2017, 32, 151–159. [Google Scholar] [CrossRef] [Green Version]
- Gonzalez, L.; Lukamowicz-Rajska, M.; Thomassen, L.C.J.J.; Kirschhock, C.E.A.A.; Leyns, L.; Lison, D.; Martens, J.A.; Elhajouji, A.; Kirsch-Volders, M. Co-Assessment of Cell Cycle and Micronucleus Frequencies Demonstrates the Influence of Serum on the in Vitro Genotoxic Response to Amorphous Monodisperse Silica Nanoparticles of Varying Sizes. Nanotoxicology 2014, 8, 876–884. [Google Scholar] [CrossRef] [PubMed]
- Drescher, D.; Orts-Gil, G.; Laube, G.; Natte, K.; Veh, R.W.; Österle, W.; Kneipp, J. Toxicity of Amorphous Silica Nanoparticles on Eukaryotic Cell Model Is Determined by Particle Agglomeration and Serum Protein Adsorption Effects. Anal. Bioanal. Chem. 2011, 400, 1367–1373. [Google Scholar] [CrossRef] [PubMed]
- Tedja, R.; Lim, M.; Amal, R.; Marquis, C. Effects of Serum Adsorption on Cellular Uptake Profile and Consequent Impact of Titanium Dioxide Nanoparticles on Human Lung Cell Lines. ACS Nano 2012, 6, 4083–4093. [Google Scholar] [CrossRef]
- Maruyama, K.; Haniu, H.; Saito, N.; Matsuda, Y.; Tsukahara, T.; Kobayashi, S.; Tanaka, M.; Aoki, K.; Takanashi, S.; Okamoto, M.; et al. Endocytosis of Multiwalled Carbon Nanotubes in Bronchial Epithelial and Mesothelial Cells. Biomed Res. Int. 2015, 2015. [Google Scholar] [CrossRef]
- Precupas, A.; Gheorghe, D.; Botea-Petcu, A.; Leonties, A.R.; Sandu, R.; Popa, V.T.; Mariussen, E.; Naouale, E.Y.; Rundén-Pran, E.; Dumit, V.; et al. Thermodynamic Parameters at Bio-Nano Interface and Nanomaterial Toxicity: A Case Study on BSA Interaction with ZnO, SiO2, and TiO2. Chem. Res. Toxicol. 2020, 33, 2054–2071. [Google Scholar] [CrossRef]
- Prasad, R.Y.; Wallace, K.; Daniel, K.M.; Tennant, A.H.; Zucker, R.M.; Strickland, J.; Dreher, K.; Kligerman, A.D.; Blackman, C.F.; Demarini, D.M. Effect of Treatment Media on the Agglomeration of Titanium Dioxide Nanoparticles: Impact on Genotoxicity, Cellular Interaction, and Cell Cycle. ACS Nano 2013, 7, 1929–1942. [Google Scholar] [CrossRef]
- Dusinska, M.; Boland, S.; Saunders, M.; Juillerat-Jeanneret, L.; Tran, L.; Pojana, G.; Marcomini, A.; Volkovova, K.; Tulinska, J.; Knudsen, L.E.; et al. Towards an Alternative Testing Strategy for Nanomaterials Used in Nanomedicine: Lessons from NanoTEST. Nanotoxicology 2015, 9 (Suppl. 1), 118–132. [Google Scholar] [CrossRef] [PubMed] [Green Version]
- Xi, W.; Li, J.; Liu, Y.; Wu, H.; Cao, A.; Wang, H. Cytotoxicity and Genotoxicity of Low-Dose Vanadium Dioxide Nanoparticles to Lung Cells Following Long-Term Exposure. Toxicology 2021, 459, 152859. [Google Scholar] [CrossRef] [PubMed]


| Nanomaterial | Details | References | ||||
|---|---|---|---|---|---|---|
| Type of Material | NM Code | Shape | Size | Aggregation (Size Range) | Other Information | |
| TiO2 | NM-101 | Spherical or ellipsoidal | 5 nm | 10–170 nm 95.2% up to 100 nm 77.3% up to 50 nm | Anatase form | [23] |
| TiO2 | NM-103 | Ellipsoidal | 20–100 nm | 40–400 nm 51.8% up to 100 nm 12.7% up to 50 nm | Rutile form | [23] |
| SiO2 | NM-200 | Spherical or ellipsoidal | 10–20 nm | 15–650 nm 88.7% up to 100 nm 69.8% up to 50 nm | Precipitated | [24] |
| Ag | NM-300K | Round, triangular or trapezium | <20 nm | Low risk a | [25] | |
| Ag | NM-302 | Rods | 100–200 nm (width) 5–10 µm (length) | Aggregates of 5–10 particles (most common) up to thousands of particles (size > 10 µm) (rare) | [26] | |
| Nanomaterials | Properties (Mean ± SD) | ||||
|---|---|---|---|---|---|
| Type of Material | NM Code | Concentration | Hydrodynamic Size [nm] | Polydispersity Index | Zeta-Potential [mV] |
| TiO2 | NM-101 | 2.56 mg/mL | 481.82 ± 16.40 | 0.35 ± 0.04 | n. m. |
| NM-103 | 2.56 mg/mL | 286.75 ± 21.69 | 0.36 ± 0.01 | n. m. | |
| SiO2 | NM-200 | 2.56 mg/mL | 214.07 ± 5.83 | 0.30 ± 0.03 | n. m. |
| Ag | NM-300K | 2.56 mg/mL | 75.66 ± 0.81 | 0.28 ± 0.01 | n. m. |
| NM-302 | 2.56 mg/ml | 451.07 ± 59.21 | 0.44 ± 0.11 | n. m. | |
| Nanomaterials | Properties | ||||||||||
|---|---|---|---|---|---|---|---|---|---|---|---|
| Type of Material | NM Code | Conc. | Hydrodynamic Size [nm] (Mean ± SD) | Polydispersity Index (Mean ± SD) | Zeta-Potential [mV] (Mean ± SD) | ||||||
| 0 h | 28 h | 48 h | 0 h | 28 h | 48h | 0 h | 28 h | 48 h | |||
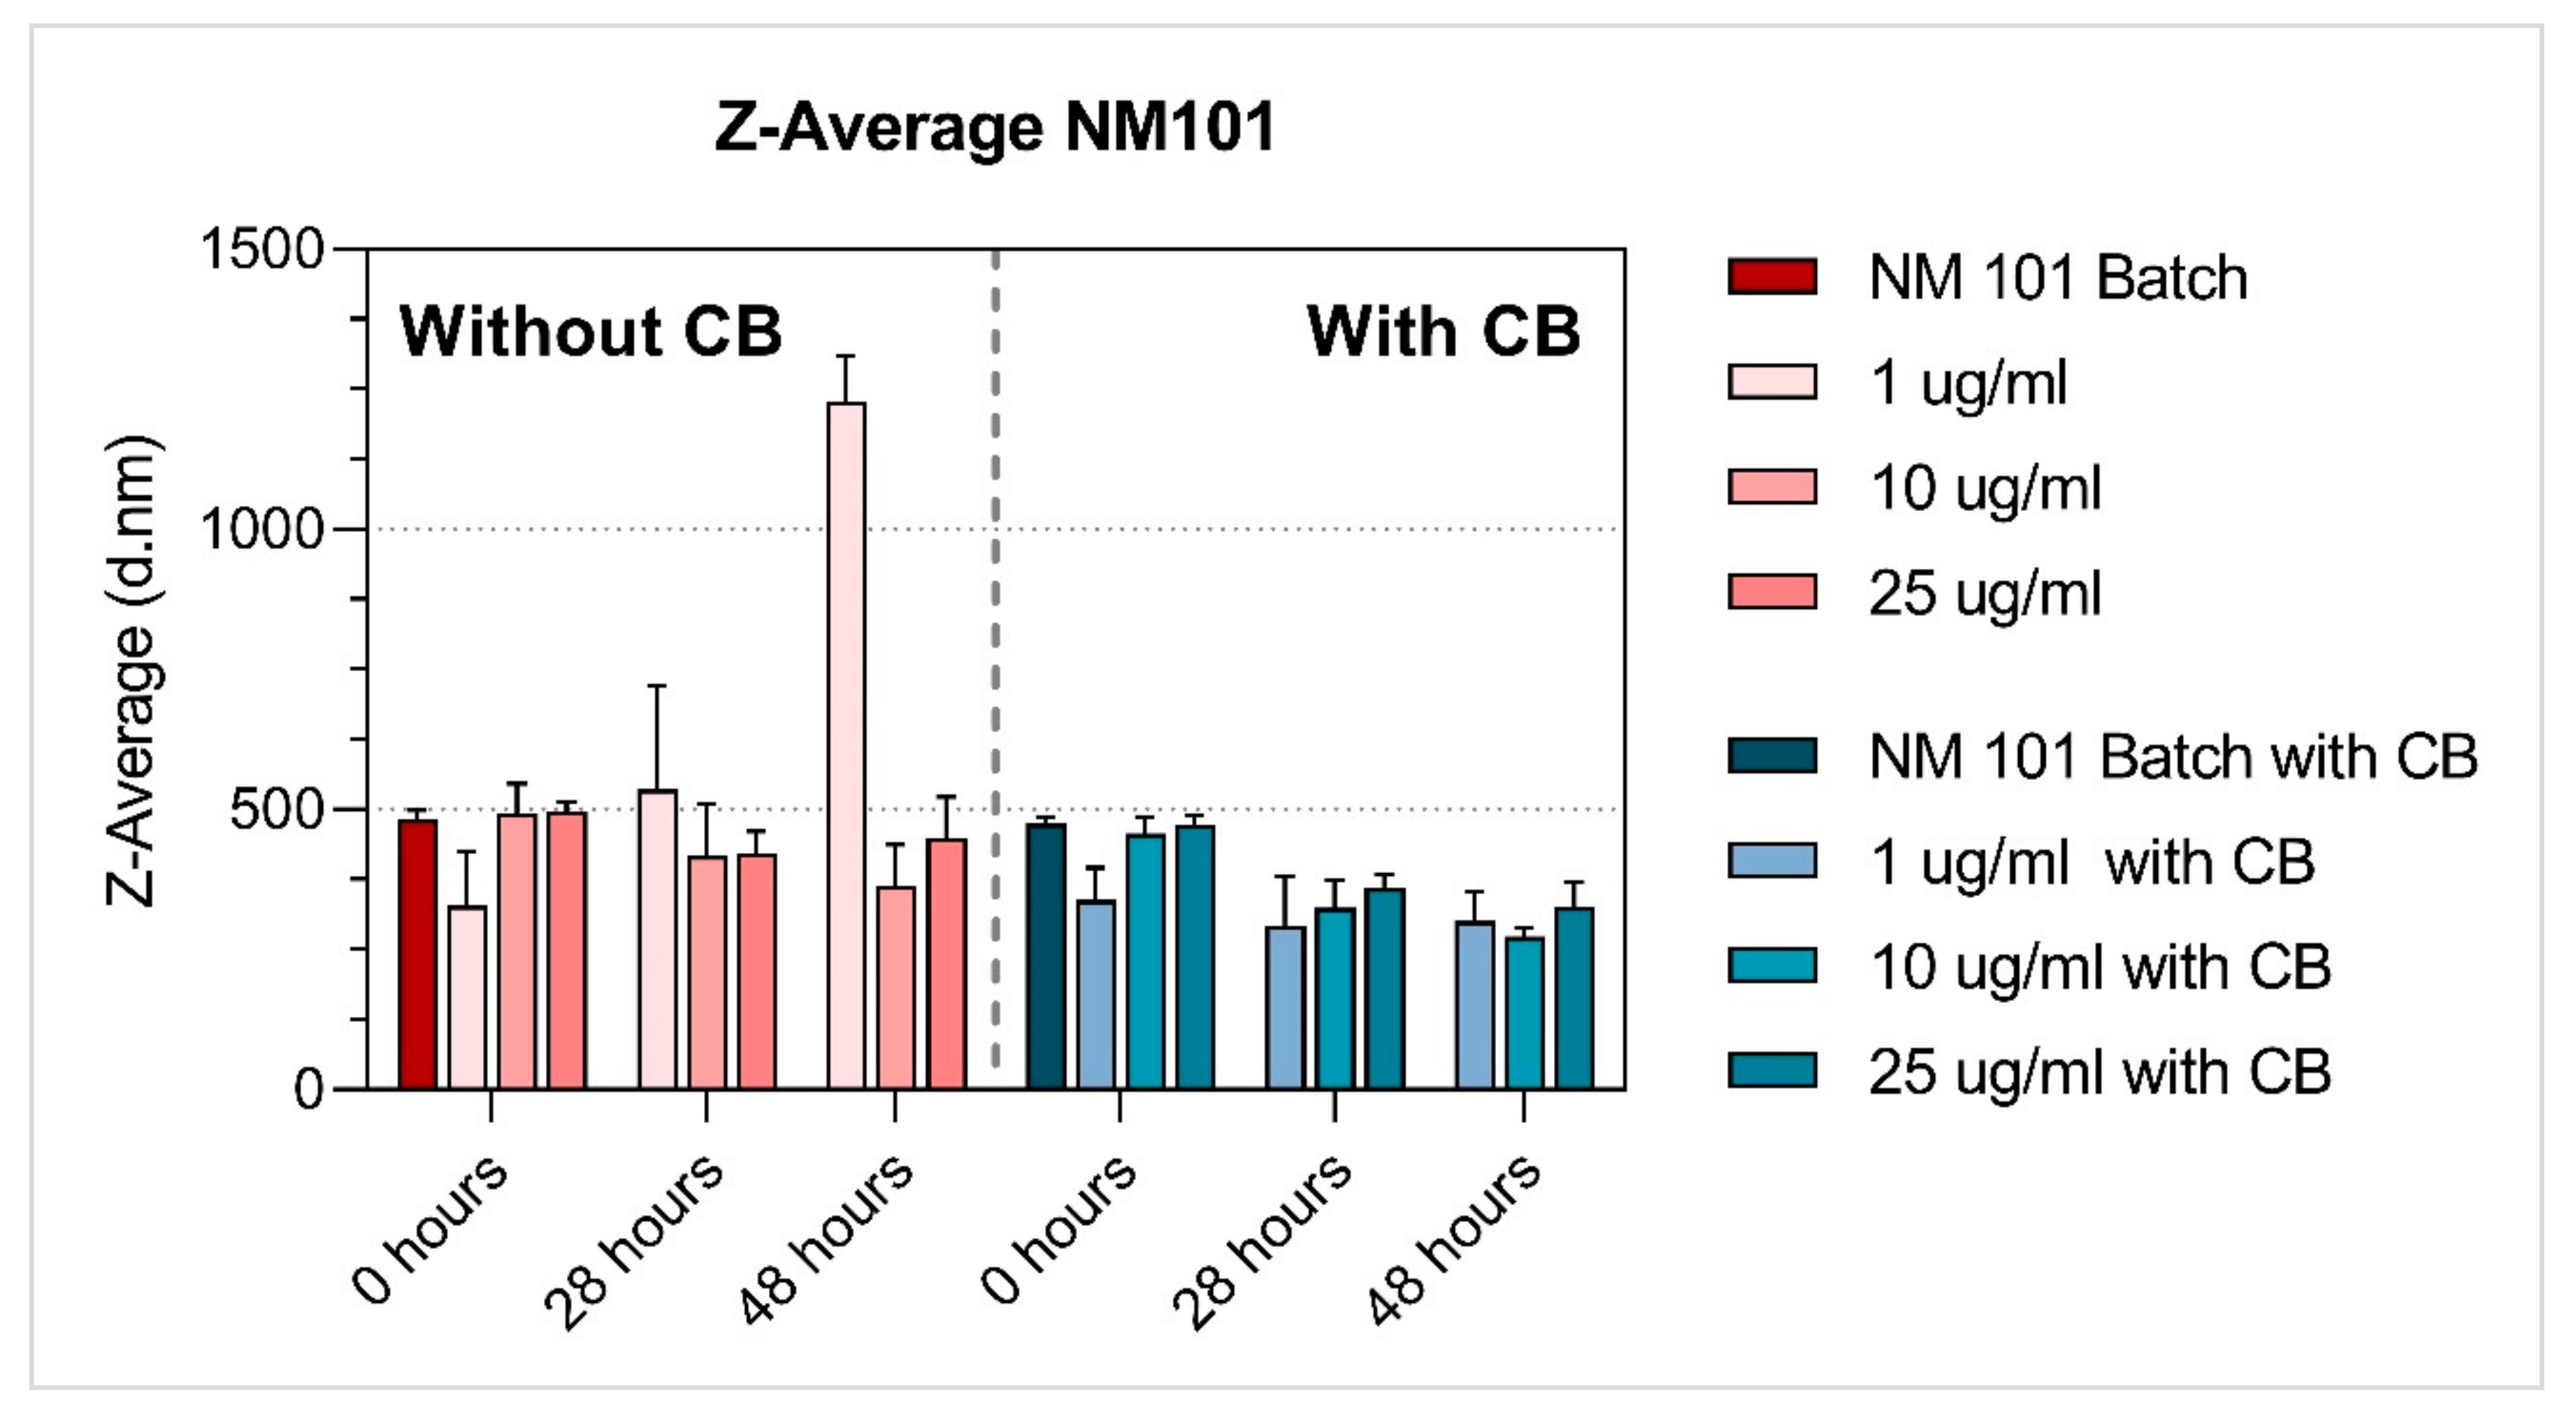
| TiO2 | NM-101 | 1 µg/mL | 328.08 ± 97.08 | 535.05 ± 185.24 | 1226.57 ± 83.31 | 0.46 ± 0.06 | 0.56 ± 0.12 | 0.36 ± 0.08 | −14.35 ± 0.66 | −14.89 ± 1.36 | −17.64 ± 0.81 |
| 10 µg/mL | 491.30 ± 54.83 | 417.43 ± 92.98 | 364.04 ± 72.42 | 0.37 ± 0.06 | 0.44 ± 0.06 | 0.46 ± 0.08 | −13.43 ± 0.92 | −12.35 ± 1.33 | −13.10 ± 0.87 | ||
| 25 µg/mL | 496.59 ± 17.11 | 422.23 ± 38.99 | 449.18 ± 72.40 | 0.35 ± 0.02 | 0.49 ± 0.05 | 0.50 ± 0.06 | −14.04 ± 1.48 | −12.98 ± 1.14 | −15.00 ± 1.63 | ||
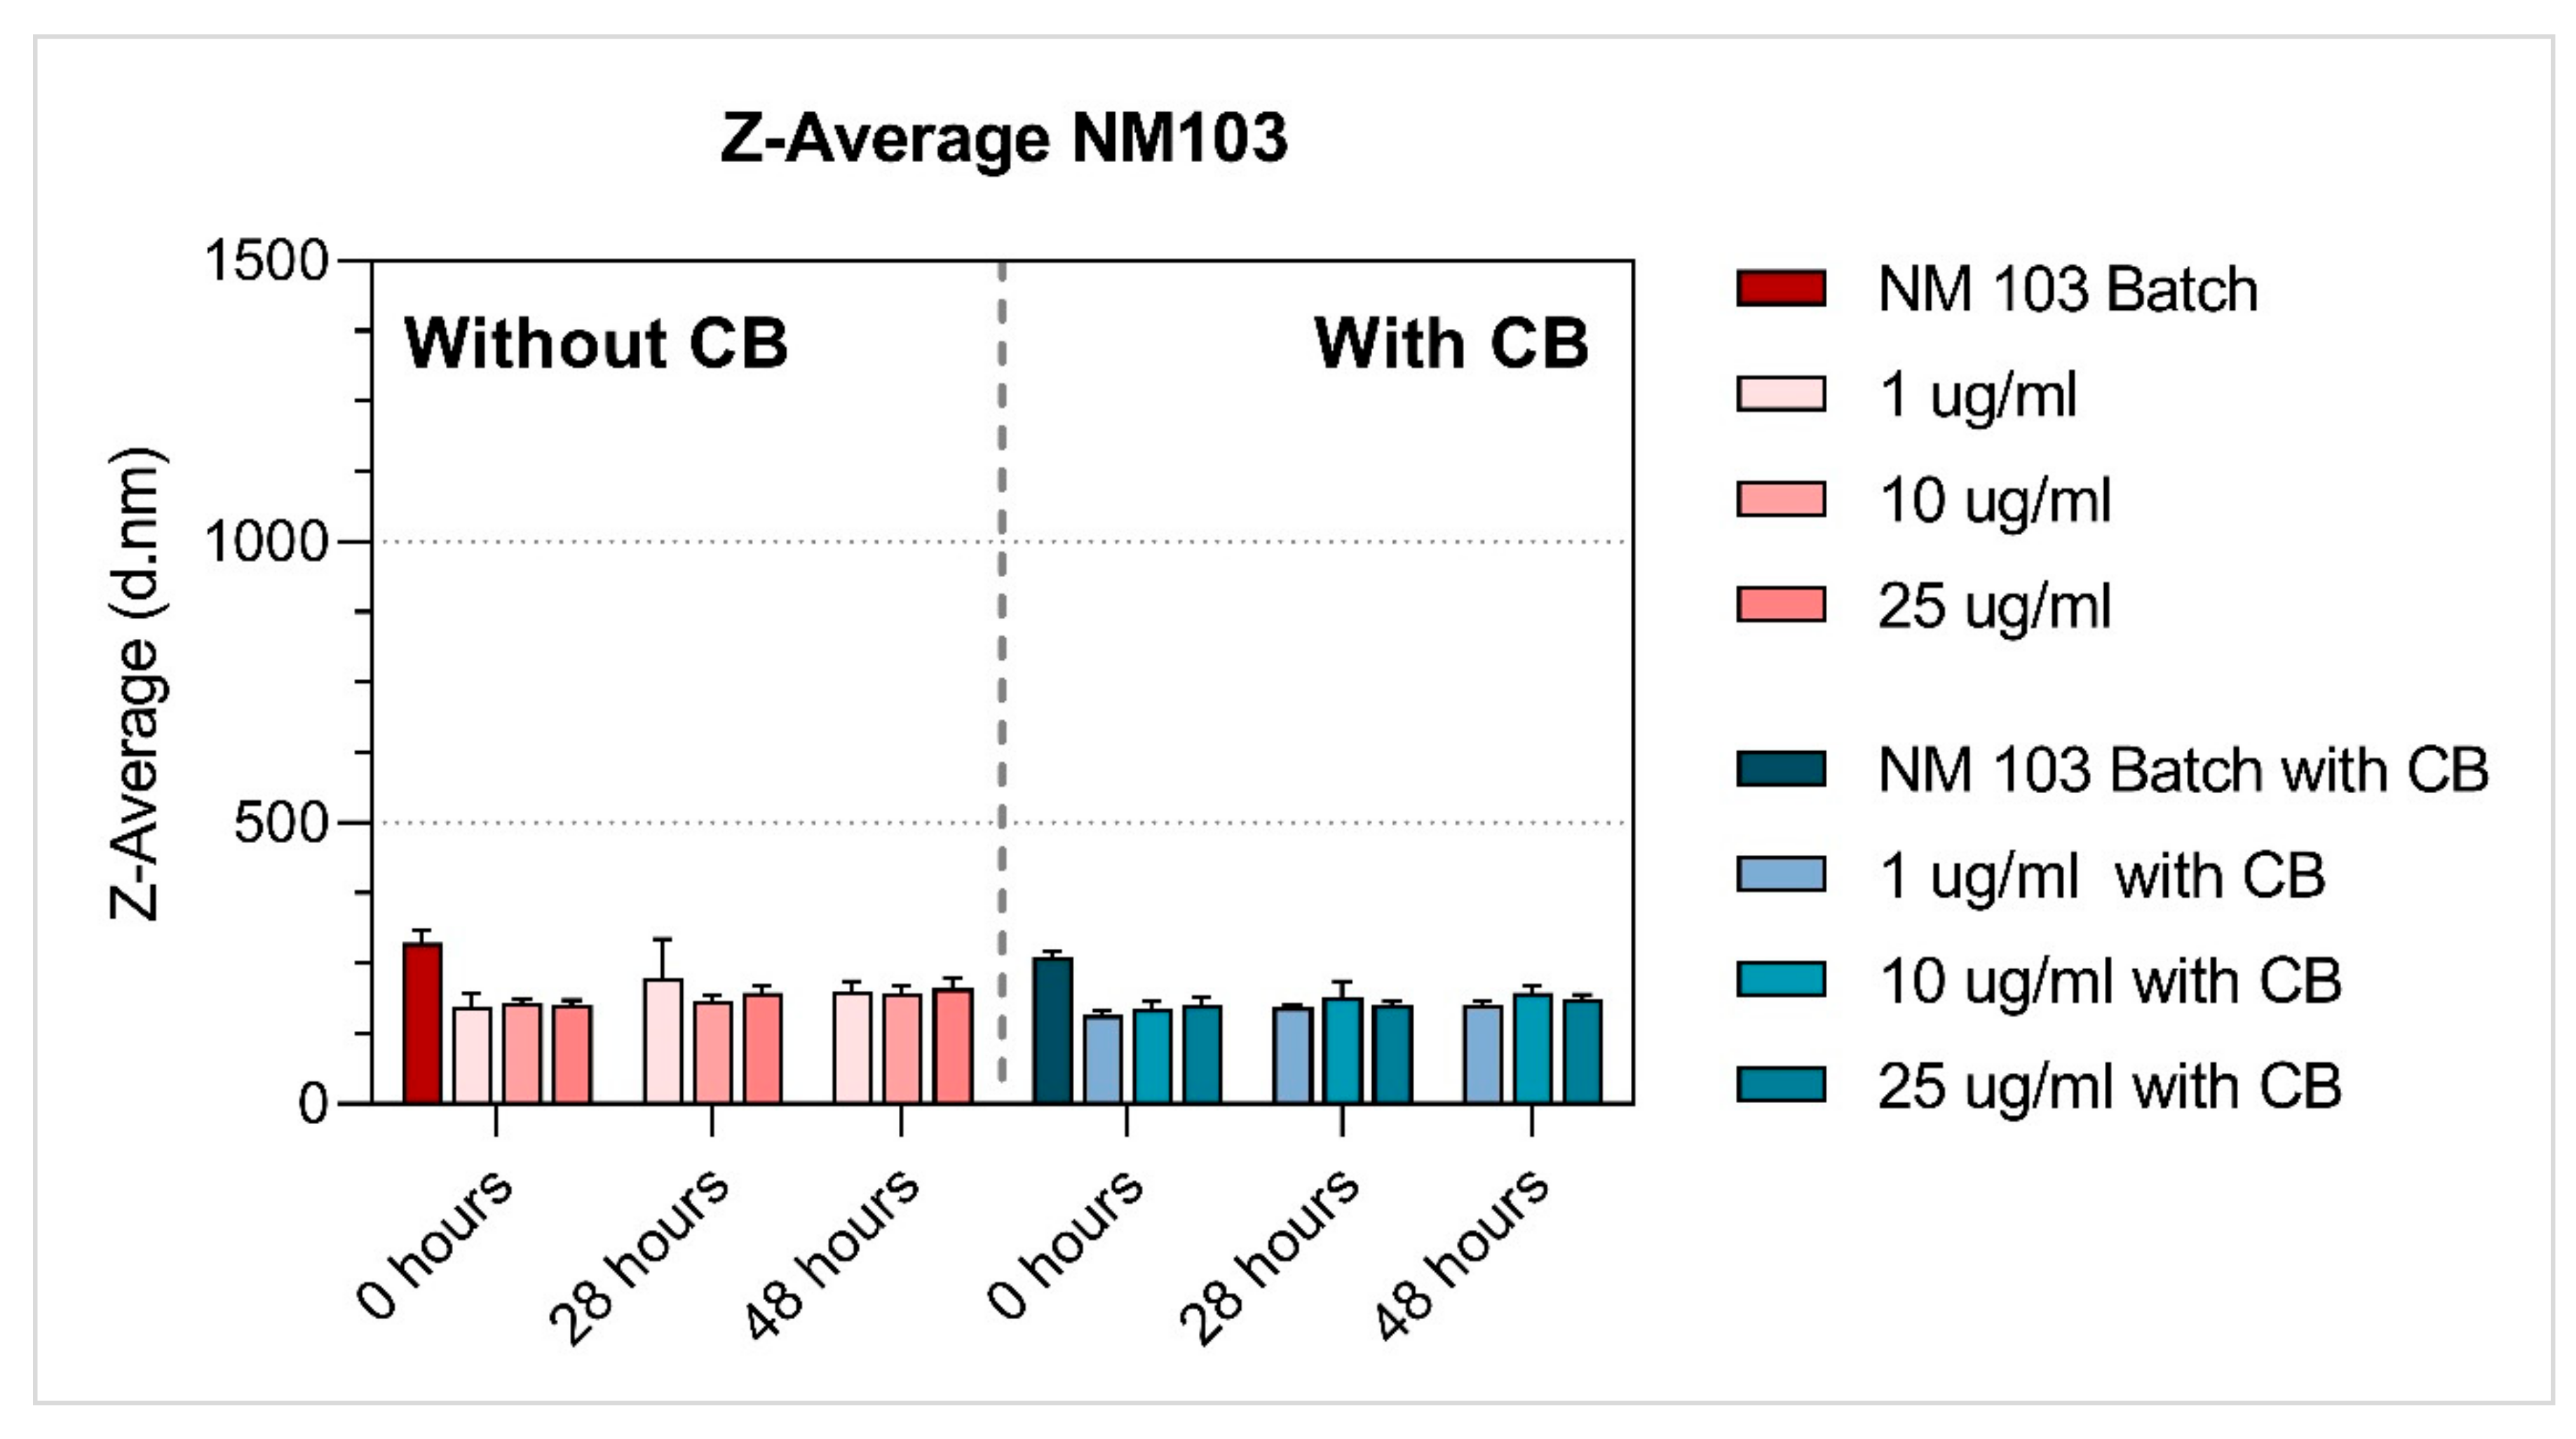
| TiO2 | NM-103 | 1 µg/mL | 173.38 ± 22.29 | 223.65 ± 69.07 | 201.06 ± 17.45 | 0.28 ± 0.08 | 0.26 ± 0.04 | 0.31 ± 0.06 | −11.71 ± 0.97 | −10.90 ± 1.16 | −11.17 ± 0.79 |
| 10 µg/mL | 179.03 ± 7.69 | 184.20 ± 8.92 | 196.69 ± 12.91 | 0.25 ± 0.04 | 0.20 ± 0.06 | 0.25 ± 0.09 | −11.65 ± 0.87 | −12.39 ± 1.38 | −12.70 ± 0.73 | ||
| 25 µg/mL | 176.80 ± 7.74 | 198.70 ± 10.20 | 203.22 ± 40.72 | 0.26 ± 0.04 | 0.26 ± 0.04 | 0.27 ± 0.05 | −13.21 ± 1.11 | −12.12 ± 0.73 | −13.51 ± 1.38 | ||
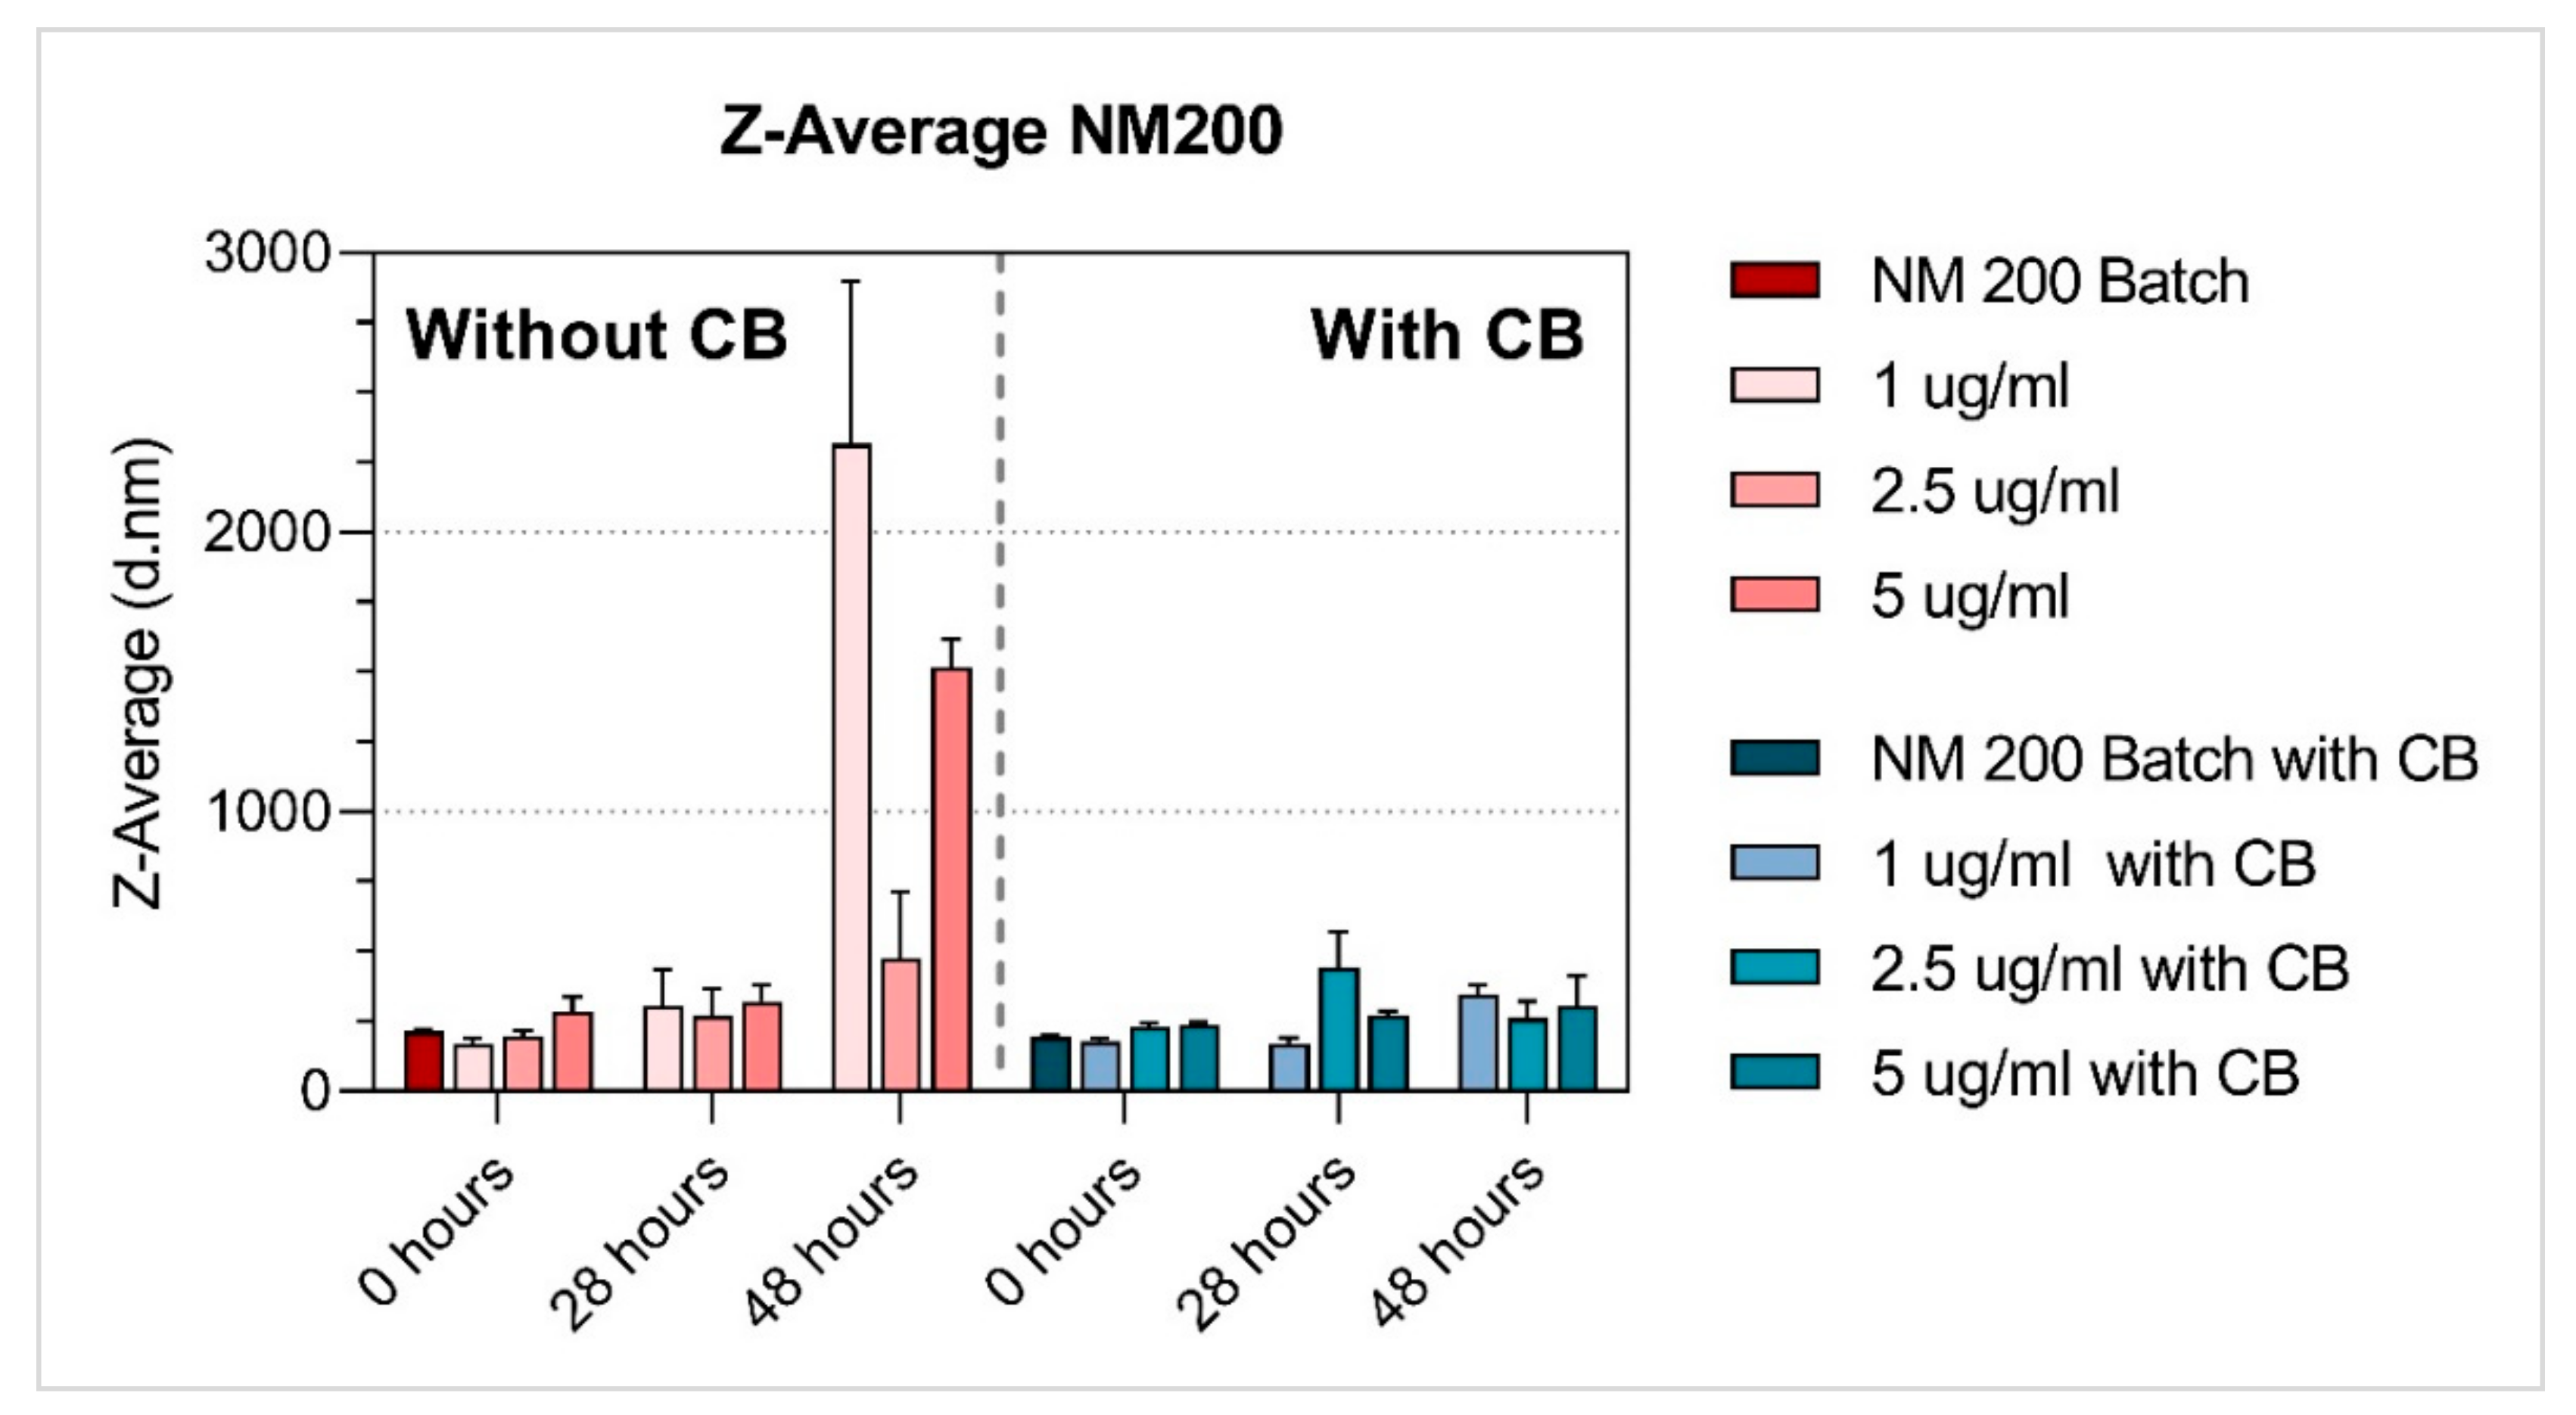
| SiO2 | NM-200 | 1 µg/mL | 169.12 ± 19.18 | 305.74 ± 131.54 | 2317.11 ± 581.67 | 0.47 ± 0.08 | 0.57 ± 0.09 | 0.97 ± 0.06 a | −11.59 ± 1.27 | −18.76 ± 2.31 | −14.85 ± 1.56 |
| 2.5 µg/mL | 196.97 ± 18.18 | 269.07 ± 97.76 | 473.70 ± 238.19 | 0.44 ± 0.03 | 0.61 ± 0.11 a | 0.59 ± 0.08 | −12.32 ± 1.32 | −13.54 ± 1.65 | −10.99 ± 2.75 | ||
| 5 µg/mL | 214.07 ± 5.83 | 321.40 ± 59.21 | 1518.18 ± 98.06 | 0.03 ± 0.03 | 0.55 ± 0.12 | 0.65 ± 0.09 a | −12.98 ± 1.31 | −12.95 ± 1.76 | −12.87 ± 1.23 | ||
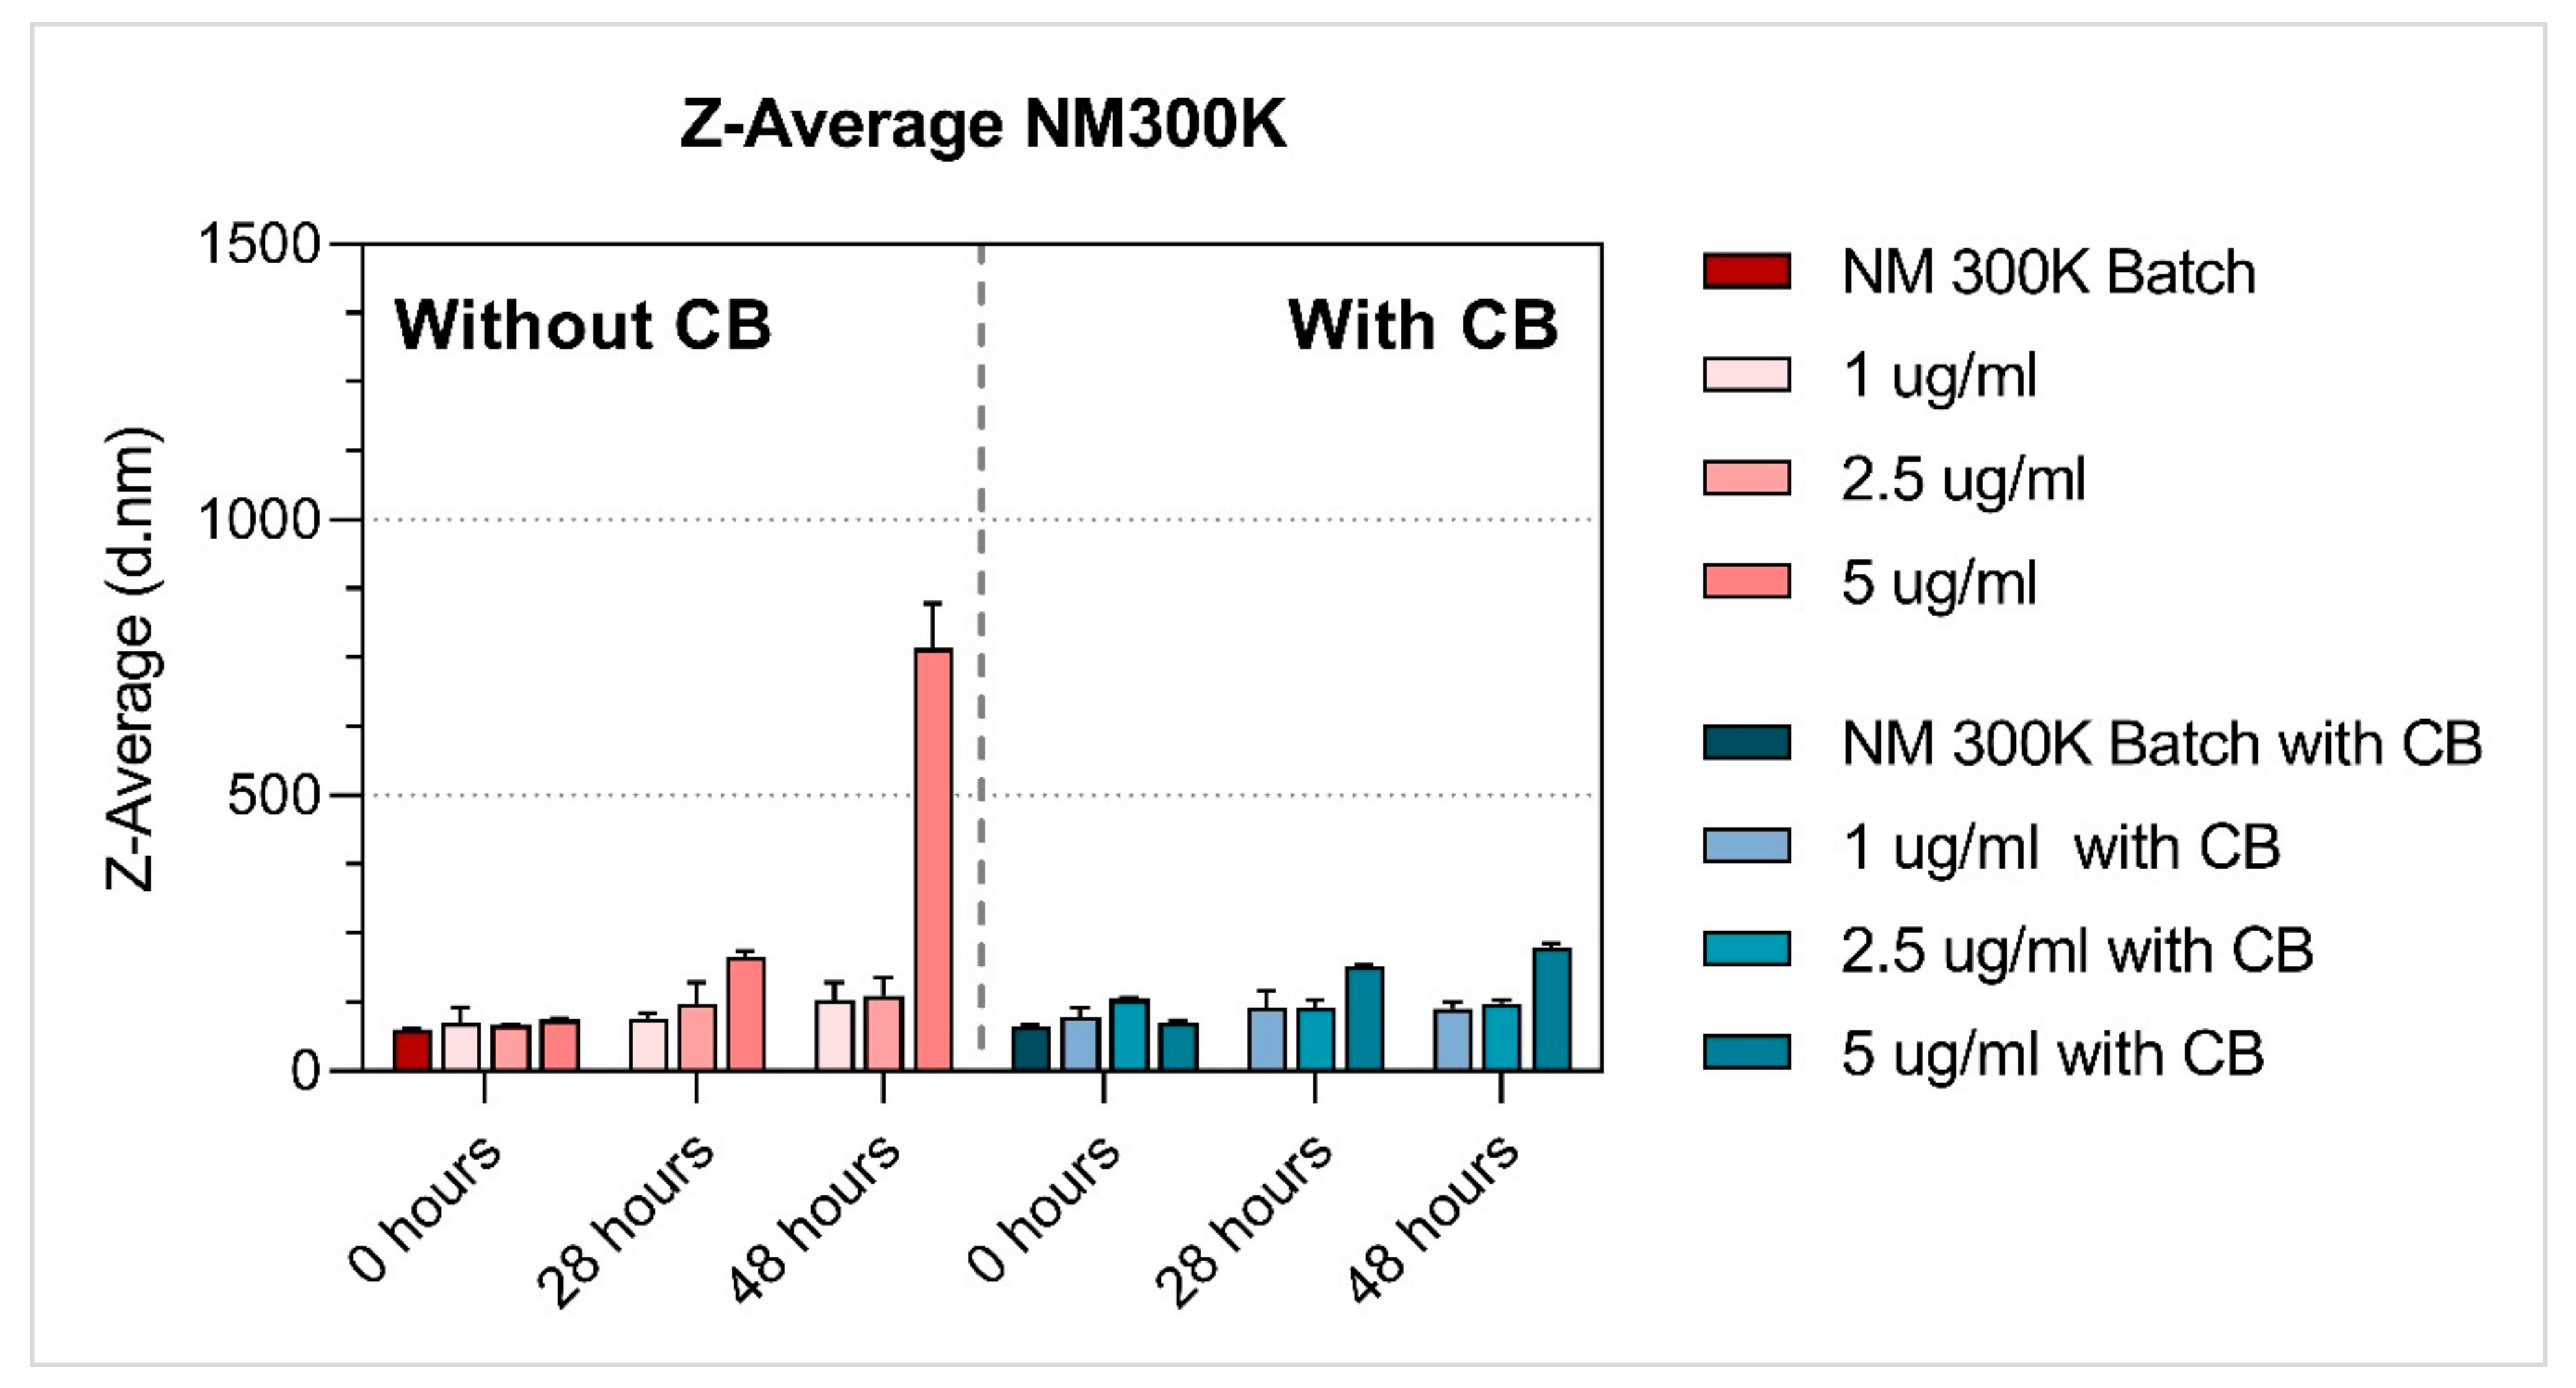
| Ag | NM-300K | 1 µg/mL | 87.35 ± 28.13 | 95.78 ± 8.49 | 128.97 ± 31.27 | 0.37 ± 0.07 | 0.33 ± 0.07 | 0.46 ± 0.06 | −12.43 ± 1.46 | −12.29 ± 1.54 | −13.71 ± 1.99 |
| 2.5 µg/mL | 83.38 ± 1.44 | 121.82 ± 38.25 | 137.31 ± 31.75 | 0.31 ± 0.03 | 0.31 ± 0.07 | 0.45 ± 0.08 | −12.70 ± 1.34 | −13.08 ± 1.59 | −13.80 ± 2.16 | ||
| 5 µg/mL | 92.86 ± 2.51 | 208.28 ± 10.34 | 767.25 ± 81.01 | 0.28 ± 0.03 | 0.42 ± 0.02 | 0.66 ± 0.12 a | −11.56 ± 1.07 | −12.78 ± 1.53 | −21.11 ± 1.64 | ||
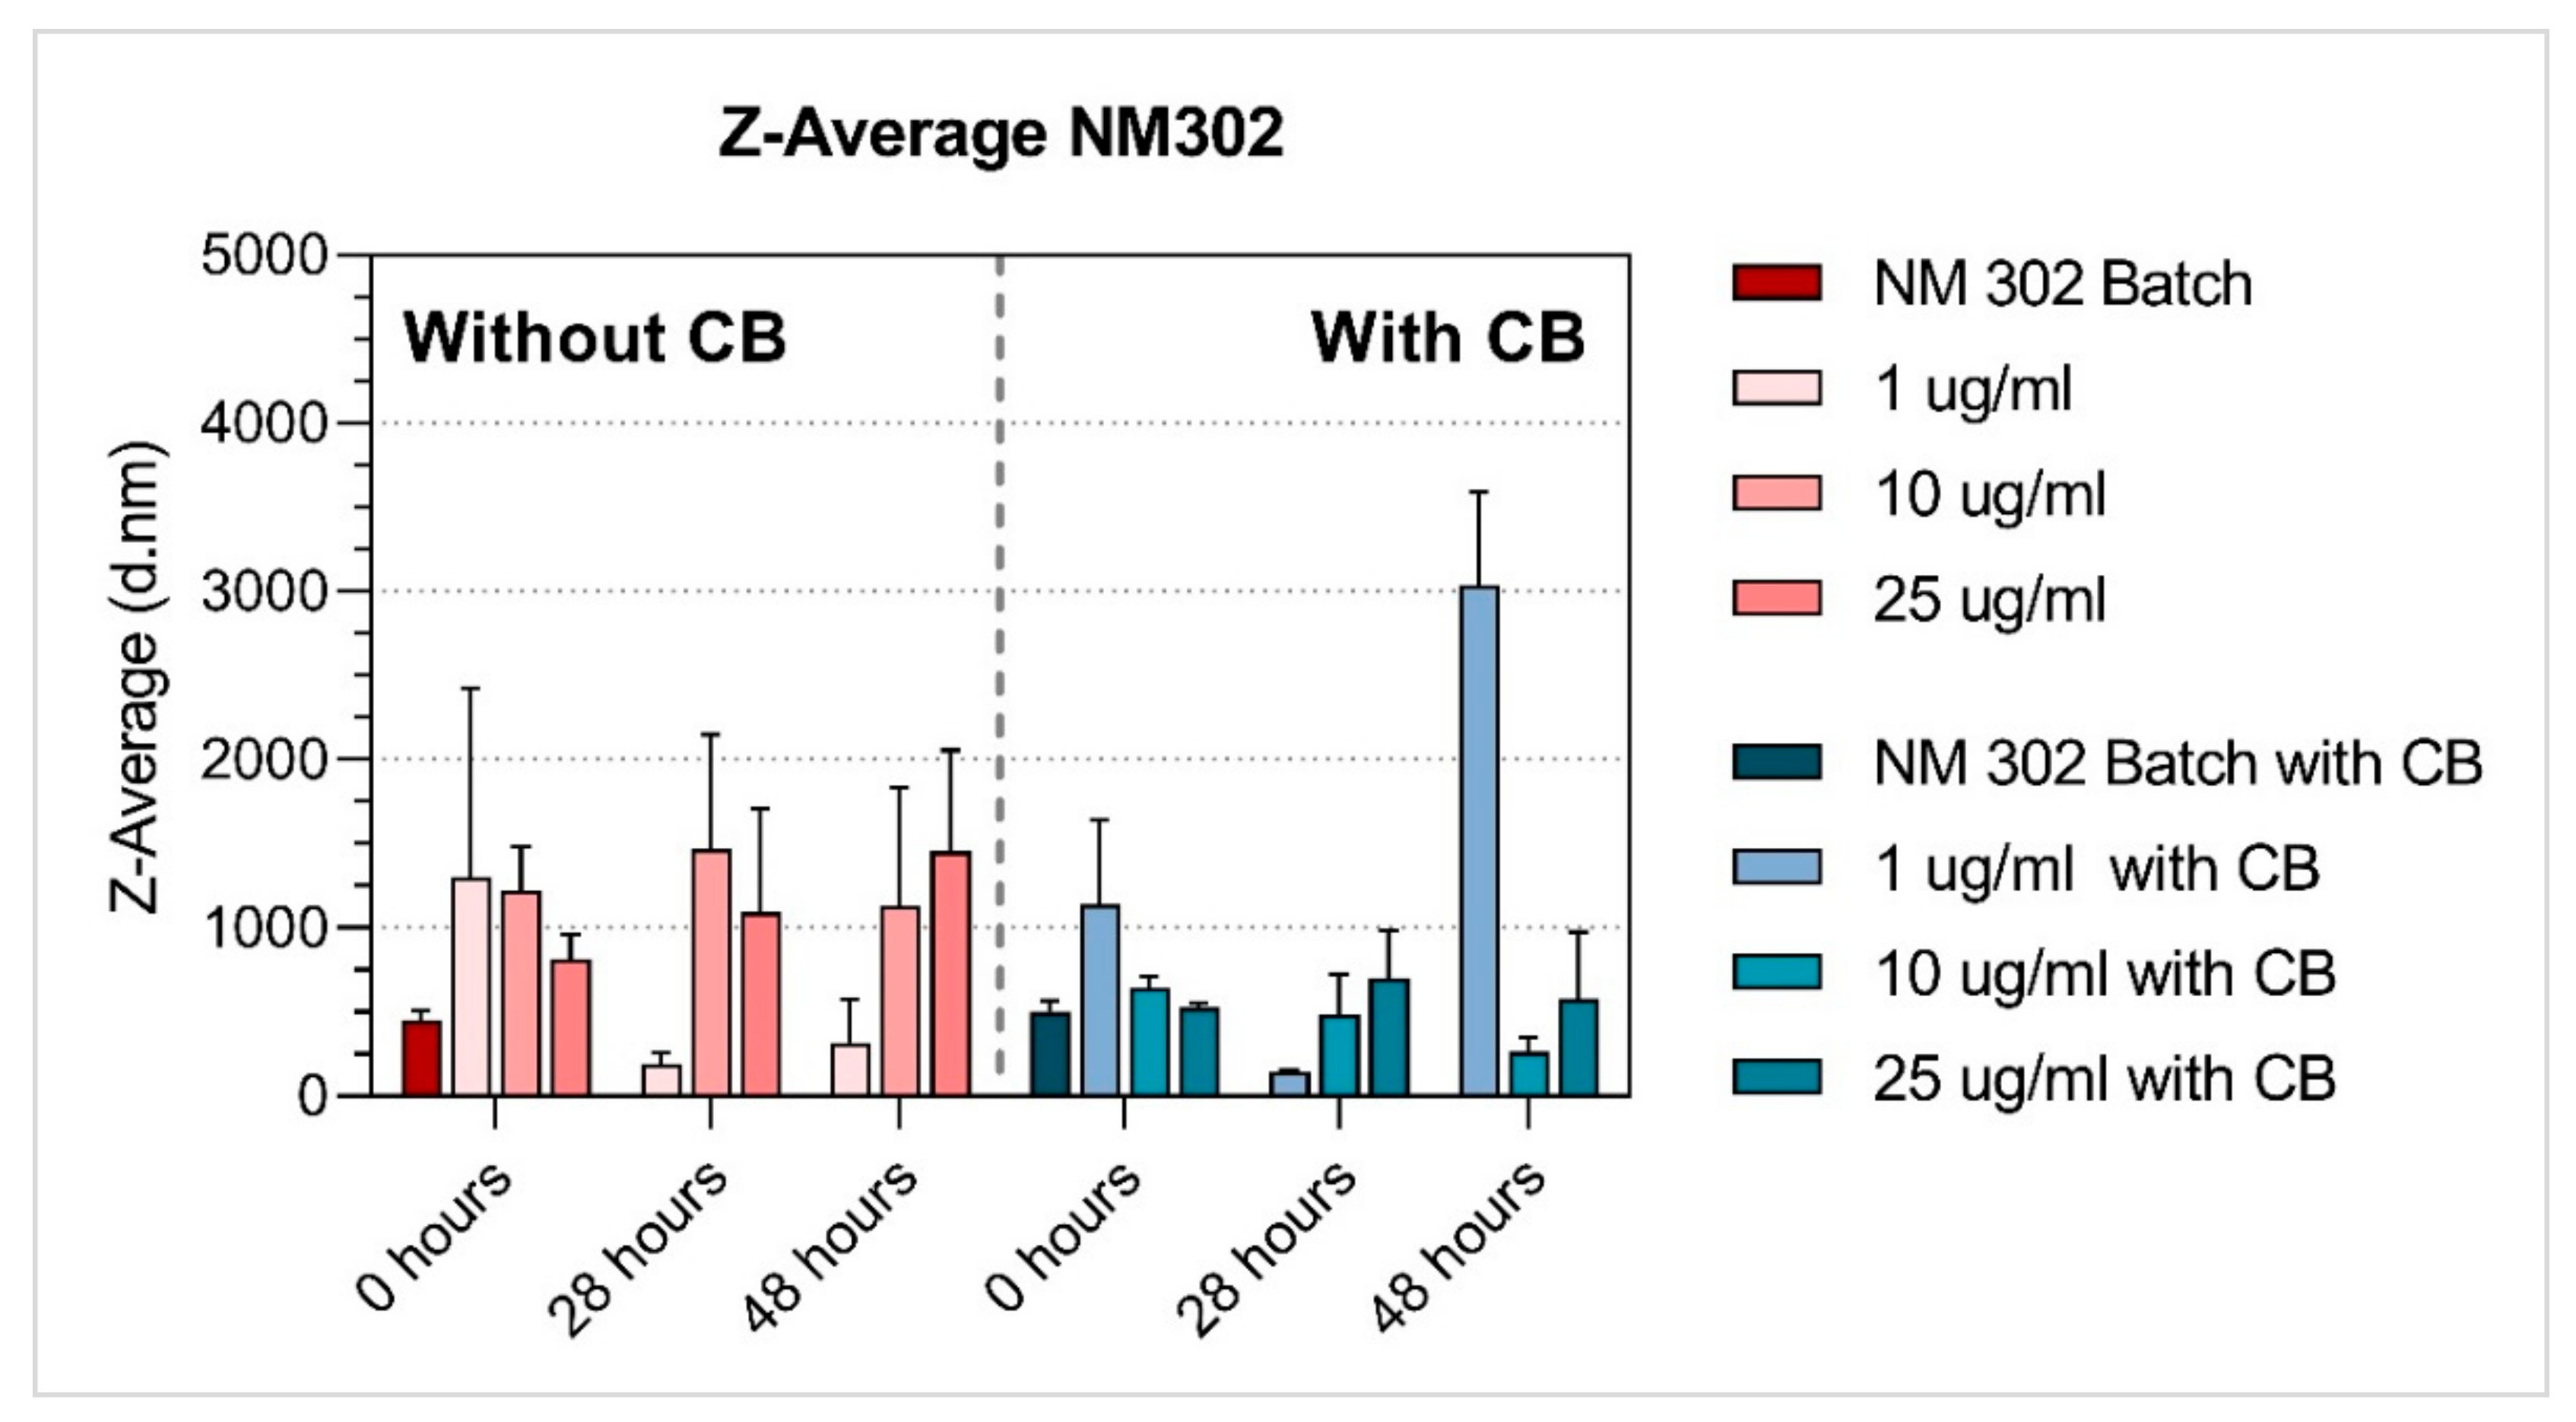
| Ag | NM-302 | 1 µg/mL | 1305.16 ± 1118.92 | 191.39 ± 66.06 | 317.95 ± 259.75 | 0.78 ± 0.25 a | 0.53 ± 0.11 | 0.60 ± 0.18 a | −14.20 ± 1.57 | −13.07 ± 1.77 | −13.31 ± 1.70 |
| 10 µg/mL | 1224.80 ± 261.61 | 1469.97 ± 679.78 | 1130.63 ± 702.44 | 0.85 ± 0.14 a | 0.95 ± 0.09 a | 0.79 ± 0.24 a | −12.81 ± 0.86 | −13.75 ± 1.15 | −12.83 ± 1.13 | ||
| 25 µg/mL | 816.42 ± 148.07 | 1094.03 ± 611.9 | 1456.28 ± 599.52 | 0.70 ± 0.09 a | 0.83 ± 0.16 a | 0.88 ± 0.12 a | −15.05 ± 1.50 | −13.97 ± 1.04 | −14.18 ± 1.80 | ||
| Nanomaterials | Properties | ||||||||||
|---|---|---|---|---|---|---|---|---|---|---|---|
| Type of Material | NM Code | Conc. | Hydrodynamic Size [nm] (mean ± SD) | Polydispersity Index (mean ± SD) | Zeta-Potential [mV] (mean ± SD) | ||||||
| 0 h | 28 h | 48h | 0 h | 28 h | 48h | 0 h | 28 h | 48 h | |||
| TiO2 | NM-101 | 1 µg/mL | 338.52 ± 57.40 | 292.89 ± 87.35 | 301.13 ± 52.18 | 0.48 ± 0.06 | 0.43 ± 0.06 | 0.49 ± 0.08 | −13.80 ± 1.32 | −13.34 ± 1.11 | −14.15 ± 1.78 |
| 10 µg/mL | 457.29 ± 29.64 | 324.67 ± 48.30 | 272.77 ± 15.09 | 0.35 ± 0.03 | 0.332 ± 0.07 | 0.29 ± 0.06 | −12.03 ± 0.84 | −12.02 ± 1.06 | −13.86 ± 1.21 | ||
| 25 µg/mL | 472.23 ± 15.35 | 359.9 ± 2298 | 327.09 ± 42.38 | 0.29 ± 0.03 | 0.32 ± 0.05 | 0.36 ± 0.07 | −13.18 ± 1.42 | −13.49 ± 1.26 | −13.55 ± 0.53 | ||
| TiO2 | NM-103 | 1 µg/mL | 157.78 ± 9.13 | 171.43 ± 5.80 | 176.11 ± 6.40 | 0.25 ± 0.05 | 0.22 ± 0.02 | 0.21 ± 0.03 | −12.13 ± 1.31 | −11.74 ± 1.14 | −12.62 ± 0.98 |
| 10 µg/mL | 170.34 ± 11.03 | 190.71 ± 27.24 | 198.16 ± 10.98 | 0.24 ± 0.02 | 0.22 ± 0.07 | 0.25 ± 0.05 | −13.55 ± 0.91 | −12.69 ± 1.06 | −14.44 ± 1.09 | ||
| 25 µg/mL | 176.98 ± 12.53 | 177.29 ± 4.37 | 187.26 ± 7.08 | 0.27 ± 0.04 | 0.20 ± 0.04 | 0.22 ± 0.05 | −12.83 ± 1.34 | −13.29 ± 0.71 | −13.41 ± 1.68 | ||
| SiO2 | NM-200 | 1 µg/mL | 179.87 ± 9.75 | 171.54 ± 20.58 | 345.68 ± 33.06 | 0.48 ± 0.03 | 0.48 ± 0.13 | 0.61 ± 0.15 a | −12.13 ± 1.66 | −11.67 ± 0.80 | −12.69 ± 1.84 |
| 2.5 µg/mL | 228.86 ± 15.24 | 443.91 ± 128.20 | 261.11 ± 60.00 | 0.45 ± 0.04 | 0.61 ± 0.13 a | 0.52 ± 0.07 | −12.19 ± 1.62 | −12.59 ± 1.07 | −11.44 ± 1.01 | ||
| 5 µg/mL | 239.98 ± 7.19 | 271.98 ± 13.32 | 306.87 ± 103.28 | 0.39 ± 0.03 | 0.53 ± 0.08 | 0.49 ± 0.08 | −11.33 ± 0.86 | −12.42 ± 1.36 | −11.64 ± 1.07 | ||
| Ag | NM-300K | 1 µg/mL | 98.03 ± 16.15 | 115.68 ± 29.75 | 112.68 ± 11.32 | 0.31 ± 0.08 | 0.33 ± 0.05 | 0.33 ± 0.06 | −12.34 ± 1.04 | −9.54 ± 1.08 | −10.39 ± 1.27 |
| 2.5 µg/mL | 130.07 ± 3.38 | 115.33 ± 12.71 | 122.95 ± 4.81 | 0.45 ± 0.04 | 0.29 ± 0.05 | 0.30 ± 0.04 | −11.67 ± 1.48 | −11.36 ± 1.23 | −10.66 ± 1.53 | ||
| 5 µg/mL | 88.23 ± 3.68 | 188.85 ± 3.75 | 223.93 ± 8.09 | 0.30 ± 0.05 | 0.26 ± 0.01 | 0.38 ± 0.01 | −13.05 ± 1.07 | −11.65 ± 0.93 | −9.94 ± 1.25 | ||
| Ag | NM-302 | 1 µg/mL | 1139.19 ± 500.85 | 142.20 ± 9.56 | 3038.32 ± 551.73 | 0.84 ± 0.13 a | 0.47 ± 0.08 | 0.81 ± 0.09 a | −14.18 ± 0.99 | −12.70 ± 0.90 | −11.92 ± 0.88 |
| 10 µg/mL | 649.89 ± 63.78 | 485.20 ± 241.45 | 266.27 ± 81.81 | 0.63 ± 0.07 | 0.68 ± 0.11 a | 0.54 ± 0.13 | −14.07 ± 0.84 | −14.83 ± 1.37 | −14.08 ± 0.80 | ||
| 25 µg/mL | 527.47 ± 26.76 | 704.09 ± 280.04 | 580.01 ± 398.89 | 0.47 ± 0.03 | 0.68 ± 0.13 a | 0.59 ± 0.2 1a | −14.03 ± 1.08 | −15.01 ± 1.54 | −14.71 ± 1.57 | ||
Publisher’s Note: MDPI stays neutral with regard to jurisdictional claims in published maps and institutional affiliations. |
© 2021 by the authors. Licensee MDPI, Basel, Switzerland. This article is an open access article distributed under the terms and conditions of the Creative Commons Attribution (CC BY) license (https://creativecommons.org/licenses/by/4.0/).
Share and Cite
Cervena, T.; Rossnerova, A.; Zavodna, T.; Sikorova, J.; Vrbova, K.; Milcova, A.; Topinka, J.; Rossner, P., Jr. Testing Strategies of the In Vitro Micronucleus Assay for the Genotoxicity Assessment of Nanomaterials in BEAS-2B Cells. Nanomaterials 2021, 11, 1929. https://doi.org/10.3390/nano11081929
Cervena T, Rossnerova A, Zavodna T, Sikorova J, Vrbova K, Milcova A, Topinka J, Rossner P Jr. Testing Strategies of the In Vitro Micronucleus Assay for the Genotoxicity Assessment of Nanomaterials in BEAS-2B Cells. Nanomaterials. 2021; 11(8):1929. https://doi.org/10.3390/nano11081929
Chicago/Turabian StyleCervena, Tereza, Andrea Rossnerova, Tana Zavodna, Jitka Sikorova, Kristyna Vrbova, Alena Milcova, Jan Topinka, and Pavel Rossner, Jr. 2021. "Testing Strategies of the In Vitro Micronucleus Assay for the Genotoxicity Assessment of Nanomaterials in BEAS-2B Cells" Nanomaterials 11, no. 8: 1929. https://doi.org/10.3390/nano11081929