
Pitfalls of Mitochondrial Redox Signaling Research

Department of Mitochondrial Physiology, No. 75, Institute of Physiology of the Czech Academy of Sciences, Vídeňská 1083, 14220 Prague, Czech Republic
Antioxidants 2023, 12(9), 1696; https://doi.org/10.3390/antiox12091696
Submission received: 4 August 2023
/
Revised: 27 August 2023
/
Accepted: 29 August 2023
/
Published: 31 August 2023
(This article belongs to the Special Issue Mitochondrial Management of ROS in Physiological and Pathological Conditions)
Abstract
:Redox signaling from mitochondria (mt) to the cytosol and plasma membrane (PM) has been scarcely reported, such as in the case of hypoxic cell adaptation or (2-oxo-) 2-keto-isocaproate (KIC) β-like-oxidation stimulating insulin secretion in pancreatic β-cells. Mutual redox state influence between mitochondrial major compartments, the matrix and the intracristal space, and the cytosol is therefore derived theoretically in this article to predict possible conditions, when mt-to-cytosol and mt-to-PM signals may occur, as well as conditions in which the cytosolic redox signaling is not overwhelmed by the mitochondrial antioxidant capacity. Possible peroxiredoxin 3 participation in mt-to-cytosol redox signaling is discussed, as well as another specific case, whereby mitochondrial superoxide release is diminished, whereas the matrix MnSOD is activated. As a result, the enhanced conversion to H2O2 allows H2O2 diffusion into the cytosol, where it could be a predominant component of the H2O2 release. In both of these ways, mt-to-cytosol and mt-to-PM signals may be realized. Finally, the use of redox-sensitive probes is discussed, which disturb redox equilibria, and hence add a surplus redox-buffering to the compartment, where they are localized. Specifically, when attempts to quantify net H2O2 fluxes are to be made, this should be taken into account.
1. Introduction
Redox homeostasis in mitochondrial (mt) compartments is interrelated with redox homeostasis in cytosol and plasma membrane (PM). In many cell types, specifically, where mitochondrial volume accounts for a large fraction of the cell volume, the mitochondrial formation of superoxide and downstream reactive oxygen species (ROS) significantly contributes to the overall cell ROS sources and the established redox state. Balance between pro-oxidant and antioxidant processes determines the redox state within the particular cell compartments and/or organelles. When such balance is shifted so that ROS sources prevail or antioxidant mechanisms are diminished, oxidative stress arises above a certain threshold, distinct in different cell types. However, below such oxidative stress thresholds, transient increases in ROS exist, typically H2O2 elevations, that represent redox signaling. Redox signals can act within the same single compartment or between distinct compartments. In this review article, the acute redox signaling from mitochondria to the cytosol is discussed, i.e., within a time frame of minutes or when only post-translational modifications may be effective, but not transcriptome reprogramming. The validated examples are reviewed, and theoretical relations are predicted. A specific case is pointed out, when directions of redox/oxidation state have opposite trends, i.e., when the matrix superoxide release diminishes, whereas the cytosolic H2O2 release is elevated. Long-term redox regulations are not discussed.
It should be stated that reports of acute redox signaling from mitochondria are rather scarce. The reader can also refer to excellent reviews published elsewhere [1,2,3,4]. One of the validated cases of redox signals from mitochondria is concerned with the initiation of hypoxia-induced factor- (HIF)-mediated transcriptome reprogramming [5,6]. Other redox-sensitive gene-regulatory processes, spanning various time scales, have also been reported, such as in progression through the S-phase of the cell cycle [7] and the regulation of quiescence, activation, proliferation, and differentiation of stem cells [8]. A class of mt redox burst processes arises from the succinate accumulation and its sudden subsequent termination leading to the reverse electron transfer (RET) and very intensive ROS bursts (pathological, upon hypoxia/reoxygenation, i.e., ischemia/reperfusion [9]) or less-intensive ROS bursts, representing physiological redox signaling [10,11].
2. Pancreatic β-Cells as Exemplar Milieu for Mitochondrial and Cytosolic Redox Signals
Studying pancreatic β-cells [12,13,14,15,16,17,18,19,20,21], we have encountered situations upon the glucose-stimulated insulin secretion (GSIS) [18,19] and fatty acid- (FA)-stimulated insulin secretion (FASIS) [12,22], whereby a distinct direction of pro-oxidant vs. more reduced states occur in cytosolic vs. mitochondrial matrix compartments (Figure 1). For both, upon GSIS and FASIS, the cytosolic compartments became more oxidized via H2O2 release, whereas the mt matrix superoxide release was indicated to decline [12,13,14,18,19,22,23].
2.1. Distinct Redox States of Mitochondrial vs. Cytosolic Compartments
2.1.1. Distinct Redox States of Mitochondrial vs. Cytosolic Compartments upon GSIS
Upon GSIS, the increased H2O2 release due to the elevated function of NADPH-oxidase 4 (NOX4) is essential for the subsequent exocytosis of insulin granule vesicles (IGVs) [18,21], while such a cytosolic redox signal co-induces the closure of the ATP-sensitive K+ channels (KATP) on the plasma membrane together with the elevated ATP [13,14,18]. Thus, in pancreatic β-cells, the KATP closure with the aid of other non-specific calcium channels (NSCCs, such as TRMP2 channels, [17]) or Cl− channels allows plasma membrane depolarization to the −50 mV threshold [15], allowing subsequent intermittent opening of Ca2+ channels together with counteracting voltage-dependent K+ channels. The resulting intermittent Ca2+ entry into the cytosol, detectable as cytosolic Ca2+ oscillations, stimulates pulsatile IGV exocytosis [13,14,15,16] (Figure 1).
Nevertheless, in the mitochondrial matrix, the opposite redox changes occur upon GSIS [19]. Due to the induction of the operation of several redox shuttles [16,19], less NADH is produced within the mt matrix, which leads to lowering mt substrate pressure (NADHmt/NAD+mt) onto the respiratory chain (RC) Complex I flavin site of superoxide formation (IF) and hence less superoxide is formed. As a result, less H2O2 is released into the mitochondrial matrix [19,23].
Among the redox shuttles verified via several reports [16,19], a pyruvate–malate shuttle is enabled via the pyruvate carboxylase (PC) reaction bypassing the regular pyruvate dehydrogenase- (PDH)-mediated entry into the Krebs cycle, while allowing the reverse reaction of the mt matrix malate dehydrogenase (MDH2), consuming NADH instead of making it. Subsequent malate export from the mt matrix benefits the cytosolic malic enzyme (ME1) which transfers malate into the pyruvate, yielding NADPH instead [19]. Notably, such additional NADPH feeds NOX4, together with the two enzymes of the pentose phosphate pathway (PPP), producing NADPH, i.e., glucose-6-phosphate dehydrogenase and 6-phosphogluconate dehydrogenase [13,14]. Metabolomics studies have determined that up to 10% of glucose flux is diverted to PPP and hence H2O2 formation via NOX4 [24]. The pyruvate–malate shuttle then represents an additional source of NADPH for NOX4.
Another experimentally verified redox shuttle is the pyruvate–isocitrate shuttle, not allowing the mt matrix isocitrate dehydrogenase isoform 3 (IDH3) to form NADH, but instead the matrix NADPH is consumed by IDH2 [19,25]. This allows the export of isocitrate from the mt matrix and reaction of cytosolic IDH1, transforming isocitrate to 2-oxoglutarate (2OG), while again forming NADPH as the surplus substrate for NOX4. Similarly, having produced typically less than three NADH in a single turn of the Krebs cycle, the RC Complex I site IF forms less superoxide and the H2O2 release into the mt matrix is slowed down.
It seems that there is no problem with the above explanations or interpretations of published data. However, one may ask why the increasing cytosolic H2O2 release is not projected into the mt matrix. Are the enzyme and transport pathways of the redox shuttles so powerful that they create redox states, which are not counteracted from the cytosolic H2O2, possibly acting back to the mt matrix? Is there any “redox insulation”? How does the peroxiredoxin system [2,26] of the cytosol vs. matrix respond to these redox changes? What is the cause that enables the mt matrix compartment to be independent, despite the fact that it represents a relatively minor volume compared to the cytosolic one?
2.1.2. Distinct Redox States of Mitochondrial vs. Cytosolic Compartments upon FASIS
Upon ongoing FASIS [12,22], distinct directions of H2O2 release into the cytosol vs. mt matrix are also encountered. Interestingly, there exists a functional synergy of the mt uncoupling protein 2 (UCP2) and the redox-activated mt Ca2+-independent phospholipase A2, isoform γ (iPLA2γ/PNPLA8). This synergy results in a mild uncoupling of the protonophoric force Δp, established on the inner mitochondrial membrane (IMM; specifically on the intracristal membranes (ICS membranes)) and hence causes a slowdown of the superoxide release into the mt matrix [22]. Indeed, the released nascent FAs, cleaved by iPLA2γ/PNPLA8 from the mt phospholipids, become cycling anionic substrates of UCP2, causing such a mild uncoupling [22,27]. The silencing/ablation of either UCP2 or iPLA2γ prevented a >50% decrease in the superoxide release into the mt matrix [22].
Nevertheless, and on the contrary, upon FASIS, at the same time, FA β-oxidation creates excessive superoxide/H2O2 (Figure 1), which is subsequently sensed by the introduced cytosolic fluorescence ROS probes in insulinoma INS-1E cells [22]. In the isolated pancreatic islets (PIs) and INS-1E cells, it even reaches the cell exterior (unpublished data). Again, how is this possible? Why does the matrix fluorescence superoxide indicator linked to the redox state shows a decrease [19,22], whereas the cytosolic [18] H2O2 probes indicate an H2O2 increase? Is there any channeling of the oxidized state from the mt membranes to the cytosol? Does the mt peroxiredoxin system [2,26] participate in such an outward-directed H2O2 flux? Is the superoxide formed within the intracristal membrane, somehow insulated from the intracristal space or the intermembrane space, so that the opposite redox changes are allowed therein?
To answer all of these questions, further research is required. To create solid theoretical predictions, we will attempt to make theoretical analyses in the further text below. They converge in two models or hypotheses. The first one is concerned with the participation of the peroxiredoxins; the second one is concerned with the activation of the mt matrix superoxide dismutase MnSOD/SOD2. The latter could explain the opposite mt matrix probe vs. the cytosolic probe responses, since paradoxically, the activation of MnSOD accelerates superoxide dismutation and this competes with the response of the superoxide-sensitive probe, such as MitoSOX. As a result, MitoSOX monitors a decreasing superoxide release rate, whereas the resulting accelerated H2O2 formation in the matrix allows a high portion of H2O2 to diffuse into the cytosol. In this way, perfect conditions for redox signaling from the mitochondria could be established.
3. Redox Sources vs. Redox Buffers in Mitochondria and Cytosol
3.1. Specificity Given by the Mitochondrion Architecture
Understanding Mitochondrial Compartments
The mitochondrion typically forms a nearly connected tubular network [28,29,30,31,32], from which small fragments are dynamically separated by fission mechanisms, while fragments join the main network via the fusion mechanism. The ultrastructural organization of mt cristae within the network (or fragments) is complex, so that at least the following compartments are recognized [31] (Figure 2). The innermost matrix compartment resembles an infinite octopus with lamellar tentacles, whereas the intracristal space (ICS) is formed by crista membrane (CM) lamellae oriented mostly perpendicularly to the nearly cylindrical outer membrane and the parallel inner boundary membrane (IBM), from which the CM are invaginated.
Around the crista outlets, which resemble a bottleneck, the MICOS-SAM complexes form so-called crista junctions (CJs), joining the IBM MICOS with the OMM SAM [31,32]. A typical crista lamella is not a regular cuboid, but an irregular structure with edges formed by the ATP-synthase dimers organized in arrays [31]. The RC supercomplexes reside on flanks of crista lamellae [34]. Cristae (crista lamellae) can shrink to provide more-efficient oxidative phosphorylation (OXPHOS) or inflate to establish less-efficient OXPHOS [33,35,36]. The thin cylindrical compartment forming the center of the OMM IBM sandwich was termed as the intermembrane space (IMS). We will refer to it as the peripheral IMS (IMSp, [31]) to distinguish IMSp from the cristae lumen space, which is in fact the ICS.
3.2. Key Players of Redox Equilibrium in Mitochondria and Cytosol
3.2.1. Original Mitochondrial Superoxide Sources
The mitochondrion provides several sites forming superoxides. A detailed description of the mechanisms and locations of the superoxide sources can be found in published reviews, e.g., [31,37,38,39]. We should note, however, that most of the considered sites of the superoxide formation release superoxide to the mt matrix compartment. Only a part of the Complex III site IIIQo superoxide production is released to the ICS, as well as the superoxide produced by ICS-facing dehydrogenases (if they produce superoxide under the given conditions), such as glycerol-3-phosphate dehydrogenase (GAPDH) and dihydroorotate dehydrogenase (DHODH) [31,37,38]. Also, Complex II (succinate dehydrogenase) produces superoxide under certain conditions [31,40], namely in pathologies [31,41].
Note that the IMSp is regarded as the most oxidized compartment, due to the function of the MIA40 system oxidizing sulfhydryl pairs (located apart) of certain suitable IMS proteins into S-S bridges (disulfides) upon their import [42,43]. Moreover, CuZnSOD has been located in this compartment. It is not known whether the MIA40 system can also affect ICS [42,43]. In this review, we do not discuss the redox phenomena in the cytosol, since this would entail another review. The reader can find descriptions in references such as [4,39].
3.2.2. Peroxiredoxin System
Peroxiredoxins (PRDXs) of the 2-Cys type are decameric (dodecameric in mt) hydroperoxide reductases containing peroxidatic cysteine, CP. They form a toroid (doughnut-like) structure of five (six) homodimers, which can split from the toroid in an unstable disulfide conformation (Figure 3). The second resolving cysteine, CR, in the second homodimer subunit forms an inter-subunit disulfide bond with CP upon a reaction with H2O2 [44,45,46,47,48,49,50]. At first, sulfenic acid (R-SOH) is formed via two-electron reversible oxidation. In an atypical mt peroxiredoxin, PRDX5, the intra-subunit S-S bridge, is formed, i.e., within the single subunit [44,45,46,47,48]. The PRDX ring is destabilized when disulfide bonds are formed [44,46]. Finally, the cycle is completed by the reduction of the two disulfide bonds of the homodimer, catalyzed either by a couple of thioredoxins (TRXs) plus NADPH-dependent TRX reductase (TRXR), or by glutathione (GSH)/glutaredoxin (GRX) [44,45,46,47,48] (Figure 3).
Since peroxiredoxins react with H2O2 faster than other peroxidases, such as catalases and glutathione peroxidases (GPX), they are considered as the main regulators of cytosolic H2O2 (besides NOX enzymes) and the related development of diseases with etiology involving oxidative stress. Thus, peroxiredoxins have been implicated in cancer development [49,50], as targets for cardiovascular disease [51] or neurodegenerative diseases [52], and in the β-cell defense against oxidative damage [53].
Cytosolic peroxiredoxins convey their oxidation by H2O2 to the terminal target proteins, typically phosphatases or transcription factors [44,46,54,55,56,57,58]. Thus, peroxiredoxins are literally capable of a “redox kiss” to the target protein, enabling the execution of a redox signal. A phenomenon of the so-called floodgate has been predicted to describe the shift of the oxidation from the original to distant locations [2,59,60]. It is based on the property of 2-Cys cytosolic peroxiredoxins PRDX1, PRDX2, and mtPRDX3 to form stacks of decamers/dodecamers (high-molecular-weight complexes, HMW), when sulfenyls are oxidized into higher oxidized states, i.e., to sulfinyls or even to sulfonyls [26]. HMW complexes frequently form filaments and those with sulfinyls can still be reduced by ATP-dependent sulfinyl reductase (SRX) enzymes [26,61] (Figure 3), unlike those with sulfonyls. The hyperoxidation of PRDX3 is about twice as slow than for PRDX2 [26].
According to the floodgate model, the HMWs formed in the original locations upon a sustained H2O2 flux allow oxidation in the distant loci, proximal to the target proteins, and hence enable the execution of the redox signal. HMW thus effectively withdraws PRDX molecules from the catalytic cycle; so, in their loci, PRDX oxidation cannot proceed and H2O2 is allowed to diffuse to further distances. But, PRDX-containing sulfinyls are brought back after their reduction by the SRX system. Mt SRXs were reported to act in the transfer of circadian rhythms to the mitochondrial matrix via the SRX expression intermittent with SRX degradation by LON-protease, controlled by the clock-genes in the adrenal gland, brown adipose tissue, and heart [26,62,63].
In human cells, six isoforms of PRDXs exist. PRDX1, PRDX2, and PRDX6 are localized in the cytosol and nucleus, while PRDX4 is localized in the endoplasmic reticulum [44,45,46,47,48,49,50]. The isoform PRDX3 is exclusively mitochondrial, whereas PRDX5 is located in mitochondria [64], but also in the cytosol and peroxisomes. PRDX 5 prefers lipid peroxides and peroxynitrite over H2O2. Artificial PRDX5 expression in IMSp attenuated hypoxic transcriptome reprograming as well as carcinogenesis [65,66]. PRDX6 can be recruited to mitochondria (to OMM) [67,68,69]. PRDX6 is a 1-cys-PRDX, which forms only homodimers and is unable to form disulfide bonds nor to be reduced by SRX. Its sulfenic moiety is then reduced with GSH, but not with thioredoxins. PRDX6 reduces oxidized phospholipids and also exerts Ca2+-independent phospholipase A2 activity.
3.2.3. Other Mitochondrial Redox Buffers
Glutathione (GSH) is a major mt matrix redox buffer in numerous cells [2,4], but exerts a lower abundancy and power in certain cells, such as in pancreatic β-cells [12,13,14,15,16]. The glutathione peroxidase (GPX) family consists of five enzymes with seleno-cysteine active sites (GPX1 to 4, GPX6), utilizing GSH as a cofactor [70,71], and three other enzymes with a redox sensor role (GPX5, GPX7, and GPX8) having only cysteine residues in their active sites and modest peroxidase activity [72]. Note that the cytosolic and mitochondrial GPX1 and plasma membrane and cytosolic GPX4 are abundant in all tissues and cell types. A complete survey of the mt GPX isoform is yet to be made. Relations of GPX enzymes to the ferroptosis type of cell death have been firmly established [73]. A correlated function of the redox buffers in the mitochondrial matrix (ICS, IMSp) has to always be considered for the particular cell type and/or physiological or pathological situation.
3.3. Diffusion of Mitochondria-Produced H2O2 into the Cytosol and Extracellular Compartment
3.3.1. Diffusion of H2O2 to the Cytosol
The primary superoxide sources, such as RC supercomplexes, can release the superoxide anion into the mt matrix compartment or into the ICS [31,37,38,39]. MnSOD, localized in the matrix, should convert the majority of superoxide into H2O2. Similarly, CuZnSOD might convert the ICS-released superoxide into H2O2 just within the ICS [74]. Note that if H2O2 was diffusing across the CM, it would reach the mt matrix within ~99% of the CM surface. Only at the proximity of CJs can the ICS-located H2O2 escape into the IMSp and subsequently via the OMM, even to the cytosol. So, considering only the ultrastructure of the mitochondrion, one can recognize how difficult it is to establish H2O2 diffusion from ICS to the cytosol. This is why, in our considerations below, we will frequently simplify a problem to a situation, only when the matrix superoxide or H2O2 release is considered. Thus, a regular diffusion of H2O2 from the matrix to the cytosol must proceed across the IBM, IMSp, and OMM.
Let us first calculate a fraction of the original mt superoxide source that might reach the cytosol. Let JS be the original total superoxide formation rate (flux) from all mt sources. It divides into the two mentioned directions, to the ICS JSICS and to the mt matrix JSm:
JS = JSICS + JSm
The superoxide dismutation in these compartments acts with an efficiency of εICS and εm, respectively, so that the total H2O2 release J into the ICS compartment will be as follows:
JICS = εICS · JSIC
For the matrix compartment, this will be
Jm = εm · JSm
However, these fluxes will be counteracted by the redox buffers and antioxidants. Let us consider that all matrix redox buffers/antioxidants withdraw H2O2 via the rate Bm, and similarly via the rate BICS within the ICS. Next, any remaining and perhaps potentially escaping free H2O2 flux ΔJmito into the cytosol (Figure 4) will be as follows:
and for the matrix compartment, this will be as follows:
where the only fraction υICS or υm, respectively, of free H2O2 diffuses across CJs/IMSp/OMM or IBM/IMSp/OMM, respectively.
ΔJmitoICS = υICS · (εICS · JSICS − BICS)
ΔJmitom = υm · (εm · JSm − Bm)
3.3.2. Convergence of Mitochondrial and Cytosolic H2O2 Fluxes
Within the cytosol, we should consider that all cytosolic H2O2 sources contribute to the cytosolic H2O2 release flux Jcytsource, which is counteracted by the cytosol redox buffer capacity (flux) Bcyt, to which we also include any H2O2 detoxification, such as the one in peroxisomes or via glutathione peroxidases. Indeed, such a cytosolic H2O2 withdrawal (redox buffer/antioxidant capacity) also counteracts the two mitochondrial H2O2 resources; so, the net cytosolic H2O2 release can be expressed as follows:
ΔJcyt = Jcytsource − Bcyt + υm · (εm · JSm − Bm) − Bmcyt + υICS · (εICS · JSICS − BICS) − BICScyt
Note that ΔJcyt > 0 when
Bcyt + υm·Bm + υICS·BICS + Bmcyt + BICScyt < Jcytsource + υm · Jm + υICS · JICS
This refers to when the H2O2/superoxide sources overcome the redox buffering/antioxidant capacities in all of the compartments involved, i.e., ΣB. If one would attempt to estimate the extracellular H2O2 release, the fraction of υPM, i.e., the fraction of Jcyt, which is able to cross the plasma membrane (PM), must be considered. Hence, it is valid that
ΔJextracellular = ΔJcyt · υPM
In the case where there are no intense cytosolic H2O2 sources, the relationship (6a) turns into the following:
ΣB < υm · Jm + υICS · JICS
3.4. Distinct Redox State Changes in Cytosolic vs. Matrix Compartments
3.4.1. When Is This Possible?
Let us analyze whether the above simplified equations allow us to distinguish between redox state changes in the cytosolic vs. matrix compartments. We consider the cytosolic change as that one in the peri-plasma membrane locations or the one projecting up to the extracellular space. Let us also consider for simplification that εICS · JSICS = BICS, so that the last term in Equation (6) is zero. Let us further approximate that υm = 1. As a result, we obtain a simplified relationship, as follows:
ΔJcyt = Jcytsource − Bcyt + εm · JSm − Bm − Bmcyt
This ΔJcyt flux of H2O2 is positive when
Jcytsource > Bcyt + Bm + Bmcyt − Jm
We may conclude that when the mitochondrial source decreases (upon ongoing antioxidant mechanisms), there could still exist a pro-oxidant H2O2 release in the cytosol, if its source exceeds the redox buffering capacities plus a drop in the mitochondrial source. Vice versa, when there is a negligible cytosolic H2O2 source, the mitochondrial one must overcome all of the redox buffers/antioxidants in the compartments. One can observe that the conditions of Equation (8a) exist upon GSIS, when the Jcytsource is represented by the NOX4, whereas the redox pyruvate shuttles provide a decrease in Jm with time. When H2O2 efflux from peroxisomes is possible [75], Jcytsource should contain such a component.
3.4.2. Accelerated MnSOD Activity
One can also consider that the MnSOD activity could be increased upon certain stimuli. To solve this case, we should consider and experimentally evaluate superoxide release and H2O2 production, diffusion, and release to the matrix vs. cytosolic compartments separately. We must therefore calculate the remaining superoxide flux ΔJSm as the difference between sources and consumption. The major part of consumption is the dismutation by MnSOD, expressed by the term JSODm. Moreover, phenomena diminishing the original superoxide formation, such as uncoupling or interaction with mt constituents, etc., can be described by another term, introducing the consumption of the superoxide by a flux JSmconsuming. The balance of the matrix superoxide is then expressed as follows:
ΔJSm = JSm − JSODm − JSmconsuming
When, e.g., JSmconsuming plus JSODm with time are greater than the original superoxide source JSm, the superoxide release with time decreases. Experimentally, probes such as MitoSOX Red should monitor the decreasing rates of the superoxide release into the mitochondrial matrix in such a case [19]. Nevertheless, upon MnSOD activation (denoted by Index 2, apart from the original state denoted by Index 1) not only does JSODm(2) increase, but the resulting H2O2 matrix release also increases. Therefore, substituting Equation (9) into Equation (5), we can obtain
ΔJmitom(1) = υm · {εm · [JSm(1) − JSODm(1) − JSmconsuming(1)] − Bm}
ΔJmitom(2) = υm · {εm · [JSm(2) − JSODm(2) − JSmconsuming(2)] − Bm}
The net change in Situations (2) − (1) when JSm(1) = JSm(2) and JSmconsuming(1) = JSmconsuming(2) will be as follows:
ΔJmitom(2 − 1) = υm · εm · [JSODm(1) − JSODm(2)]
Since the term JSODm(2) is larger than JSODm(1), the resulting change in H2O2 release penetrating into the cytosol will be positive and non-zero. We conclude that if under a certain stimulus MnSOD activity increases, one can experimentally indicate the diminishing superoxide with time in the matrix, compared with the increasing H2O2 with time in the cytosol.
3.4.3. Examples of MnSOD Regulation
Acute switch-on of MnSOD activity can only be realized via fast post-translational modifications (PTMs). One of the frequently documented PTMs is the NAD+-dependent sirtuin-3 (SIRT3)-mediated deacetylation of MnSOD [76,77,78]. There could be a conceptual problem with this, since it is not a large population of enzymes in the matrix that is acetylated/deacetylated, but only a fraction. Nevertheless, in our cases of the intramitochondrial redox signal or weak redox signaling to the cytosol, such a fraction can still produce a sufficient H2O2 bolus. Concerning MnSOD regulations within an hour time frame or chronic regulations, subtle changes accumulated during the time can also be effective [79,80,81,82,83].
3.5. Taking into Account the ICS Volume Changes
The ICS Volume Changes upon Substrate Variations
Nature and mitochondrion are more complex for the simplified description, as discussed above. Upon a respiration substrate increase, cristae narrowing has been observed [33], as well as preceding cristae inflation upon hypoxic cell adaptation [35]. We have also encountered cristae narrowing upon GSIS [36]. Let us consider the relative rates before glucose to be ΔJ0mitoICS = 50 and ΔJ0mitom = 150 (relative magnitudes based on published data of Ref. [22]), while taking the ICS volume V0ICS to be twice the volume VICS established after shrinkage and resulting from a high glucose addition (upon GSIS). V0ICS = 2 VICS. We may also reasonably expect and define that Vm = 3VICS. Since the OMM/IBM volume is constant, we can consider that the matrix volume inflates by the same volume through which the ICS volume shrinks. Hence, V0m = (2/3) · Vm.
Considering volumes, one can introduce flux per volume as a flux density ρ in a given compartment. As expressed in our relative units prior to GSIS, this will be ρ0ICS = 50/2VICS, which gives 75/Vm. For the matrix, ρ0m = 225/Vm. After the volume changes, ρICS = 50/VICS, which gives 150/Vm and ρm = 100/Vm. Simply, the cristae narrowing to a half volume causes the effective doubling of the ICS H2O2 flux density, whereas it reduces the matrix flux density to about 2/3. These theoretical considerations match the observed values [22].
These considerations and exemplar cases also call for the necessity of measurements of redox states in the ICS and matrix compartments separately. While the MitoSOX Red, MitoB [19], and mitochondria-matrix-addressed HyPer probes monitored redox changes in the matrix compartments, the ICS redox changes were only scarcely evaluated.
4. Floodgate Effect of Peroxiredoxins May Promote Redox Signaling
4.1. Intramitochondrial Redox Signaling Promoted by PRDX3
4.1.1. The Simplest Model
In the simplified model, we consider that the hyperoxidation cycle of PRDX3 is too slow, relative to the catalytic cycle (Figure 3). Consequently, we do not need to calculate the rates for the hyperoxidation cycle and consider them as negligible. We will also neglect the splitting into homodimers. In such a case, the total amount of PRDX3 dodecamers [PRDX312] only consists of two major portions. The first fraction [PRDX312]SOH is only oxidized into the first, i.e., sulfenyl state, and remains within the catalytic cycle (Figure 3). The second fraction [PRDX312]SO2H +SO3H is withdrawn from the catalytic cycle, forms HMW structures, and reacts with H2O2 only when converting the remaining sulfinyls (R-SO2H) into sulfonyls (R-SO3H). Using Equation (5), we can neglect other redox buffering power and take the quantity BSOHm as the rate of H2O2 being withdrawn by the PRDX3 catalytic cycle plus the diminishing rate of oxidation into sulfonyls, BSO3Hm. However, note that BSOHm decreases with time at the expense of the increasing BSO2Hm. The remaining mt matrix H2O2 flux will, in this case, be as follows:
where at the decrease in the catalytic cycle at a later time, (2) will diminish the H2O2 withdrawal by the rate BSOHm(2), so that
and the difference between the net late and the net initial H2O2 flux at υm = 1 will be as follows:
ΔJmitom/υm = εm · JSm − BSOHm − BSO2Hm − BSO3Hm
BSOHm(1) − BSOHm(2) = BSO2Hm(2) − BSO2Hm(1)
ΔJmitom(2) − ΔJmitom(1) = BSO3Hm(1) − BSO3Hm(2)
Since BSO3Hm is decreasing and approaches zero with time, the later H2O2 flux at a later time (2), ΔJmitom(2), will be greater than the initial ΔJmitom(1). This consideration stands for a proof of concept for PRDX3 facilitation of the mitochondrial redox signaling.
Moreover, Equations (11)–(13) describe a steady state and do not consider a faster diffusion of H2O2 relative to the diffusion of PRDX3 dodecamers. This difference probably also stands for another cause of the floodgate model mechanism. Within the ~20 nm thin compartments of the mt matrix between the cristae lamellae, H2O2 produced by MnSOD molecules distant from the IBM/IMSp/OMM sandwich can escape from the local consumption, not only because of the local floodgate mechanism, being unable to further oxidize HMW structures, but also due to the lack of reduced PRDX dodecamers in the same loci. The escape means diffusion up to the IBM and across the IBM/IMSp/OMM, up to the cytosol. However, experiments with a complete ablation of PRDX3 cannot directly evidence the floodgate mechanism, since the total matrix redox buffer capacity is reduced and H2O2 diffusion is thus facilitated via the PRDX3 ablation, per se.
We have to also note that hyperoxidized PRDX3 was not detected in the whole pancreases [26]. This does not mean that in a few percent of pancreas mass, represented by β-cells, there is no hyperoxidized PRDX3. An intriguing hypothesis that similar circadian control of the matrix redox buffering capacity, such as in the adrenal gland, also exists in β-cells is still speculative. Nevertheless, the acetylation of PRDX3 was found to facilitate its hyperoxidation in INS-1E cells and in human cultured β-cells at 30 mM glucose [84].
4.1.2. The Model Involving the Hyperoxidation Cycle of PRDX3
Introducing a more realistic model also considering the hyperoxidation cycle of PRDX3, one should consider that within the given time frame, the sulfinic peroxidation cycle increases the [PRDX312]SOH fraction, and so it does not decline as quickly as in the simplest model, as described above. The surplus of BSOHm(2) will be given by the differences in rates of the SRX hyperoxidation cycle BSRXm(2) − BSRXm(1). Hence, one can consider a higher intensity of mt redox signaling with lower activity of the SRX reaction reducing sulfinyls. This may occur, for example, with a faster rate of LON-protease-facilitated SRX degradation [26].
5. Pitfalls of Redox Signaling Indications with Fluorescence Probes
5.1. Fluorescence Monitoring of H2O2 in Cytosolic and Matrix Compartments
5.1.1. Understanding Redox Buffering via Redox Probes
Unfortunately, even the most specific fluorescence probes perturb the redox system in the compartment where they are located. Hence, one has to consider them as a surplus of the counteracting redox buffering. We can simplify such a situation via the notion that introducing the fluorescent probes makes redox signaling more difficult. For probes required to be expressed, different expression levels, namely the mild ones, should be adjusted, as well as the concentrations of the concentrating probes (e.g., the MitoSOX superoxide sensor as an exemplar probe with the TPP moiety, allowing penetration to the mt matrix).
Equation (8) can be rewritten to express a contribution of the mt matrix fluorescence probe, as follows:
Jcyt = Jcytsource − Bcyt + εm · JSm − Bm − Bprobem − Bmcyt
Similarly, Equation (8) can be rewritten to express a contribution of the cytosolic fluorescence probe:
Jcyt = Jcytsource − Bcyt − Bcyt probe + εm · JSm − Bm − Bmcyt
One can foresee the decreases in the estimated mitochondrial and cytosolic fluxes according to the relative buffering capacity of the probe vs. the buffering capacity of its environment.
5.1.2. Is the Sensitivity of Redox Probes High Enough to Be Able to Compete with Redox Buffers?
Even the recently developed H2O2-selective fluorescence probes, such as HyPer7, do not always match the required sensitivity for the indication of the net local ΔJcyt, i.e., local H2O2 surplus concentration changes with time in the observed loci [85,86,87,88]. The reason for this is the competition of the redox probe with the local redox buffers, such as with the peroxiredoxin system [85]. Matching the sensitivity to successfully indicate any surplus of local H2O2 is naturally different in the different cell types and/or situations.
We have successfully monitored redox signals upon insulin secretion in model rat pancreatic β-cells, INS-1E cells, and isolated pancreatic islets [18], and identified its origin via NOX4 [18] or from mitochondria—with the latter being in the case of fatty acid- [22] and ketoisocaproate-stimulated insulin secretion [18]. One could ascribe the ability of mt-addressed or cytosolic fluorescence probes used to the relatively low redox buffering capacity of pancreatic β-cells. Indeed, attempting HyPer7 monitoring of cytosolic H2O2 using confocal microscopy, we encountered subtle increases in the 488 nm vs. 405 nm fluorescence ratios after glucose addition to INS-1E cells at the margins of the probe sensitivity (Engstová, H. and P.J.; unpublished). On the contrary, the artificially induced superoxide/H2O2 in C. elegans using Supernova (an optogenetic superoxide source, [89]) yielded sufficient increases in HyPer7 488 nm vs. 405 nm fluorescence ratios to monitor H2O2 elevations [90].
Recently, HyPer7 monitoring in HEK293 cells and HeLa cells has reflected a heterogeneity between individual cells [86]. Authors have reported mitochondria-released H2O2 on the surface of the mt tubules (OMM) and in the bulk cytosol, but not in the proximity of the plasma membrane or in the nucleus. The observed H2O2 gradient was found to be under control by cytosolic peroxiredoxins and variations in the cytosolic thioredoxin reductase levels [86]. These authors accepted a possibility of H2O2-mediated redox signaling under specific metabolic conditions.
5.1.3. Pitfalls in Calibration of Redox Probes
Another problem with cytosolic or mitochondrial redox probes is their calibration. Of course, attempts to calibrate with externally added H2O2 face the problem that H2O2 diffusion into the cytosol is counteracted by the cell redox buffer systems, and therefore the real cytosolic H2O2 concentrations are not matched. An alternative can be viewed in the controlled H2O2 delivery, such as introduced with an ectopic expression of D-amino acid oxidase (DAAO), which catalyzes H2O2 formation using D-amino acids [91]. In this case, the DAAO-produced amount of H2O2 can be calibrated from the concomitant oxygen consumption [91].
5.1.4. Extracellular H2O2 Indications with Amplex Red—Is This the Solution to the Problem?
Solving the redox buffer problem for cytosolic redox probes might appear to be simple, lying in the use of the external probes, to be calibrated in the absence of redox buffers. Indeed, Amplex Red has been reported to indicate extracellular H2O2 originating from mitochondria [92,93,94,95]. For example, in C2C12 myoblasts, contributions of distinct sites of mt superoxide formation have been reported [94]. The RC Complex I site IQ accounted for 12% (25% after differentiation into myotubes) of the total mt of superoxide/H2O2 formation, while the Complex III site IIIQo accounted for 30%. In cultured cells, approximately 60% of the total cell H2O2 flux, surveyed extracellularly, was ascribed to NADPH oxidases, while 30% was ascribed to mitochondria [91]. Possible obstacles with the Amplex Red method may come from the requirement of the horseradish peroxidase to catalyze Amplex Red conversion to resorufin.
5.2. Fluorescence Monitoring of Matrix Superoxide
The MitoSOX-Red-based confocal microscopy semi-quantification of the mitochondrial matrix superoxide is not perfect, but it is still a usable method to monitor time-lapsed mt superoxide release [96]. Due to the ability of MitoSOX Red to intercalate into mtDNA, the probe cannot leak out from the mt matrix with decreasing mt membrane potential ([19,96,97] and Supplemental Information for Ref. [19]), and hence, MitoSOX Red can also monitor situations whereby such decreases occur. MitoSOX Red fluorescence elevation could be a genuine measure of the increased superoxide release into the mt matrix, if surveyed within time intervals when the effects of MitoSOX on mtDNA are still not manifested.
5.3. Guidelines for Measuring ROS and Oxidative Damage
Recommended guidelines for the use and interpretation of measurements with various ROS probes and for investigations into redox states can be found in excellent published reviews [98,99,100,101,102]. Table 1 summarizes the considered advantages or disadvantages of each probe or approach.
Even more caution has to be paid when analyses of clinical samples are conducted [98]. One has to not only consider the ROS sources and their scavenging and antioxidant mechanisms, but all lipid, protein, and DNA (mtDNA) modifications and their consequences in altered autophagy (both elevated as well as decreased autophagy can be pathological) and mitochondria-specific autophagy, i.e., mitophagy. Moreover, responses by cells should be taken into account, such as the ER stress or unfolded protein response and mitochondrial unfolded protein response. The initiation or execution of various types of cell death underlie these phenomena due to their striking consequences and changes, including mt network morphology [32] and cristae ultrastructural changes [31]. Concerning mitochondria as a central metabolic and information hub [3], controlling the majority of the above-mentioned phenomena, mitochondrial biogenesis and protein turnover can delay certain pathological situations, but can serve as specific markers of the abnormal situation.
6. Future Perspectives
All of the above knowledge is a substantial part of modern molecular biomedicine. Further investigations into and quantifications of mitochondrial redox signals are required. Here, a small attempt is made to illustrate certain examples, where the impaired mitochondrial redox signaling might be part of the disease etiology (Table 2). It is not distinguished by timing, concerning whether the involved redox signals are acute or proceed slowly as redox regulations with concomitant gene expression changes. In a few cases, such an impairment is concerned with either the blockage or overwhelming of the repeatable acute redox signals; in most cases, exemplar redox signaling controlling gene expression is mentioned. Also, a few examples are listed for cytosolic redox signals, such as those initiated via NADPH oxidases.
Thus, mt redox signals are implicated in aging [116,117,118], as well as in the development of cancer and metastases [119,120,121,122,123]. Cytosolic redox signals/gene regulations are hypothetically involved in type 2 diabetes changes in pancreatic β-cells. The housekeeping and maintenance of the insulin gene and specific genes for pancreatic β-cells [124] were hypothetically ascribed to repeatable NADPH-oxidase-4-mediated redox signals determining glucose-stimulated insulin secretion [18]. Logically, the attenuation or blockage of these redox signals disrupt the correct housekeeping of the most important β-cell-specific transcripts. In the long term, this leads to a dedifferentiation of β-cells or their transdifferentiation into other islet cell types (e.g., α-cells and δ-cells). Redox signals or regulations of mt origin are also implicated in insulin resistance development in peripheral tissues [125,126]. Other listed examples include heart [127,128,129] and endothelial pathology [130,131,132,133,134], pulmonary hypertension [135], sepsis [136], skeletal muscle injuries (here, mt ROS signal for repair mechanisms, [137,138]), and NLR family pyrin domain-containing 3 (NLRP3)-related inflammatory states [139,140,141]. This list is illustrative and incomplete.
Funding
This research was funded by the Grant Agency of the Czech Republic, grant number 21-01205S given to P.J., and by the project of the National Institute for Research of Metabolic and Cardiovascular Diseases (Programme EXCELES, ID Project No. LX22NPO5104)—funded by the European Union—Next Generation EU.
Conflicts of Interest
The author declares no conflict of interest.
References
- Shadel, G.S.; Horvath, T.L. Mitochondrial ROS signaling in organismal homeostasis. Cell 2015, 163, 560–569. [Google Scholar] [CrossRef] [PubMed]
- Ježek, P.; Holendová, B.; Plecitá-Hlavatá, L. Redox Signaling from Mitochondria: Signal Propagation and Its Targets. Biomolecules 2020, 10, 93. [Google Scholar] [CrossRef]
- Picard, M.; Shirihai, O.S. Mitochondrial signal transduction. Cell Metab. 2022, 34, 1620–1653. [Google Scholar] [CrossRef]
- Sies, H.; Jones, D.P. Reactive oxygen species (ROS) as pleiotropic physiological signalling agents. Nat. Rev. Mol. Cell Biol. 2020, 21, 363–383. [Google Scholar] [CrossRef] [PubMed]
- Chandel, N.S.; McClintock, D.S.; Feliciano, C.E.; Wood, T.M.; Melendez, J.A.; Rodriguez, A.M.; Schumacker, P.T. Reactive oxygen species generated at mitochondrial complex III stabilize hypoxia-inducible factor-1a. J. Biol. Chem. 2000, 275, 25130–25138. [Google Scholar] [CrossRef]
- Lee, P.; Chandel, N.S.; Simon, M.C. Cellular adaptation to hypoxia through hypoxia inducible factors and beyond. Nat. Rev. Mol. Cell Biol. 2020, 21, 268–283. [Google Scholar] [CrossRef] [PubMed]
- Kirova, D.G.; Judasova, K.; Vorhauser, J.; Zerjatke, T.; Leung, J.K.; Glauche, I.; Mansfeld, J. A ROS-dependent mechanism promotes CDK2 phosphorylation to drive progression through S phase. Dev. Cell 2022, 57, 1712–1727. [Google Scholar] [CrossRef]
- Chakrabarty, R.P.; Chandel, N.S. Mitochondria as Signaling Organelles Control Mammalian Stem Cell Fate. Cell Stem. Cell 2021, 28, 394–408. [Google Scholar] [CrossRef]
- Chouchani, E.T.; Pell, V.R.; Gaude, E.; Aksentijević, D.; Sundier, S.Y.; Robb, E.L.; Logan, A.; Nadtochiy, S.M.; Ord, E.N.J.; Smith, A.C.; et al. Ischaemic accumulation of succinate controls reperfusion injury through mitochondrial ROS. Nature 2014, 515, 431–435. [Google Scholar] [CrossRef]
- Mills, E.L.; Pierce, K.A.; Jedrychowski, M.P.; Garrity, R.; Winther, S.; Vidoni, S.; Yoneshiro, T.; Spinelli, J.B.; Lu, G.Z.; Kazak, L.; et al. Accumulation of succinate controls activation of adipose tissue thermogenesis. Nature 2018, 560, 102–106. [Google Scholar] [CrossRef]
- Mills, E.L.; Kelly, B.; Logan, A.; Costa, A.S.H.; Varma, M.; Bryant, C.E.; Tourlomousis, P.; Däbritz, J.H.M.; Gottlieb, E.; Latorre, I.; et al. Succinate Dehydrogenase Supports Metabolic Repurposing of Mitochondria to Drive Inflammatory Macrophages. Cell 2016, 167, 457–470. [Google Scholar] [CrossRef]
- Ježek, P.; Jabůrek, M.; Holendová, B.; Plecitá-Hlavatá, L. Fatty Acid-Stimulated Insulin Secretion vs. Lipotoxicity. Molecules 2018, 23, 1483. [Google Scholar] [CrossRef] [PubMed]
- Ježek, P.; Holendová, B.; Jabůrek, M.; Tauber, J.; Dlasková, A.; Plecitá-Hlavatá, L. The Pancreatic β-Cell: The Perfect Redox System. Antioxidants 2021, 10, 197. [Google Scholar] [CrossRef]
- Ježek, P.; Holendová, B.; Jabůrek, M.; Dlasková, A.; Plecitá-Hlavatá, L. Contribution of Mitochondria to Insulin Secretion by Various Secretagogues. Antioxid. Redox Signal. 2022, 36, 920–952. [Google Scholar] [CrossRef] [PubMed]
- Rorsman, P.; Ashcroft, F.M. Pancreatic β-Cell Electrical Activity and Insulin Secretion: Of Mice and Men. Physiol. Rev. 2018, 98, 117–214. [Google Scholar] [CrossRef]
- Merrins, M.J.; Corkey, B.E.; Kibbey, R.G.; Prentki, M. Metabolic cycles and signals for insulin secretion. Cell Metab. 2022, 34, 947–968. [Google Scholar] [CrossRef] [PubMed]
- Yosida, M.; Dezaki, K.; Uchida, K.; Kodera, S.; Lam, N.V.; Ito, K.; Rita, R.S.; Yamada, H.; Shimomura, K.; Ishikawa, S.E.; et al. Involvement of cAMP/EPAC/TRPM2 activation in glucose- and incretin-induced insulin secretion. Diabetes 2014, 63, 3394–3403. [Google Scholar] [CrossRef]
- Plecitá-Hlavatá, L.; Jabůrek, M.; Holendová, B.; Tauber, J.; Pavluch, V.; Berková, Z.; Cahová, M.; Schröder, K.; Brandes, R.P.; Siemen, D.; et al. Glucose-Stimulated Insulin Secretion Fundamentally Requires H2O2 Signaling by NADPH Oxidase 4. Diabetes 2020, 69, 1341–1354. [Google Scholar] [CrossRef] [PubMed]
- Plecitá-Hlavatá, L.; Engstová, H.; Holendová, B.; Tauber, J.; Špaček, T.; Petrásková, L.; Křen, V.; Špačková, J.; Gotvaldová, K.; Ježek, J.; et al. Mitochondrial Superoxide Production Decreases on Glucose-Stimulated Insulin Secretion in Pancreatic β Cells Due to Decreasing Mitochondrial Matrix NADH/NAD+ Ratio. Antioxid. Redox Signal. 2020, 33, 789–815. [Google Scholar] [CrossRef]
- Pavluch, V.; Engstová, H.; Špačková, J.; Ježek, P. Deficiency of transcription factor Nkx6.1 does not prevent insulin secretion in INS-1E cells. Sci. Rep. 2023, 13, 683. [Google Scholar] [CrossRef]
- Leguina-Ruzzi, A.; Vodičková, A.; Holendová, B.; Pavluch, V.; Tauber, J.; Engstová, H.; Dlasková, A.; Ježek, P. Glucose-Induced Expression of DAPIT in Pancreatic β-Cells. Biomolecules 2020, 10, 1026. [Google Scholar] [CrossRef]
- Ježek, J.; Dlasková, A.; Zelenka, J.; Jabůrek, M.; Ježek, P. H2O2-Activated Mitochondrial Phospholipase iPLA2γ Prevents Lipotoxic Oxidative Stress in Synergy with UCP2, Amplifies Signaling via G-Protein-Coupled Receptor GPR40, and Regulates Insulin Secretion in Pancreatic β-Cells. Antioxid. Redox Signal. 2015, 23, 958–972. [Google Scholar] [CrossRef]
- Deglasse, J.-P.; Roma, L.P.; Pastor-Flores, D.; Gilon, P.; Dick, T.P.; Jonas, J.-C. Glucose acutely reduces cytosolic and mitochondrial H2O2 in rat pancreatic beta cells. Antioxid. Redox Signal. 2019, 30, 297–313. [Google Scholar] [CrossRef]
- Spégel, P.; Sharoyko, V.V.; Goehring, I.; Danielsson, A.P.; Malmgren, S.; Nagorny, C.L.; Andersson, L.E.; Koeck, T.; Sharp, G.W.; Straub, S.G.; et al. Time resolved metabolomics analysis of b-cells implicates the pentose phosphate pathway in the control of insulin release. BioChem. J. 2013, 450, 595–605. [Google Scholar] [CrossRef]
- Ježek, P. 2-Hydroxyglutarate in Cancer Cells. Antioxid. Redox Signal. 2020, 33, 903–926. [Google Scholar] [CrossRef] [PubMed]
- Rhee, S.G.; Kil, I.S. Mitochondrial H2O2 signaling is controlled by the concerted action of peroxiredoxin III and sulfiredoxin: Linking mitochondrial function to circadian rhythm. Free Radic. Biol. Med. 2016, 100, 73–80. [Google Scholar] [CrossRef]
- Ježek, P.; Holendová, B.; Garlid, K.D.; Jabůrek, M. Mitochondrial Uncoupling Proteins: Subtle Regulators of Cellular Redox Signaling. Antioxid. Redox Signal. 2018, 29, 667–714. [Google Scholar] [CrossRef] [PubMed]
- Plecitá-Hlavatá, L.; Lessard, M.; Šantorová, J.; Bewersdorf, J.; Ježek, P. Mitochondrial oxidative phosphorylation and energetic status are reflected by morphology of mitochondrial network in INS-1E and HEP-G2 cells viewed by 4Pi microscopy. Biochim. Biophys. Acta 2008, 1777, 834–846. [Google Scholar] [CrossRef] [PubMed]
- Dlasková, A.; Špaček, T.; Šantorová, J.; Plecitá-Hlavatá, L.; Berková, Z.; Saudek, F.; Lessard, M.; Bewersdorf, J.; Ježek, P. 4Pi microscopy reveals an impaired three-dimensional mitochondrial network of pancreatic islet beta-cells, an experimental model of type-2 diabetes. Biochim. Biophys. Acta 2010, 1797, 1327–1341. [Google Scholar] [CrossRef] [PubMed]
- Dlasková, A.; Engstová, H.; Plecitá-Hlavatá, L.; Lessard, M.; Alán, L.; Reguera, D.P.; Jabůrek, M.; Ježek, P. Distribution of mitochondrial DNA nucleoids inside the linear tubules vs. bulk parts of mitochondrial network as visualized by 4Pi microscopy. J. Bioenerg. Biomembr. 2015, 47, 255–263. [Google Scholar] [CrossRef]
- Ježek, P.; Jabůrek, M.; Holendová, B.; Engstová, H.; Dlasková, A. Mitochondrial Cristae Morphology Reflecting Metabolism, Superoxide Formation, Redox Homeostasis, and Pathology. Antioxid. Redox Signal. 2023, ahead of print. [CrossRef]
- Kawano, I.; Bazila, B.; Ježek, P.; Dlasková, A. Mitochondrial dynamics and cristae shape changes during metabolic reprogramming. Antioxid. Redox Signal. 2023; ahead of print. [Google Scholar] [CrossRef]
- Dlasková, A.; Špaček, T.; Engstová, H.; Špačková, J.; Schröfel, A.; Holendová, B.; Smolková, K.; Plecitá-Hlavatá, L.; Ježek, P. Mitochondrial cristae narrowing upon higher 2-oxoglutarate load. Biochim. Biophys. Acta 2019, 1860, 659–678. [Google Scholar] [CrossRef] [PubMed]
- Nesterov, S.; Chesnokov, Y.; Kamyshinsky, R.; Panteleeva, A.; Lyamzaev, K.; Vasilov, R.; Yaguzhinsky, L. Ordered Clusters of the Complete Oxidative Phosphorylation System in Cardiac Mitochondria. Int. J. Mol. Sci. 2021, 22, 1462. [Google Scholar] [CrossRef]
- Plecitá-Hlavatá, L.; Engstová, H.; Alán, L.; Špaček, T.; Dlasková, A.; Smolková, K.; Špačková, J.; Tauber, J.; Strádalová, V.; Malínský, J.; et al. Hypoxic HepG2 cell adaptation decreases ATP synthase dimers and ATP production in inflated cristae by mitofilin down-regulation concomitant to MICOS clustering. FASEB J. 2016, 30, 1941–1957. [Google Scholar] [CrossRef]
- Dlasková, A.; Engstová, H.; Špaček, T.; Kahancová, A.; Pavluch, V.; Smolková, K.; Špačková, J.; Bartoš, M.; Hlavatá, L.; Ježek, P. 3D super-resolution microscopy reflects mitochondrial cristae alternations and mtDNA nucleoid size and distribution. Biochim. Biophys. Acta 2018, 1859, 829–844. [Google Scholar] [CrossRef]
- Brand, M.D. Mitochondrial generation of superoxide and hydrogen peroxide as the source of mitochondrial redox signaling. Free Radic Biol. Med. 2016, 100, 14–31. [Google Scholar] [CrossRef]
- Wong, H.S.; Dighe, P.A.; Mezera, V.; Monternier, P.A.; Brand, M.D. Production of superoxide and hydrogen peroxide from specific mitochondrial sites under different bioenergetic conditions. J. Biol. Chem. 2017, 292, 16804–16809. [Google Scholar] [CrossRef]
- Brand, M.D. Riding the tiger—Physiological and pathological effects of superoxide and hydrogen peroxide generated in the mitochondrial matrix. Crit. Rev. BioChem. Mol. Biol. 2020, 55, 592–661. [Google Scholar] [CrossRef] [PubMed]
- Quinlan, C.L.; Orr, A.L.; Perevoshchikova, I.V.; Treberg, J.R.; Ackrell, B.A.; Brand, M.D. Mitochondrial complex II can generate reactive oxygen species at high rates in both the forward and reverse reactions. J. Biol. Chem. 2012, 287, 27255–27264. [Google Scholar] [CrossRef] [PubMed]
- Mukhopadhyay, S.; Encarnación-Rosado, J.; Lin, E.Y.; Sohn, A.S.W.; Zhang, H.; Mancias, J.D.; Kimmelman, A.C. Autophagy supports mitochondrial metabolism through the regulation of iron homeostasis in pancreatic cancer. Sci. Adv. 2023, 9, eadf9284. [Google Scholar] [CrossRef]
- Ježek, P.; Plecitá-Hlavatá, L. Mitochondrial reticulum network dynamics in relation to oxidative stress, redox regulation, and hypoxia. Int. J. BioChem. Cell Biol. 2009, 41, 1790–1804. [Google Scholar] [CrossRef] [PubMed]
- Dickson-Murray, E.; Nedara, K.; Modjtahedi, N.; Tokatlidis, K. The Mia40/CHCHD4 Oxidative Folding System: Redox Regulation and Signaling in the Mitochondrial Intermembrane Space. Antioxidants 2021, 10, 592. [Google Scholar] [CrossRef] [PubMed]
- Bolduc, J.; Koruza, K.; Luo, T.; Malo Pueyo, J.; Vo, T.N.; Ezeriņa, D.; Messens, J. Peroxiredoxins wear many hats: Factors that fashion their peroxide sensing personalities. Redox Biol. 2021, 42, 101959. [Google Scholar] [CrossRef] [PubMed]
- Rhee, S.G.; Kang, S.W.; Chang, T.S.; Jeong, W.; Kim, K. Peroxiredoxin, a novel family of peroxidases. IUBMB Life 2001, 52, 35–41. [Google Scholar] [CrossRef]
- Rhee, S.G. Overview on Peroxiredoxin. Mol. Cells 2016, 39, 1–5. [Google Scholar] [PubMed]
- Villar, S.F.; Ferrer-Sueta, G.; Denicola, A. The multifaceted nature of peroxiredoxins in chemical biology. Curr. Opin. Chem. Biol. 2023, 76, 102355. [Google Scholar] [CrossRef] [PubMed]
- Rhee, S.G.; Woo, H.A. Multiple functions of 2-Cys peroxiredoxins, I and II, and their regulations via post-translational modifications. Free Radic. Biol. Med. 2020, 152, 107–115. [Google Scholar] [CrossRef]
- Thapa, P.; Jiang, H.; Ding, N.; Hao, Y.; Alshahrani, A.; Wei, Q. The Role of Peroxiredoxins in Cancer Development. Biology 2023, 12, 666. [Google Scholar] [CrossRef]
- Liu, Y.; Wang, P.; Hu, W.; Chen, D. New insights into the roles of peroxiredoxins in cancer. Biomed. Pharmacother. 2023, 164, 114896. [Google Scholar] [CrossRef]
- Jeong, S.J.; Park, J.G.; Oh, G.T. Peroxiredoxins as Potential Targets for Cardiovascular Disease. Antioxidants 2021, 10, 1244. [Google Scholar] [CrossRef]
- Szeliga, M. Peroxiredoxins in Neurodegenerative Diseases. Antioxidants 2020, 9, 1203. [Google Scholar] [CrossRef]
- Stancill, J.S.; Corbett, J.A. The Role of Thioredoxin/Peroxiredoxin in the β-Cell Defense Against Oxidative Damage. Front. Endocrinol. 2021, 12, 718235. [Google Scholar] [CrossRef] [PubMed]
- Heo, S.; Kim, S.; Kang, D. The Role of Hydrogen Peroxide and Peroxiredoxins throughout the Cell Cycle. Antioxidants 2020, 9, 280. [Google Scholar] [CrossRef]
- Stocker, S.; Van Laer, K.; Mijuskovic, A.; Dick, T.P. The Conundrum of Hydrogen Peroxide Signaling and the Emerging Role of Peroxiredoxins as Redox Relay Hubs. Antioxid. Redox Signal. 2018, 28, 558–573. [Google Scholar] [CrossRef] [PubMed]
- Rhee, S.G.; Woo, H.A.; Kang, D. The Role of Peroxiredoxins in the Transduction of H2O2 Signals. Antioxid. Redox Signal. 2018, 28, 537–557. [Google Scholar] [CrossRef]
- Sobotta, M.C.; Liou, W.; Stocker, S.; Talwar, D.; Oehler, M.; Ruppert, T.; Scharf, A.N.; Dick, T.P. Peroxiredoxin-2 and STAT3 form a redox relay for H2O2 signaling. Nat. Chem. Biol. 2015, 11, 64–70. [Google Scholar] [CrossRef]
- Jarvis, R.M.; Hughes, S.M.; Ledgerwood, E.C. Peroxiredoxin 1 functions as a signal peroxidase to receive, transduce, and transmit peroxide signals in mammalian cells. Free Radic. Biol. Med. 2012, 53, 1522–1530. [Google Scholar] [CrossRef] [PubMed]
- Woo, H.A.; Yim, S.H.; Shin, D.H.; Kang, D.; Yu, D.Y.; Rhee, S.G. Inactivation of peroxiredoxin I by phosphorylation allows localized H2O2 accumulation for cell signaling. Cell 2010, 140, 517–528. [Google Scholar] [CrossRef]
- Reczek, C.R.; Chandel, N.S. ROS-dependent signal transduction. Curr. Opin. Cell Biol. 2015, 33, 8–13. [Google Scholar] [CrossRef]
- Mishra, M.; Jiang, H.; Wu, L.; Chawsheen, H.A.; Wei, Q. The sulfiredoxin-peroxiredoxin (Srx-Prx) axis in cell signal transduction and cancer development. Cancer Lett. 2015, 366, 150–159. [Google Scholar] [CrossRef] [PubMed]
- Del Olmo, M.; Kramer, A.; Herzel, H. A Robust Model for Circadian Redox Oscillations. Int. J. Mol. Sci. 2019, 20, 2368. [Google Scholar] [CrossRef]
- Lee, J.; Liu, R.; de Jesus, D.; Kim, B.S.; Ma, K.; Moulik, M.; Yechoor, V. Circadian control of β-cell function and stress responses. Diabetes Obes. Metab. 2015, 17 (Suppl. 1), 123–133. [Google Scholar] [CrossRef]
- Knoops, B.; Goemaere, J.; Van der Eecken, V.; Declercq, J.P. Peroxiredoxin 5: Structure, mechanism, and function of the mammalian atypical 2-Cys peroxiredoxin. Antioxid. Redox Signal. 2011, 15, 817–829. [Google Scholar] [CrossRef] [PubMed]
- Sabharwal, S.S.; Waypa, G.B.; Marks, J.D.; Schumacker, P.T. Peroxiredoxin-5 targeted to the mitochondrial intermembrane space attenuates hypoxia-induced reactive oxygen species signalling. BioChem. J. 2013, 456, 337–346. [Google Scholar] [CrossRef] [PubMed]
- Sabharwal, S.S.; Dudley, V.J.; Landwerlin, C.; Schumacker, P.T. H2O2 transit through the mitochondrial intermembrane space promotes tumor cell growth in vitro and in vivo. J. Biol. Chem. 2023, 299, 104624. [Google Scholar] [CrossRef]
- Ma, S.; Zhang, X.; Zheng, L.; Li, Z.; Zhao, X.; Lai, W.; Shen, H.; Lv, J.; Yang, G.; Wang, Q.; et al. Peroxiredoxin 6 Is a Crucial Factor in the Initial Step of Mitochondrial Clearance and Is Upstream of the PINK1-Parkin Pathway. Antioxid. Redox Signal. 2016, 24, 486–501. [Google Scholar] [CrossRef]
- López-Grueso, M.J.; Lagal, D.J.; García-Jiménez, Á.F.; Tarradas, R.M.; Carmona-Hidalgo, B.; Peinado, J.; Requejo-Aguilar, R.; Bárcena, J.A.; Padilla, C.A. Knockout of PRDX6 induces mitochondrial dysfunction and cell cycle arrest at G2/M in HepG2 hepatocarcinoma cells. Redox Biol. 2020, 37, 101737. [Google Scholar] [CrossRef]
- Pacifici, F.; Della-Morte, D.; Capuani, B.; Coppola, A.; Scioli, M.G.; Donadel, G.; Andreadi, A.; Ciccosanti, F.; Fimia, G.M.; Bellia, A.; et al. Peroxiredoxin 6 Modulates Insulin Secretion and Beta Cell Death via a Mitochondrial Dynamic Network. Front. Endocrinol. 2022, 13, 842575. [Google Scholar] [CrossRef]
- Brigelius-Flohe, R.; Maiorino, M. Glutathione peroxidases. Biochim. Biophys. Acta 2013, 1830, 3289–3303. [Google Scholar] [CrossRef]
- Ighodaro, O.M.; Akinloye, O.A. First line defence antioxidants-superoxide dismutase (SOD), catalase (CAT) and glutathione peroxidase (GPX): Their fundamental role in the entire antioxidant defence grid. Alex. J. Med. 2018, 54, 287–293. [Google Scholar] [CrossRef]
- Herbette, S.; Roeckel-Drevet, P.; Drevet, J.R. Seleno-independent glutathione peroxidases. More than simple antioxidant scavengers. FEBS J. 2007, 274, 2163–2180. [Google Scholar] [CrossRef]
- Cheng, X.; Zhang, J.; Xiao, Y.; Wang, Z.; He, J.; Ke, M.; Liu, S.; Wang, Q.; Zhang, L. Mitochondrial Regulation of Ferroptosis in Cancer Therapy. Int. J. Mol. Sci. 2023, 24, 10037. [Google Scholar] [CrossRef] [PubMed]
- Valentine, J.S.; Doucette, P.A.; Zittin Potter, S. Copper-zinc superoxide dismutase and amyotrophic lateral sclerosis. Annu Rev. Biochem. 2005, 74, 563–593. [Google Scholar] [CrossRef] [PubMed]
- Fujiki, Y.; Okumoto, K.; Honsho, M.; Abe, Y. Molecular insights into peroxisome homeostasis and peroxisome biogenesis disorders. Biochim. Biophys. Acta 2022, 1869, 119330. [Google Scholar] [CrossRef]
- Ozden, O.; Park, S.H.; Kim, H.S.; Jiang, H.; Coleman, M.C.; Spitz, D.R.; Gius, D. Acetylation of MnSOD directs enzymatic activity responding to cellular nutrient status or oxidative stress. Aging 2011, 3, 102–107. [Google Scholar] [CrossRef]
- Tao, R.; Vassilopoulos, A.; Parisiadou, L.; Yan, Y.; Gius, D. Regulation of MnSOD enzymatic activity by Sirt3 connects the mitochondrial acetylome signaling networks to aging and carcinogenesis. Antioxid. Redox Signal. 2014, 20, 1646–1654. [Google Scholar] [CrossRef]
- Salvatori, I.; Valle, C.; Ferri, A.; Carrì, M.T. SIRT3 and mitochondrial metabolism in neurodegenerative diseases. NeuroChem. Int. 2017, 109, 184–192. [Google Scholar] [CrossRef]
- Gao, E.; Sun, X.; Thorne, R.F.; Zhang, X.D.; Li, J.; Shao, F.; Ma, J.; Wu, M. NIPSNAP1 directs dual mechanisms to restrain senescence in cancer cells. J. Transl. Med. 2023, 21, 401. [Google Scholar] [CrossRef]
- Anamika Roy, A.; Trigun, S.K. Hippocampus mitochondrial MnSOD activation by a SIRT3 activator, honokiol, correlates with its deacetylation and upregulation of FoxO3a and PGC1α in a rat model of ammonia neurotoxicity. J. Cell. Biochem. 2023, 124, 606–618. [Google Scholar] [CrossRef] [PubMed]
- Mohan, M.S.; Aswani, S.S.; Aparna, N.S.; Boban, P.T.; Sudhakaran, P.R.; Saja, K. Effect of acute cold exposure on cardiac mitochondrial function: Role of sirtuins. Mol. Cell Biochem. 2023; ahead of print. [Google Scholar] [CrossRef]
- Liu, X.; Xie, X.; Li, D.; Liu, Z.; Zhang, B.; Zang, Y.; Yuan, H.; Shen, C. Sirt3-dependent regulation of mitochondrial oxidative stress and apoptosis contributes to the dysfunction of pancreatic islets after severe burns. Free Radic. Biol. Med. 2023, 198, 59–67. [Google Scholar] [CrossRef]
- Ma, C.; Sun, Y.; Pi, C.; Wang, H.; Sun, H.; Yu, X.; Shi, Y.; He, X. Sirt3 Attenuates Oxidative Stress Damage and Rescues Cellular Senescence in Rat Bone Marrow Mesenchymal Stem Cells by Targeting Superoxide Dismutase 2. Front. Cell Dev. Biol. 2020, 8, 599376. [Google Scholar] [CrossRef]
- Elumalai, S.; Karunakaran, U.; Moon, J.S.; Won, K.C. High glucose-induced PRDX3 acetylation contributes to glucotoxicity in pancreatic β-cells: Prevention by Teneligliptin. Free Radic. Biol. Med. 2020, 160, 618–629. [Google Scholar] [CrossRef]
- de Cubas, L.; Pak, V.V.; Belousov, V.V.; Ayté, J.; Hidalgo, E. The Mitochondria-to-Cytosol H2O2 Gradient Is Caused by Peroxiredoxin-Dependent Cytosolic Scavenging. Antioxidants 2021, 10, 731. [Google Scholar] [CrossRef] [PubMed]
- Hoehne, M.N.; Jacobs, L.J.H.C.; Lapacz, K.J.; Calabrese, G.; Murschall, L.M.; Marker, T.; Kaul, H.; Trifunovic, A.; Morgan, B.; Fricker, M.; et al. Spatial and temporal control of mitochondrial H2O2 release in intact human cells. EMBO J. 2022, 41, e109169. [Google Scholar] [CrossRef] [PubMed]
- Pak, V.V.; Ezeriņa, D.; Lyublinskaya, O.G.; Pedre, B.; Tyurin-Kuzmin, P.A.; Mishina, N.M.; Thauvin, M.; Young, D.; Wahni, K.; Martínez Gache, S.A.; et al. Ultrasensitive Genetically Encoded Indicator for Hydrogen Peroxide Identifies Roles for the Oxidant in Cell Migration and Mitochondrial Function. Cell Metab. 2020, 31, 642–653. [Google Scholar] [CrossRef]
- Alshaabi, H.; Shannon, N.; Gravelle, R.; Milczarek, S.; Messier, T.; Cunniff, B. Miro1-mediated mitochondrial positioning supports subcellular redox status. Redox Biol. 2021, 38, 101818. [Google Scholar] [CrossRef]
- Berry, B.J.; Wojtovich, A.P. Mitochondrial light switches: Optogenetic approaches to control metabolism. FEBS J. 2020, 287, 4544–4556. [Google Scholar] [CrossRef] [PubMed]
- Onukwufor, J.O.; Farooqi, M.A.; Vodičková, A.; Koren, S.A.; Baldzizhar, A.; Berry, B.J.; Beutner, G.; Porter, G.A., Jr.; Belousov, V.; Grossfield, A.; et al. A reversible mitochondrial complex I thiol switch mediates hypoxic avoidance behavior in C. elegans. Nat. Commun. 2022, 13, 2403. [Google Scholar] [CrossRef]
- den Toom, W.T.F.; van Soest, D.M.K.; Polderman, P.E.; van Triest, M.H.; Bruurs, L.J.M.; De Henau, S.; Burgering, B.M.T.; Dansen, T.B. Oxygen-consumption based quantification of chemogenetic H2O2 production in live human cells. Free Radic. Biol. Med. 2023, 206, 134–142. [Google Scholar] [CrossRef]
- Fang, J.; Zhang, Y.; Gerencser, A.A.; Brand, M.D. Effects of sugars, fatty acids and amino acids on cytosolic and mitochondrial hydrogen peroxide release from liver cells. Free Radic. Biol. Med. 2022, 188, 92–102. [Google Scholar] [CrossRef]
- Fang, J.; Wong, H.S.; Brand, M.D. Production of superoxide and hydrogen peroxide in the mitochondrial matrix is dominated by site IQ of complex I in diverse cell lines. Redox Biol. 2020, 37, 101722. [Google Scholar] [CrossRef]
- Goncalves, R.L.S.; Watson, M.A.; Wong, H.S.; Orr, A.L.; Brand, M.D. The use of site-specific suppressors to measure the relative contributions of different mitochondrial sites to skeletal muscle superoxide and hydrogen peroxide production. Redox Biol. 2020, 28, 101341. [Google Scholar] [CrossRef] [PubMed]
- Wong, H.S.; Benoit, B.; Brand, M.D. Mitochondrial and cytosolic sources of hydrogen peroxide in resting C2C12 myoblasts. Free Radic. Biol. Med. 2019, 130, 140–150. [Google Scholar] [CrossRef] [PubMed]
- Dlasková, A.; Hlavatá, L.; Jezek, P. Oxidative stress caused by blocking of mitochondrial complex I H(+) pumping as a link in aging/disease vicious cycle. Int. J. BioChem. Cell Biol. 2008, 40, 1792–1805. [Google Scholar] [CrossRef] [PubMed]
- Plecitá-Hlavatá, L.; Ježek, J.; Ježek, P. Aglycemia keeps mitochondrial oxidative phosphorylation under hypoxic conditions in HepG2 cells. J. Bioenerg. Biomembr. 2015, 47, 467–476. [Google Scholar] [CrossRef] [PubMed]
- Murphy, M.P.; Bayir, H.; Belousov, V.; Chang, C.J.; Davies, K.J.A.; Davies, M.J.; Dick, T.P.; Finkel, T.; Forman, H.J.; Janssen-Heininger, Y.; et al. Guidelines for measuring reactive oxygen species and oxidative damage in cells and in vivo. Nat. Metab. 2022, 4, 651–662. [Google Scholar] [CrossRef] [PubMed]
- Smolyarova, D.D.; Podgorny, O.V.; Bilan, D.S.; Belousov, V.V. A guide to genetically encoded tools for the study of H2O2. FEBS J. 2022, 289, 5382–5395. [Google Scholar] [CrossRef]
- Kostyuk, A.I.; Panova, A.S.; Kokova, A.D.; Kotova, D.A.; Maltsev, D.I.; Podgorny, O.V.; Belousov, V.V.; Bilan, D.S. In Vivo Imaging with Genetically Encoded Redox Biosensors. Int. J. Mol. Sci. 2020, 21, 8164. [Google Scholar] [CrossRef]
- Bilan, D.S.; Belousov, V.V. In Vivo Imaging of Hydrogen Peroxide with HyPer Probes. Antioxid. Redox Signal. 2018, 29, 569–584. [Google Scholar] [CrossRef]
- Bilan, D.S.; Belousov, V.V. Genetically encoded probes for NAD+/NADH monitoring. Free Radic. Biol. Med. 2016, 100, 32–42. [Google Scholar] [CrossRef]
- Besson, E.; Gastaldi, S.; Bloch, E.; Zielonka, J.; Zielonka, M.; Kalyanaraman, B.; Aslan, S.; Karoui, H.; Rockenbauer, A.; Ouari, O.; et al. Embedding cyclic nitrone in mesoporous silica particles for EPR spin trapping of superoxide and other radicals. Analyst 2019, 144, 4194–4203. [Google Scholar] [CrossRef]
- Hardy, M.; Zielonka, J.; Karoui, H.; Sikora, A.; Michalski, R.; Podsiadły, R.; Lopez, M.; Vasquez-Vivar, J.; Kalyanaraman, B.; Ouari, O. Detection and Characterization of Reactive Oxygen and Nitrogen Species in Biological Systems by Monitoring Species-Specific Products. Antioxid. Redox Signal. 2018, 28, 1416–1432. [Google Scholar] [CrossRef] [PubMed]
- Davies, M.J. Detection and characterisation of radicals using electron paramagnetic resonance (EPR) spin trapping and related methods. Methods 2016, 109, 21–30. [Google Scholar] [CrossRef]
- Zielonka, J.; Vasquez-Vivar, J.; Kalyanaraman, B. Detection of 2-hydroxyethidium in cellular systems: A unique marker product of superoxide and hydroethidine. Nat. Protoc. 2008, 3, 8–21. [Google Scholar] [CrossRef]
- Shchepinova, M.M.; Cairns, A.G.; Prime, T.A.; Logan, A.; James, A.M.; Hall, A.R.; Vidoni, S.; Arndt, S.; Caldwell, S.T.; Prag, H.A.; et al. MitoNeoD: A Mitochondria-Targeted Superoxide Probe. Cell Chem. Biol. 2017, 24, 1285–1298. [Google Scholar] [CrossRef] [PubMed]
- Lippert, A.R.; Van de Bittner, G.C.; Chang, C.J. Boronate oxidation as a bioorthogonal reaction approach for studying the chemistry of hydrogen peroxide in living systems. Acc. Chem. Res. 2011, 44, 793–804. [Google Scholar] [CrossRef] [PubMed]
- Winterbourn, C.C. Biological production, detection, and fate of hydrogen peroxide. Antioxid. Redox Signal. 2018, 29, 541–551. [Google Scholar] [CrossRef]
- Gatin-Fraudet, B.; Ottenwelter, R.; Le Saux, T.; Norsikian, S.; Pucher, M.; Lombès, T.; Baron, A.; Durand, P.; Doisneau, G.; Bourdreux, Y.; et al. Evaluation of borinic acids as new, fast hydrogen peroxide-responsive triggers. Proc. Natl. Acad. Sci. USA 2021, 118, e2107503118. [Google Scholar] [CrossRef]
- Zielonka, J.; Sikora, A.; Hardy, M.; Joseph, J.; Dranka, B.P.; Kalyanaraman, B. Boronate probes as diagnostic tools for real time monitoring of peroxynitrite and hydroperoxides. Chem. Res. Toxicol. 2012, 25, 1793–1799. [Google Scholar] [CrossRef]
- Cocheme’, H.M.; Logan, A.; Prime, T.A.; Abakumova, I.; Quin, C.; McQuaker, S.J.; Patel, J.V.; Fearnley, I.M.; James, A.M.; Porteous, C.M.; et al. Using the mitochondria-targeted ratiometric mass spectrometry probe MitoB to measure H2O2 in living Drosophila. Nat. Protoc. 2012, 7, 946–958. [Google Scholar] [CrossRef]
- Morgan, B.; Van Laer, K.; Owusu, T.N.; Ezeriņa, D.; Pastor-Flores, D.; Amponsah, P.S.; Tursch, A.; Dick, T.P. Real-time monitoring of basal H2O2 levels with peroxiredoxin-based probes. Nat. Chem. Biol. 2016, 12, 437–443. [Google Scholar] [CrossRef]
- Kritsiligkou, P.; Shen, T.K.; Dick, T.P. A comparison of Prx- and OxyR-based H2O2 probes expressed in S. cerevisiae. J. Biol. Chem. 2021, 297, 100866. [Google Scholar] [CrossRef]
- Carmona, M.; de Cubas, L.; Bautista, E.; Moral-Blanch, M.; Medraño-Fernández, I.; Sitia, R.; Boronat, S.; Ayté, J.; Hidalgo, E. Monitoring cytosolic H2O2 fluctuations arising from altered plasma membrane gradients or from mitochondrial activity. Nat. Commun. 2019, 10, 4526. [Google Scholar] [CrossRef] [PubMed]
- Castejon-Vega, B.; Cordero, M.D.; Sanz, A. How the Disruption of Mitochondrial Redox Signalling Contributes to Ageing. Antioxidants 2023, 12, 831. [Google Scholar] [CrossRef] [PubMed]
- Vicente-Gutierrez, C.; Bonora, N.; Bobo-Jimenez, V.; Jimenez-Blasco, D.; Lopez-Fabuel, I.; Fernandez, E.; Josephine, C.; Bonvento, G.; Enriquez, J.A.; Almeida, A.; et al. Astrocytic mitochondrial ROS modulate brain metabolism and mouse behaviour. Nat. Metab. 2019, 1, 201–211. [Google Scholar] [CrossRef] [PubMed]
- Dumont, A.; Lee, M.; Barouillet, T.; Murphy, A.; Yvan-Charvet, L. Mitochondria orchestrate macrophage effector functions in atherosclerosis. Mol. Aspects. Med. 2021, 77, 100922. [Google Scholar] [CrossRef]
- Guzy, R.D.; Sharma, B.; Bell, E.; Chandel, N.S.; Schumacker, P.T. Loss of the SdhB, but Not the SdhA, subunit of complex II triggers reactive oxygen species-dependent hypoxia-inducible factor activation and tumorigenesis. Mol. Cell. Biol. 2008, 28, 718–731. [Google Scholar] [CrossRef]
- Bastin, J.; Sroussi, M.; Nemazanyy, I.; Laurent-Puig, P.; Mouillet-Richard, S.; Djouadi, F. Downregulation of mitochondrial complex I induces ROS production in colorectal cancer subtypes that differently controls migration. J. Transl. Med. 2023, 21, 522. [Google Scholar] [CrossRef]
- Wen, Y.A.; Xiong, X.; Scott, T.; Li, A.T.; Wang, C.; Weiss, H.L.; Tan, L.; Bradford, E.; Fan, T.W.M.; Chandel, N.S.; et al. The mitochondrial retrograde signaling regulates Wnt signaling to promote tumorigenesis in colon cancer. Cell Death Differ. 2019, 26, 1955–1969. [Google Scholar] [CrossRef]
- Comito, G.; Calvani, M.; Giannoni, E.; Bianchini, F.; Calorini, L.; Torre, E.; Migliore, C.; Giordano, S.; Chiarugi, P. HIF1alpha stabilization by mitochondrial ROS promotes Met-dependent invasive growth and vasculogenic mimicry in melanoma cells. Free Radic. Biol. Med. 2011, 51, 893–904. [Google Scholar] [CrossRef]
- Capeloa, T.; Van de Velde, J.A.; d’Hose, D.; Lipari, S.G.; Derouane, F.; Hamelin, L.; Bedin, M.; Vazeille, T.; Duhoux, F.P.; Murphy, M.P.; et al. Inhibition of Mitochondrial Redox Signaling with MitoQ Prevents Metastasis of Human Pancreatic Cancer in Mice. Cancers 2022, 14, 4918. [Google Scholar] [CrossRef]
- Swisa, A.; Glaser, B.; Dor, Y. Metabolic stress and compromised identity of pancreatic beta cells. Front. Genet. 2017, 8, 21. [Google Scholar] [CrossRef] [PubMed]
- Apostolova, N.; Vezza, T.; Muntane, J.; Rocha, M.; Víctor, V.M. Mitochondrial Dysfunction and Mitophagy in Type 2 Diabetes: Pathophysiology and Therapeutic Targets. Antioxid. Redox Signal. 2023, 39, 278–320. [Google Scholar] [CrossRef] [PubMed]
- Ayer, A.; Fazakerley, D.J.; James, D.E.; Stocker, R. The role of mitochondrial reactive oxygen species in insulin resistance. Free Radic. Biol. Med. 2022, 179, 339–362. [Google Scholar] [CrossRef] [PubMed]
- Aon, M.A.; Cortassa, S.; Marban, E.; O’Rourke, B. Synchronized whole cell oscillations in mitochondrial metabolism triggered by a local release of reactive oxygen species in cardiac myocytes. J. Biol. Chem. 2003, 278, 44735–44744. [Google Scholar] [CrossRef] [PubMed]
- Nanadikar, M.S.; Vergel Leon, A.M.; Guo, J.; van Belle, G.J.; Jatho, A.; Philip, E.S.; Brandner, A.F.; Böckmann, R.A.; Shi, R.; Zieseniss, A.; et al. IDH3γ functions as a redox switch regulating mitochondrial energy metabolism and contractility in the heart. Nat. Commun. 2023, 14, 2123. [Google Scholar] [CrossRef] [PubMed]
- Rukavina-Mikusic, I.A.; Rey, M.; Adán Areán, J.S.; Vanasco, V.; Alvarez, S.; Valdez, L.B. Mitochondrial H2O2 metabolism as central event of heart complex I syndrome in early diabetes. Free Radic. Biol. Med. 2023, 201, 66–75. [Google Scholar] [CrossRef]
- Guzy, R.D.; Hoyos, B.; Robin, E.; Chen, H.; Liu, L.; Mansfield, K.D.; Simon, M.C.; Hammerling, U.; Schumacker, P.T. Mitochondrial complex III is required for hypoxia-induced ROS production and cellular oxygen sensing. Cell Metab. 2005, 1, 401–408. [Google Scholar] [CrossRef]
- Waypa, G.B.; Marks, J.D.; Guzy, R.; Mungai, P.T.; Schriewer, J.; Dokic, D.; Schumacker, P.T. Hypoxia triggers subcellular compartmental redox signaling in vascular smooth muscle cells. Circ. Res. 2010, 106, 526–535. [Google Scholar] [CrossRef]
- Nazarewicz, R.R.; Dikalova, A.E.; Bikineyeva, A.; Dikalov, S.I. Nox2 as a potential target of mitochondrial superoxide and its role in endothelial oxidative stress. Am. J. Physiol. 2013, 305, H1131–H1140. [Google Scholar] [CrossRef]
- Salazar, G.; Huang, J.; Feresin, R.G.; Zhao, Y.; Griendling, K.K. Zinc regulates Nox1 expression through a NF-kappaB and mitochondrial ROS dependent mechanism to induce senescence of vascular smooth muscle cells. Free Radic. Biol. Med. 2017, 108, 225–235. [Google Scholar] [CrossRef]
- Daiber, A.; Di Lisa, F.; Oelze, M.; Kroller-Schon, S.; Steven, S.; Schulz, E.; Munzel, T. Crosstalk of mitochondria with NADPH oxidase via reactive oxygen and nitrogen species signalling and its role for vascular function. Br. J. Pharmacol. 2017, 174, 1670–1689. [Google Scholar] [CrossRef] [PubMed]
- Reyes-García, J.; Carbajal-García, A.; Di Mise, A.; Zheng, Y.M.; Wang, X.; Wang, Y.X. Important Functions and Molecular Mechanisms of Mitochondrial Redox Signaling in Pulmonary Hypertension. Antioxidants 2022, 11, 473. [Google Scholar] [CrossRef] [PubMed]
- Moon, J.S.; Lee, S.; Park, M.A.; Siempos, I.I.; Haslip, M.; Lee, P.J.; Yun, M.; Kim, C.K.; Howrylak, J.; Ryter, S.W.; et al. UCP2-induced fatty acid synthase promotes NLRP3 inflammasome activation during sepsis. J. Clin. Investig. 2015, 125, 665–680. [Google Scholar] [CrossRef]
- Horn, A.; Van der Meulen, J.H.; Defour, A.; Hogarth, M.; Sreetama, S.C.; Reed, A.; Scheffer, L.; Chandel, N.S.; Jaiswal, J.K. Mitochondrial redox signaling enables repair of injured skeletal muscle cells. Sci. Signal. 2017, 10, eaaj1978. [Google Scholar] [CrossRef]
- Garcia, S.; Nissanka, N.; Mareco, E.A.; Rossi, S.; Peralta, S.; Diaz, F.; Rotundo, R.L.; Carvalho, R.F.; Moraes, C.T. Overexpression of PGC-1alpha in aging muscle enhances a subset of young-like molecular patterns. Aging Cell 2018, 17, e12707. [Google Scholar] [CrossRef] [PubMed]
- Zhou, R.; Yazdi, A.S.; Menu, P.; Tschopp, J. A role for mitochondria in NLRP3 inflammasome activation. Nature 2011, 469, 221–225. [Google Scholar] [CrossRef]
- Zhong, Z.; Liang, S.; Sanchez-Lopez, E.; He, F.; Shalapour, S.; Lin, X.J.; Wong, J.; Ding, S.; Seki, E.; Schnabl, B.; et al. New mitochondrial DNA synthesis enables NLRP3 inflammasome activation. Nature 2018, 560, 198–203. [Google Scholar] [CrossRef]
- Moon, J.S.; Nakahira, K.; Chung, K.P.; DeNicola, G.M.; Koo, M.J.; Pabon, M.A.; Rooney, K.T.; Yoon, J.H.; Ryter, S.W.; Stout-Delgado, H.; et al. NOX4-dependent fatty acid oxidation promotes NLRP3 inflammasome activation in macrophages. Nat. Med. 2016, 22, 1002–1012. [Google Scholar] [CrossRef]
Figure 1.
Redox signaling upon insulin secretion, stimulated either with glucose [18,19], ketoisocaproate (KIC) [18], or fatty acid [22]. Schemes show that the ATP-sensitive K+ channel (KATP) is to be closed only when both ATP and H2O2 (redox signaling) act in synergy [18], leading to a threshold depolarization (−50 mV) of the plasma membrane and concomitant opening of the voltage-dependent Ca2+ channels (CaL), allowing the Ca2+ entry and insulin granule vesicles’ exocytosis. With glucose, the pentose phosphate shuttle supplies NADPH [24] (besides so-called redox pyruvate transport shuttles, [19]) for the constitutively expressed NADPH-oxidase isoform 4 (NOX4), which provides cytosolic redox signaling [18]. With KIC, its oxidation provides both ATP and H2O2, which now originates from the mt-matrix-formed superoxide/H2O2 [18]. KIC is oxidized via a series of reactions resembling fatty acid β-oxidation (termed β-like oxidation) [13,14]. Finally, with fatty acid, even at low glucose, fatty acid β-oxidation also provides both ATP and H2O2. Again, H2O2 is of mt matrix origin and redox signaling from mitochondria to the plasma membrane (PM) has to occur. Simultaneously, H2O2 also activates mitochondrial phospholipase iPLA2γ (not shown, for simplicity), which adds a surplus of mt fatty acids for both β-oxidation and the metabotropic GPR40 receptor on PM [22]. GPR40 downstream pathways further stimulate insulin secretion.

Figure 2.
Compartments of mitochondrion. Schemes shows examples of the following: (a) Mitochondrial network as imaged using 4Pi microscopy, i.e., 3D high-resolution fluorescence microscopy (images, such as published in Ref. [28]). (b) Section of a mitochondrial network tubule (such as indicated by the red line in (a)), extracted from 3D FIB/SEM images (see Ref. [33]). The outer mitochondrial membrane (OMM) is highlighted by a green color, similarly to the inner boundary membrane (IBM) and the intermembrane space peripheral (IMSp) between them. Yellow color-coding is used for cristae membranes, shown together with the contained but unresolved proteins. (c) Image of a single crista with already-resolved ATP-synthase dimers and respiratory chain (RC) supercomplexes, adopted from Ref. [34]. Diffusion distances for ubiquinol (QH2) or ubiquinone (Q) are indicated by arrows, as well as the diffusion of protons between the ATP-synthase and RC supercomplexes. Matrix-faced dehydrogenases (DHs) allow QH2 diffusion on the same leaflet, whereas the QH2 diffusion between dehydrogenases facing the intracristal space (ICS) requires a flip/flop of QH2/Q. These are namely glycerol-3-phosphate dehydrogenase (GAPDH) and dihydroorotate dehydrogenase (DHODH).

Figure 3.
Peroxiredoxins of 2-Cys type exemplified by cycles of mt PRDX3. The catalytic cycle of the PRDX3 dodecamer emphasizes the deprotonation of the peroxidatic cysteine into S− (red, protein part denoted as “p”), its oxidation into the sulfenyl state, and concomitant formation of S-S bonds with the resolving cysteines in the proximal subunit of the dimeric couple (dark blue, protein part denoted as “r”). After this, dodecamers occur in an unstable conformation, allowing splitting to dimers, which are reduced (regenerated to the original state) by the thioredoxin (TRX) plus TRXR (omitted). Upon intensive H2O2 flux, a hyperoxidation cycle starts by oxidation into sulfinyls (SO2H), which can stack into the HMW filaments. Sulfinyls can be reduced at the expense of the ATP, being phosphorylated during the first step via a sulfinyl reductase reaction (sulfiredoxin, SRX), followed by TRX/TRXR or glutahione (GSH)/GRX. Redox signaling can exist, when a particular target protein with proximal cysteines interacts with just the peroxiredoxin in a state with disulfides. Protein reduces the peroxiredoxin dimer, whereas being oxidized into disulfides typically alters its function.

Figure 4.
Considered fluxes and redox buffers for deriving the cytosolic redox signal (see Equation (6)).
Figure 4.
Considered fluxes and redox buffers for deriving the cytosolic redox signal (see Equation (6)).


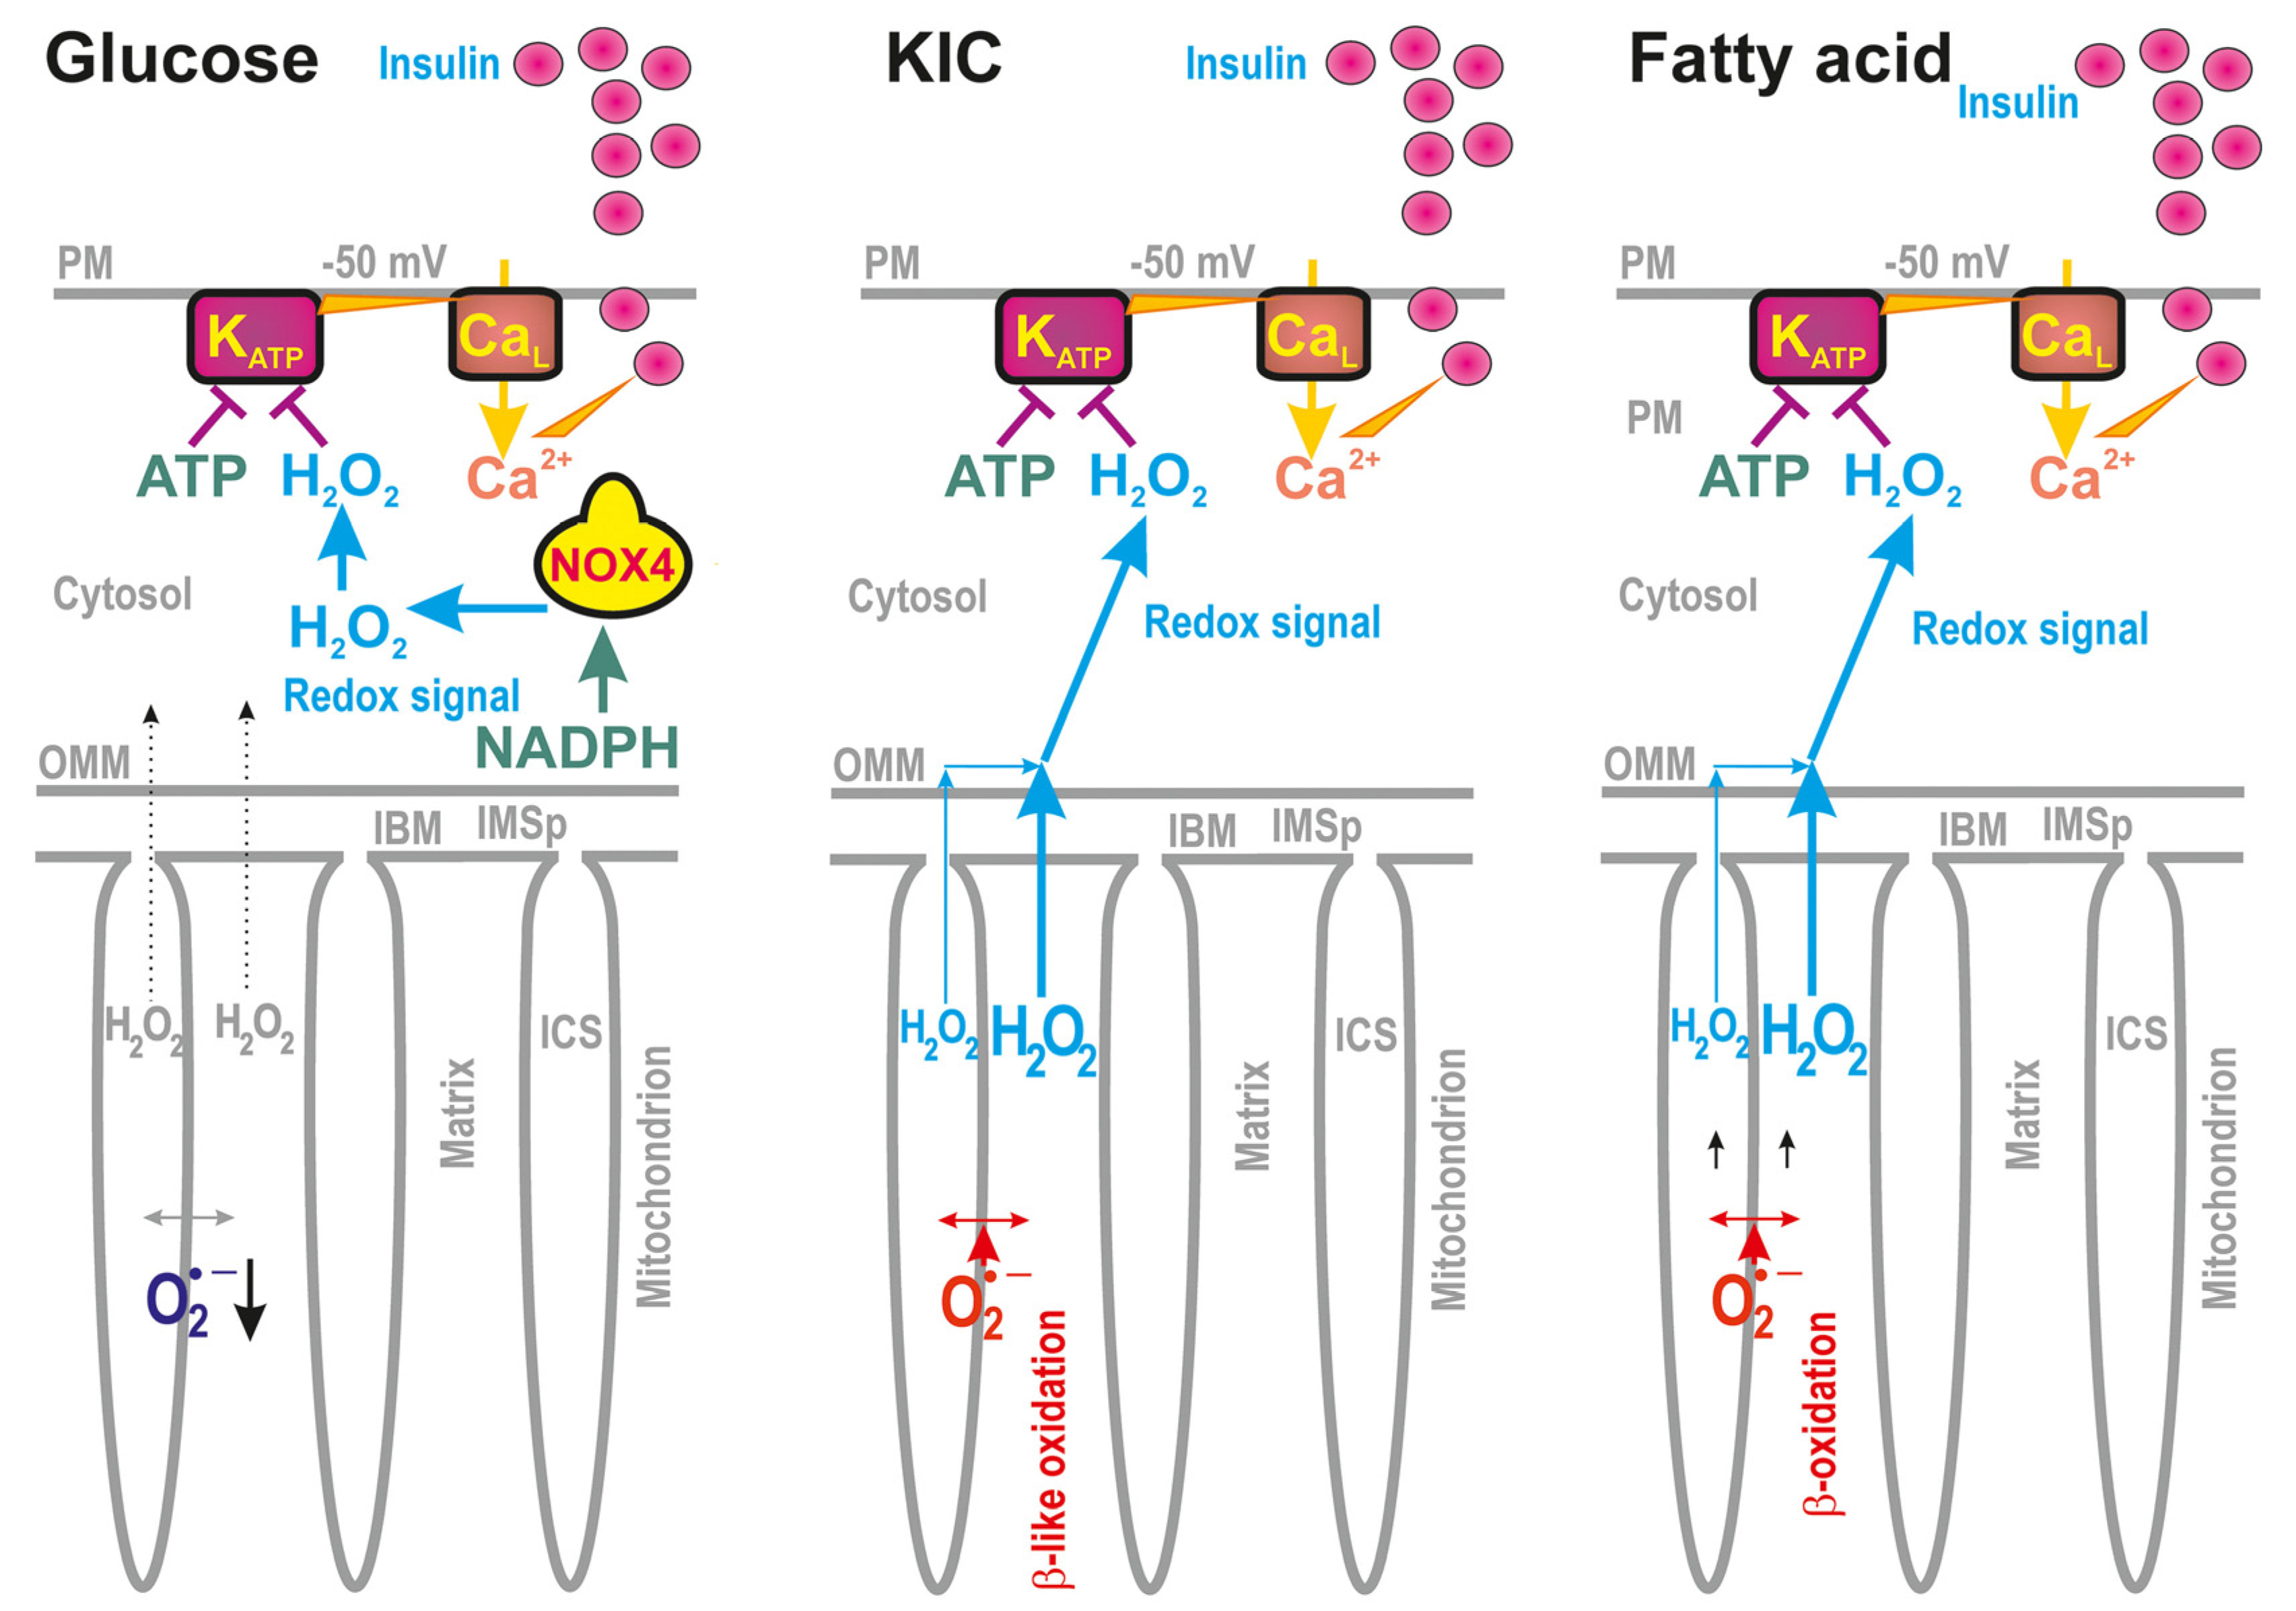
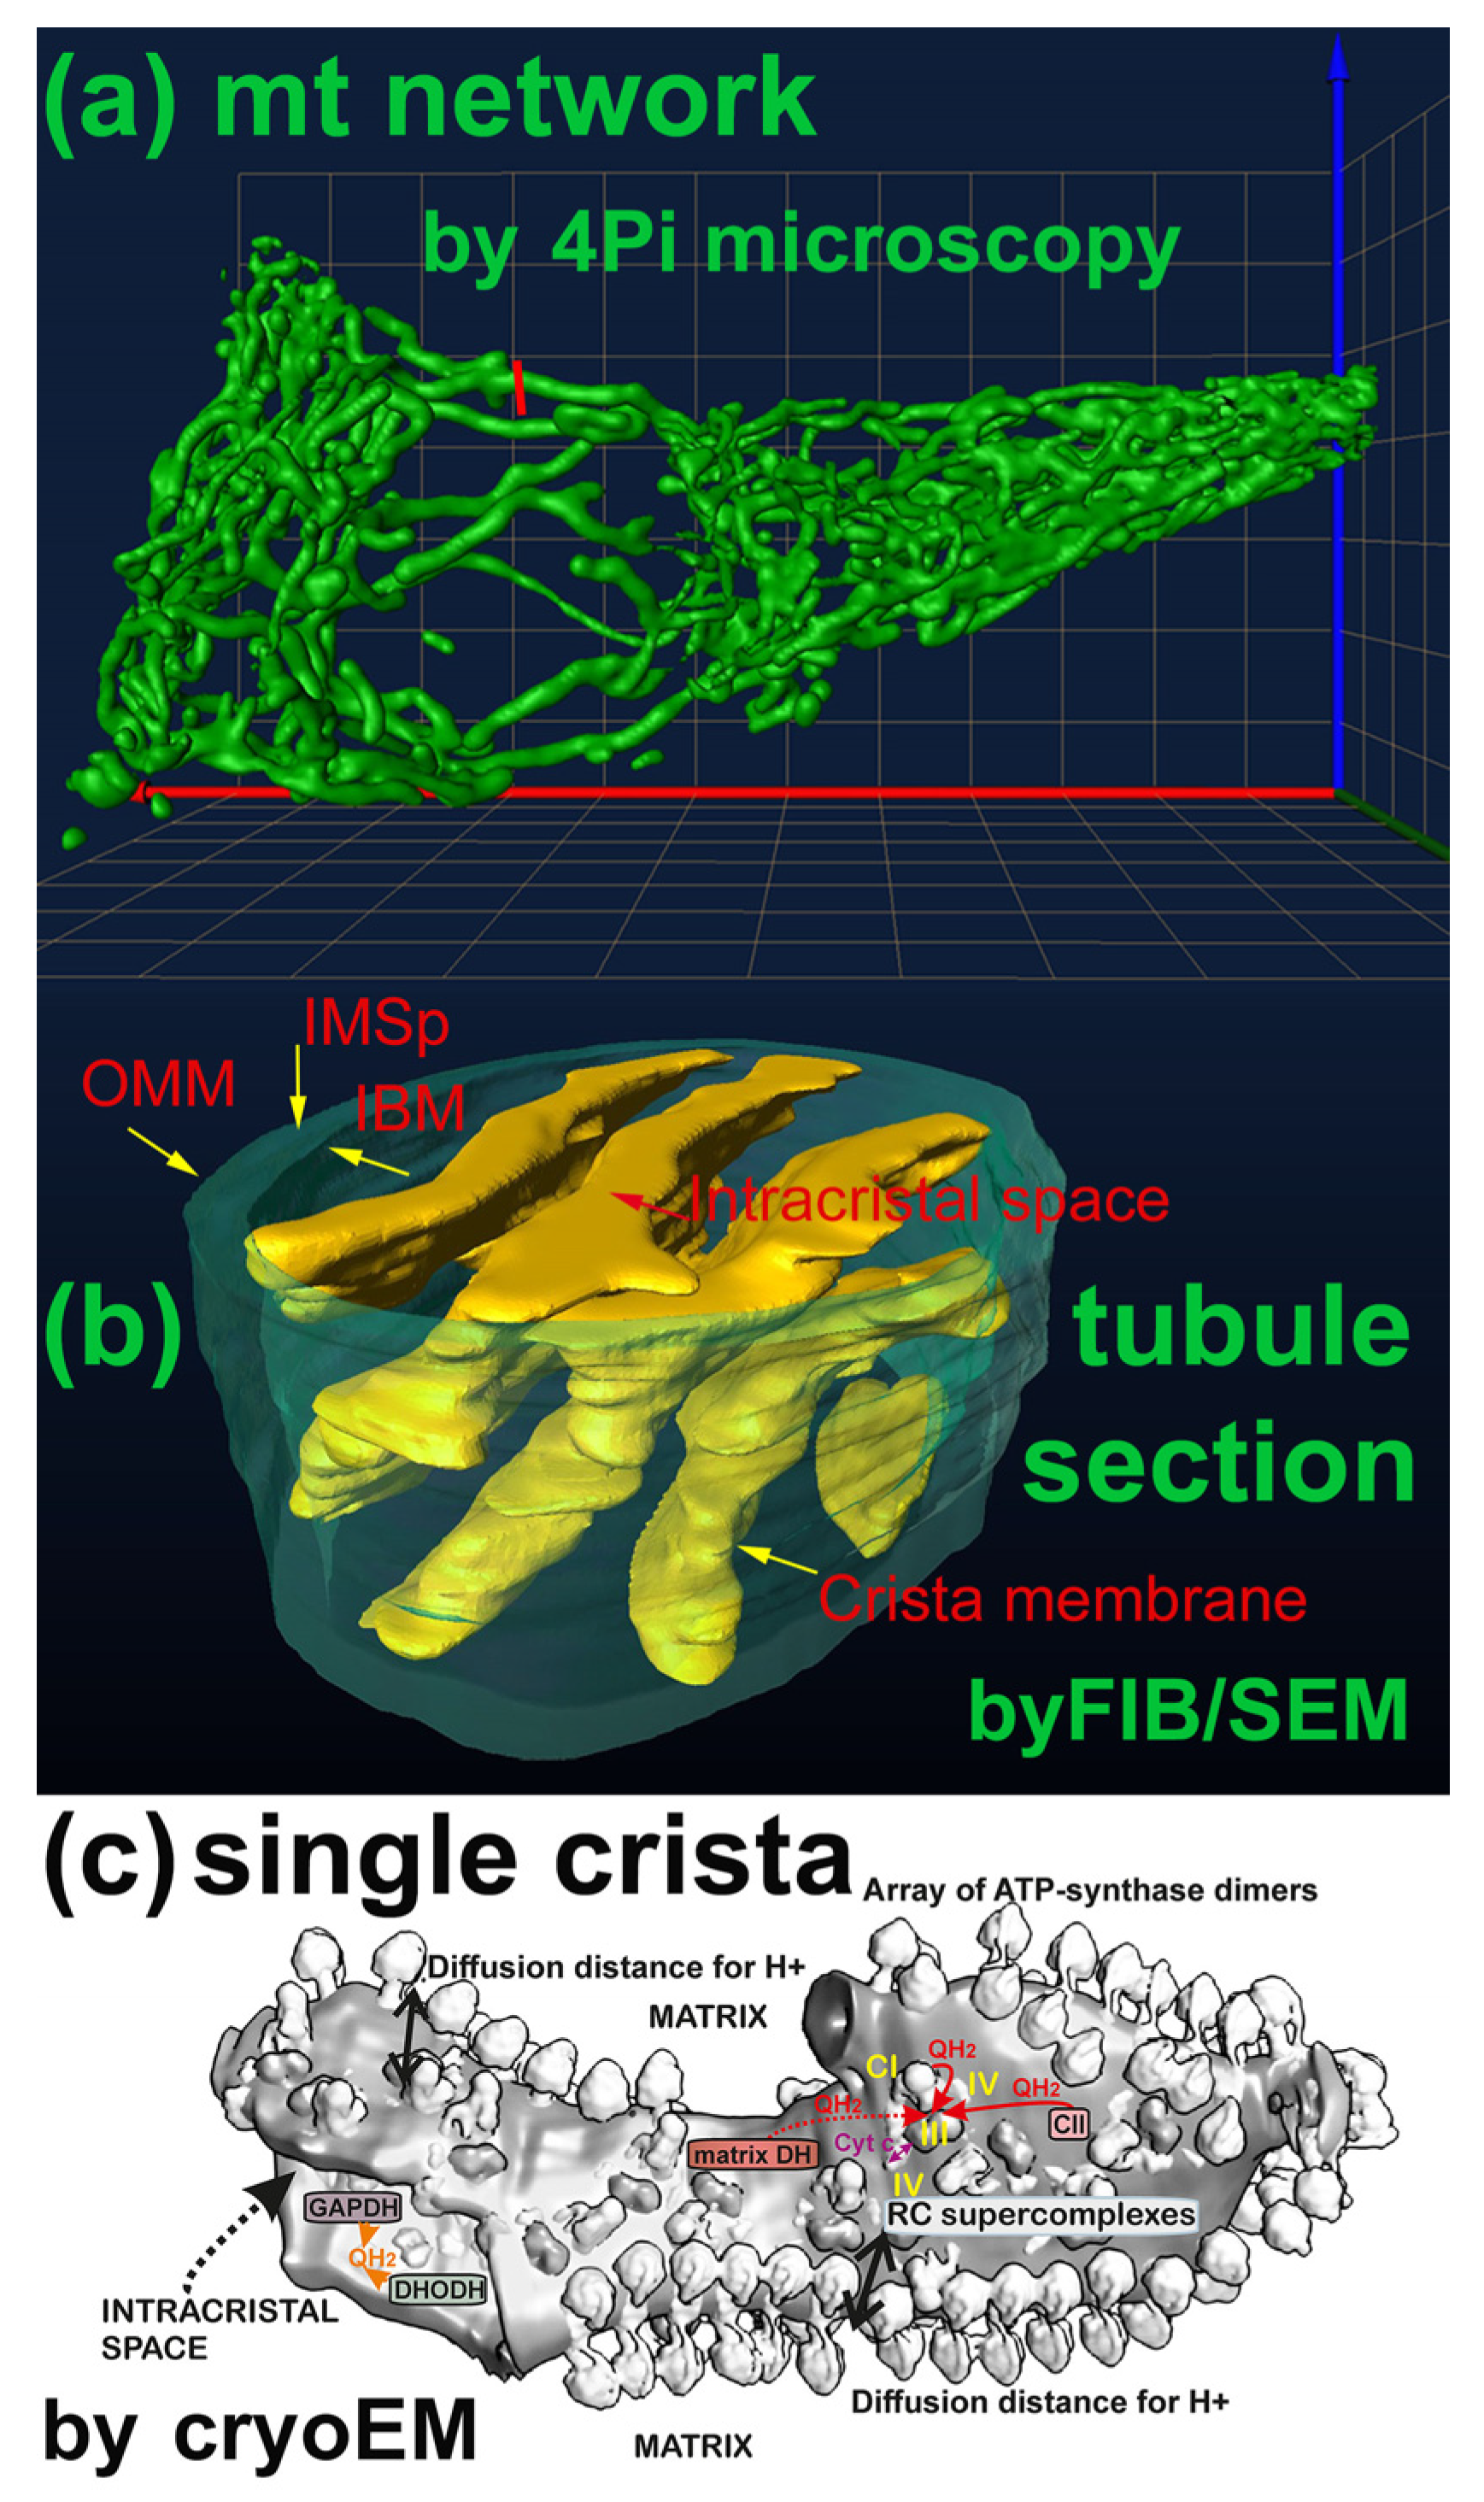
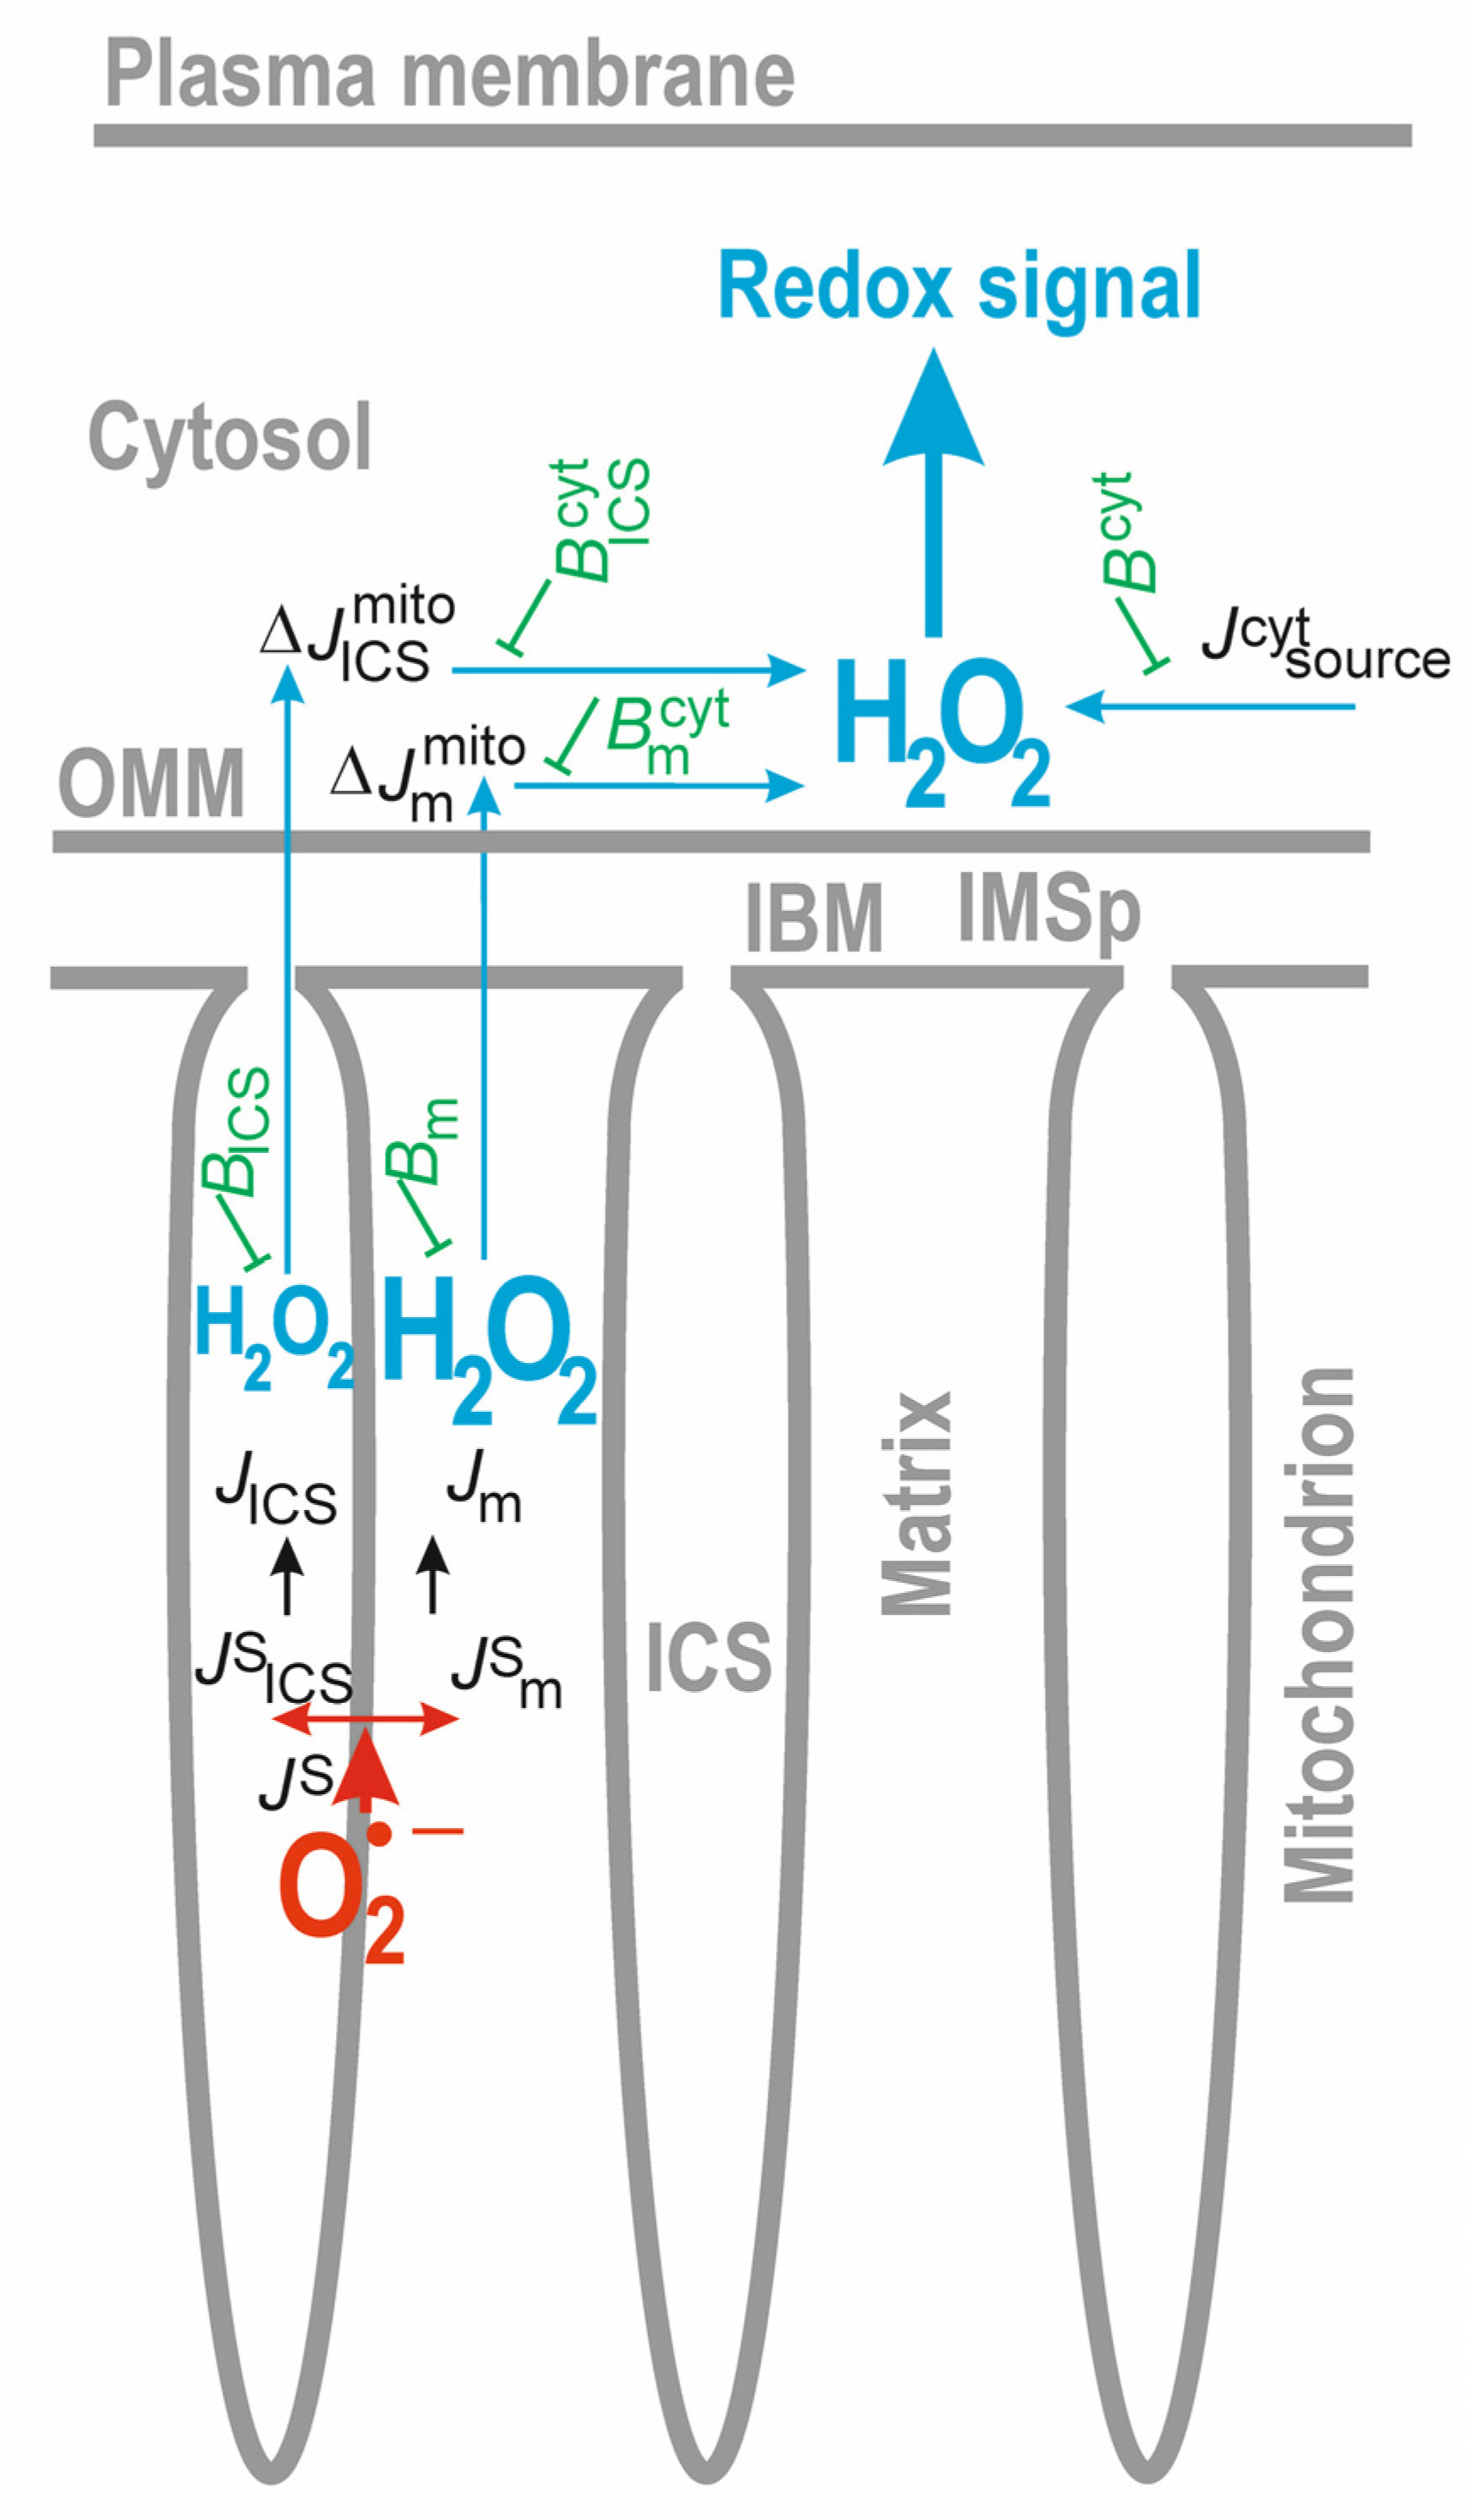
Table 1.
Probes for monitoring of superoxide, H2O2.
| Probe | Advantage/Disadvantage | References |
|---|---|---|
| O2•−, EPR, spin trapping | Rather complex snapshots 1 | [103,104,105] |
| O2•− fluorescence monitoring | ||
| hydroethidine | LC-MS to distinct E+ vs. 2HE+ | [106] |
| NeoD | No DNA intercalation | [107] |
| MitoSOX | Time course 2 vs. background separates 2HE+ | [19,22,96,97] |
| MitoNeoD | No DNA intercalation 3 | [107] |
| H2O2 detection | ||
| Boronate- and borinate-probes | Boronates are insensitive | [108,109,110,111] |
| MitoB | snapshots 1 | [19,112] |
| H2O2 fluorescence monitoring | ||
| HyPer7 | Still insens. for redox signals 4 | [85,86,87,90] |
| MitoHyPer | [19,23,85,86,87,90] | |
| Orp1 | [113] | |
| TSA2 | [114] | |
| TPX1 | [115] | |
| Amplex UltraRed with HRP | Extracellular monitoring | [37,38,40,94] |
| Non-specific ROS fluorescence monitoring | ||
| 2′,7′dichlorodihydrofluorescein | Downstream H2O2 products 5 | [18,98] |
1 Time resolving below minutes is not realistic; 2 see Ref. [19] on how to eliminate ethidium E+ background insensitive to superoxide. 3 But, mtDNA intercalation of MitoSOX is an advantage, since the probe is not redistributed upon potential changes. 4 See Refs. [86,87]. 5 Reacts with several ROS, and not with H2O2 but with products of the H2O2 reaction with redox-active metals, heme proteins, or peroxidase; see Ref. [98].
Table 2.
Pathologies with involvement of impaired redox signaling.
| Disease/Pathological State | Signal Impaired | References |
|---|---|---|
| Aging | Pleiotropic | [116] |
| Astrocyte-related | mt H2O2 | [117] |
| Atherosclerosis | mt H2O2 | [118] |
| Cancer | Complex II—ROS | [119] |
| Colon cancer | mt H2O2 | [120,121] |
| Cancer—melanoma | mt H2O2 | [122] |
| Cancer—pancreatic | mt H2O2 | [123] |
| Diabetes—type 2/Ins gene maintenance, β-cell dedifferentiation | Post-prandial NOX4-H2O2 signals 1 | [18,124] |
| Diabetes—type 2, insulin resistance | Pleiotropic | [125,126] |
| Heart—cardiomyopathy | mt H2O2 | [127,128] |
| Heart—early diabetic | Complex I—ROS | [129] |
| Hypertension—endothelial dysfunction | Complex III—ROS | [130,131] |
| Hypertens—endothelial | mt ROS—induced NOX | [132,133,134] |
| Pulmonary hypertension | mt H2O2 | [135] |
| Sepsis, NLRP3-related | mt H2O2 | [136] |
| Skeletal muscle injury repair | mt H2O2 | [137,138] |
| Various NLRP3-related | mt H2O2 | [139,140] |
| Various NLRP3-related | NOX4, fatty acid β-oxidation | [141] |
1 Still hypothetical.
Disclaimer/Publisher’s Note: The statements, opinions and data contained in all publications are solely those of the individual author(s) and contributor(s) and not of MDPI and/or the editor(s). MDPI and/or the editor(s) disclaim responsibility for any injury to people or property resulting from any ideas, methods, instructions or products referred to in the content. |
© 2023 by the author. Licensee MDPI, Basel, Switzerland. This article is an open access article distributed under the terms and conditions of the Creative Commons Attribution (CC BY) license (https://creativecommons.org/licenses/by/4.0/).
Share and Cite
MDPI and ACS Style
Ježek, P. Pitfalls of Mitochondrial Redox Signaling Research. Antioxidants 2023, 12, 1696. https://doi.org/10.3390/antiox12091696
AMA Style
Ježek P. Pitfalls of Mitochondrial Redox Signaling Research. Antioxidants. 2023; 12(9):1696. https://doi.org/10.3390/antiox12091696
Chicago/Turabian StyleJežek, Petr. 2023. "Pitfalls of Mitochondrial Redox Signaling Research" Antioxidants 12, no. 9: 1696. https://doi.org/10.3390/antiox12091696
Note that from the first issue of 2016, this journal uses article numbers instead of page numbers. See further details here.