
Overview of an Experimental Program for Development of Yield Surfaces Tracing Method
by
 ,
,
Jan Štefan
1,* ,
,
Slavomír Parma
1,
René Marek
1,
Jiří Plešek
1,
Constantin Ciocanel
2 and
Heidi Feigenbaum
2 1
Institute of Thermomechanics of the Czech Academy of Sciences, Dolejškova 1402/5, 182 00 Praha, Czech Republic
2
Department of Mechanical Engineering, Northern Arizona University, 2112 S Huffer Lane, Flagstaff, AZ 86011, USA
*
Author to whom correspondence should be addressed.
Appl. Sci. 2021, 11(16), 7606; https://doi.org/10.3390/app11167606
Submission received: 11 July 2021
/
Revised: 6 August 2021
/
Accepted: 16 August 2021
/
Published: 19 August 2021
(This article belongs to the Topic Metallurgical and Materials Engineering)
Abstract
:This paper develops an experimental technique to evaluate the initial yield surfaces of metallic materials, as well as to study their evolution during plastic flow. The experimental tracing of yield surfaces is necessary for deriving and calibrating more robust phenomenological models of directional distortional hardening. Such models can be used to characterize the behavior of structures experiencing complicated and demanding loading modes, such as multiaxial ratcheting. The experimental technique developed in this work uses thin-walled tubular specimens, along with a servo-hydraulic machine, under various modes of tension/compression and torque. Identification of the onset of plastic flow is based on a small proof equivalent plastic strain evaluated from the outputs of a contact biaxial extensometer firmly attached to a specimen surface. This allows for evaluation of both the initial yield surface, as well as theevolved yield surface after a plastic prestrain. Throughout a test, continuous and fully automatized evaluation of elastic moduli and proof plastic strain is assured through algorithms written in C# language. The current technique is shown to provide promising results to effectively capture the yield surfaces of conventional metallic materials.
1. Introduction
This paper establishes an experimental technique to evaluate yield surfaces of metallic materials, namely a yield surface tracing (YST) method. The concept of a yield surface (YS) is critical to phenomenological plasticity theory and it is defined as a set of yield points (YPs) within a particular stress space that represent the onset of yield in any combination of mixed-mode loading from a predefined initial point. The yield surface may change size, shape and/or location due to plastic flow. YST is an essential tool for acquisition of experimental data required for deriving and calibrating robust phenomenological models of directional distortional hardening (DDH). A fine description of yield surfaces is expected to improve the accuracy of phenomenological modelling predictions for structures experiencing complicated and demanding loading modes. Plausible applications of phenomenological DDH models include, but are not limited to, the processes of forming of metallic products, or predicting the behavior of structures under cyclic loading (e.g., during earthquakes, in service conditions, repetitive wind or wave loading) leading to the accumulation of plastic strain (a phenomenon known as ratcheting) [1].
Despite significant advances in physically-based plasticity models [2,3,4], the phenomenological models are still the most useful for structural applications. The phenomenological approach is based on the concept of substituting the real crystallographic structure with a continuum solid. Thus, phenomenological models tend to require significantly less computational time than the physically-based models. In phenomenological modelling, the YS defines when the material experiences plastic deformation and is often also used as a potential to define the direction of plastic strain accumulation. The mathematical expression of a YS, i.e., a yield criterion, can be written in the following simple form:
where σ is the Cauchy stress tensor:
One of the first and most widely used phenomenological yield criterion is the von Mises criterion, which is based on the concept of equivalent stress (von Mises stress) and is defined as:
Correspondingly, the von Mises yield criterion is written as:
where σy is equal to the yield strength under pure tension, and can be easily derived by setting σ11 = σ and all other stress components to zero into expression (3), resulting in:
By analogy, yield strength for pure shear can be derived by setting σ12 = τ, giving:
which indicates that the onset of plastic flow occurs at a shear stress level which is decreased by the factor of √3 in comparison with the axial yield strength. The von Mises yield criterion is usually suitable for initial yield surfaces of isotropic metallic materials with either no plastic prestrain or with prestress that has been mitigated by annealing.
As the stress state is elevated beyond the yield surface, plastic flow occurs. If the material integrity is preserved throughout the plastic flow, then the YS has to change its size, shape, and/or position in the stress space in order to persistently include the actual stress state in the set of points where yielding occurs. The process is associated with permanent changes of yield strength and is referred to as strain hardening. Elementary phenomenological plasticity theory discerns the two most fundamental strain hardening mechanisms:
- 1.
- Kinematic hardening mechanism that causes translation of a yield surface through stress space. The position of a YS is described with an evolving back-stress parameter, α, representing an offset of the YS center with respect to the origin of the stress space. In this case, the yield criterion (4) takes the following more general form:where sij denotes the components of the deviatoric Cauchy stress tensor:The well-known Bauschinger effect is a typical feature of kinematic hardening.
- 2.
- Isotropic hardening is represented by a uniform expansion of the yield surface in the deviatoric stress space. Strain hardening induces an increase of yield strength not only in the primary loading mode (e.g., tension), but also in any other loading modes (e.g., compression, pure shear, etc.). The yield function of an ideal isotropically hardening material can be described as:
The strain hardening parameter, κ, can be expressed as a function of either the plastic strain energy density accumulated in the material element throughout the plastic flow history
or the equivalent plastic strain which is a time integral of equivalent plastic strain rate:
In practice, however, yield surfaces evolve in a more complicated manner. Apart from translation and expansion, distortion, rotation, or affine deformation can be discerned as separate mechanisms [5]. One of the most important features is sharpening of the forward apex (i.e., in the direction of plastic loading), and flattening of the region at the rear [6,7]. An accompanying phenomenon called cross-effect represents a change in size of the YS in directions perpendicular to the load in deviatoric stress space. A negative cross effect was reported for a low work hardening aluminum alloy in [8], while a positive cross effect was reported for a high work hardening aluminum alloy in [9]. Further evidence on evolution of YS shape under plastic flow was provided by many studies [10,11,12,13,14,15,16,17,18].
Careful experimental identification of yield surface shape is critical to the development and calibration of phenomenological models of plasticity, and their application on real engineering problems [19,20,21,22]. In particular, recent work [23] uses YS shape change to help develop models aimed at improving predictions of multiaxial ratcheting behavior, since conventional models that neglect the YS distortion may not provide satisfactory predictions in this complex loading case [1].
This paper describes the advances of the Laboratory of Thermomechanics in the development of a rigorous procedure for experimental data acquisition of yield surfaces. First, a detailed description of the methods being developed is presented. In short, the YST technique under development is based on loading thin-walled tubular specimens, with a servo-hydraulic testing machine under various combinations of tension/compression and torque. Particular aspects of the experimental design are based on approaches presented by Wu, Yeh 1991 [6], and other authors (e.g., [16,24,25]). Unlike some prior work (e.g., [8,9,26]), the current technique employs proportional loading characterized by regulation of both stress components simultaneously and proportionally with each other. The onset of plastic flow is currently based on a small proof equivalent plastic strain being continuously evaluated from the output of a contact biaxial extensometer of a type similar to those employed in [2,4,16,27]. Second, suitability of the method for effective capture of YSs is demonstrated by results obtained on conventional low-alloyed ferritic steels.
2. Materials and Methods
2.1. Objectives of the Experimental Program
The long-term objective of the Laboratory of Thermomechanics is to develop an accurate and reliable yield surfaces tracing method capable of capturing the yield surface shape and position in a particular stress space under various load conditions. This YST method requires identifying a series of representative yield points constituting a YS. For now, we focus on the axial stress—shear stress space and use hollow cylindrical test specimens. The specimens are subject to prescribed combinations of axial load (tension/compression) and torque. Identification of individual YPs within each of these sequences, being referred to as “probes”, is achieved using an automatized procedure, performing continuous evaluation of prescribed experimental yield point definition. The procedure can not only be used to evaluate the initial YS (i.e., the YS in the as-manufactured state of material), but also to induce an artificial plastic prestrain and to perform tracing of the subsequent YS bearing information on the desired directional distortional hardening evolution.
While prior experimental methods mainly used strain gages to measure the axial and shear strains (e.g., [28,29,30,31]), the current method employs a contact axial/torsional extensometer (EXTM). Similar types of extensometers were also employed in [2,4,16,27]. The decreased precision of the EXTM in comparison with strain gages is well compensated by the following advantages: a simplified and faster procedure to attach the measurement device to the test specimen surface; substantially elevated measurement range allowing the evaluation of multiple YSs without the necessity of frequent reattachment of the EXTM; and the possibility of more automatization of the YS tracing procedure.
2.2. Test Specimens and Materials
The presented experimental method employs thin-walled tubular test specimens (TS) for the testing under combined axial and torsional loading. Figure 1 shows a technical drawing of a TS used for the current YS tracing experiment. TSs were manufactured using conventional machining technologies. The central bore hole was manufactured within a three-stage process starting with rough drilling, followed by precise lathe knife machining, and careful surface finishing using a special reamer.
The relatively high length at both end sections prevents sliding of the TS when subjected to intensive loadings. The TS is clamped in hydraulically actuated grips with V-serrated jaw faces. The end sections are filled/reinforced with steel pin inserts. The design of the TS’s central section provides the cross-section with sufficient stiffness preventing buckling and the occurrence of other instabilities possibly associated with the complex loading modes and intensities.
Two conventional non-alloyed ferritic steel grades were investigated in this work. The first grade, P250GH (W. Nr. 1.0460, or C22G2) is designated for applications on weldable parts of pressure vessels and piping exposed to elevated temperatures. The second grade, S235JR (W. Nr. 1.0122), belongs to a group of ordinary weldable steels commonly used for less demanding parts of structures as halls, bridges, cranes, etc. The composition of these alloys is shown in Table 1 and Table 2, respectively. Some preliminary results on the initial YSs tracing of alternative ferritic steels can be found in previously reported work [1]. Current results are particularly enriched by the measurement of subsequent yield surfaces.
2.3. Apparatus
An axial-torsional Instron 8852 universal hydraulic testing machine (UTM), equipped with 100 kN axial and 1 kNm torsional fatigue rated load cells and an Epsilon Tech 3550 biaxial extensometer comprise the core experimental apparatus. The UTM can exert loading sequences at arbitrary combination of the axial load and torque to a TS clamped in hydraulic grips. The UTM is driven by a powerful external hydraulic power unit that can induce maximum plastic strain in the TSs. The Dynacell load transducer has 0.5 class precision load measurements rating. The experiments were controlled, and test input parameters specified using a proprietary software, WaveMatrix 2, installed on a desktop computer interfaced with the UTM controller. Advanced algorithms for the YST test control, the evaluation of elastic moduli, elastic and plastic components of both axial and shear strains, as well as the evaluation of equivalent plastic strain, are written in C# language.
The Epsilon Tech 3550 axial/torsional extensometer was used for the contact measurement of both axial and shear strain in the test specimen reduced section. The EXTM gage length of Lg = 25 mm covers >80% of the reduced TS length (Lc) of 30 mm. Measurement range is 5% for axial strain and 3 deg for torsional shear strain angle corresponding to a 5.2% shear strain. EXTM compatibility with the testing machine enables feedback control of the test, i.e., the possibility of performance of strain-controlled loading on the basis of the EXTM output.
2.4. Experimental Procedure
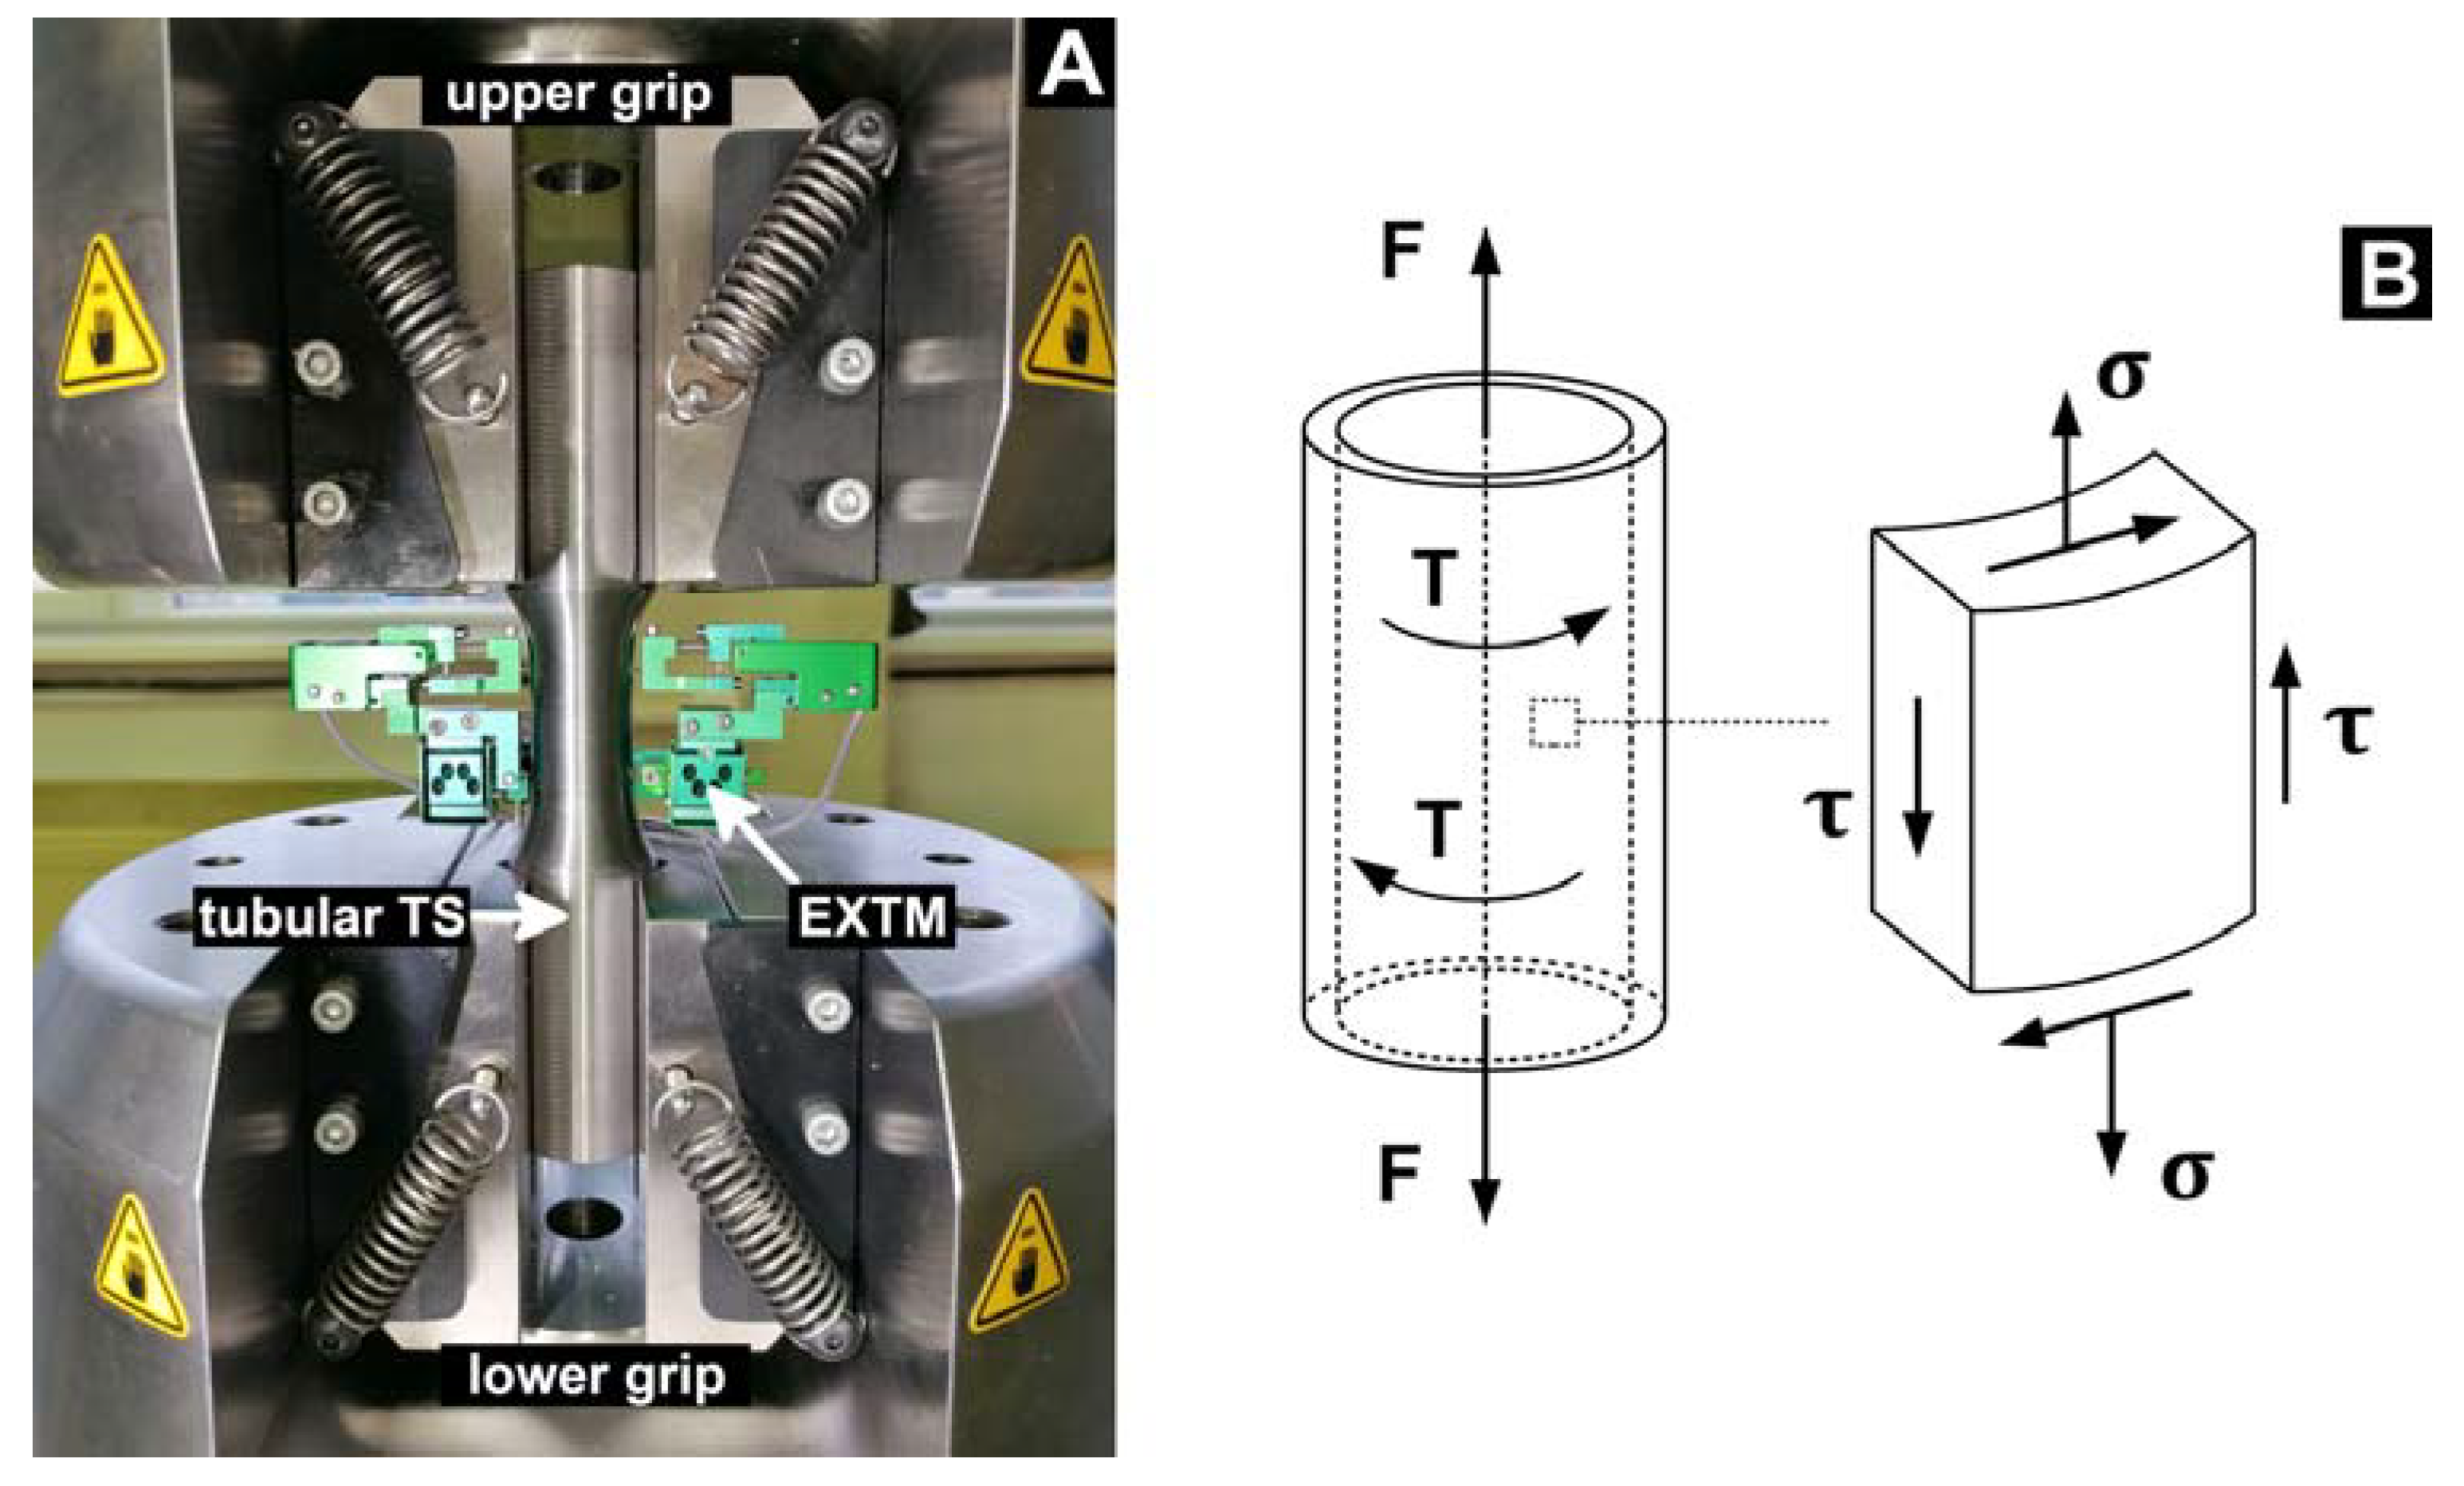
The stress state within a thin-walled tubular TS under combined tensile and torsional loading can be described as a superposition of a pure tensile stress state and a pure shear stress state, i.e.:
The stress state is schematically depicted in Figure 2B.
Consequently, the von Mises stress (3), and the corresponding von Mises yield criterion (4) can be simplified into the following forms:
In the subsequent procedures, both the axial and the shear true stresses are replaced by “engineering” quantities and expressed by the following simple relationships:
where F and T are the axial force and the torsional moment, respectively, do is the outer diameter and di is the internal diameter of the TS’s initial cross-section.
As indicated in Section 2.1, the yield surface tracing procedure is performed by a series of probes, each contributing a single yield point on the current yield surface. A probe is a very slow stress-controlled loading sequence characterized by elevation of both stress components proportionally with each other. As a special case, one of the stress components could be kept at zero for achieving either pure axial or pure torsional loading.
Below is a detailed procedure for tracing of the initial YS:
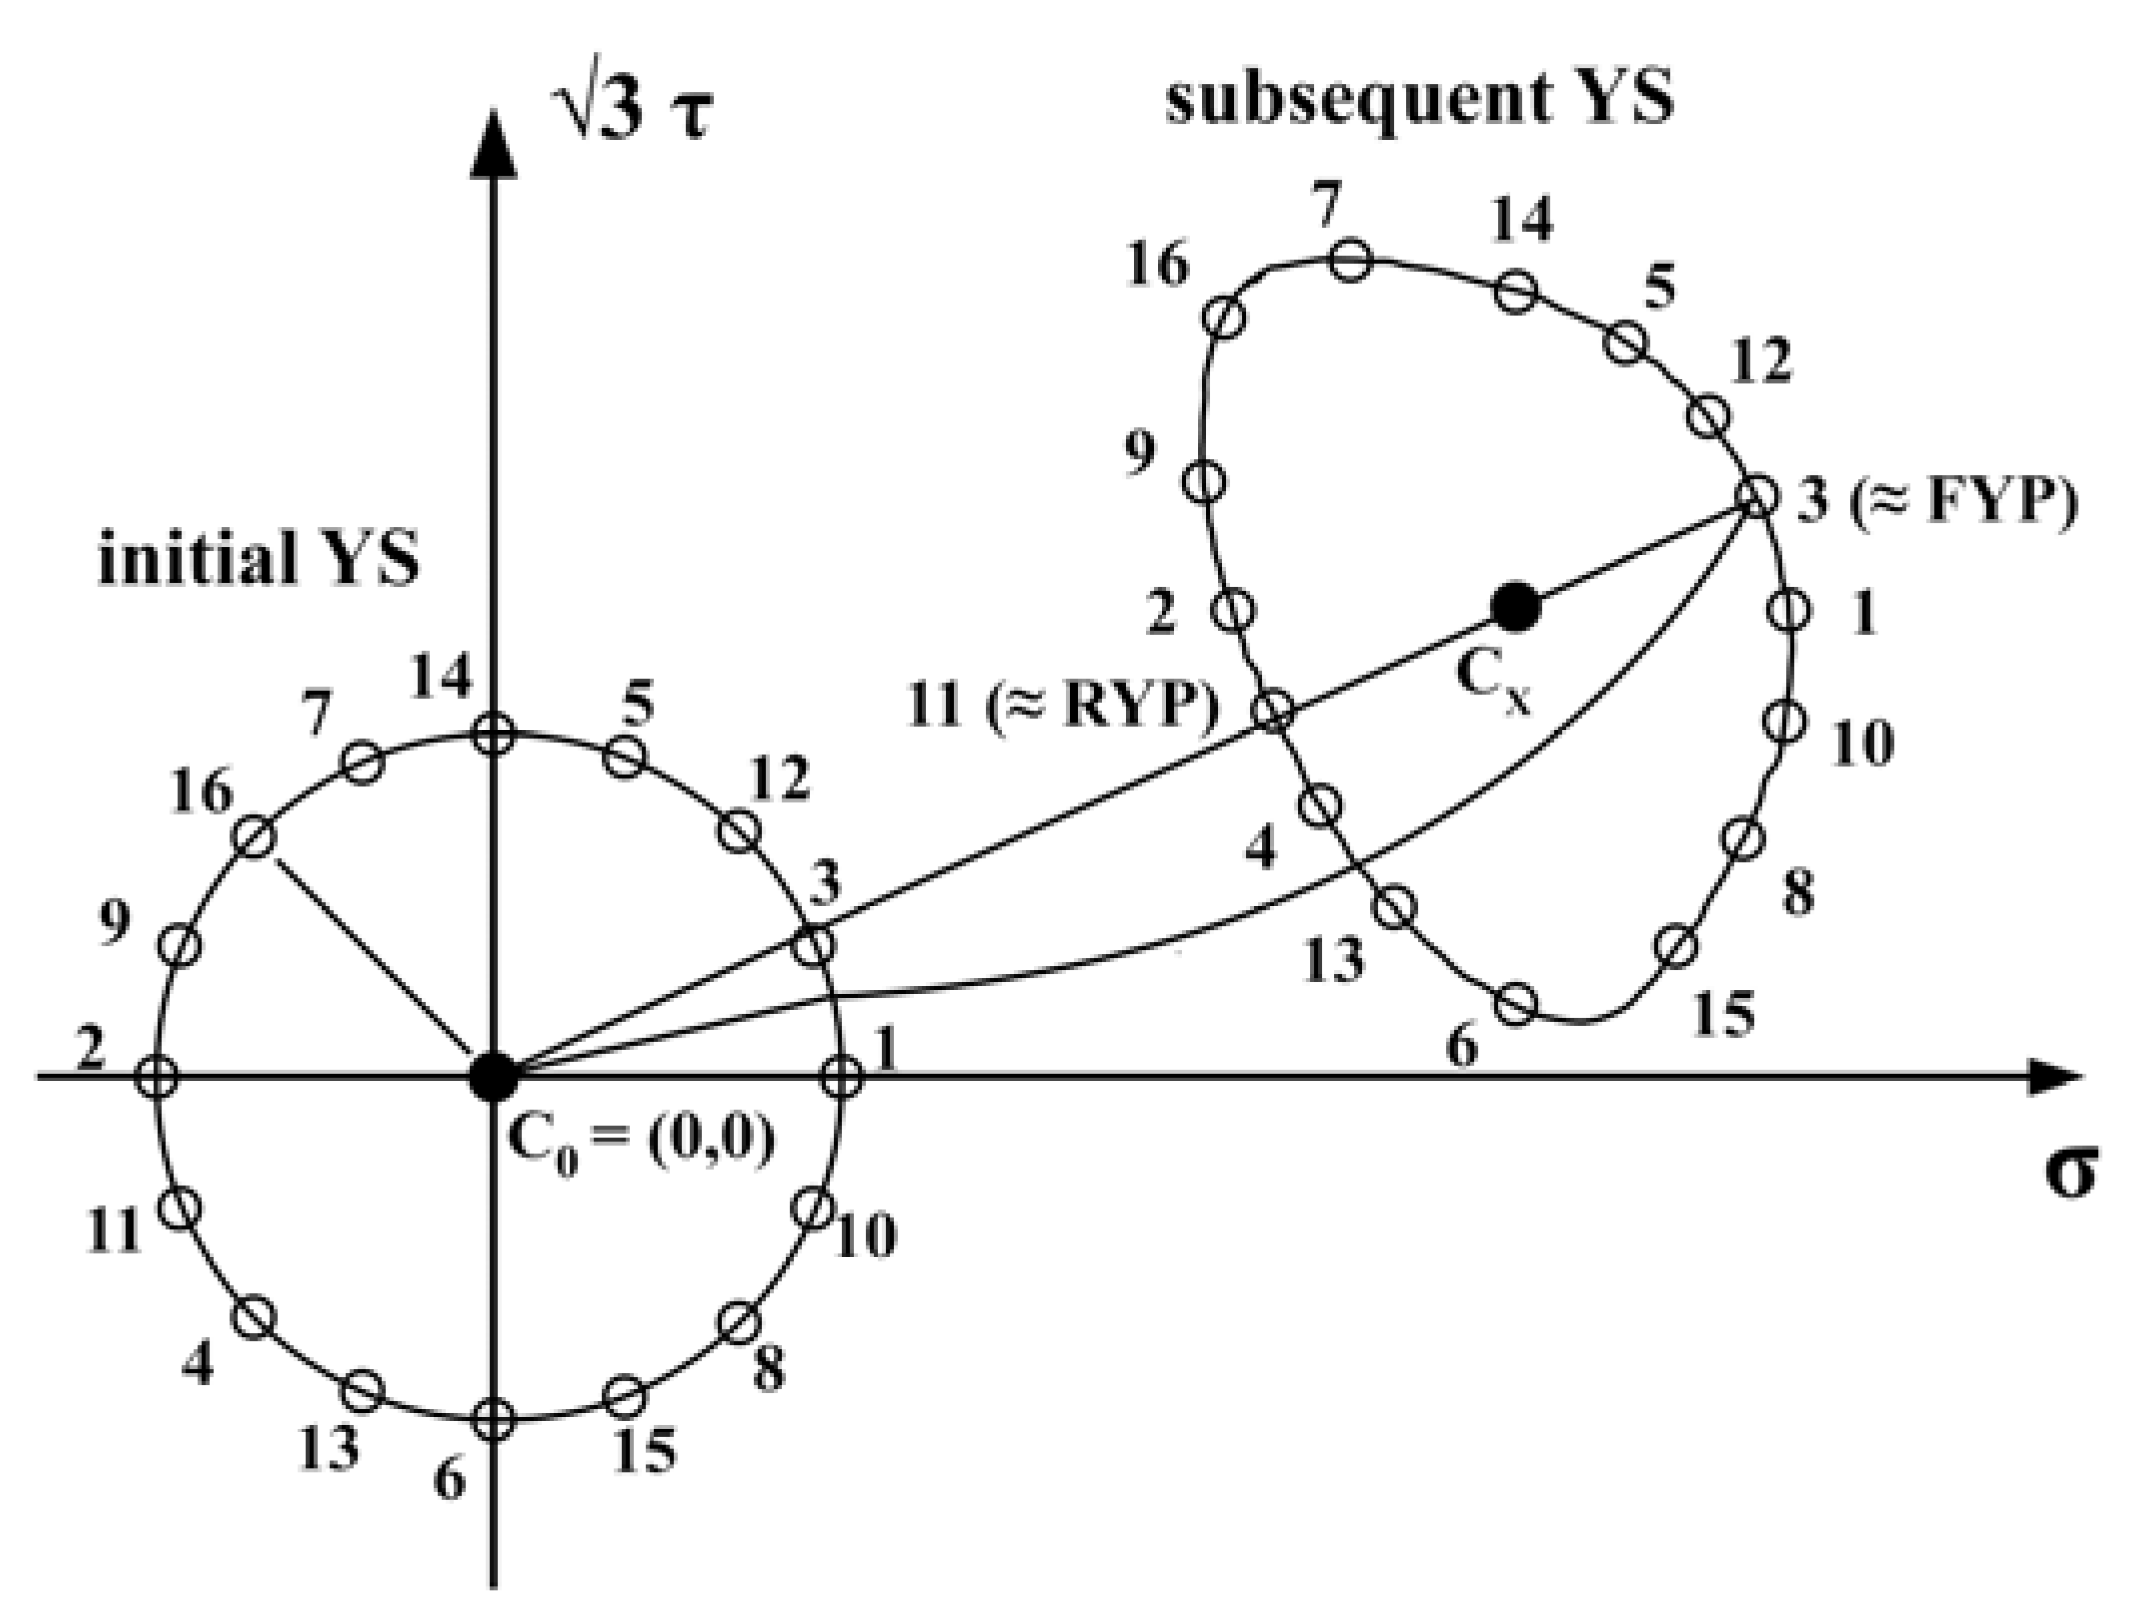
- The test specimen begins unloaded (i.e., zero stress). This centerpoint of the initial yield surface is represented by “C0” in Figure 3.
- Probe #1 is conducted in order to evaluate the first yield point. While probing, the stress is gradually increased until a yield point is clearly determined by fulfilment of a particular experimental YP definition described below.
- Once a YP is detected, further loading ceases and the specimen is unloaded back to the stress level corresponding to the centerpoint.
- The process is finished by unloading to the centerpoint.
All probes are characterized by an identical magnitude of an overall stress rate given by an implicit relationship analogous to (13):
The factor of √3 in the shear term is convenient for consistency with the (σ, √3τ) stress space used for the YS, where the von Mises yield surface (14) possesses a circular shape.
The procedure for subsequent YS tracing is basically equivalent to that of the initial YS. It is preceded by application of a desired level of plastic prestrain to the specimen. However, there is an important difference for probing that consists in the reassessment of the center-point, that is updated to “Cx” showed in Figure 3. This step is necessary due to intensive drift of the initial YS through the stress space. The drift is a feature of kinematic strain hardening and was confirmed in [8,9,26] to be sufficiently intensive to drift the YS far away from the origin of the stress space, as schematically depicted in Figure 3. As the stress-free state is no longer enclosed by the YS, complete unload would result in an undesirable reverse plasticity. Hence, the process of subsequent YS tracing is designed into the following steps:
- Starting from the centerpoint from the previous load, the specimen is subject to strain-controlled loading in order to achieve the desired levels of axial and shear plastic prestrains.
- A relaxation period is applied by keeping strain at the desired level for a period of 10 min. The final stress state defines an approximate forward yield point (FYP in Figure 3).
- An approximate reverse yield point (RYP) is evaluated by a steady unload towards the preceding centerpoint.
- A new centerpoint (Cx in Figure 3) is defined at a stress state half between RYP and FYP.
- Subsequently, a probing procedure identical to that applied for the initial YS tracing is conducted and finished at the centerpoint.
Careful selection of an appropriate YP definition is crucial for clear identification of yield points. The YP definition needs to be suitable for any individual probe characterized by different levels of both stress components. There were several yield criteria used in the past:
- “Lode backward extrapolation” method (e.g., [32]) defines a YP as intersection of a backward extrapolation line of a stress-strain curve with the elastic line or the ordinate. This method, however, requires an excessive amount of plastic overstrain, so that a specimen is suitable only for the determination of a single YP.
- “Deviation from linearity” method assigns the YP equal to the limit of proportionality of the stress strain curve. The method was introduced and particularly highlighted by Phillips [28,30,31] because of excellent consistency of experimental results. However, extremely high-level accuracy of strain measurement (on the order of units of microstrains, µε, 10−6) is required.
A YP definition denoted as “small proof plastic strain” is implemented into the current YS tracing method. A YP is identified based on the equivalent plastic strain increment developed throughout a probe and calculated using the following fundamental relationship:
Terms under the square root in (18), i.e., the axial and the shear plastic strain increments, can be expressed as follows:
All terms in (19) are schematically identified in Figure 4 showing an axial stress–strain record of a single probe. The total strain values, ε, γ, are measured directly with the extensometer, the elastic parts are calculated from the following relationships based on the Hooke’s law:
A vital part of the procedure is an algorithm that continuously and automatically performs a least squares linear regression analysis to fit the elastic part of the stress–strain curve throughout a probe. There are two primary outputs: the elastic moduli (Young’s modulus, E, and shear modulus, G) as slopes, and the residual strains (εR, γR) as offsets. Elastic strain components (εel, γel) are calculated subsequently and used to evaluate the total equivalent plastic strain accumulated during the actual probe. Calculations are updated with every additional data point evaluated. Hence, the procedure is fully automatized for evaluating unique yield points.
At the current stage of YST method development, the following YP definition is employed:
The value of 200 µε is considerably larger than 20 µε used commonly with strain gages, still one order of magnitude finer in comparison with standard proof strain calculated in tensile tests (Rp02 being equivalent to 2000 µε offset). The value was selected as low as possible considering the limitations imposed by the EXTM precision. Small amount of plastic flow caused by “piercing” of a YS within the preceding probes can possibly cause an unwelcome influence on the subsequent probes. In order to mitigate this “probing effect”, particular probing sequence characterized by succession of probes from opposite stress space quadrants was designed (see Figure 3).
3. Results
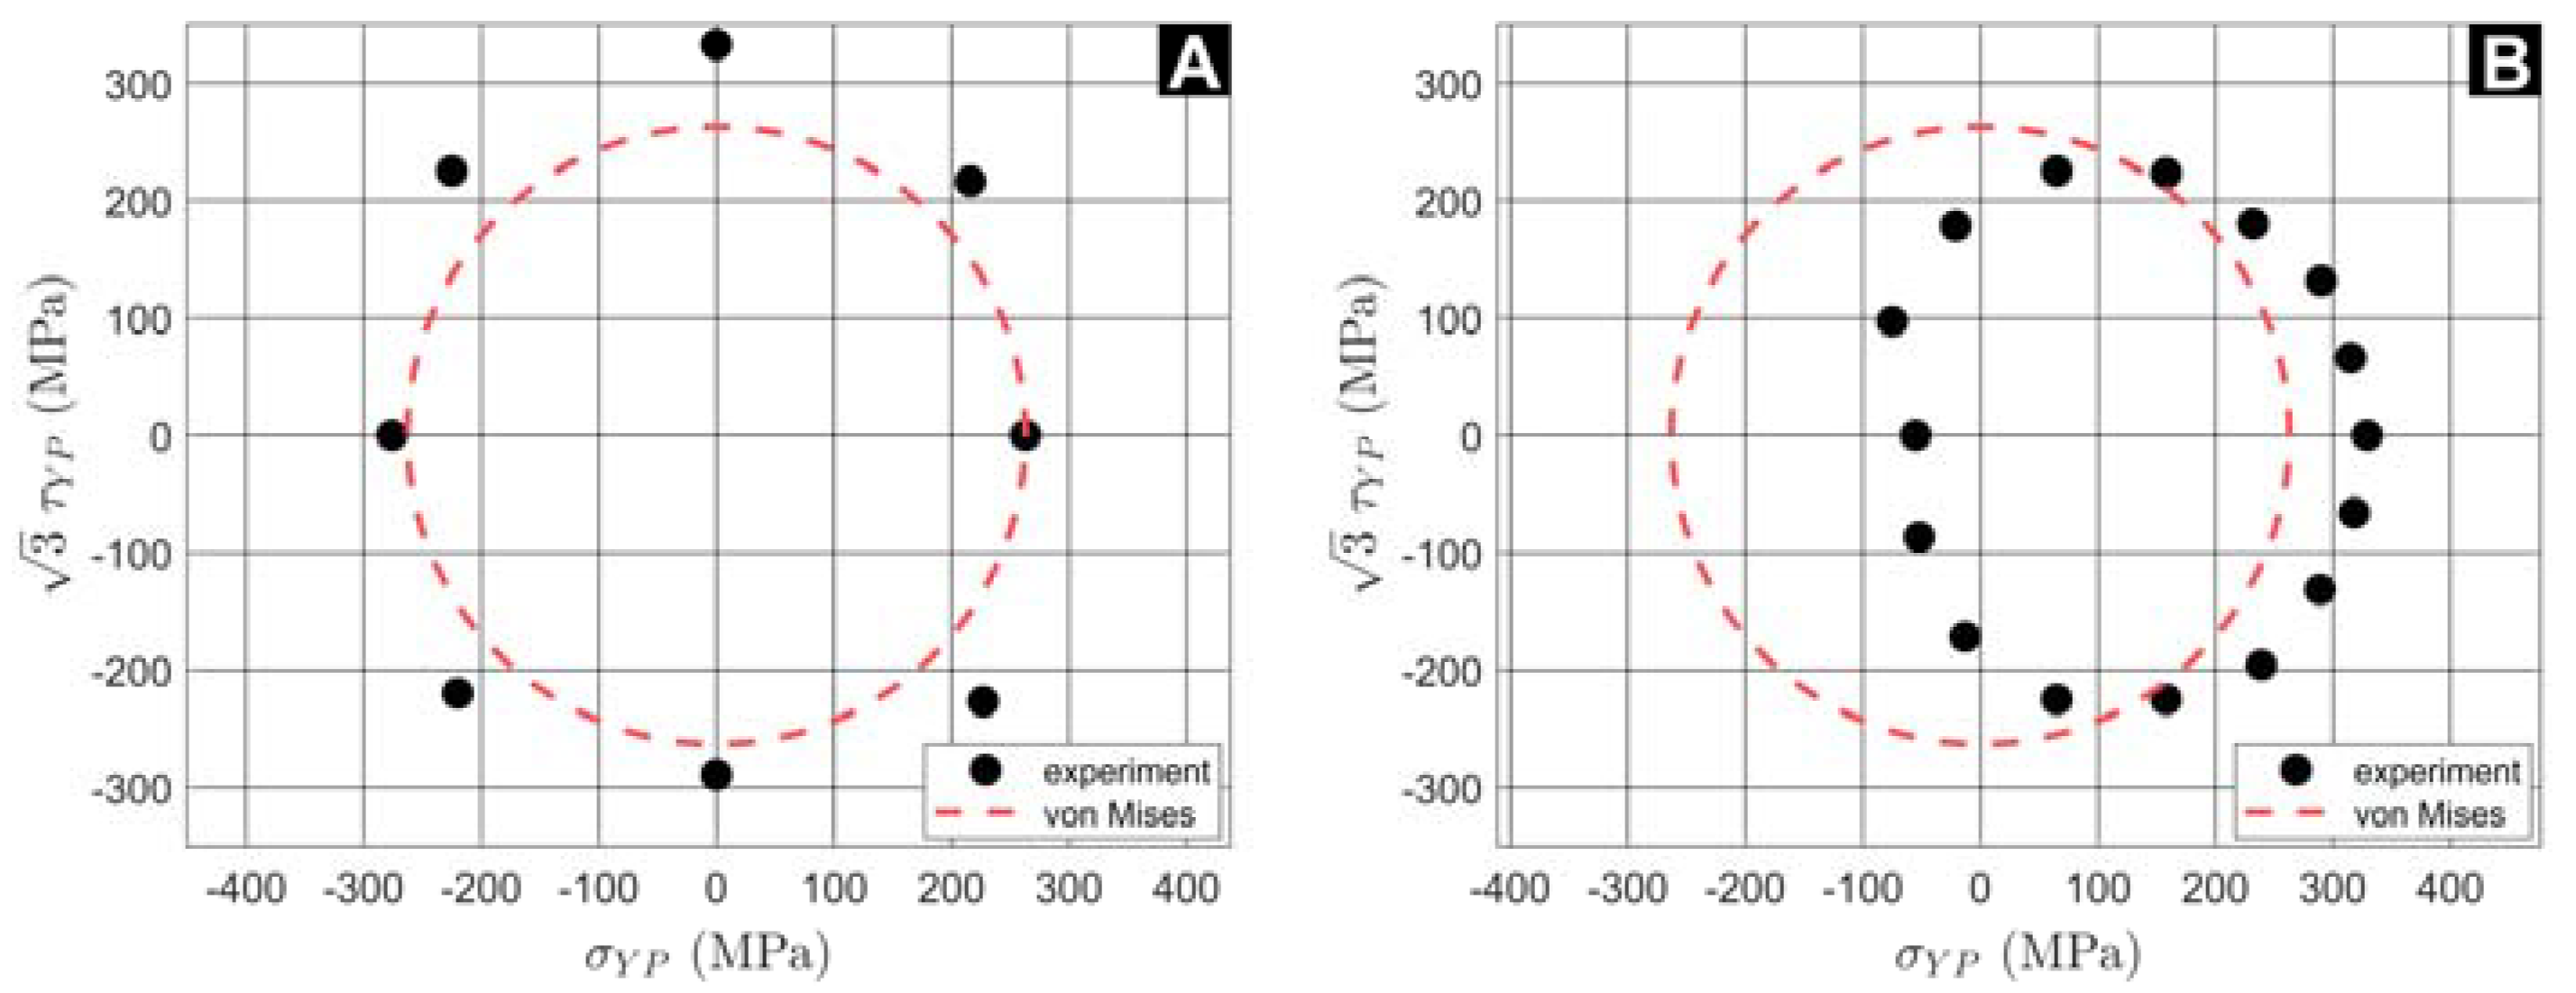
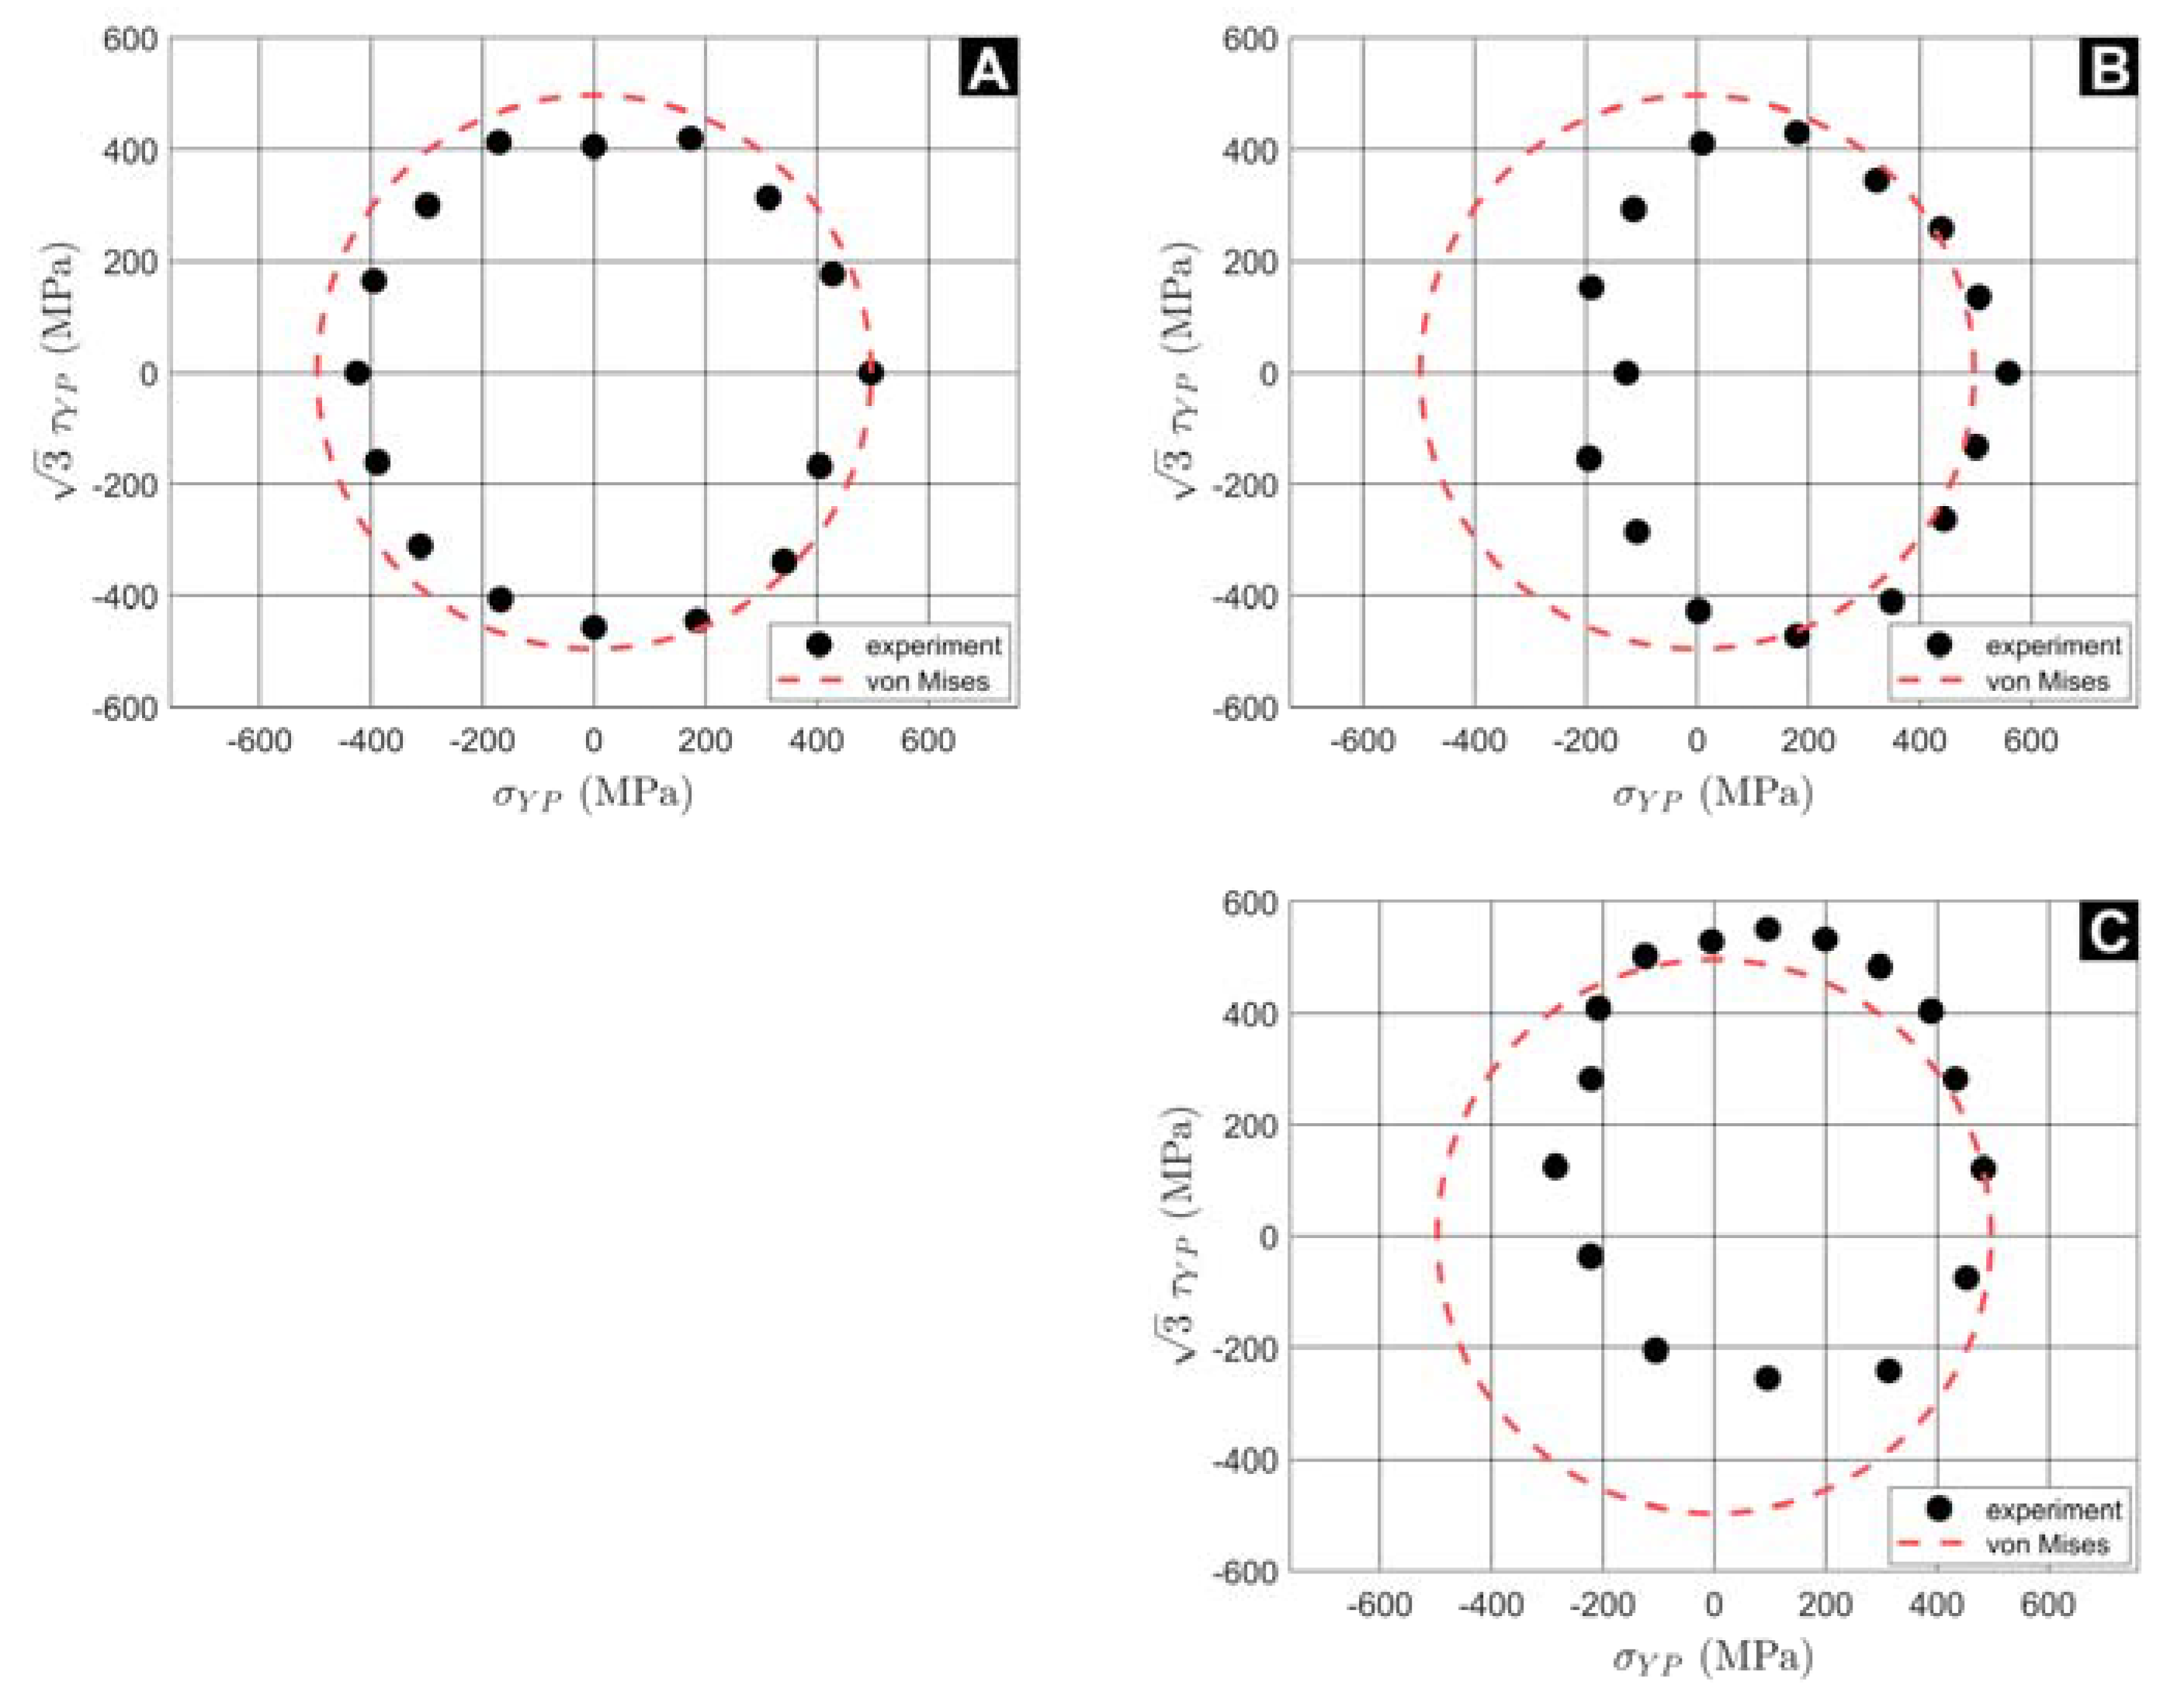
Figure 5 and Figure 6 show both initial and subsequent yield surfaces of P250GH and S235JR grades, respectively, evaluated consistently with the YS tracing procedures specified in Section 2.4. Corresponding tabular data are presented in Appendix A (Table A1 and Table A2). Tracing of the initial YS of P250GH steel (Figure 5A) was performed with only eight probes that constituted an older design of YST method. For the sake of more precise identification of YS within the stress space, the total probes’ count was doubled, thereby doubling YP density for all subsequent experiments.
In order to emphasize shapes of experimental YSs and their positions within the stress space, hypothetical von Mises circles were drawn into the figures. As can be seen, the initial YS of S235JR steel conforms the von Mises criterion better than that of P250GH steel. Similar “initial YS anisotropies” are commonly reported for metallic materials [6,16] and could be attributed to the raw material production history. Subsequent YSs exhibited classical apex in the prestrain direction, as well as flattening of the rear part.
4. Discussion
General overview of the yield surfaces presented in Figure 5 and Figure 6 confirms the existence of yield surfaces and their evolution under the effect of strain hardening, as well as good functionality of the developed yield surfaces tracing method.
As can be seen from Figure 6, the initial yield surface of a cold-drawn S235JR steel is relatively well predicted by the von Mises yield criterion possessing circular shape in (σ, √3τ) stress space. The initial YS of P250GH grade shows some initial elongation in the shear direction that could be possibly explained in terms of uncertainties of the actual production history of the semiproduct. As the material microstructure can have crucial impact on ductility of materials [33], a detailed metallographic analysis will be performed to obtain the real grain structure and texture that could be a source of initial anisotropies.
Subsequent YSs depicted in Figure 5B and Figure 6B,C provide evidence of pronounced kinematic hardening. Pure axial prestrain induced the commonly reported slight sharpening of the forward YS apex, as well as flattening of the rear part [8,9,26]. In the case of P250GH grade, decrease of shear yield points magnitudes indicated a negative cross effect.
Probably the most important problem encountered throughout the YST method development is the design of an optimal procedure for automated evaluation of elastic moduli, E and G. For instance, a standard Instron tensile testing software offers almost 10 different methods for moduli calculation. At the same time, precise evaluation of a YP is extremely sensitive to the precision of the fit of the elastic line. An inappropriate inset of the elastic line leads to significant variation of the point where the stress–strain curve starts to deviate from linearity, and, consequently, results in either premature or delayed fulfilment of the YP definition, (22). This may explain the non-convexities recorded within subsequent YSs depicted in Figure 5 and Figure 6. Therefore, the next task for the YST method development is the optimization of elastic moduli calculation procedure, i.e., a design for calculation of E and G that is sufficiently high quality and repeatable. This is particularly important for probes characterized by significant superiority of one of the stress components (either the axial stress, or the shear stress) over the other. Fulfilment of this task could eventually lead to an opportunity to improve precision, to decrease the yield point threshold under the current value of 200 µε equivalent plastic strain, and to mitigate the “probing effect”.
5. Conclusions
This publication presents a complete overview of an experimental program that aims to develop a yield surface tracing method for metallic materials. The objective of the method is to determine the shapes of the initial yield surfaces, as well as shapes of subsequent yield surfaces to obtain information on the evolution of the directional distortional hardening process. The precise observation of directional distortional hardening is essential for calibration of phenomenological plasticity models. These models provide vital predictions of the behavior of structures under complicated and intensive loading. Despite some imperfections discussed in the paper, the method proved to effectively capture yield surfaces in an axial stress—shear stress space induced by combined tensile/compressive and torsional loading of thin-walled tubular specimens. The most important remaining issue with this methodology is the optimization of the procedure for the evaluation of the actual elastic stiffness in the measured stress–strain data that will result in significantly increased precision of the overall method.
Author Contributions
Investigation, J.Š.; methodology, S.P. and C.C.; software, R.M.; supervision, J.P.; validation, S.P.; visualization, R.M.; writing—original draft, J.Š.; writing—review and editing, C.C. and H.F. All authors have read and agreed to the published version of the manuscript.
Funding
This work was supported by (1) Ministry of youth, education and sports under Grant LTAUSA18199 Advanced Phenomenological Models of Plasticity and Phase Transformations in Modern Engineering Materials, by (2) Czech Science Foundation under Grant No. GA19-03282S, by (3) the European Regional Development Fund under Grant No. CZ.02.1.01/0.0/0.0/15_003/0000493 (Centre of Excellence for Nonlinear Dynamic Behaviour of Advanced Materials in Engineering), and by (4) US Army Research Laboratory and the US Army Research Office under Grant No. W911NF-19-1-0040.
Data Availability Statement
Data are contained within the article—see Appendix A.
Conflicts of Interest
The authors declare no conflict of interest.
Abbreviations
| DDH | Directional distortional hardening |
| EXTM | Extensometer |
| TS | Test specimen |
| YP | Yield point |
| YS | Yield surface |
| YST | Yield surface tracing (experimental method) |
Appendix A

Table A1.
Tabular results of YS tracing in P250GH steel—the yield points evaluated within individual probes.
Table A1.
Tabular results of YS tracing in P250GH steel—the yield points evaluated within individual probes.
| Probe No. | Initial YS | Subsequent YS after 1% Axial Prestrain | ||
|---|---|---|---|---|
| (Figure 5A) | (Figure 5B) | |||
| σ (MPa) | τ (MPa) | σ (MPa) | τ (MPa) | |
| 1 | 263 | 0 | 329 | 0 |
| 2 | −276 | 0 | −55 | 0 |
| 3 | 315 | 38 | ||
| 4 | −220 | −127 | −13 | −99 |
| 5 | 232 | 104 | ||
| 6 | 0 | −167 | 158 | −130 |
| 7 | 65 | 130 | ||
| 8 | 227 | −131 | 289 | −76 |
| 9 | −75 | 56 | ||
| 10 | 318 | −38 | ||
| 11 | −52 | −50 | ||
| 12 | 216 | 125 | 290 | 76 |
| 13 | 65 | −130 | ||
| 14 | 0 | 192 | 158 | 129 |
| 15 | 239 | −113 | ||
| 16 | −225 | 130 | −21 | 103 |
Table A2.
Tabular results of YS tracing in S235JR steel—the yield points evaluated within individual probes.
Table A2.
Tabular results of YS tracing in S235JR steel—the yield points evaluated within individual probes.
| Probe No. | Initial YS | Subsequent YS after 1% Axial Prestrain | Subsequent YS after 1% Axial + 1% Shear Prestrain | |||
|---|---|---|---|---|---|---|
| (Figure 6A) | (Figure 6B) | (Figure 6C) | ||||
| σ (MPa) | τ (MPa) | σ (MPa) | τ (MPa) | σ (MPa) | τ (MPa) | |
| 1 | 497 | 0 | 558 | 0 | 433 | 163 |
| 2 | −425 | 0 | −127 | 0 | −221 | 163 |
| 3 | 428 | 102 | 505 | 78 | 389 | 233 |
| 4 | −312 | −180 | −108 | −165 | −222 | −21 |
| 5 | 173 | 242 | 322 | 199 | 199 | 307 |
| 6 | 0 | −264 | 179 | 248 | 96 | −147 |
| 7 | −171 | 238 | 9 | 237 | −5 | 305 |
| 8 | 341 | −196 | 443 | −152 | 453 | −43 |
| 9 | −395 | 95 | −190 | 88 | −208 | 236 |
| 10 | 405 | −97 | 500 | −77 | 483 | 70 |
| 11 | −389 | −93 | −194 | −89 | −285 | 72 |
| 12 | 313 | 181 | 438 | 149 | 297 | 279 |
| 13 | −168 | −235 | 2 | −247 | −105 | −118 |
| 14 | 0 | 234 | 179 | −273 | 96 | 318 |
| 15 | 185 | −257 | 349 | −237 | 313 | −139 |
| 16 | −299 | 173 | −114 | 169 | −124 | 290 |
References
- Štefan, J.; Parma, S.; Marek, R.; Plešek, J.; Feigenbaum, H.; Ciocanel, C. An Experimental Investigation of Yield Surfaces Anisotropies. In Experimental Stress Analysis 2020, Book of Full Papers; VŠB—TUO: Ostrava, Czech Republic, 2020; p. 575. [Google Scholar]
- Hu, G.; Huang, S.; Lu, D.; Zhong, X.; Li, Z.; Brocks, W.; Zhang, K. Subsequent Yielding of Polycrystalline Aluminum after Cyclic Tension-Compression Analyzed by Experiments and Simulations. Int. J. Solids Struct. 2015, 56, 142–153. [Google Scholar] [CrossRef]
- Chen, J.; Zhang, K.; Kuang, Z.; Hu, G.; Song, Q.; Chang, Y. The Anisotropic Distortional Yield Surface Constitutive Model Based on the Chaboche Cyclic Plastic Model. Materials 2019, 12, 543. [Google Scholar] [CrossRef] [Green Version]
- Lu, D.; Zhang, K.; Hu, G.; Lan, Y.; Chang, Y. Investigation of Yield Surfaces Evolution for Polycrystalline Aluminum after Pre-Cyclic Loading by Experiment and Crystal Plasticity Simulation. Materials 2020, 13, 69. [Google Scholar] [CrossRef] [PubMed]
- Liu, L.-W.; Hong, H.-K. A Description of Three-Dimensional Yield Surfaces by Cubic Polynomials. J. Eng. Mech. 2017, 143, 04017129. [Google Scholar] [CrossRef]
- Wu, H.C.; Yeh, W.C. On the Experimental Determination of Yield Surfaces and Some Results of Annealed 304 Stainless Steel. Int. J. Plast. 1991, 7, 803–826. [Google Scholar] [CrossRef]
- Zhang, M.; Benítez, J.M.; Montáns, F.J. Capturing Yield Surface Evolution with a Multilinear Anisotropic Kinematic Hard-ening Model. Int. J. Solids Struct. 2016, 81, 329–336. [Google Scholar] [CrossRef]
- Khan, A.S.; Kazmi, R.; Pandey, A.; Stoughton, T. Evolution of Subsequent Yield Surfaces and Elastic Constants with Finite Plastic Deformation. Part I: A Very Low Work Hardening Aluminum Alloy (Al6061-T6511). Int. J. Plast. 2009, 25, 1611–1625. [Google Scholar] [CrossRef]
- Khan, A.S.; Pandey, A.; Stoughton, T. Evolution of Subsequent Yield Surfaces and Elastic Constants with Finite Plastic Deformation. Part II: A Very High Work Hardening Aluminum Alloy (Annealed 1100 Al). Int. J. Plast. 2010, 26, 1421–1431. [Google Scholar] [CrossRef]
- Cayla, P.; Boucher, M. A Theoretical and Experimental Approach of Strain Induced Anisotropy. Int. Deep Draw. Res. Gr. 1990, 6. [Google Scholar]
- Cheng, S.; Krempl, E. Experimental Determination of Strain-Induced Anisotropy During Nonproportional Straining of an Al/Mg Alloy at Room Temperature. Int. J. Plast. 1991, 7, 827–846. [Google Scholar] [CrossRef]
- Ishikawa, H. Subsequent Yield Surface Probed from Its Current Center. Int. J. Plast. 1997, 13, 533–549. [Google Scholar] [CrossRef]
- Khan, A.S.; Wang, X. An Experimental Study on Subsequent Yield Surface after Finite Shear Prestraining. Int. J. Plast. 1993, 9, 889–905. [Google Scholar] [CrossRef]
- McComb, H.G. Some Experiments Concerning Subsequent Yield Surfaces in Plasticity; Technical Note D-396; NASA: Washington, DC, USA, 1960. [Google Scholar]
- Naghdi, P.M.; Essenburg, F.; Koff, W. Experimental Study of Initial and Subsequent Yield Surface in Plasticity. J. Appl. Mech. 1958, 201, 201. [Google Scholar] [CrossRef]
- Sung, S.J.; Liu, L.W.; Hong, H.K.; Wu, H.C. Evolution of Yield Surface in the 2D and 3D Stress Spaces. Int. J. Solids Struct. 2011, 48, 1054–1069. [Google Scholar] [CrossRef] [Green Version]
- Liu, G.L.; Huang, S.H.; Shi, C.S.; Zeng, B.; Zhang, K.S.; Zhong, X.C. Experimental Investigations on Subsequent Yield Sur-face of Pure Copper by Single-Sample and Multi-Sample Methods under Various Pre-Deformation. Materials 2018, 11, 277. [Google Scholar] [CrossRef] [PubMed] [Green Version]
- Meyer, K.A.; Ekh, M.; Ahlström, J. Anisotropic Yield Surfaces after Large Shear Deformations in Pearlitic Steel. Eur. J. Mech. A/Solids 2020, 82, 103977. [Google Scholar] [CrossRef]
- Feigenbaum, H.P.; Dafalias, Y.F. Directional Distortional Hardening in Metal Plasticity within Thermodynamics. Int. J. Solids Struct. 2007, 44, 22–23. [Google Scholar] [CrossRef]
- Marek, R.; Plešek, J.; Hrubý, Z.; Parma, S.; Feigenbaum, H.; Dafalias, Y. Numerical Implementation of A Model With Directional Distortional Hardening. J. Eng. Mech. 2015, 141, 04015048. [Google Scholar] [CrossRef]
- Parma, S.; Plešek, J.; Marek, R.; Hrubý, Z.; Feigenbaum, H.P.; Dafalias, Y.F. Calibration of a Simple Directional Distortional Hardening Model for Metal Plasticity. Int. J. Solids Struct. 2018, 143, 113–124. [Google Scholar] [CrossRef]
- Plešek, J.; Feigenbaum, H.P.; Dafalias, Y.F. Convexity of Yield Surface with Directional Distortional Hardening Rules. J. Eng. Mech. 2010, 136, 477–484. [Google Scholar] [CrossRef]
- Welling, C.A.; Marek, R.; Feigenbaum, H.P.; Dafalias, Y.F.; Plešek, J.; Hrubý, Z.; Parma, S. Numerical Convergence in Simulations of Multiaxial Ratcheting with Directional Distortional Hardening. Int. J. Solids Struct. 2017, 126–127, 105–121. [Google Scholar] [CrossRef]
- Freund, M.; Shutov, A.V.; Ihlemann, J. Simulation of Distortional Hardening by Generalizing a Uniaxial Model of Finite Strain Viscoplasticity. Int. J. Plast. 2012, 36, 113–129. [Google Scholar] [CrossRef]
- Dietrich, L.; Kowalewski, Z.L. Experimental Investigation of an Anisotropy in Copper Subjected to Predeformation Due to Constant and Monotonic Loadings. Int. J. Plast. 1997, 13, 87–109. [Google Scholar] [CrossRef]
- Khan, A.S.; Pandey, A.; Stoughton, T. Evolution of Subsequent Yield Surfaces and Elastic Constants with Finite Plastic Deformation. Part III: Yield Surface in Tension–Tension Stress Space (Al 6061--T 6511 and Annealed 1100 Al). Int. J. Plast. 2010, 26, 1432–1441. [Google Scholar] [CrossRef]
- Halama, R.; Markopoulos, A.; Šofer, M.; Poruba, Z.; Matušek, P. Cyclic Plastic Properties of Class C Steel Emphasizing on Ratcheting: Testing and Modelling. Strojnický Časopis J. Mech. Eng. 2015, 65, 21–26. [Google Scholar] [CrossRef] [Green Version]
- Phillips, A.; Liu, C.S.; Justusson, J.W. An Experimental Investigation of Yield Surfaces at Elevated Temperatures. Acta Mech. 1972, 14, 119–146. [Google Scholar] [CrossRef]
- Phillips, A.; Lu, W.Y. An Experimental Investigation of Yield Surfaces and Loading Surfaces of Pure Aluminum with Stress-Controlled and Strain-Controlled Paths of Loading. J. Eng. Mater. Technol. 1984, 106, 349–354. [Google Scholar] [CrossRef]
- Phillips, A.; Tang, J.-L.; Ricciuti, M. Some New Observations on Yield Surfaces. Acta Mech. 1975, 20, 23–39. [Google Scholar] [CrossRef]
- Phillips, A.; Tang, J.L. The Effect Yield Surface of Loading Path on the At Elevated Temperatures. Int. J. Solids Struct. 1972, 8, 463–474. [Google Scholar] [CrossRef]
- Mair, W.M.; Pugh, H.L.D. Effect of Pre-Strain on Yield Surfaces in Copper. J. Mech. Eng. Sci. 1964, 6, 150–163. [Google Scholar] [CrossRef]
- Štefan, J.; Siegl, J.; Adámek, J.; Kopřiva, R.; Kytka, M. Failure Behaviour of Cladding Made from Sv 07Kh25N13 Austenitic Stainless Steel. Int. J. Press. Vessel. Pip. 2021, 189, 104275. [Google Scholar] [CrossRef]
Figure 1.
Technical drawing of thin-walled tubular TS.

Figure 2.
Experimental setup (A): a thin-walled tubular specimen clamped in hydraulic grips of the testing machine, and a contact biaxial extensometer is attached in four points on the reduced section of the TS. Stress state representation (B) within the TS subject to combined axial load and torque.

Figure 3.
Schematic drawing of an initial and a subsequent YS. Probing systems composed of series of 16 probes.
Figure 3.
Schematic drawing of an initial and a subsequent YS. Probing systems composed of series of 16 probes.

Figure 4.
Schematic representation of the axial stress–strain curve within a probe. Decomposition of total axial strain into elastic, plastic, and residual components.
Figure 4.
Schematic representation of the axial stress–strain curve within a probe. Decomposition of total axial strain into elastic, plastic, and residual components.

Figure 5.
Initial YS of P250GH steel (A), and subsequent YS after 1% axial plastic prestrain (B).

Figure 6.
Initial YS of S235JR steel (A), subsequent YS after 1% axial prestrain (B), and subsequent YS after further 1% shear prestrain (C).
Figure 6.
Initial YS of S235JR steel (A), subsequent YS after 1% axial prestrain (B), and subsequent YS after further 1% shear prestrain (C).

Table 1.
Contents of alloying elements (wt%) in P250GH steel investigated in the present work, as-stated by inspection certificate.
Table 1.
Contents of alloying elements (wt%) in P250GH steel investigated in the present work, as-stated by inspection certificate.
| C | Mn | Si | P | S | Cr | Ni | Mo | Al | Ti |
|---|---|---|---|---|---|---|---|---|---|
| 0.19 | 0.82 | 0.18 | 0.011 | 0.006 | 0.17 | 0.090 | 0.020 | 0.023 | 0.0017 |
Table 2.
Contents of alloying elements (wt%) in S235JR steel investigated in the present work.
| C | Mn | P | S | N |
|---|---|---|---|---|
| 0.16 | 1.32 | 0.021 | 0.024 | 0.005 |
Publisher’s Note: MDPI stays neutral with regard to jurisdictional claims in published maps and institutional affiliations. |
© 2021 by the authors. Licensee MDPI, Basel, Switzerland. This article is an open access article distributed under the terms and conditions of the Creative Commons Attribution (CC BY) license (https://creativecommons.org/licenses/by/4.0/).
Share and Cite
MDPI and ACS Style
Štefan, J.; Parma, S.; Marek, R.; Plešek, J.; Ciocanel, C.; Feigenbaum, H. Overview of an Experimental Program for Development of Yield Surfaces Tracing Method. Appl. Sci. 2021, 11, 7606. https://doi.org/10.3390/app11167606
AMA Style
Štefan J, Parma S, Marek R, Plešek J, Ciocanel C, Feigenbaum H. Overview of an Experimental Program for Development of Yield Surfaces Tracing Method. Applied Sciences. 2021; 11(16):7606. https://doi.org/10.3390/app11167606
Chicago/Turabian StyleŠtefan, Jan, Slavomír Parma, René Marek, Jiří Plešek, Constantin Ciocanel, and Heidi Feigenbaum. 2021. "Overview of an Experimental Program for Development of Yield Surfaces Tracing Method" Applied Sciences 11, no. 16: 7606. https://doi.org/10.3390/app11167606
Note that from the first issue of 2016, this journal uses article numbers instead of page numbers. See further details here.