Article

Influence of Build Orientation on Surface Roughness and Fatigue Life of the Al2024-RAM2 Alloy Produced by Laser Powder Bed Fusion (L-PBF)

1
Department of Materials Engineering, Faculty of Mechanical Engineering, University of Zilina, Univerzitna 1, 01026 Žilina, Slovakia
2
Department of Engineering and Architecture, University of Parma, Parco Area delle Science 181/A, 43124 Parma, Italy
3
Institute of Physics of Materials, Czech Academy of Sciences, Žižkova 22, 616 00 Brno, Czech Republic
*
Author to whom correspondence should be addressed.
Metals 2023, 13(9), 1615; https://doi.org/10.3390/met13091615
Submission received: 31 July 2023 / Revised: 14 September 2023 / Accepted: 15 September 2023 / Published: 19 September 2023
(This article belongs to the Special Issue Microstructure and Properties of Aluminum Alloys)

Abstract

:
Additive manufacturing of high strength Al alloys brings problems with hot cracking during rapid solidification. One of the ways to solve this challenge is technology developed by the Elementum 3D company. The way consists of inoculation by ceramic nanoparticles using RAM technology. When applying the L-PBF method, a very fine equiaxed microstructure with exceptional properties and without cracks is created. This paper offers the results and discussion of the microstructure, surface roughness and fatigue life of the high-strength Al2024-RAM2 alloy made from a gas atomized powder with an additive of 2 wt.% ceramic nanoparticles on the base of Ti. The specimens for fatigue tests were produced in different orientations relative to the building platform and left in the as-built conditions with different surface quality (roughness). The specimens were T6 heat-treated. The treatment caused a coarsening of a part of the fine grains. After T6 heat treatment, the hardness increased significantly, which occurred by precipitation hardening. Fatigue tests of specimens with different build orientation were performed in plane bending and the experimentally determined fatigue life was discussed in terms of surface roughness and material microstructure.

1. Introduction

Additive manufacturing (AM) technologies generate three-dimensional components layer by layer from 3D CAD models. These technologies allow the production of objects with complex geometries that would be impossible to create using traditional methods such casting, machining, or forming [1,2]. In contrast to conventional manufacturing technologies, AM adds material and melts it layer by layer using an energy source. This process provides designers with the freedom to create complex components while significantly reducing material consumption during production [3]. However, the disadvantage of this process is that the surface quality of the product is lower than that of conventionally manufactured parts. It varies in different areas of the product and its finish, if possible due to the complexity of the part, adds significantly to the product price [4]. The most widely used additive technology is Laser Powder Bed Fusion (L-PBF). It is based on a targeted laser beam which produces a small melt pool (typically 40 to 100 µm) and scanning mirrors which direct the beam to the metal powder layer [5,6]. The L-PBF workflow’s standard processing speed ranges from 1 to 20 cm3h−1, depending on the design of the part, layer thickness, material used, and the power of the energy source [7].
Several issues arise when using the L-PBF method for component production, which have negative impacts on the entire component quality. One of the important issues is the stair-stepping effect. Stair-stepping develops on component surfaces which have an angle other than 0° or 90° relative to the building platform [8]. The lower the angle to the platform and the wider the layer thickness, the more pronounced this effect becomes. This effect has a negative impact on the surface quality and can strongly influence the fatigue strength [9]. The appropriate choice of scanning strategy and modification of the part’s position on the building platform in the chamber is one of the ways to improve the surface quality [10]. The sections of the component that are tilted downward towards the building platform are referred to as “down-skin” and may require reduced energy input to prevent excessive penetration into the powder bed and deterioration of surface quality. The final layer deposited is referred to as “up-skin,” and it may leave visible traces of laser scanning on the surface [11].
In addition to the stair-stepping effect, during the powder melting process other effects can appear, e.g., the balling effect, which also influences the surface quality, or residual stresses, which also influence the component geometry and the fatigue strength.
The L-PBF process leads to the production of materials with complex microstructures similar to those produced by welding. On the other hand, the L-PBF process is different from welding because the material is melted layer by layer with a specific depth and width, and a high cooling rate. Multiple layers of material are simultaneously melted and fused during each pass of the heat source, resulting in the formation of a thermally affected zone below and around the last molten region, referred to as the “melt pool” [12].
L-PBF technology is suitable for manufacturing components from various alloys. Some are more suitable for this technology, while others create specific problems. Aluminum alloys are easily produced by conventional processes, but numerous studies have revealed critical issues when they are processed by L-PBF technology. One of the difficult challenges in processing aluminum powders is the requirement for increased laser energy due to their high reflectivity and thermal conductivity. Additionally, a thin oxide film on the powder particles makes them more difficult to process [13]. Eutectic Al-Si alloys (AlSi10Mg, AlSi12, A357, and A356) are the most widely used commercial aluminum alloys. The silicon content of these alloys determines their properties, primarily because it helps prevent cracking during solidification. The cracking mechanism is related to the solidification rate [14]. Due to the high susceptibility to cracking during solidification, most high-strength aluminum alloys in the 2xxx, 6xxx, and 7xxx series are difficult to process using L-PBF technology Many of these alloys solidify into dendritic structures. These structures often become a consequence of higher solidification ranges of temperatures, where primary phases solidify first in a dendritic structure and the remaining melt fills the spaces between the dendrites [15]. Aluminum has a high coefficient of thermal expansion and contracts during solidification and cooling [16]. The formation of a primary dendrite is common, with the areas between the dendrites left empty for the remaining melt in the system to fill. The solidified grains begin to contract as the material temperature decreases, and the solidifying secondary phases are unable to fill the voids [17,18]. When the metal cools and internal stresses from solid particles overcome the strength of grain boundaries, resulting in cracking at the grain boundaries, incomplete fusion creates porosity resembling “zipper-like” structures. This is referred to as hot cracking, which is a type of cracking that happens during solidification. During hot cracking, the material substantially loses its mechanical properties [19]. Another issue with these alloys is the presence of alloying elements such as Zn, Mg, and Li, which can evaporate during the manufacturing process [20]. For these reasons, the industry is very interested in developing high-strength aluminum alloys that are specifically designed for L-PBF technology.
The solution to hot cracking in high-strength aluminum alloys involves the use of inoculants as heterogeneous nucleation sites. Inoculants are typically in the form of second-phase particles that solidify creating a fine dispersion of heterogeneous nucleation sites while most of the material remains in the melt. These well-dispersed nucleation sites support the formation of a fine-grained structure and reduce or eliminate hot cracking [21,22].
The best result in preventing hot cracking is given by reactive additive manufacturing (RAM) technology, which uses exothermic chemical reactions to synthesize second-phase materials during additive manufacturing processes. This technology can be used to produce several different inoculants, but it is exceptionally suitable for manufacturing metal matrix composites (MMCs) reinforced with ceramic. Ceramic particles serve as heterogeneous nucleation sites, allowing previously unweldable or “unprintable” alloys such as Al2024, Al6061, and Al7050 to be processed by AM techniques [23,24]. The chemical energy released during the RAM process speeds up processing by lowering the amount of laser or other supplied energy required. Additionally, ceramic nanoparticles with high melting temperatures can be formed from particles with lower melting temperatures, allowing for more energy-efficient production. The nucleation particles also improve properties by precipitating or dispersing strong ceramic reinforcements that block dislocation motion. Inoculation additionally results in an equiaxed grain morphology, which leads to more isotropic mechanical properties [25]. Equiaxed fine grains reduce the influence of building orientation on part properties and performance during printing. The cost of components is a critical issue in the industry, especially for mass production. RAM components are typically more expensive than non-composite alloys due to the higher cost of material production and component manufacturing techniques. At present, there is still a need for further research in this area because this methodology has a strong potential.
The aim of this article is to characterize the microstructure of the Al2024-RAM2 alloy produced by the L-PBF method in the as-build state and the state after heat treatment using the T6 regime. The most important research goal was to determine the fatigue life of plain specimens after T6 heat treatment and to discuss the influence of surface roughness in the as-built state (without any surface post-treatment) on the fatigue crack initiation and fatigue life.

2. Materials and Methods

2.1. Material and L-PBF Fabrication

The material investigated in this study is a high-strength aluminum alloy Al2024-RAM2 with Metal Matrix Composites (MMCs) with an addition of 2 wt.% ceramic nanoparticles prepared by Elementum 3D [23]. These nanoparticles were added to the material using RAM technology and they are acting as inoculants and enabling the processing of the material using PBF technologies. The Elementum 3D company patented an innovative reactive additive manufacturing (RAM) technology [21] to introduce new commercial aluminum alloys and high-performance MMCs for use with existing additive manufacturing equipment. RAM utilizes exothermic chemical reactions to synthesize product materials in situ during the additive fusion process.
The SPECTRO MAXx analyzer determined the chemical composition of the fatigue specimens (Table 1) produced from the Al2024-RAM2 powder material.
The fatigue specimens were prepared by the company BEAM-IT (Fornovo di Taro, Italy) using an SLM® 280HL (SLM Solution Group AG, Lübeck, Germany) system. This system uses two parallel 400 W Yb-fiber laser units with chamber dimensions of 280 × 280 × 320 mm3, with a maximum laser power of 323 W, and a layer thickness of 60 µm. The selective laser melting process took place in a protective argon atmosphere on a pre-heated building platform up to 200 °C.
After fabrication, all specimens were heat-treated in a vacuum furnace using T6 heat treatment as follows: solution annealing at 500 °C for 5 h, then vacuum cooling to room temperature under argon atmosphere, followed by 24 h artificial aging at 160 °C. This heat treatment reduces the residual stresses caused by the manufacturing process to a negligible level and at the same time improves the mechanical properties by precipitation hardening. The samples were removed from the platform after heat treatment.
The microstructure was investigated using a Zeiss Axio Observer Z1M light microscope (LM) and a STEM Tescan LYRA 3 XMU FEG/SEMxFIB with an EBSD detector and an EDS analyzer. Specimens for metallographic analysis were prepared by standard metallographic procedures, which included sampling (longitudinal sections of miniature fatigue specimens) and specimens’ preparation, grinding, and polishing, and they were etched by Keller for 10 s followed by 10 s by Weck.
The hardness of material was determined using Vickers hardness measurements on polished specimens before and after heat treatment with a Zwick/Roel ZHµ HD. The Vickers microhardness HV0.2 and HV0.01 was measured on the polished surface of the fatigue test specimens.

2.2. Fatigue Testing

Four sets of miniature specimens (i.e., 22 mm in length, 5 × 5 mm2 minimum cross section, and lateral semi-circular notch 2 mm in radius) with different build orientations with respect to the building platform (Figure 1a) were manufactured. These specimens were tested with as-built surface. One set of specimens was modified by grinding (size of SiC metallographic grinding paper 180) of the loaded surface. The advantage of the miniature specimens designed by Nicoletto [26,27] is the reduction in material consumption and production costs. The results of the determination of fatigue life are comparable when classical round specimens are used. The method of plane cyclic loading of miniature specimens is shown in Figure 1b. Testing of the flat specimen surface allows the determination of fatigue life. The stressed surface of specimens is located opposite to the notch (red area in the middle of the flat part opposite to the notch, Figure 1b). This is the area where fatigue cracks initiate under cyclic plane bending with a stress ratio R = 0. Fatigue testing was performed on a modified Schenk–Erlinger electromechanical fatigue testing machine RB H01—3D44X (Figure 1c), operating at a frequency of 25 Hz in fixed rotation-control mode according to ISO 22407:2021(en) [28].

2.3. Surface Roughness

Surface roughness affects fatigue life. The quality of the surface of AM components depends on the orientation of the samples relative to the building platform. The standard parameters of linear roughness Ra (average arithmetic deviation of the analyzed profile) and Rz (the largest height of profile unevenness) were measured using a contact profilometer according to the ISO4287 standard [29]. The procedure using a Gaussian filter on a sample length of 2.5 mm along the longitudinal axis was applied. The SAMATools SA6210 touch roughness meter with a diamond tip with a radius of 5 µm, a sensing tip angle of 90°, and a measuring force of 4 mN with a measurement accuracy of ±10% and a standard sliding unit with a range of 17.5 mm, was used. The set measured length on the flat surface was 12.5 mm with a measuring speed of 0.5 mm s−1. Three measurements were performed on each sample and the average was taken as the reference value.

3. Results and Discussion

3.1. Microstructure

No hot cracks were detected in the microstructure of the high-strength alloy Al2024-RAM2 with the addition of 2 wt.% ceramic nanoparticles processed by RAM in the basic state (without heat treatment). The microstructure on vertical planes analyzed on a light microscope showed the characteristic fish-scale morphology (Figure 2a) typical of alloys prepared by the L-PBF method. The texture at low magnification is characterized by melt pool patterns created by the laser beam transitions. The width of melt pools is 150 to 250 µm. At higher magnification, it can be seen that the microstructure consists of ultra-fine equiaxed α-Al phase grains (Figure 2b). The microstructure and the grain orientation as observed by EBSD are shown in Figure 2c. The size of the fine grains is 1 to 2 µm and the grains are randomly oriented (Figure 2c). Globular titanium microparticles were detected in the microstructure, (Figure 2a,b).
The microstructure and the element distribution imaged by STEM-EDS analyzer are presented in Figure 3. Along the fine grain boundaries, a network of segregated intermetallic phases Al2Cu and Al2CuMg (Figure 3b,c) is clearly seen. Figure 3d confirms the presence of Ti nanoparticles.
Observation of the microstructure of the high-strength alloy Al2024-RAM2 prepared by L-PBF from the powder delivered by the company Elementum 3D [30] with an additive of 2 wt.% Ti nanoparticles confirmed that the addition of Ti nanoparticles and the application of the RAM process lead to the formation of an ultra-fine-grained structure without hot cracks. Similar results concerning the grain refinement during additive manufacturing of high-strength Al alloys without RAM process were published in papers [31,32,33,34] in which the authors have focused their attention on the influence of the addition of nanoparticles based on elements that refine the grains and found that the resulting structure is free of cracks. On the other hand, the structure of the high-strength A6061-RAM2 alloy prepared by L-PBF was analyzed in [35], but in this case, the occurrence of microcracks was detected.
After the T6 heat treatment, as shown in the observations made in this study, a pronounced change of the microstructure appeared. In some areas, the fine grains remained unchanged, whereas in other regions the grains became much larger. These changes were first shown by optical microscopy (Figure 4a,b), and then confirmed by EBSD analysis (Figure 4c). The average size of the coarse grains is in the range of 100 to 250 μm, which is two orders of magnitude larger than the size of the fine grains (Figure 4). Tan [31] states that the T6 heat treatment, which is standardly used for the conventionally produced wrought alloy 2024, is probably not optimal for additive manufactured alloys. During the homogenization of the solid α-Al solution, coarsening of the grains occurs during solution processing, depending on the temperature and the holding time. The orientation of large and very fine grains is random, as can be seen from Figure 4c. Globular Ti microparticles also remained present in the microstructure after T6 heat treatment (Figure 4b).
The STEM analysis of the Al2024-RAM2 microstructure after T6 treatment (Figure 5 and Figure 6) confirmed the presence of Cu- and Mg-rich precipitates forming the Al2CuMg phase or the main strengthening phase θ-Al2Cu. Precipitates and phases that have a strengthening effect have been identified in both coarse-grained and fine-grained structures. Another group of phases occurring in the Al2024-RAM2 alloy after T6 are insoluble phases, formed by elements such as Fe, Mn, or Si, which have low solubility in Mg-alloyed aluminum. These elements tend to form dispersoids, whose main influence lies in increasing resistance to recrystallization and prevention of grain coarsening [31]. These dispersoids precipitate in the form of fine Al20Cu2Mn3 phases located inside the α-Al grains (Figure 6a,f). Diffusion of a certain amount of Mn into the particles of the Al12Fe3Si phase resulted in additional dispersoid forming the Al12(Fe, Mn)3Si phase (Figure 6f–h). The occurrence of these phases was followed in detail and described in a publication by Wang [33].

3.2. Hardness

The results of the determination of microhardness of the material in the state after and before the T6 heat treatment confirmed the effect of precipitation strengthening. The average value of microhardness in the basic state, 119 HV0.2, increased to 146 HV0.2 after T6 treatment. The strengthening is related to the formation of Al2Cu and Al2CuMg precipitates during hardening. The influence of different heat treatment parameters was not examined in this study, though Chen [32] found that the hardness increases with the increasing time of artificial age hardening 5, 10, and 15 h, and depends on the solution annealing temperature. The parameters of heat treatment in this study were taken according to the suggestion of the Elementum 3D company, as described above in Materials and Methods.
Since there are coarse and fine grains in the microstructure after the T6 treatment, the microhardness was measured in both regions. The resulting values in both types of grains were approximately the same, and the results are shown in Table 2. The determination of microhardness of Ti microparticles confirmed the significantly higher hardness compared to the hardness of the α-Al matrix (Table 2).

3.3. Surface Roughness

The surface quality of the specimens used for the determination of fatigue life in relation to the build orientation is shown in Figure 7. The surface roughness corresponding to the as-built conditions and the profile of the plane-loaded surfaces (above the notch) on the longitudinal section shows large differences. Light microscopy observation reveals that the A- orientation has the lowest fragmentation of the surface profile. The surface is formed by the last building layer which has a relatively low surface roughness with the least occurrence of sharp notch defects. The surface profile of the 45- oriented specimens shows large unevenness with sharp notches caused by the stair-stepping effect. The profile roughness of samples with orientation B and C is located between the A- and 45- orientations. The specimen surfaces were examined after fatigue tests and the initiation sites of fatigue cracks are documented in Figure 7b.
The roughness of the cyclically loaded surface of the products, which cannot be reduced by finishing due to the complexity of the manufactured product, is the most important factor for fatigue life. The influence of the orientation of the samples for fatigue tests with respect to the building direction was investigated and reported in papers [36,37]. These studies have demonstrated and quantified the effect of orientation on fatigue life.
The average values of the surface roughness of specimens with different orientations are summarized in Table 3. For comparison purposes and to obtain basic values for material characterization from the point of view of fatigue life, one set of specimens with A- orientation was surface-treated by grinding. The values of surface roughness these specimens denoted as A- 180SP are lower than the values corresponding to the surface A-; see Table 3.

3.4. Fatigue Life

The experimental results of the determination of the fatigue life of specimens with as-built surface and after T6 heat treatment for the A-, B, C, and 45- orientations are shown in Figure 8. The unbroken specimens after application of 2 × 10⁶ cycles are denoted by arrows. The solid lines represent the power-law plot through the points corresponding to the broken specimens. Surprisingly, the effect of orientation is not strong.
Based on the results of the measurement of hardness, which is nearly the same in the fine-grained and coarse-grained regions, and the fact that the observation of the microstructure by optical microscopy and by SEM did not reveal any hot cracks, it can be concluded that the most important factor influencing fatigue life is surface quality. Fatigue life decreases with surface quality. From the trend of the S-N curves defined by solid lines, the fatigue limit based on the number of cycles of 2 × 10⁶ and expressed in terms of maximum stress σmax for the specimens of type A- is 118 MPa (Ra = 2.1 µm), and this value is the highest. The specimens with orientation C with a fatigue limit of 115 MPa (Ra = 12 µm) exhibit the same fatigue limit as those with orientation B (Ra = 12.3 µm). The specimens with 45- orientation have a fatigue limit of 109 MPa (Ra = 17.6 µm), which is the lowest one.
The comparison of relative positions of full lines in Figure 8 clearly proves the effect of the specimen orientation and surface quality on fatigue life. As the surface roughness increases, fatigue life decreases, but this effect is not significant, especially when compared to the observations published in [36]. In the mentioned publications, a more significant influence of the building orientation on fatigue life was demonstrated.
Fatigue life, especially in the high cycle region, is determined mainly by the crack nucleation stage. The measurement of the surface roughness shows lowest values for the A- surfaces. According to the observation of the surface profiles (Figure 7), it is obvious that the fatigue cracks initiate at surface defects in the form of deep notches. Their frequency and their depth, as shown by fractographic observations, increase with increasing overall surface roughness, expressed by Ra and Rz values; see Table 3. This fact explains the observed effect of roughness on fatigue life.
The experimentally determined S-N data for ground material A- 180SP are shown together with data for the A- orientation in Figure 9. From the comparison, it is obvious that the lowering of the roughness through surface treatment significantly increases fatigue life. This effect increases with decreasing σmax. The fatigue limit based on 2 × 10⁶ cycles is 200 MPa, compared to 118 MPa for the A- orientation with an as-built surface.
To the knowledge of the authors of this paper, the S-N curve of the Al2024-RAM2 alloy after T6 treatment has not yet been published in the literature. The only data available can be obtained from the Elementum 3D company basic information on the fatigue life of samples produced using the L-PBF EOS M290 [38]. These S-N data were obtained on standard test samples with a machined and polished surface after T6 heat treatment in accordance with the ASTM E466 standard [39]. The comparison of these data with the S-N curves obtained in this study on miniature samples is shown in Figure 9. It is clear that the fatigue limit is in both cases comparable and equals about 200 MPa, even though in our case the loading was performed in plane bending and in the second case in rotating bending. The results obtained confirm the fact that the surface roughness plays a significant role in determining the fatigue life of the Al2024-RAM2 alloy.

3.5. Fractography

Fracture surfaces of miniature specimens were analyzed with the aim to detect the sites and details of initiation of fatigue cracks. The fracture surfaces with orientations A-, B, C, and 45- under low magnification are shown in Figure 10. In the as-built specimens, fatigue cracks were observed to initiate on the surface above the notch; see the red area in Figure 11. In cases where multiple surface defects like notches or deep surface unevenness were present, multiple crack initiation sites were detected, particularly in specimens with orientation 45- (Figure 10), which exhibited the highest surface roughness. In specimens with orientation A- (Figure 10), fatigue crack initiation usually occurred at the corner of the specimen where the synergy of the influence of some surface defect together with the stress concentration due to the corner locally increased the stress amplitude. For specimens with orientations B, C, and 45-, fatigue cracks initiated mainly from the flat surface.
From the fractographic observation, it can be concluded that, in all cases, defects on the surface play a decisive role in crack initiation. An example of a defect, which initiated the fatigue crack, is shown in Figure 11. The defect consists of a deep (about 400 µm) and sharp notch. The characteristic features of the fracture surfaces corresponding to the propagation of long fatigue cracks in A-, B, C, and 45- specimens did not exhibit any fundamental differences.
The surface condition of the 3D-printed part does not have a great influence on its strength characteristics, but it has a very strong influence on its fatigue properties. Surface machining of geometrically complex components is expensive and often even impossible. Therefore, it is essential to pay attention to the effect of surface quality on fatigue life. For engineering practice, it is beneficial that the standard measured roughness is a parameter that is relevant to fatigue life, which can be seen from the presented results; however, as can be seen from fractographic observations of fatigue initiation sites on the surface, the detailed geometry of surface irregularities and their stress concentration effect are critical. In 3D printing, care must be taken to set the process parameters such that surface defects are generated with the least possible stress concentration effect at each build orientation.

4. Conclusions

The microstructure, surface roughness related to the build orientation, and fatigue strength of the high-strength aluminum alloy Al2024-RAM2 produced by L-PBF was investigated. The material was analyzed in the as-built state and after T6 heat treatment. The main results are the following:
  • The powder alloy Al2024-RAM2 with the addition of 2 wt.% ceramic nanoparticles based on Ti enables the preparation of material by the L-PBF method with a crack-free microstructure. The microstructure consists of ultra-fine equiaxed grains of the α-Al phase with random orientation.
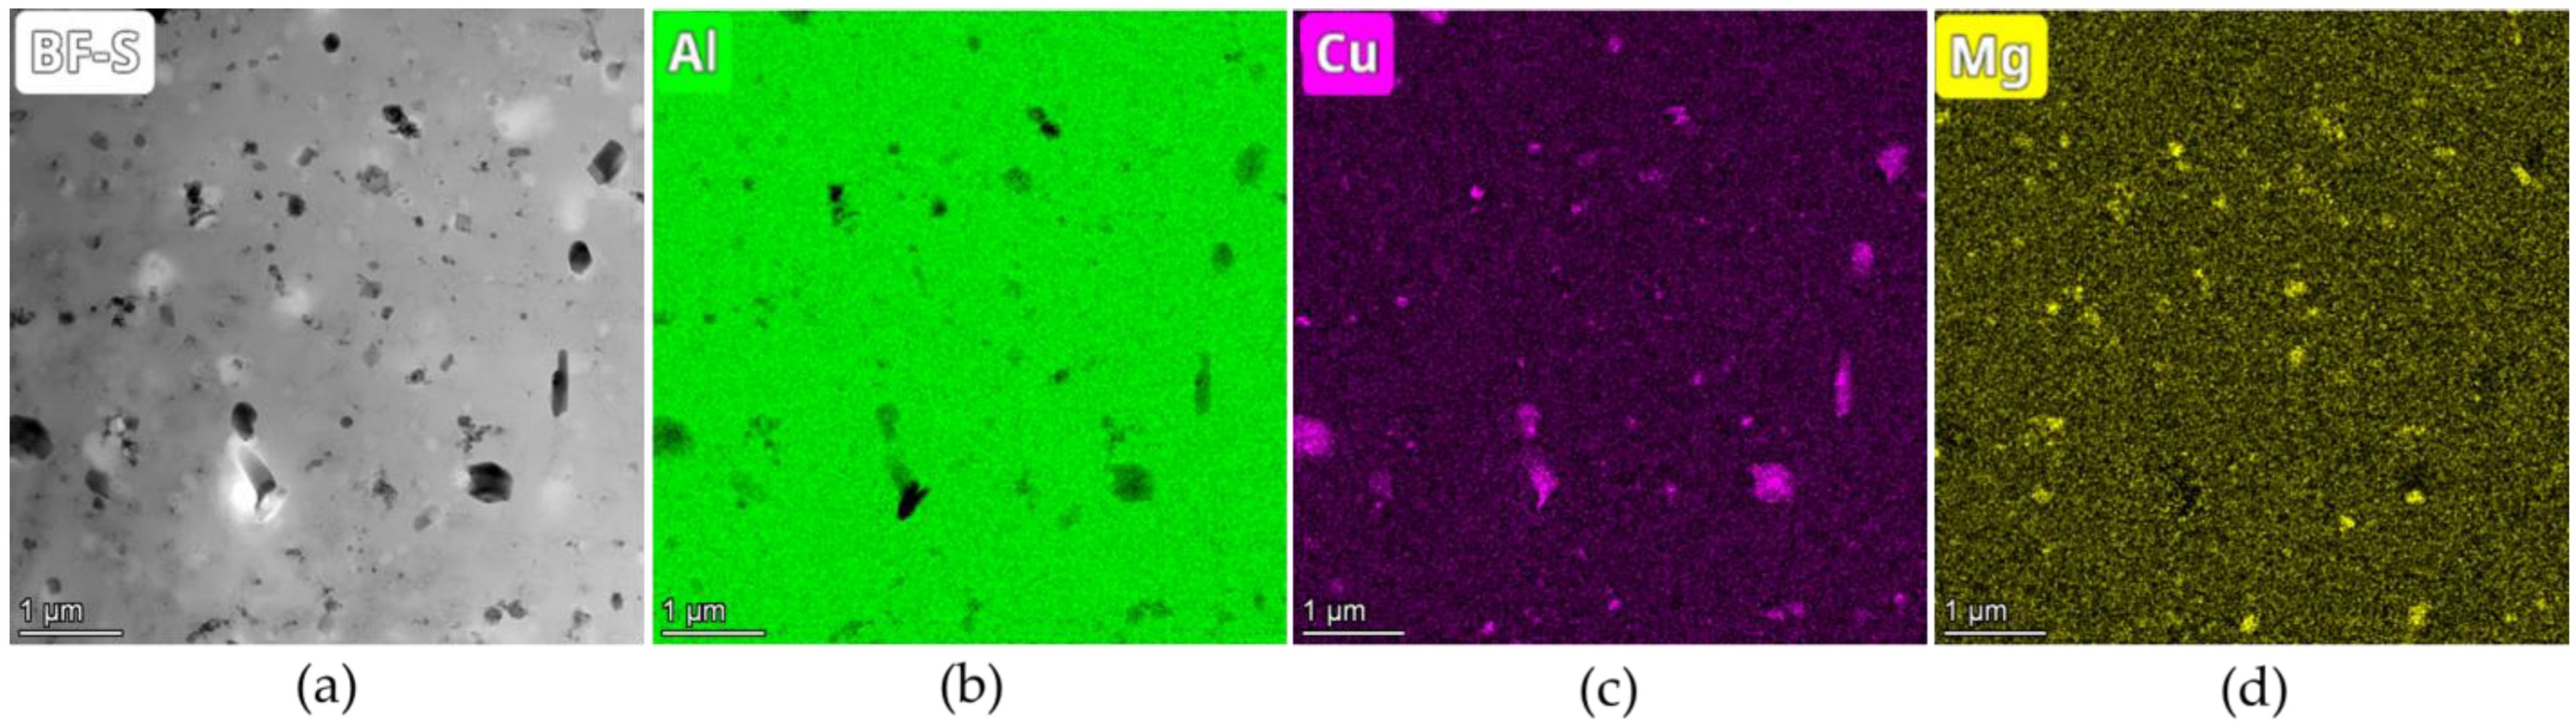
  • T6 heat treatment results in a microstructure consisting of areas of coarsened grains and areas of ultra-fine equiaxed grains of α-Al phase with random orientation. A STEM analysis confirmed the presence of precipitates of θ-Al2Cu and Al2CuMg phases. T6 processing increases the hardness, which the same in both areas (HV0.01 = 150).
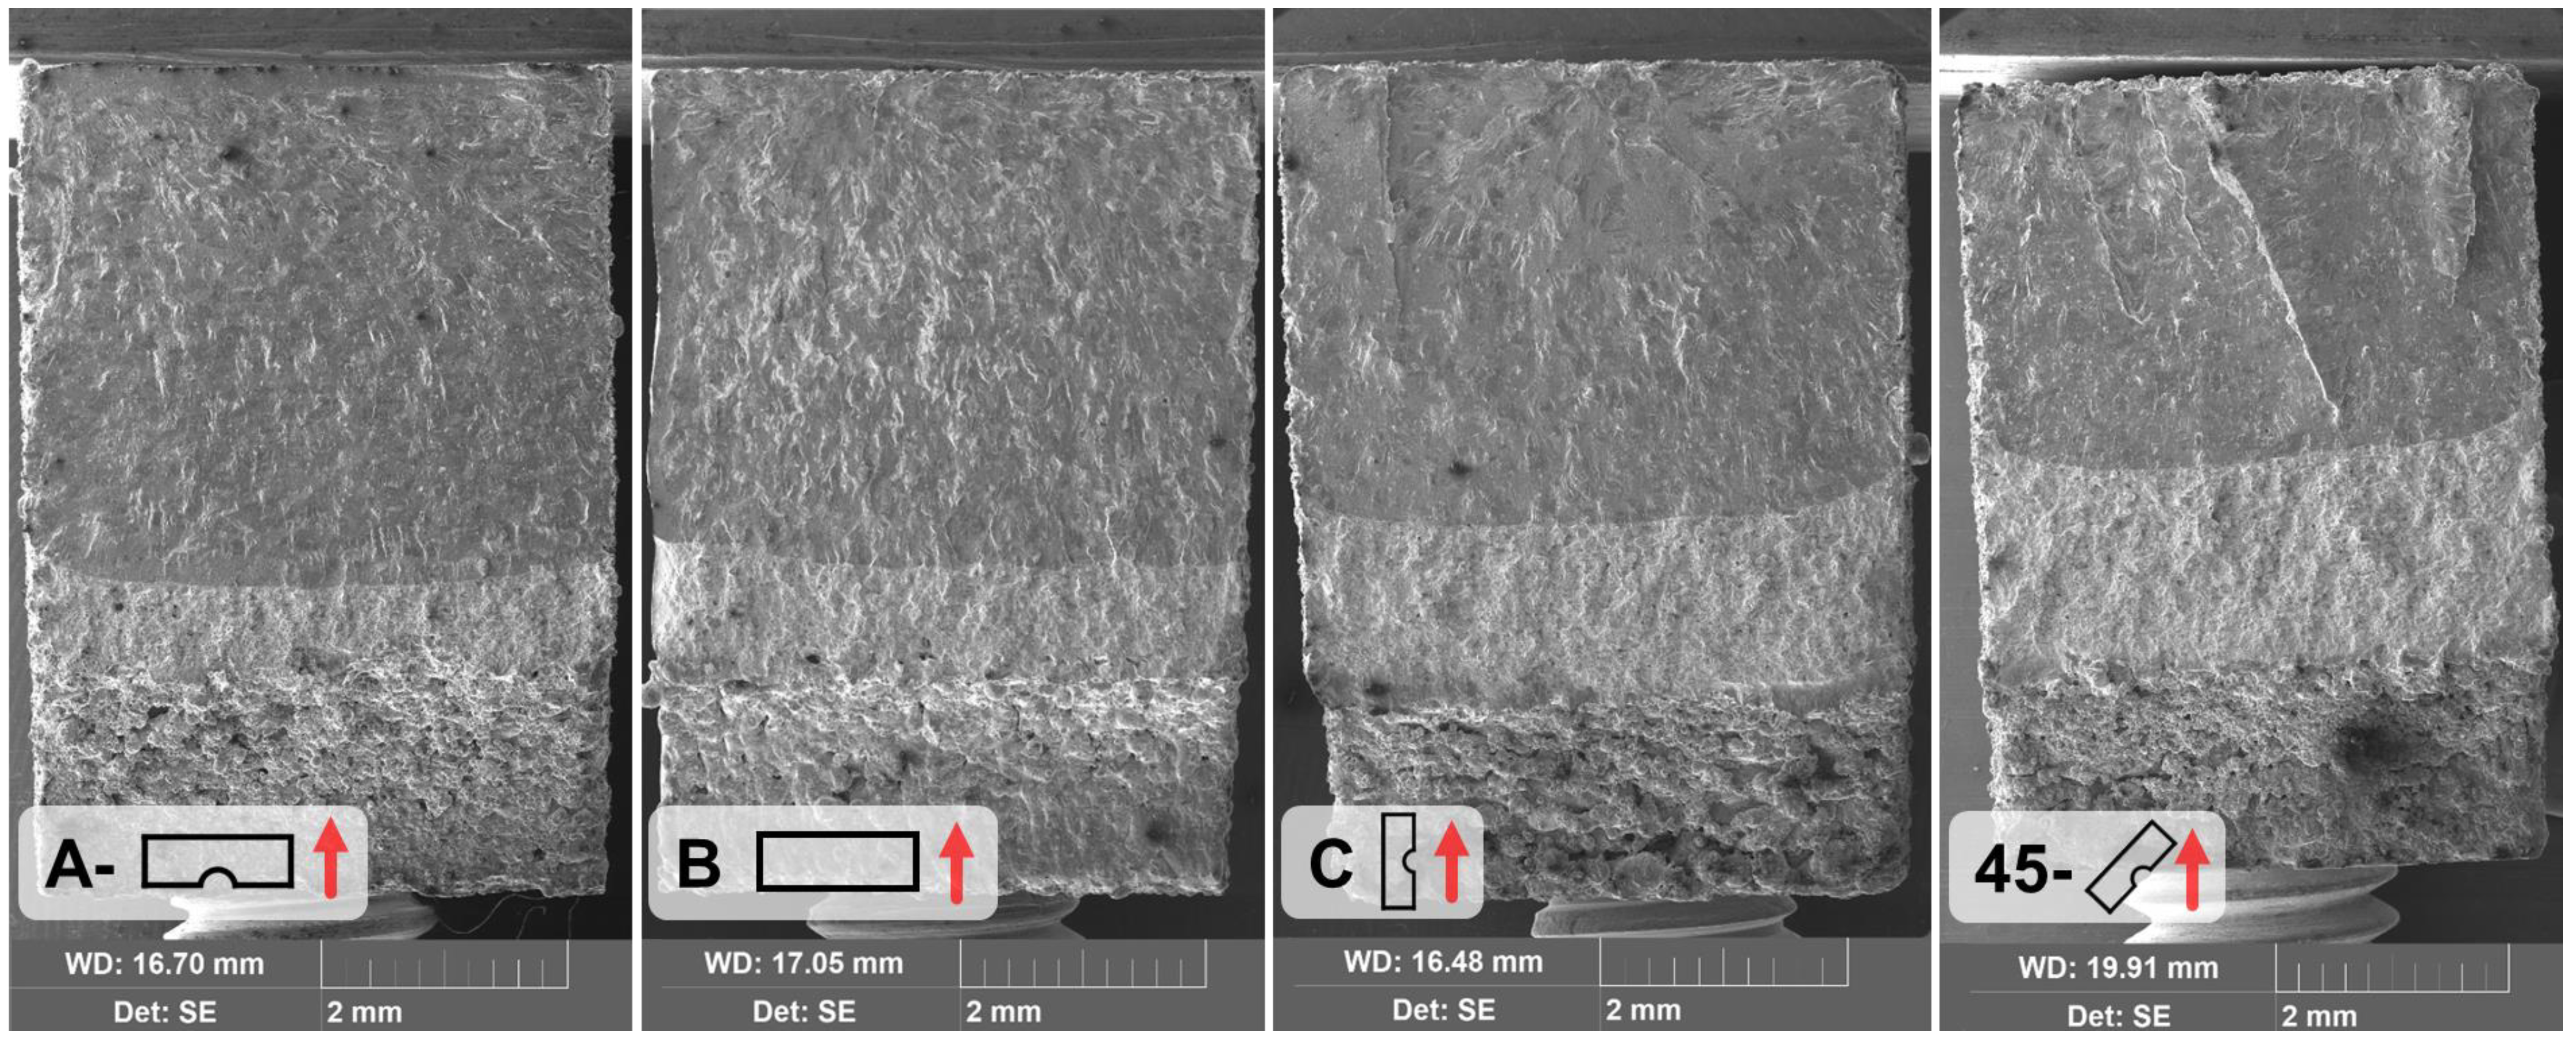
  • The roughness of the as-built surface depends on the orientation of the specimens to the building platform. The roughness increases from orientation A- (the lowest value, Ra = 2.1 µm), to a higher value for orientation B and C (Ra = 12 µm), to the highest value for orientation 45- (Ra = 17.6 µm).
  • Fatigue life depends on the build orientation of specimens. The differences in fatigue life expressed in terms of S-N curves between the individual orientations are not significant. The specimens with orientation A- with the lowest roughness showed the highest fatigue strength σmax = 118 MPa (for fatigue life at 2 × 10⁶ cycles and cyclic loading with R = 0). Fatigue life for a given σmax decreases with increasing surface roughness. Specimens with grounded surface (Ra = 0.6 µm) exhibit a fatigue strength σmax of about 200 MPa at 2 × 10⁶ cycles.
  • From the fractographic observation it can be concluded that deep notches on the surface, the occurrence of which is in relation to the linear roughens Ra, play a decisive role in crack initiation and thus in fatigue life.

Author Contributions

Conceptualization, R.K., T.V. and G.N.; methodology, R.K., T.V. and G.N.; software, T.V., G.N. and M.J.; validation, R.K., G.N. and T.V.; formal analysis, R.K., G.N. and T.V.; investigation, R.K., G.N. and T.V.; resources, R.K. and G.N.; data curation, R.K. and G.N.; writing—original draft preparation, T.V.; writing—review and editing, R.K. and G.N.; visualization, T.V.; supervision, R.K.; project administration, R.K. and G.N.; funding acquisition, R.K. All authors have read and agreed to the published version of the manuscript.

Funding

This research was funded by VEGA grant agency of Slovak Republic by grant number 1/0463/19.

Data Availability Statement

Data are available on request. The data presented in this study are available on request from the corresponding author.

Acknowledgments

The authors acknowledge the company BEAM-IT srl, Fornovo Taro, Italy for providing the specimens GN’s project contribution was under the National Recovery and Resilience Plan (NRRP), Mission 04 Component 2 Investment 1.5—NextGenerationEU, Call for tender n. 3277 dated 30 December 2021, Award Number: 0001052 dated 23 June 2022.

Conflicts of Interest

The authors declare no conflict of interest.

References

  1. ASTM 52900: 2015; Additive Manufacturing. ISO International: Geneva, Switzerland, 2015.
  2. Gibson, I.; Rosen, D.; Stucker, B. Additive Manufacturing Technologies: 3D Printing, Rapid Prototyping, and Direct Digital Manufacturing; Springer: New York, NY, USA, 2015; ISBN 978-1-4939-4455-2. [Google Scholar]
  3. Kruth, J.-P.; Levy, G.; Klocke, F.; Childs, T.H.C. Consolidation phenomena in laser and powder-bed based layered manufacturing. CIRP Ann. 2007, 56, 730–759. [Google Scholar] [CrossRef]
  4. Klahn, C.; Leutenecker, B.; Meboldt, M. Design for Additive Manufacturing—Supporting the Substitution of Components in Series Products. Procedia CIRP 2014, 21, 138–143. [Google Scholar] [CrossRef]
  5. Emmelmann, C.; Sander, P.; Kranz, J.; Wycisk, E. Laser Additive Manufacturing and Bionics: Redefining Lightweight Design. Phys. Procedia 2011, 12, 364–368. [Google Scholar] [CrossRef]
  6. Wang, Y.; Zhang, L.; Daynes, S.; Zhang, H.; Feih, S.; Wang, M.Y. Design of graded lattice structure with optimized mesostructures for additive manufacturing. Mater. Des. 2018, 142, 114–123. [Google Scholar] [CrossRef]
  7. Badrossamay, M.; Yasa, E.; Van Vaerenbergh, J.; Kruth, J.P. Improving Productivity Rate in SLM of Commercial Steel Powders. Technol. Pap.-Soc. Manuf. Eng. 2009, TP09PUB17, 1–13. [Google Scholar]
  8. Campagnolo, A.; Meneghetti, G.; Berto, F.; Tanaka, K. Crack initiation life in notched steel bars under torsional fatigue: Synthesis based on the averaged strain energy density approach. Int. J. Fatigue 2017, 100, 563–574. [Google Scholar] [CrossRef]
  9. Pyka, G.; Kerckhofs, G.; Papantoniou, I.; Speirs, M.; Schrooten, J.; Wevers, M. Surface Roughness and Morphology Customization of Additive Manufactured Open Porous Ti6Al4V Structures. Materials 2013, 6, 4737–4757. [Google Scholar] [CrossRef]
  10. Nicoletto, G. Influence of rough as-built surfaces on smooth and notched fatigue behavior of L-PBF AlSi10Mg. Addit. Manuf. 2020, 34, 101251. [Google Scholar] [CrossRef]
  11. Solberg, K.; Berto, F. Notch-defect interaction in additively manufactured Inconel 718. Int. J. Fatigue 2019, 122, 35–45. [Google Scholar] [CrossRef]
  12. Kou, S. Welding Metallurgy, 2nd ed.; John Wiley & Sons, Inc.: Hoboken, NJ, USA, 2003; ISBN 0-471-43491-4. [Google Scholar]
  13. Frazier, W.E. Metal Additive Manufacturing: A Review. J. Mater. Eng. Perform. 2014, 23, 1917–1928. [Google Scholar] [CrossRef]
  14. Tang, M.; Pistorius, P.C.; Narra, S.P.; Beuth, J. Rapid Solidification: Selective Laser Melting of AlSi10Mg. JOM J. Miner. Met. Mater. Soc. 2016, 68, 960–966. [Google Scholar] [CrossRef]
  15. Khorasani, M.; Gibson, I.; Ghasemi, A.H.; Hadavi, E.; Rolfe, B. Laser Subtractive and Laser Powder Bed Fusion of Metals: Review of Process and Production Features. Rapid Prototyp. J. 2023, 29, 935–958. [Google Scholar] [CrossRef]
  16. Zhang, H.; Zhu, H.; Qi, T.; Hu, Z.; Zeng, X. Selective laser melting of high strength Al–Cu–Mg alloys: Processing, microstructure and mechanical properties. Mater. Sci. Eng. A 2016, 656, 47–54. [Google Scholar] [CrossRef]
  17. Martin, J.H.; Yahata, B.D.; Hundley, J.M.; Mayer, J.A.; Schaedler, T.A.; Pollock, T.M. 3D printing of high-strength aluminium alloys. Nature 2017, 549, 365–369. [Google Scholar] [CrossRef] [PubMed]
  18. Rappaz, M.; Drezet, J.M.; Mathier, V.; Vernède, S. Towards a Micro-Macro Model of Hot Tearing. Mater. Sci. Forum 2006, 519, 1665–1674. [Google Scholar] [CrossRef]
  19. Uddin, S.Z.; Murr, L.E.; Terrazas, C.A.; Morton, P.; Roberson, D.A.; Wicker, R.B. Processing and Characterization of Crack-Free Aluminum 6061 Using High-Temperature Heating in Laser Powder Bed Fusion Additive Manufacturing. Addit. Manuf. 2018, 22, 405–415. [Google Scholar] [CrossRef]
  20. Leirmo, J.L. High Strength Aluminium Alloys in Laser-Based Powder Bed Fusion—A Review. Procedia CIRP 2021, 104, 1747–1752. [Google Scholar] [CrossRef]
  21. Nuechterlein, J.S.; Joseph, J. Reactive Additive Manufacturing. 2019. Available online: https://patents.google.com/patent/US20160271878A1/en (accessed on 17 June 2023).
  22. Spierings, A.B.; Dawson, K.; Heeling, T.; Uggowitzer, P.J.; Schäublin, R.; Palm, F.; Wegener, K. Microstructural features of Sc- and Zr-modified Al-Mg alloys processed by selective laser melting. Mater. Des. 2017, 115, 52–63. [Google Scholar] [CrossRef]
  23. Understanding Metal Matrix Composites—Elementum 3D. 2022. Available online: https://www.elementum3d.com/white-papers/metal-matrix-composites/ (accessed on 17 June 2023).
  24. An Inside Look at How AM Aluminum Alloys are Possible Using RAM Technology—Elementum 3D. 2022. Available online: https://www.elementum3d.com/white-papers/an-inside-look-at-how-am-commercial-aluminum-alloys-are-made-possible-using-ram-technology/ (accessed on 17 June 2023).
  25. Sullivan, E.; Polizzi, A.; Iten, J.; Nuechterlein, J.; Domack, M.; Liu, S. Microstructural Characterization and Tensile Behavior of Reaction Synthesis Aluminum 6061 Metal Matrix Composites Produced via Laser Beam Powder Bed Fusion and Electron Beam Freeform Fabrication. Int. J. Adv. Manuf. Technol. 2022, 121, 2197–2218. [Google Scholar] [CrossRef]
  26. Nicoletto, G. Anisotropic high cycle fatigue behavior of Ti–6Al–4V obtained by powder bed laser fusion. Int. J. Fatigue 2017, 94, 255–262. [Google Scholar] [CrossRef]
  27. Nicoletto, G. A novel test method for the fatigue characterization of metal powder bed fused alloys. Procedia Struct. Integr. 2017, 7, 67–74. [Google Scholar] [CrossRef]
  28. ASTM ISO 22407:2021; Metallic Materials—Fatigue Testing—Axial Plane Bending Method. ISO International: Geneva, Switzerland, 2021.
  29. ISO-ISO 4287:1997; Geometrical Product Specifications (GPS)—Surface Texture: Profile Method—Terms, Definitions and Surface Texture Parameters. ISO International: Geneva, Switzerland, 1997. Available online: https://www.iso.org/standard/10132.html (accessed on 17 June 2023).
  30. 3D Printed Aluminum, AM Powder Solution—Elementum 3D. 2021. Available online: https://www.elementum3d.com/aluminum/ (accessed on 24 July 2023).
  31. Tan, Q.; Zhang, J.; Sun, Q.; Fan, Z.; Li, G.; Yin, Y.; Liu, Y.; Zhang, M.-X. Inoculation Treatment of an Additively Manufactured 2024 Aluminium Alloy with Titanium Nanoparticles. AMI Acta Mater. 2020, 38. [Google Scholar] [CrossRef]
  32. Chen, B.; Xi, X.; Gu, T.; Tan, C.; Song, X. Influence of heat treatment on microstructure evolution and mechanical properties of TiB2/Al 2024 composites fabricated by directed energy deposition. J. Mater. Res. Technol. 2020, 9, 14223–14236. [Google Scholar] [CrossRef]
  33. Wang, S.C.; Starink, M.J. Precipitates and intermetallic phases in precipitation hardening Al–Cu–Mg–(Li) based alloys. Int. Mater. Rev. 2005, 50, 193–215. [Google Scholar] [CrossRef]
  34. Lin, F.; Jia, F.; Ren, M.; Wang, J.; Yang, M.; Chen, Z.; Jiang, Z. Microstructure, mechanical and thermal properties of ultrafine-grained Al2024–TiC-GNPs nanocomposite. Mater. Sci. Eng. A 2022, 841, 142855. [Google Scholar] [CrossRef]
  35. Rosito, M.; Vanzetti, M.; Padovano, E.; Gili, F.; Sampieri, R.; Bondioli, F.; Badini, C.F. Processability of A6061 Aluminum Alloy Using Laser Powder Bed Fusion by In Situ Synthesis of Grain Refiners. Metals 2023, 13, 1128. [Google Scholar] [CrossRef]
  36. Konečná, R.; Nicoletto, G. On the link between as-built surface quality and fatigue behavior of additively manufactured Inconel 718. Procedia Struct. Integr. 2019, 23, 384–389. [Google Scholar] [CrossRef]
  37. Frkan, M.; Konecna, R.; Nicoletto, G.; Kunz, L. Microstructure and fatigue performance of SLM-fabricated Ti6Al4V alloy after different stress-relief heat treatments. Transp. Res. Procedia 2019, 40, 24–29. [Google Scholar] [CrossRef]
  38. Al2024-RAM2. Available online: https://www.elementum3d.com/wp-content/uploads/2023/03/A2024-RAM2-WEB-Data-Sheets-2023-02-22.pdf (accessed on 24 July 2023).
  39. ASTM E466-15; Standard Practice for Conducting Force Controlled Constant Amplitude Axial Fatigue Tests of Metallic Materials. ASTM International: West Conshohocken, PA, USA, 2015.
Figure 1. (a) Specimens’ orientation to the building platform, (b) scheme of fatigue loading, and (c) modified fatigue testing machine RB H01—3D44X.
Metals 13 01615 g001
Figure 2. Microstructure of basic material: (a) structure of melt pools, (b) fine-grained structure formed by equiaxed grains of the α-Al phase, and globular Ti microparticles, LM, and (c) EBSD map, SEM.
Metals 13 01615 g002
Figure 3. Microstructure details of basic material: (a) ultra-fine grains, (b,c) distribution of main alloying elements Cu and Mg, and (d) distribution of Ti nanoparticles. STEM-EDS analyzer.
Metals 13 01615 g003
Figure 4. Microstructure after T6 heat treatment: (a) randomly oriented coarse and fine grains of the α-Al phase, (b) detail of fine grains and coarse grains area, LM, and (c) EBSD map, SEM.
Metals 13 01615 g004
Figure 5. Microstructure details after T6: (a) precipitates in coarse grain, and (bd) Al2Cu and Al2CuMg precipitates. STEM-EDS analyzer.
Metals 13 01615 g005
Figure 6. Microstructure details after T6 heat treatment—interface CG and FG: (a,b) distribution of main alloying elements Cu and Mg, (c,d) distribution of B and Ti, (e) interface of coarse grains and fine grains, and (fh) distribution of secondary alloying elements Mn, Fe, and Si. STEM-EDS analyzer.
Metals 13 01615 g006
Figure 7. (a) Metallographic profiles of loaded surfaces for specimen orientations of A-, B, C, and 45-, and (b) details with sites where fatigue cracks were observed.
Metals 13 01615 g007
Figure 8. S-N curves of specimens with different build orientation.
Metals 13 01615 g008
Figure 9. Comparison of S-N curves with different roughness of specimens.
Metals 13 01615 g009
Figure 10. Sites of fatigue crack initiations for the different build orientation of the specimens. SEM.
Metals 13 01615 g010
Figure 11. Fractographic analysis of characteristic fatigue fracture surfaces: (a) overview, (b) initiation site, and (c) detail from the final static failure. SEM.
Metals 13 01615 g011
Table 1. Chemical composition of the Al2024-RAM2 alloy.
Elements [wt.%]SiFeCuMnMgZnTiAl
Al2024–RAM20.120.13.680.571.470.022.43balance
Table 2. Microhardness HV0.01.
MeasurementCoarse GrainFine GrainTi Particles
1157144666
2147156652
3150148652
4145150624
Average value150 ± 6150 ± 5648 ± 10
Table 3. The average surface roughness for different building orientations.
OrientationRa [µm]Rz [µm]
A-2.15.8
B12.334.8
C1234.2
45-17.649.8
A- 180SP0.61.6
Disclaimer/Publisher’s Note: The statements, opinions and data contained in all publications are solely those of the individual author(s) and contributor(s) and not of MDPI and/or the editor(s). MDPI and/or the editor(s) disclaim responsibility for any injury to people or property resulting from any ideas, methods, instructions or products referred to in the content.

