
High-Resolution Characterization of Deformation Induced Martensite in Large Areas of Fatigued Austenitic Stainless Steel Using Deep Learning
 , , , ,
Abstract
:
1. Introduction
2. Materials and Methods
3. Results and Discussion
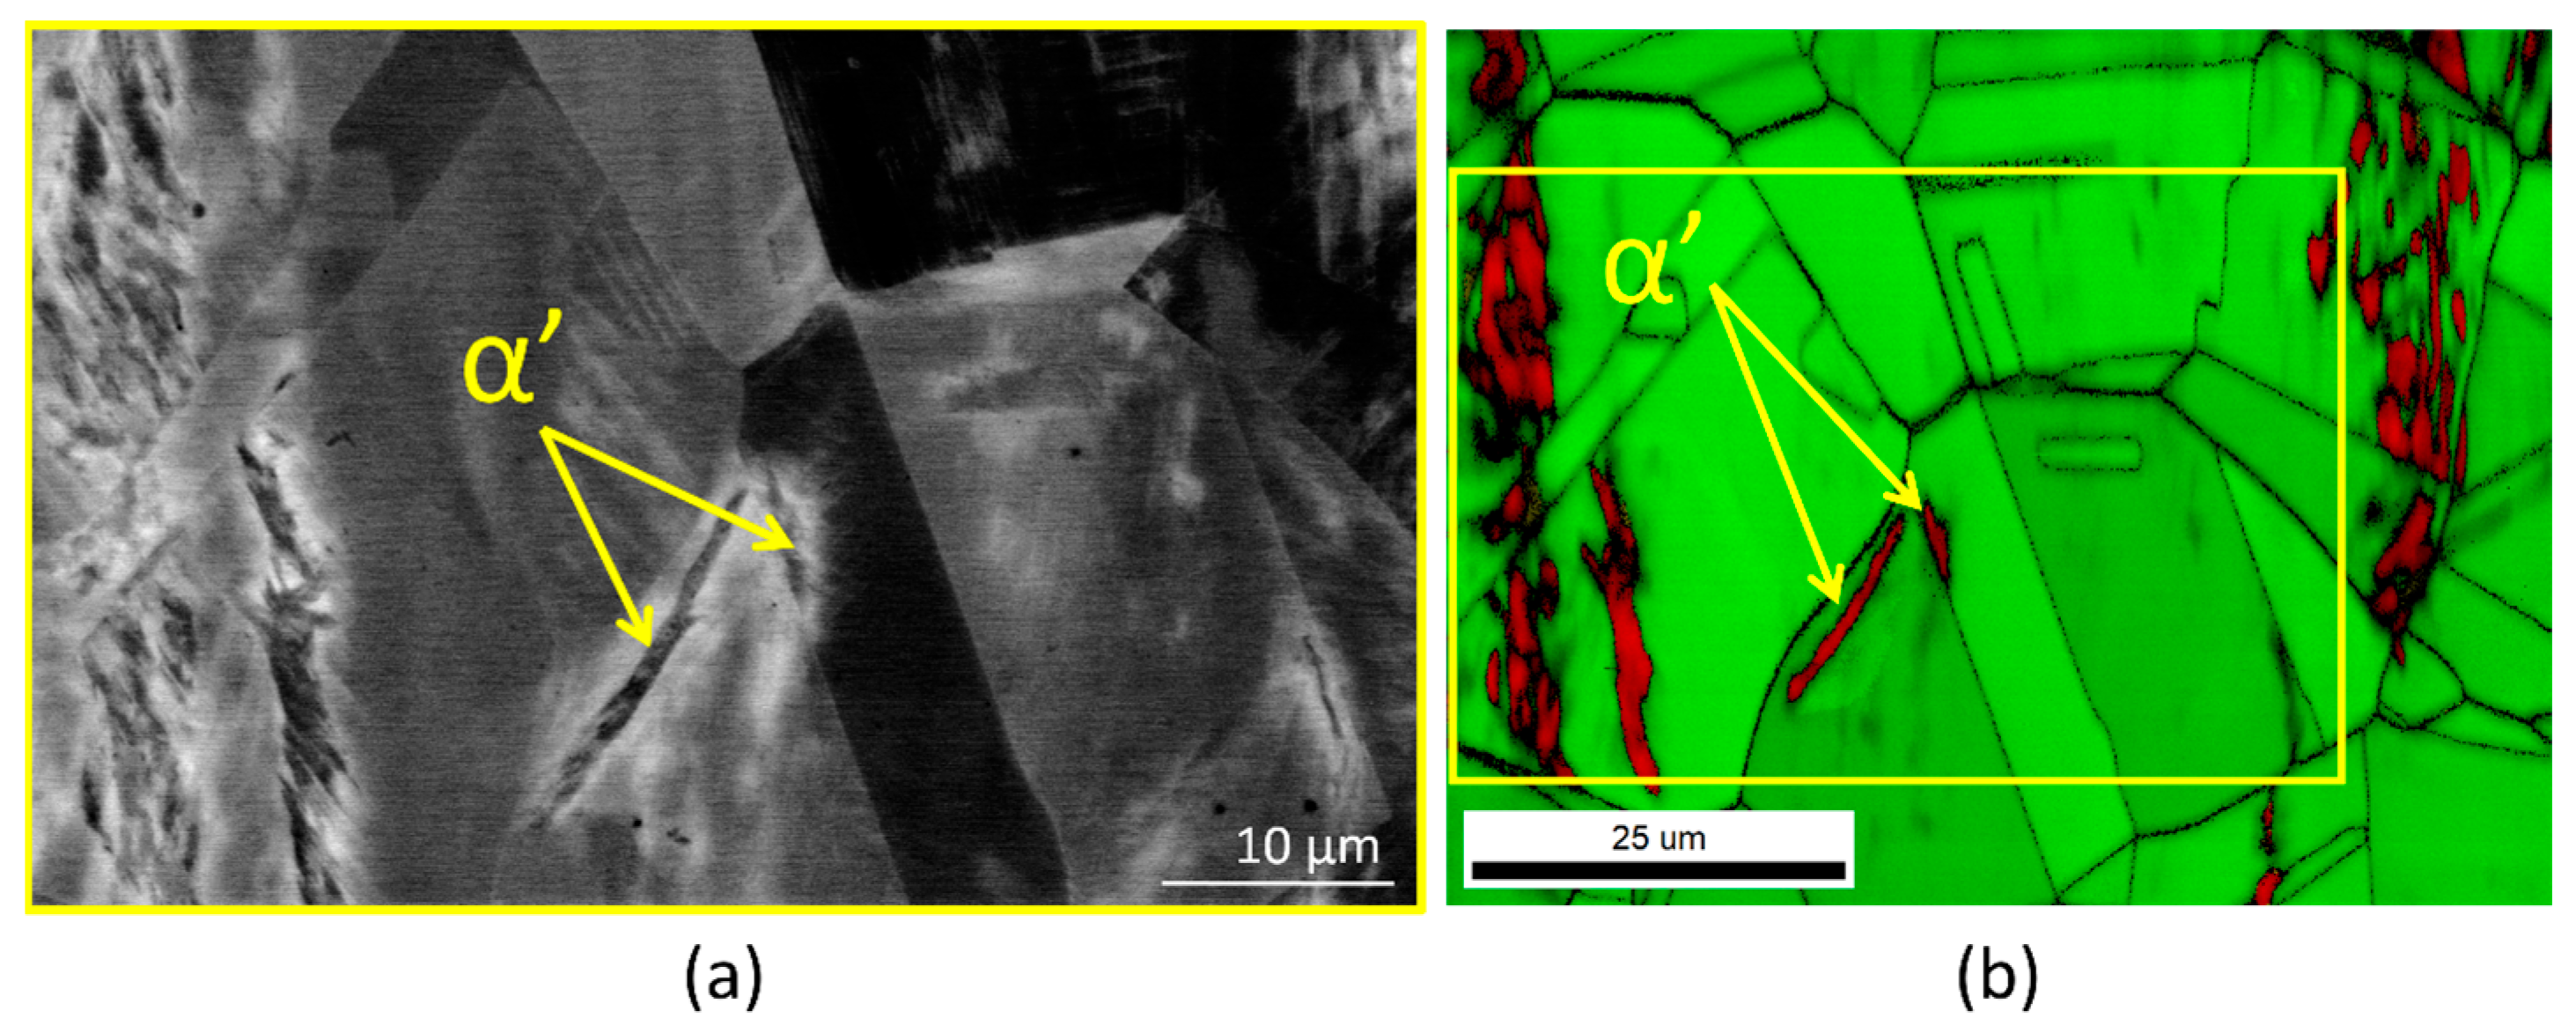
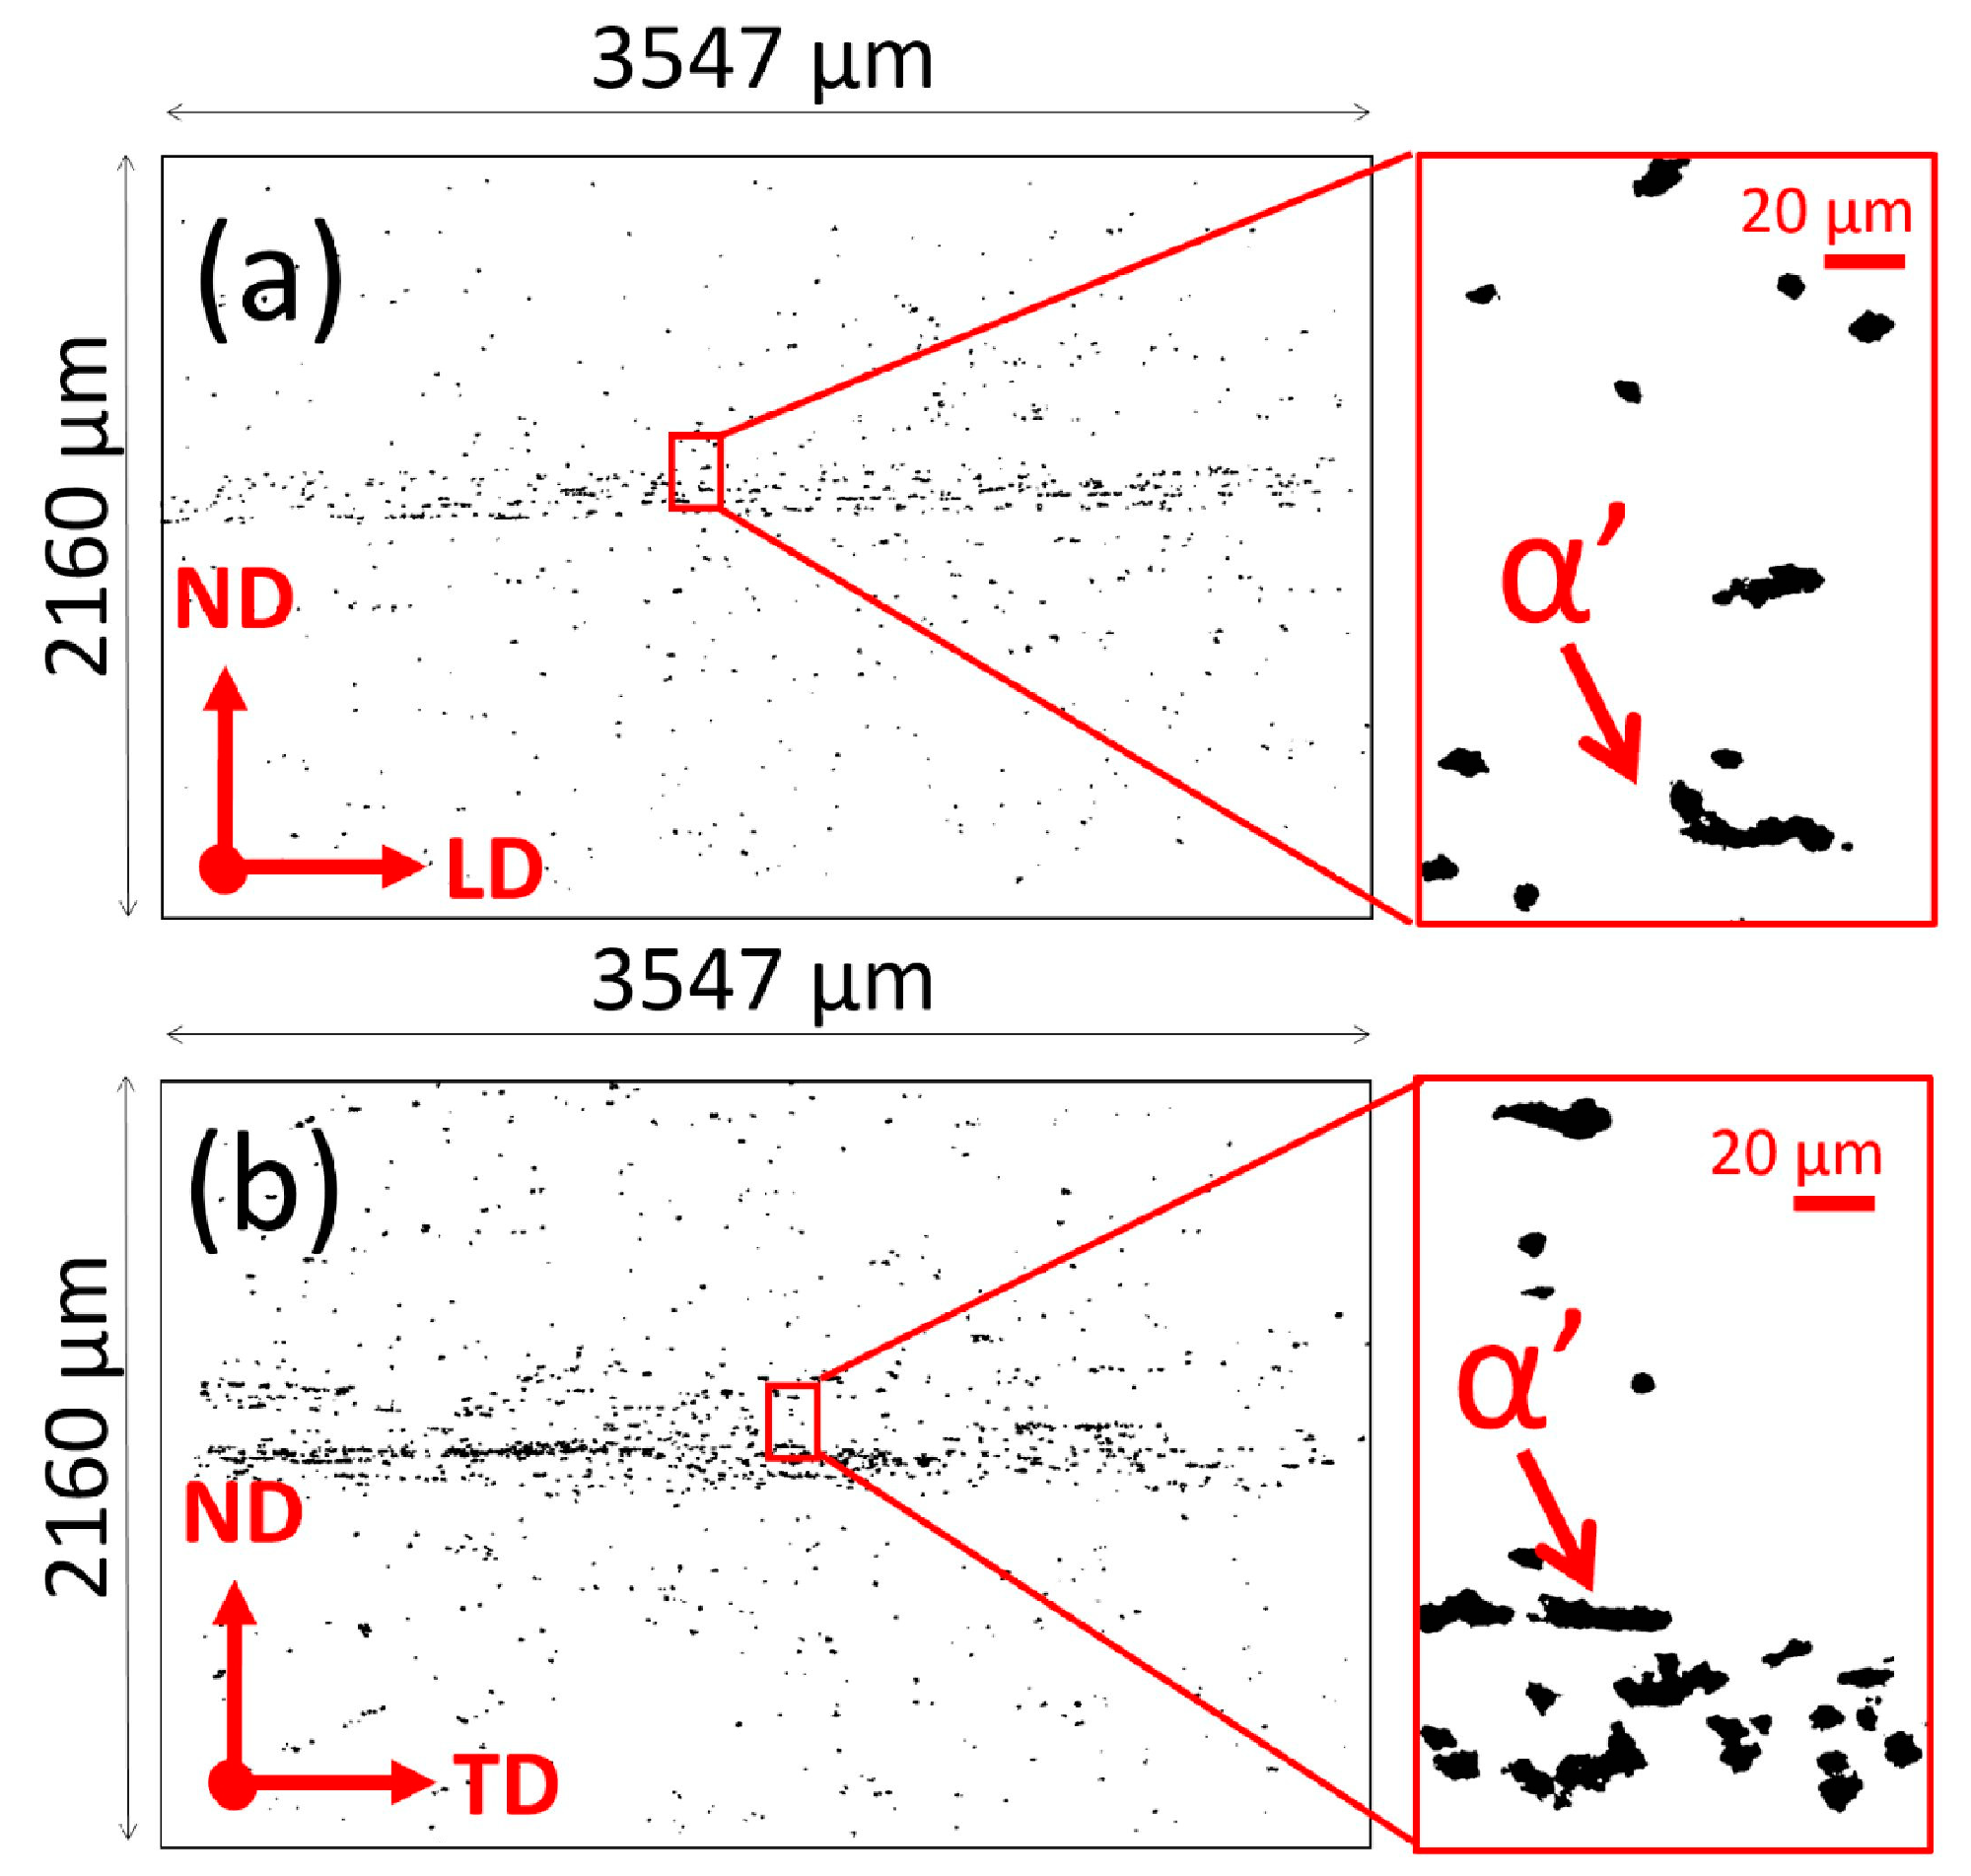
3.1. Visualization of Martensite Phase in SEM Micrographs
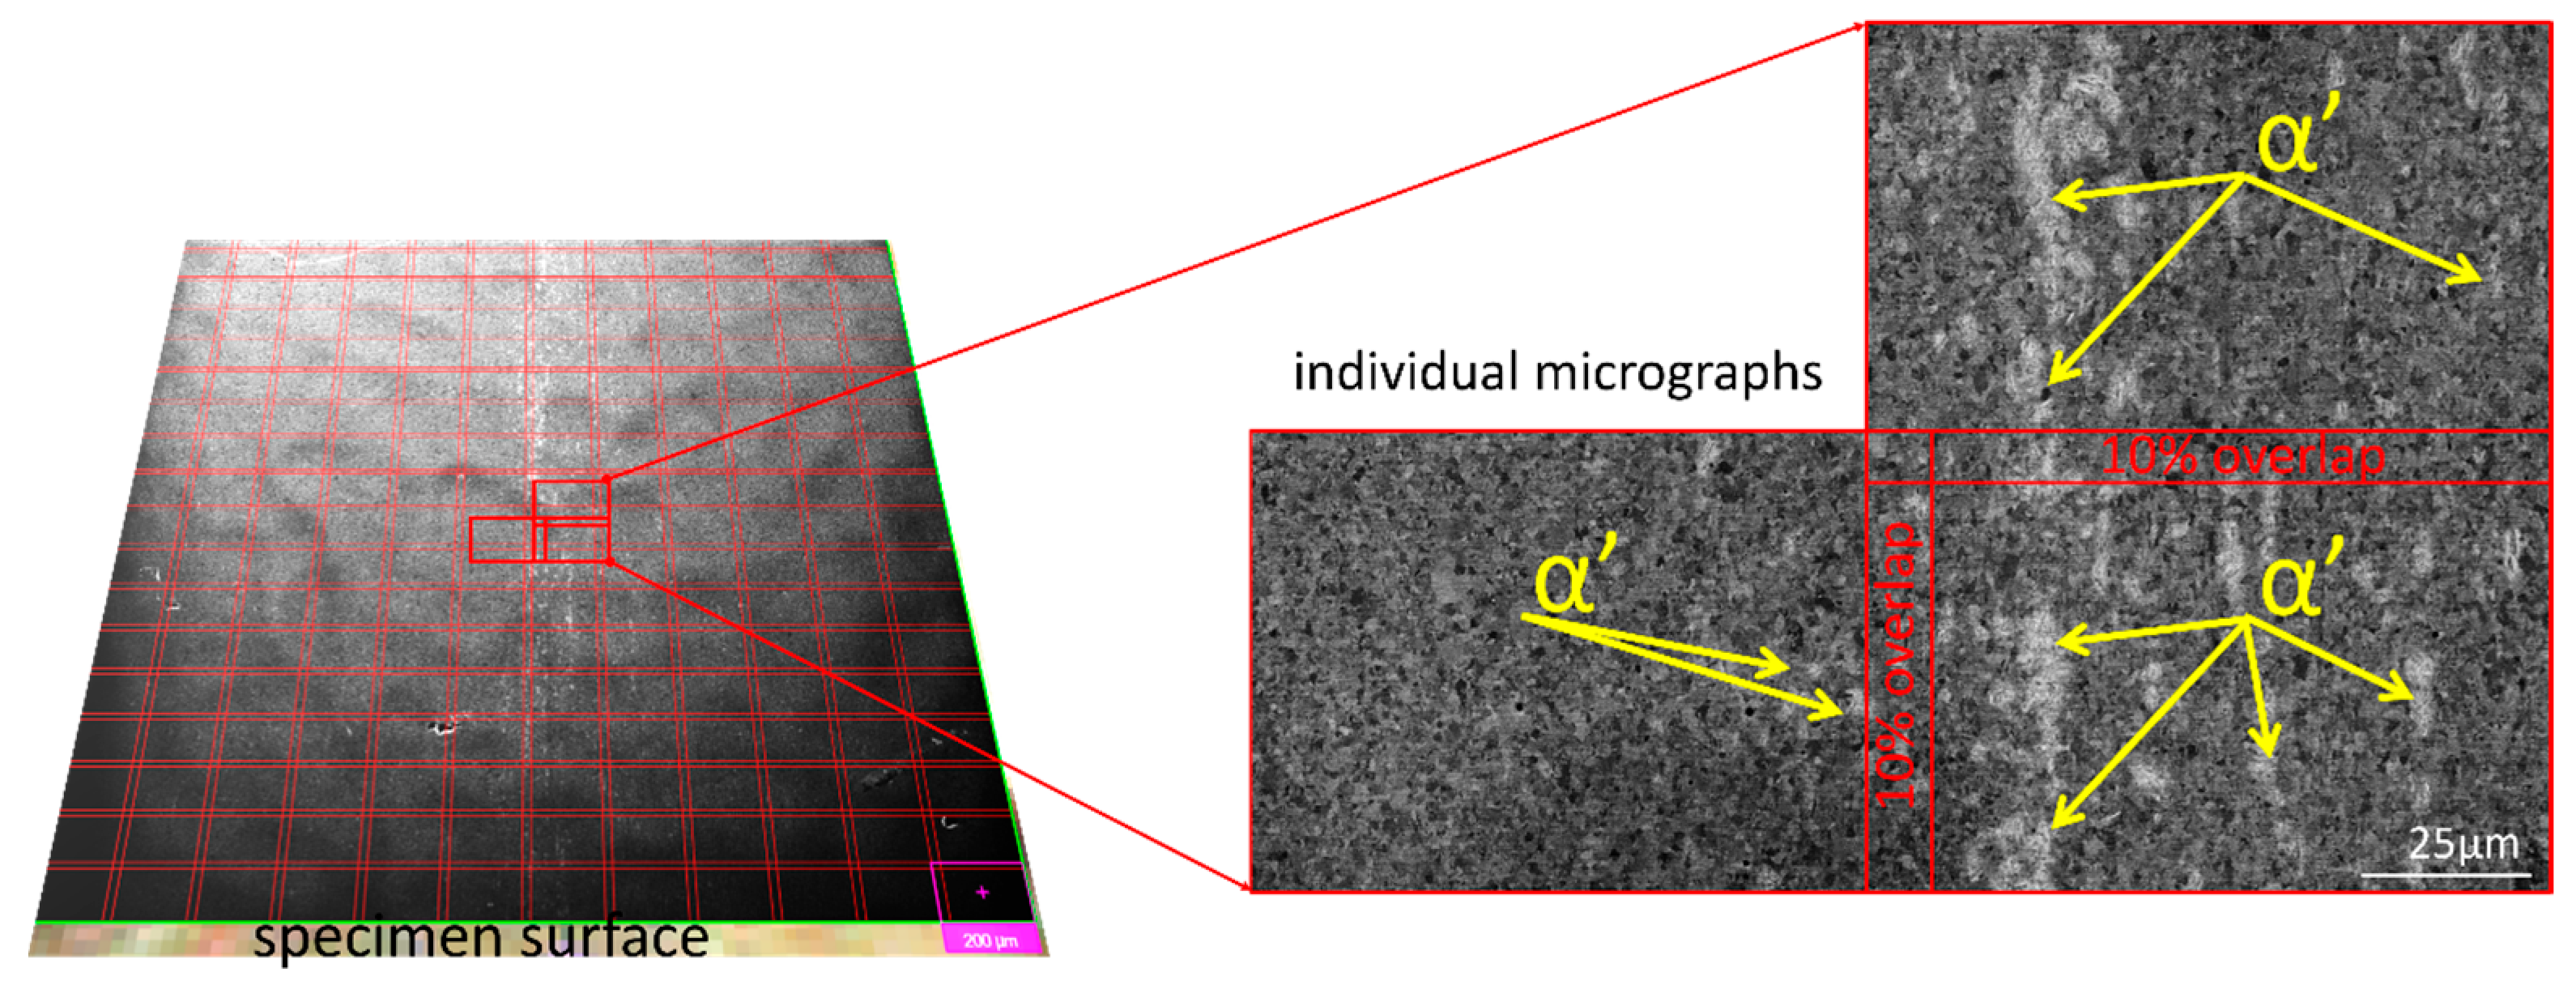
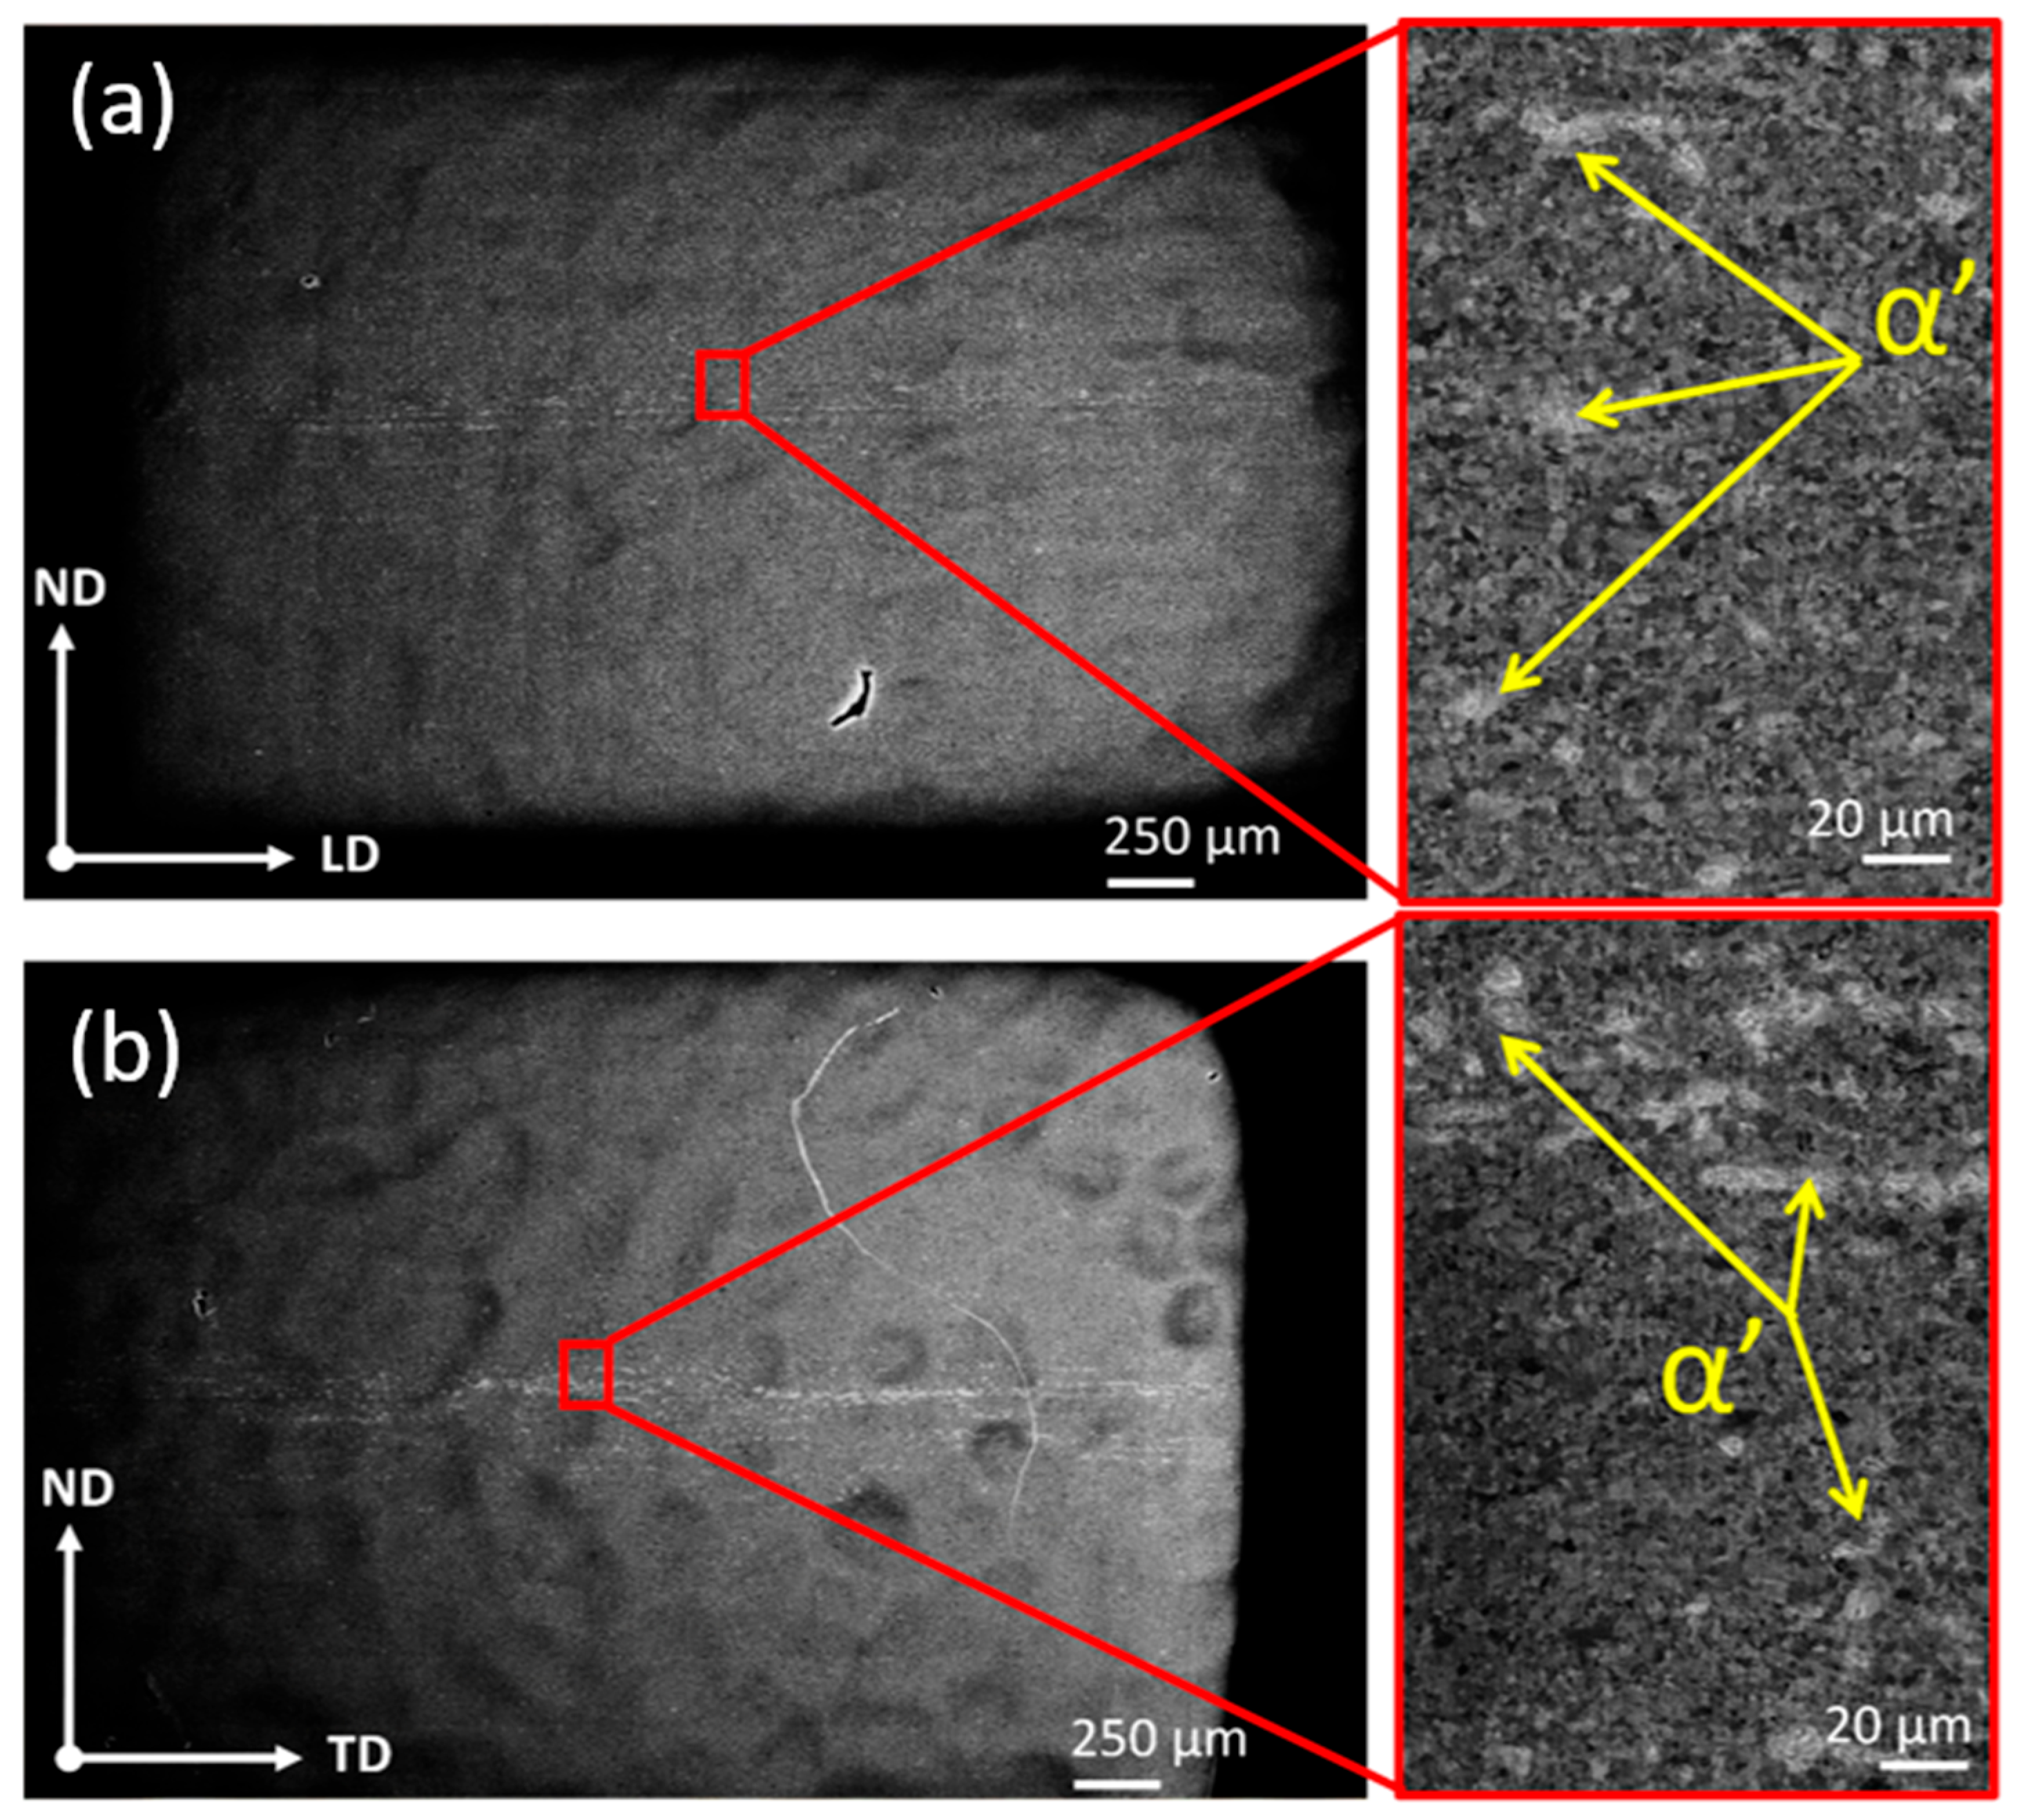
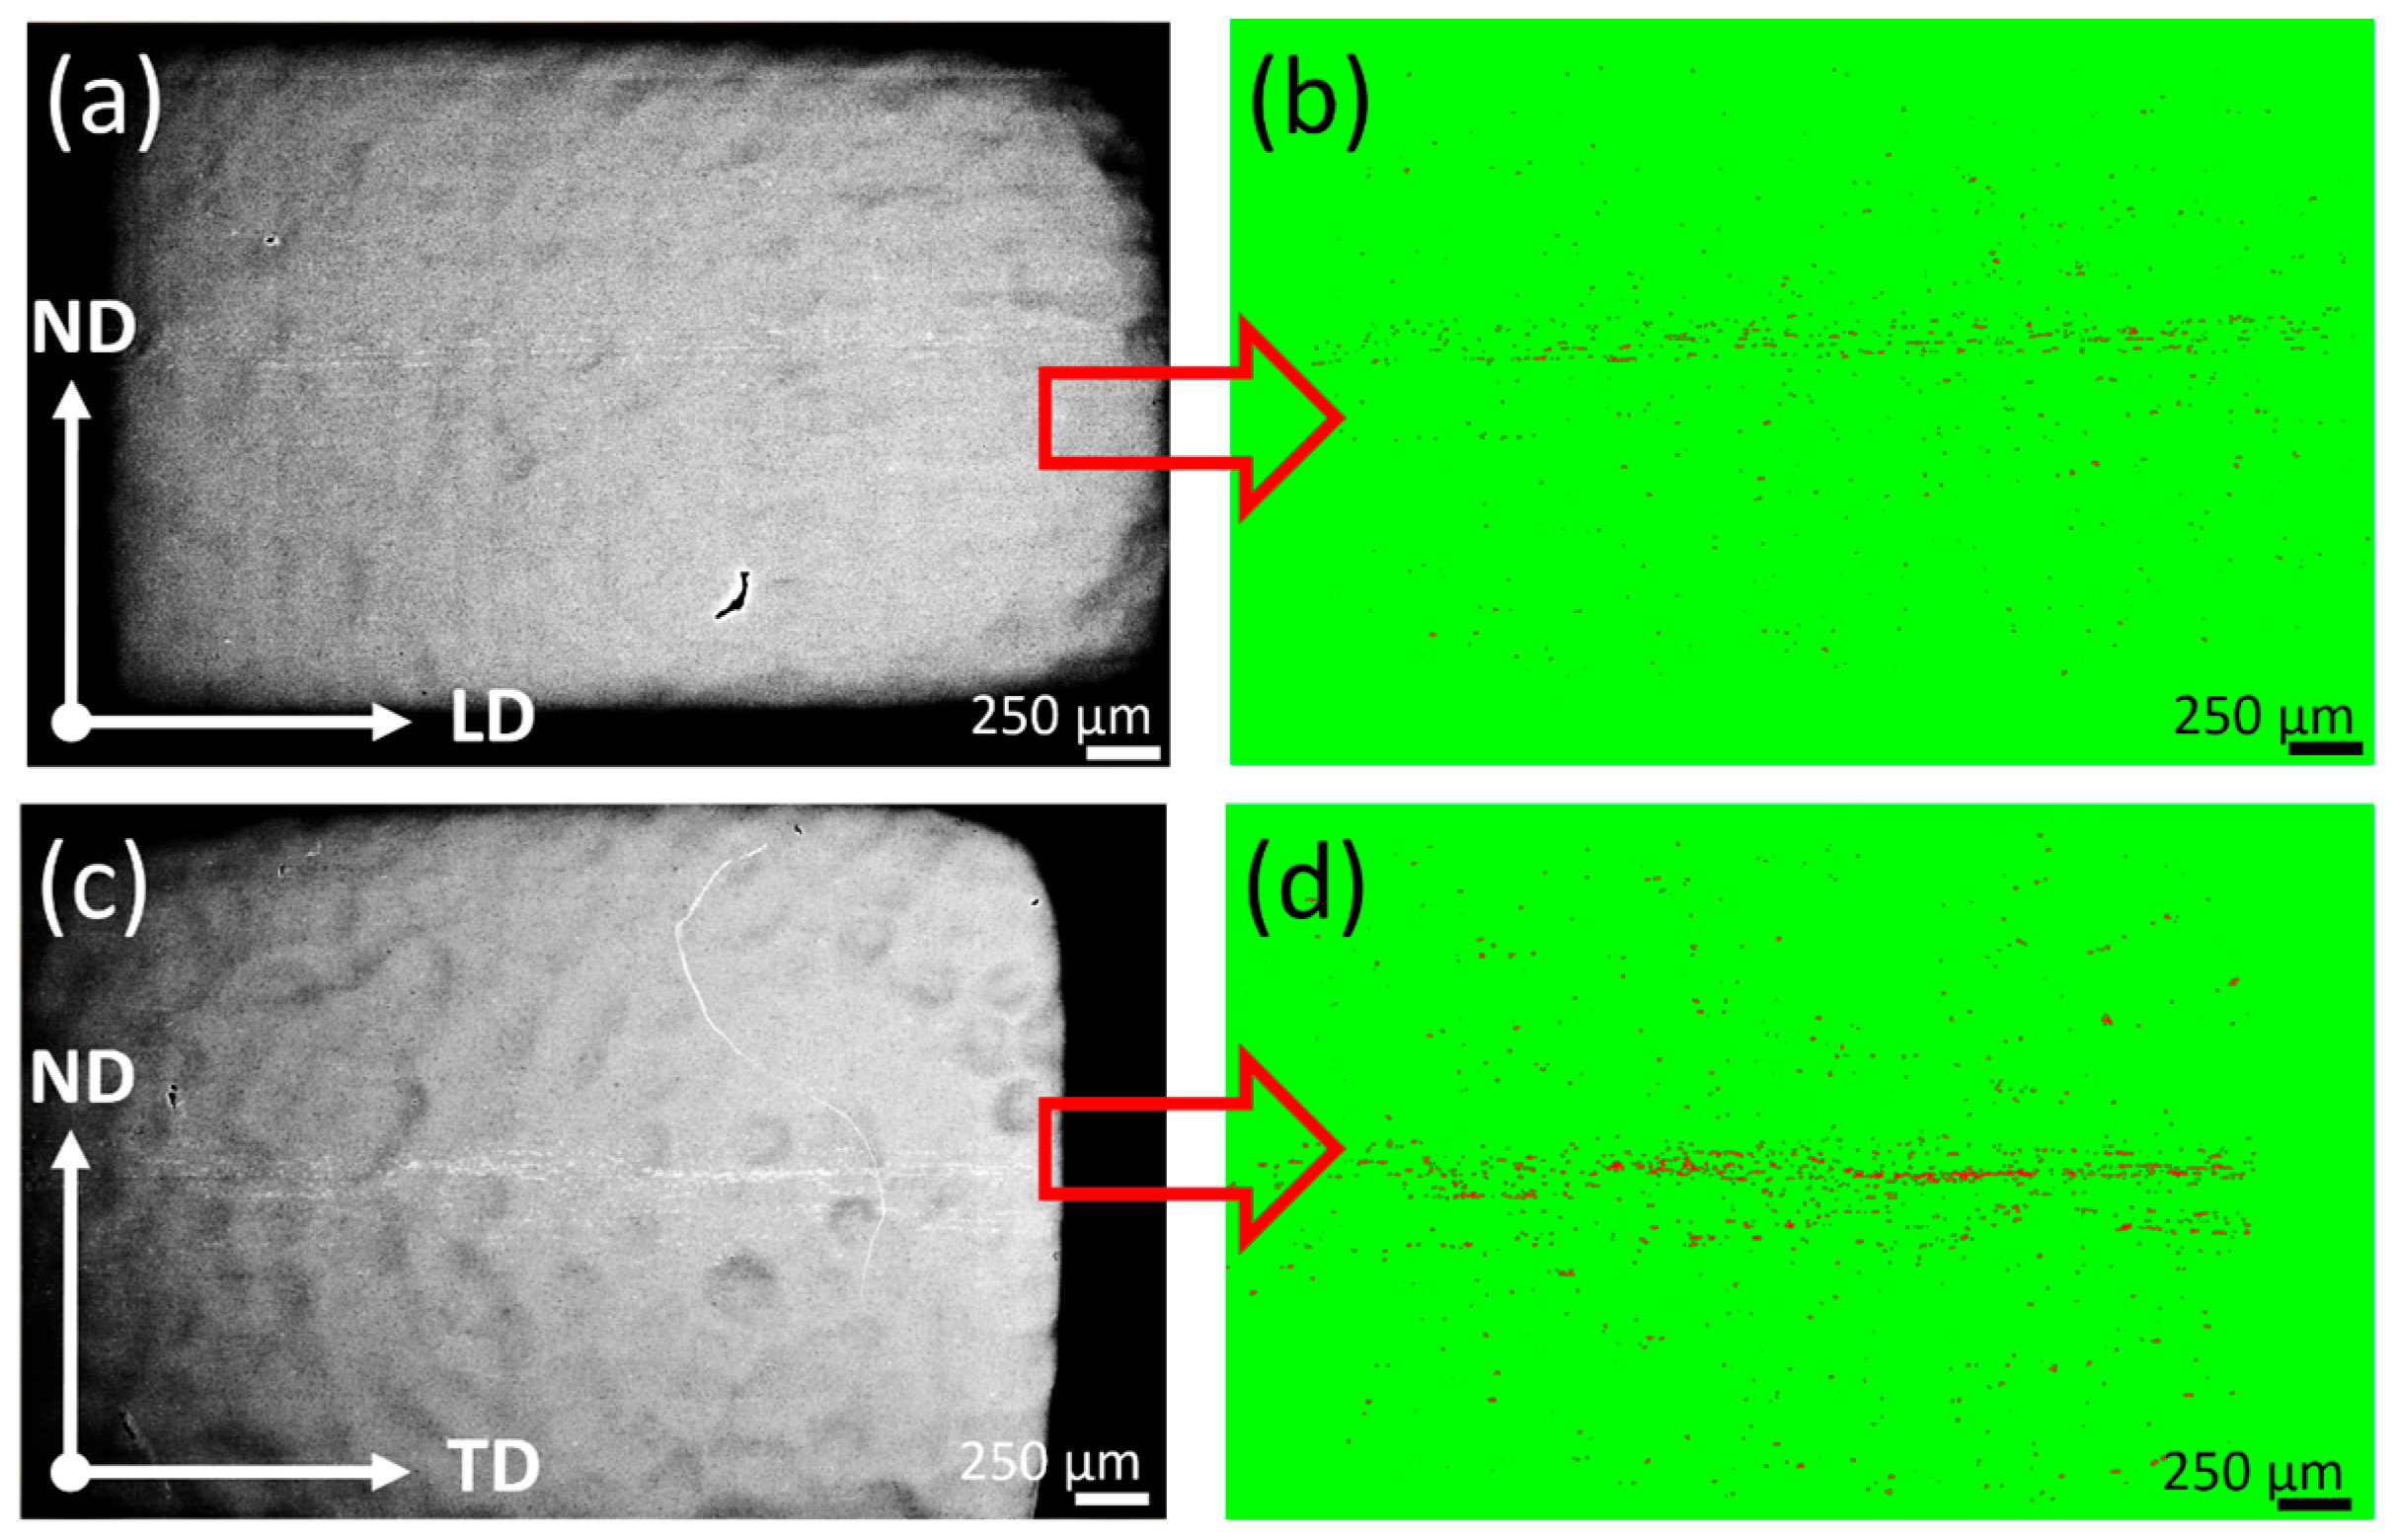
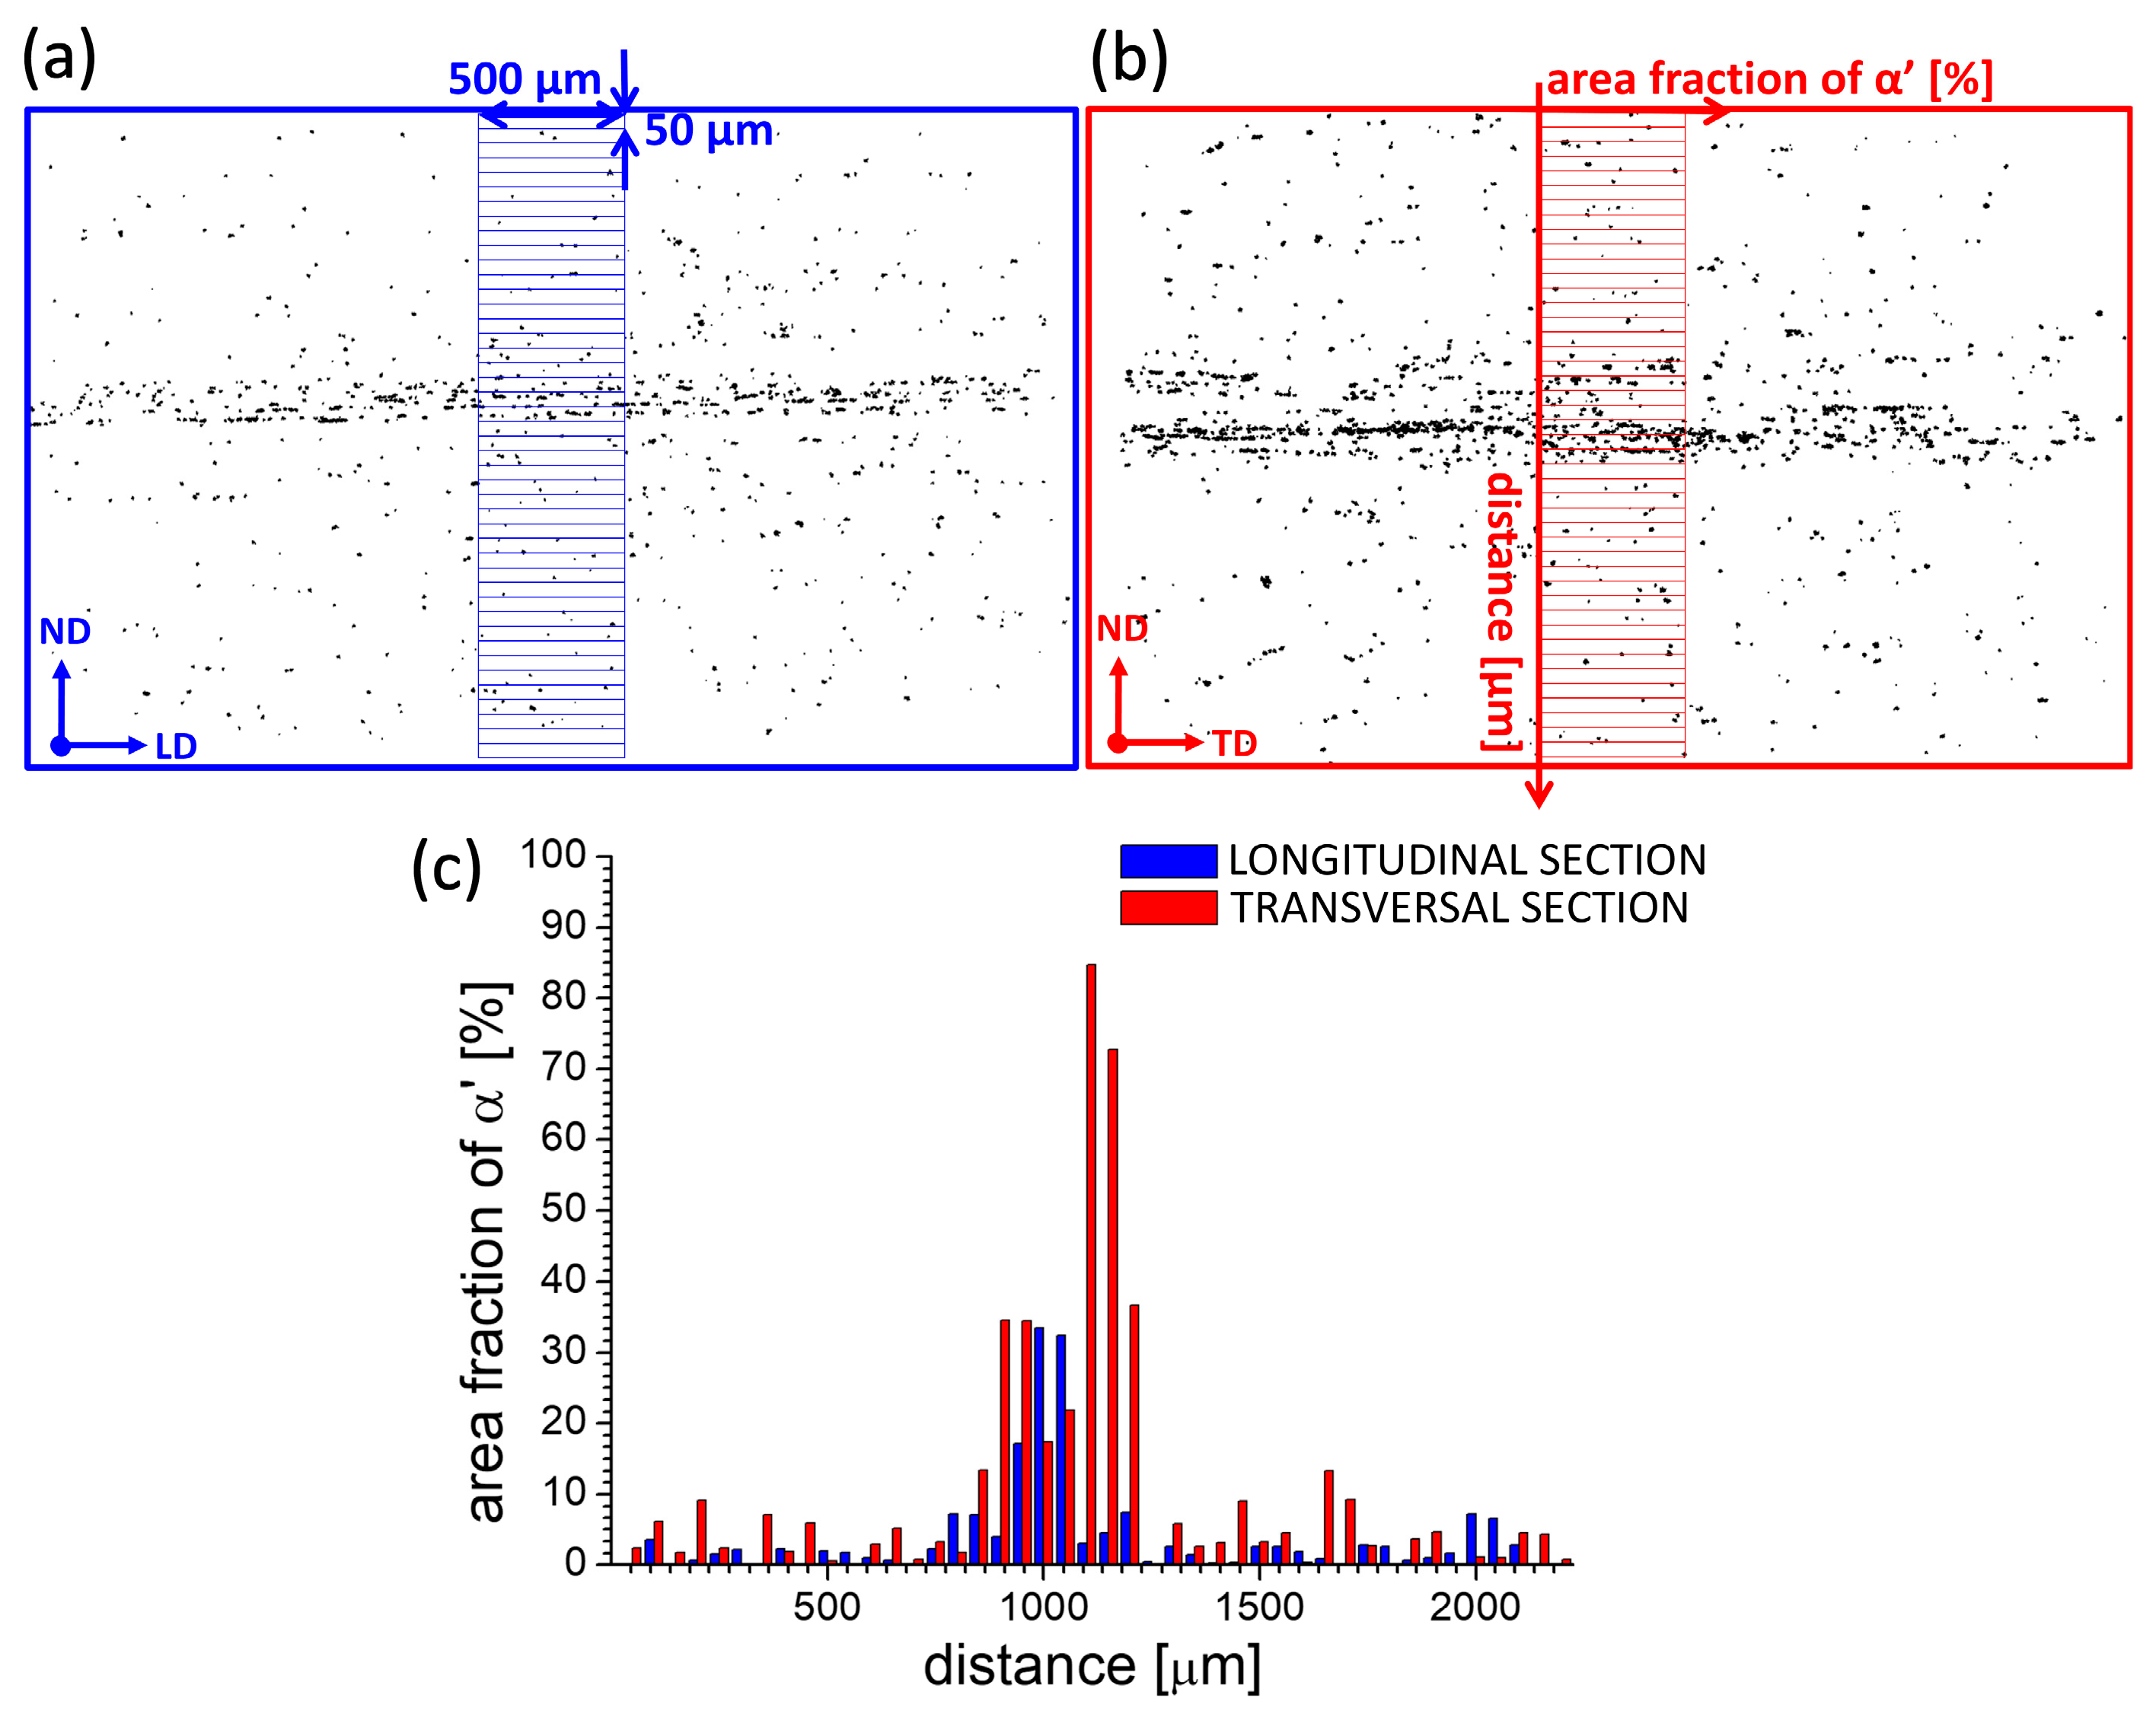
3.2. Large-Area Mapping: Automated Image Acquisition in the SEM
3.3. Deep Learning
4. Summary and Conclusions
Author Contributions
Funding
Data Availability Statement
Acknowledgments
Conflicts of Interest
References
- Boniardi, M.; Casaroli, A. Stainless Steels; Lucefin S.p.A.: Esine, Italy, 2014. [Google Scholar]
- Lacombe, P.; Baroux, B.; Beranger, G. (Eds.) Stainless Steels; Les Editions de Physique: Les Ulis, France, 1993. [Google Scholar]
- McGuire, M.F. Stainless Steels for Design Engineers; ASM International: Materials Park, OH, USA, 2008. [Google Scholar]
- Lo, K.H.; Shek, C.H.; Lai, J.K.L. Recent developments in stainless steels. Mater. Sci. Eng. R Rep. 2009, 65, 39–104. [Google Scholar] [CrossRef]
- Biermann, H.; Aneziris, C.G. (Eds.) Austenitic TRIP/TWIP Steels and Steel-Zirconia Composites; Springer Series in Materials Science 298; Springer Nature: Cham, Switzerland, 2020. [Google Scholar]
- Hedström, P.; Odqvist, J. Deformation-induced martensitic transformation in metastable austenitic stainless steels–Introduction and current perspectives. In Stainless Steel: Microstructure, Mechanical Properties and Methods of Application; Pramanik, A., Basak, A.K., Eds.; Nova Science Publishers: New York, NY, USA, 2015; pp. 81–106. [Google Scholar]
- de Bellefon, G.M.; Van Duysen, J.C. Tailoring plasticity of austenitic stainless steels for nuclear applications: Review of mechanisms controlling plasticity of austenitic steels below 400 °C. J. Nucl. Mater. 2016, 475, 168–191. [Google Scholar] [CrossRef]
- Sohrabi, M.J.; Naghizadeh, M.; Mirzadeh, H. Deformation-induced martensite in austenitic stainless steels: A review. Arch. Civ. Mech. Eng. 2020, 20, 124. [Google Scholar] [CrossRef]
- Hahnenberger, F.; Smaga, M.; Eifler, D. Microstructural investigation of the fatigue behavior and phase transformation in metastable austenitic steels at ambient and lower temperatures. Int. J. Fatigue 2014, 69, 36–48. [Google Scholar] [CrossRef]
- Tian, Y.E.; Gorbatov, O.I.; Borgenstam, A.; Ruban, A.V.; Hedström, P. Deformation microstructure and deformation-induced martensite in austenitic Fe-Cr-Ni alloys depending on stacking fault energy. Metall. Mater. Trans. A 2017, 48, 1–7. [Google Scholar] [CrossRef]
- Rafaja, D.; Ullrich, C.; Motylenko, M.; Martin, S. Microstructure aspects of the deformation mechanisms in metastable austenitic steels. In Austenitic TRIP/TWIP Steels and Steel-Zirconia Composites: Design of Tough, Transformation-Strengthened Composites and Structures; Chapter 11; Biermann, H., Aneziris, C.G., Eds.; Springer Series in Materials Science 298; Springer Nature: Cham, Switzerland, 2020; pp. 325–377. [Google Scholar]
- Talonen, J.; Hänninen, H. Formation of shear bands and strain-induced martensite during plastic deformation of metastable austenitic stainless steels. Acta Mater. 2007, 55, 6108–6118. [Google Scholar] [CrossRef]
- Martin, S.; Fabrichnaya, O.; Rafaja, D. Prediction of the local deformation mechanisms in metastable austenitic steels from the local concentration of the main alloying elements. Mater. Lett. 2015, 159, 484–488. [Google Scholar] [CrossRef]
- Walter, M.; Mujica Roncery, L.; Weber, S.; Leich, L.; Theisen, W. XRD measurement of stacking fault energy of Cr–Ni austenitic steels: Influence of temperature and alloying elements. J. Mater. Sci. 2020, 55, 13424–13437. [Google Scholar] [CrossRef]
- Man, J.; Smaga, M.; Kuběna, I.; Eifler, D.; Polák, J. Effect of metallurgical variables on the austenite stability in fatigued AISI 304 type steels. Eng. Fract. Mech. 2017, 185, 139–159. [Google Scholar] [CrossRef]
- Weidner, A. Deformation Processes in TRIP/TWIP Steels: In-Situ Characterization Techniques; Springer Series in Materials Science 295; Springer Nature: Cham, Switzerland, 2020. [Google Scholar]
- Somani, M.C.; Juntunen, P.; Karjalainen, L.P.; Misra, R.D.K.; Kyröläinen, A. Enhanced mechanical properties through reversion in metastable austenitic stainless steels. Metall. Mater. Trans. A 2009, 40, 729–744. [Google Scholar] [CrossRef]
- Järvenpää, A.; Jaskari, M.; Kisko, A.; Karjalainen, P. Processing and properties of reversion-treated austenitic stainless steels. Metals 2020, 10, 281. [Google Scholar] [CrossRef]
- Tobler, R.L.; Nishimura, A.; Yamamoto, J. Design-relevant mechanical properties of 316-type steels for superconducting magnets. Cryogenics 1997, 37, 533–550. [Google Scholar] [CrossRef]
- Nishimura, A.; Ono, Y.; Umezawa, O.; Kumagai, S.; Kato, Y.; Kato, T.; Yuri, T.; Komatsu, M. Study on development policy for new cryogenic structural material for superconducting magnet of fusion reactor. Nucl. Mater. Energy 2022, 30, 101125. [Google Scholar] [CrossRef]
- De Backer, F.; Schoss, V.; Maussner, G. Investigations on the evaluation of the residual fatigue life-time in austenitic stainless steels. Nucl. Eng. Des. 2001, 206, 201–219. [Google Scholar] [CrossRef]
- Leber, H.J.; Niffenegger, M.; Tirbonod, B. Microstructural aspects of low cycle fatigued austenitic stainless tube and pipe steels. Mater. Charact. 2007, 58, 1006–1015. [Google Scholar] [CrossRef]
- Smaga, M.; Walther, F.; Eifler, D. Deformation-induced martensitic transformation in metastable austenitic steels. Mater. Sci. Eng. A 2008, 483–484, 394–397. [Google Scholar] [CrossRef]
- Mishakin, V.; Gonchar, A.; Kurashkin, K.; Kachanov, M. Prediction of fatigue life of metastable austenitic steel by a combination of acoustic and eddy current data. Int. J. Fatigue 2020, 141, 105846. [Google Scholar] [CrossRef]
- Acosta, R.; Heckmann, K.; Sievers, J.; Schopf, T.; Bill, T.; Starke, P.; Donnerbauer, K.; Lücker, L.; Walther, F.; Boller, C. Microstructure-based lifetime assessment of austenitic steel AISI 347 in view of fatigue, environmental conditions and NDT. Appl. Sci. 2021, 11, 11214. [Google Scholar] [CrossRef]
- Guo, X.; Post, J.; Groen, M.; Bleck, W. Stress oriented delayed cracking induced by dynamic martensitic transformation in meta-stable austenitic stainless steels. Steel Res. Int. 2011, 82, 6–13. [Google Scholar] [CrossRef]
- Papula, S.; Talonen, J.; Hänninen, H. Effect of residual stress and strain-induced α′-martensite on delayed cracking of metastable austenitic stainless steels. Metall. Mater. Trans. A 2014, 45, 1238–1246. [Google Scholar] [CrossRef]
- San Marchi, C.; Michler, T.; Nibur, K.A.; Somerday, B.P. On the physical differences between tensile testing of type 304 and 316 austenitic stainless steels with internal hydrogen and in external hydrogen. Int. J. Hydrog. Energy 2010, 35, 9736–9745. [Google Scholar] [CrossRef]
- Egels, G.; Roncery, L.M.; Fussik, R.; Theisen, W.; Weber, S. Impact of chemical inhomogeneities on local material properties and hydrogen environment embrittlement in AISI 304L steels. Int. J. Hydrog. Energy 2018, 43, 5206–5216. [Google Scholar] [CrossRef]
- Izawa, C.; Wagner, S.; Deutges, M.; Weber, S.; Pargeter, R.; Michler, T.; Uchida, H.H.; Gemma, R.; Pundt, A. Relationship between hydrogen embrittlement and Md30 temperature: Prediction of low-nickel austenitic stainless steel’s resistance. Int. J. Hydrog. Energy 2019, 44, 25064–25075. [Google Scholar] [CrossRef]
- Barrera, O.; Bombac, D.; Chen, Y.; Daff, T.D.; Galindo-Nava, E.; Gong, P.; Haley, D.; Horton, R.; Katzarov, I.; Kermode, J.R.; et al. Understanding and mitigating hydrogen embrittlement of steels: A review of experimental, modelling and design progress from atomistic to continuum. J. Mater. Sci. 2018, 53, 6251–6290. [Google Scholar] [CrossRef] [PubMed]
- Qiu, Y.; Yang, H.; Tong, L.; Wang, L. Research progress of cryogenic materials for storage and transportation of liquid hydrogen. Metals 2021, 11, 1101. [Google Scholar] [CrossRef]
- de Abreu, H.F.G.; de Carvalho, S.S.; de Lima Neto, P.; dos Santos, R.P.; Freire, V.N.; de Oliveira Silva, P.M.; Tavares, S.S.M. Deformation induced martensite in an AISI 301LN stainless steel: Characterization and influence on pitting corrosion resistance. Mater. Res. 2007, 10, 359–366. [Google Scholar] [CrossRef]
- Lv, J.; Luo, H. Effects of strain and strain-induced α′-martensite on passive films in AISI 304 austenitic stainless steel. Mater. Sci. Eng. C 2014, 34, 484–490. [Google Scholar] [CrossRef]
- Solomon, N.; Solomon, I. Effect of deformation-induced phase transformation on AISI 316 stainless steel corrosion resistance. Eng. Fail. Anal. 2017, 79, 865–875. [Google Scholar] [CrossRef]
- Silva, P.M.; Filho, M.C.; Cruz, J.A.D.; Sales, A.J.; Sombra, A.S.; Tavares, J.M.R. Influence on pitting corrosion resistance of AISI 301LN and 316L stainless steels subjected to cold-induced deformation. Metals 2023, 13, 443. [Google Scholar] [CrossRef]
- Talonen, J.; Aspegren, P.; Hänninen, H. Comparison of different methods for measuring strain induced α′-martensite content in austenitic steels. Mater. Sci. Technol. 2004, 20, 1506–1512. [Google Scholar] [CrossRef]
- Haušild, P.; Davydov, V.; Drahokoupil, J.; Landa, M.; Pilvin, P. Characterization of strain-induced martensitic transformation in a metastable austenitic stainless steel. Mater. Des. 2010, 31, 1821–1827. [Google Scholar] [CrossRef]
- Celada-Casero, C.; Kooiker, H.; Groen, M.; Post, J.; San-Martin, D. In-situ investigation of strain-induced martensitic transformation kinetics in an austenitic stainless steel by inductive measurements. Metals 2017, 7, 271. [Google Scholar] [CrossRef]
- Carneiro, Í.; Simões, S. Recent advances in EBSD characterization of metals. Metals 2020, 10, 1097. [Google Scholar] [CrossRef]
- Man, J.; Järvenpää, A.; Jaskari, M.; Kuběna, I.; Fintová, S.; Chlupová, A.; Karjalainen, L.P.; Polák, J. Cyclic deformation behaviour and stability of grain-refined 301LN austenitic stainless structure. In MATEC Web of Conferences; EDP Sciences: Les Ulis, France, 2018; Volume 165, p. 06005. [Google Scholar]
- Järvenpää, A.; Jaskari, M.; Man, J.; Karjalainen, L.P. Austenite stability in reversion-treated structures of a 301LN steel under tensile loading. Mater. Charact. 2017, 127, 12–26. [Google Scholar] [CrossRef]
- Järvenpää, A.; Jaskari, M.; Man, J.; Karjalainen, L.P. Stability of grain-refined reversed structures in a 301LN austenitic stainless steel under cyclic loading. Mater. Sci. Eng. A 2017, 703, 280–292. [Google Scholar] [CrossRef]
- FEI Company. MagellanTM XHR SEM User Manual; FEI Company: Hillsboro, OR, USA, 2001. [Google Scholar]
- Šakić, A.; Nanver, L.K.; van Veen, G.; Kooijman, K.; Vogelsamg, P.; Scholtes, T.L.M.; de Boer, W.; Wien, W.H.A.; Milosavljevic, S.; Heerkens, C.T.H.; et al. Versatile silicon photodiode detector technology for scanning electron microscopy with high-efficiency sub-5keV electron detection. In Proceedings of the 2010 International Electron Devices Meeting, San Francisco, CA, USA, 6–8 December 2010; pp. 31.4.1–31.4.4. [Google Scholar] [CrossRef]
- FEI Company. FEI Maps 2.5 SW Application User Guide; FEI Company: Hillsboro, OR, USA, 2016. [Google Scholar]
- Mikmeková, Š.; Yamada, K.; Noro, H. Dual-phase steel structure visualized by extremely slow electrons. Microscopy 2015, 64, 437–443. [Google Scholar] [CrossRef]
- Sato, K.; Sueyoshi, H.; Yamada, K. Characterization of complex phase steel using backscattered electron images with controlled collection angles. Microscopy 2015, 64, 297–304. [Google Scholar] [CrossRef]
- Marshall, P. Austenitic Stainless Steels: Microstructure and Mechanical Properties; Elsevier Applied Science Publishers: London, UK; New York, NY, USA, 1984; p. 29. [Google Scholar]
- Ronneberger, O.; Fischer, P.; Brox, T. U-Net: Convolutional networks for biomedical image segmentation. In Proceedings of the 18th International Conference on Medical Image Computing and Computer-Assisted Intervention (MICCAI 2015), Munich, Germany, 5–9 October 2015; Part III 18. Springer International Publishing: Cham, Switzerland, 2015; pp. 234–241. [Google Scholar]
- Gu, J.; Wang, Z.; Kuen, J.; Ma, L.; Shahroudy, A.; Shuai, B.; Liu, T.; Wang, X.; Wang, L.; Wang, G.; et al. Recent advances in convolutional neural networks. Pattern Recognit. 2018, 77, 354–377. [Google Scholar] [CrossRef]
- Li, Z.; Liu, F.; Yang, W.; Peng, S.; Zhou, J. A survey of convolutional neural networks: Analysis, applications, and prospects. IEEE Trans. Neural Netw. Learn. Syst. 2022, 33, 6999–7019. [Google Scholar] [CrossRef]
- Long, J.; Shelhamer, E.; Darrell, T. Fully convolutional networks for semantic segmentation. In Proceedings of the IEEE Conference on Computer Vision and Pattern Recognition (CVRP 2015), Boston, MA, USA, 7–12 June 2015; pp. 3431–3440. [Google Scholar]
- He, K.; Zhang, X.; Ren, S.; Sun, J. Deep residual learning for image recognition. In Proceedings of the 2016 IEEE Conference on Computer Vision and Pattern Recognition (CVPR), Las Vegas, NV, USA, 27–30 June 2016; pp. 770–778. [Google Scholar]
- Lin, T.-Y.; Dollár, P.; Girshick, R.; He, K.; Hariharan, B.; Belongie, S. Feature pyramid networks for object detection. In Proceedings of the IEEE Conference on Computer Vision and Pattern Recognition (CVPR), Honolulu, HI, USA, 21–26 July 2017; pp. 936–944. [Google Scholar]
- Chaurasia, A.; Culurciello, E. LinkNet: Exploiting encoder representations for efficient semantic segmentation. In Proceedings of the 2017 IEEE Visual Communications and Image Processing (VCIP), St. Petersburg, FL, USA, 10–13 December 2017; pp. 1–4. [Google Scholar] [CrossRef]
- Zhao, H.; Shi, J.; Qi, X.; Wang, X.; Jia, J. Pyramid scene parsing network. In Proceedings of the 2017 IEEE Conference on Computer Vision and Pattern Recognition (CVPR), Honolulu, HI, USA, 26 July 2017; pp. 6230–6239. [Google Scholar] [CrossRef]
- Russakovsky, O.; Deng, J.; Su, H.; Krause, J.; Satheesh, S.; Ma, S.; Huang, Z.; Karpathy, A.; Khosla, A.; Bernstain, M.; et al. ImageNet large scale visual recognition challenge. Int. J. Comput. Vis. 2015, 115, 211–252. [Google Scholar] [CrossRef]
- Paszke, A.; Gross, S.; Massa, F.; Lerer, A.; Bradbury, J.; Chanan, G.; Kileen, T.; Lin, Z.; Gimelshein, N.; Antiga, L.; et al. PyTorch: An imperative style, high-performance deep learning library. In Advances in Neural Information Processing Systems 32, Proceedings of the Annual Conference on Neural Information Processing Systems 2019, Vancouver, BC, Canada, 8–14 December 2019; NeurIPS 2019; Wallach, H.M., Larochelle, H., Beygelzimer, A., d’Alché-Buc, F., Fox, E.A., Garnett, R., Eds.; Neural Information Processing Systems Foundation, Inc.: La Jolla, CA, USA, 2019; pp. 8024–8035. [Google Scholar]
- Li, X.; Sun, X.; Meng, Y.; Liang, J.; Wu, F.; Li, J. Dice loss for data-imbalanced NLP tasks. In Proceedings of the 58th Annual Meeting of the Association for Computational Linguistics, Online, 5–10 July 2020; Jurafsky, D., Chai, J., Schluter, N., Tetreault, J., Eds.; The Association for Computational Linguistics: Stroudsburg, PA, USA, 2020; pp. 465–476. [Google Scholar]
- Wu, S.; Li, X.; Wang, X. IoU-aware single-stage object detector for accurate localization. Image Vis. Comput. 2020, 97, 103911. [Google Scholar] [CrossRef]


| Model | Best Validation Dice Loss | Best Validation IoU Score |
|---|---|---|
| U-net with ResNet encoder | 0.3639 | 0.5436 |
| FPN | 0.8619 | 0.1379 |
| Link Net | 0.3958 | 0.5258 |
| PSP Net | 0.5853 | 0.3471 |
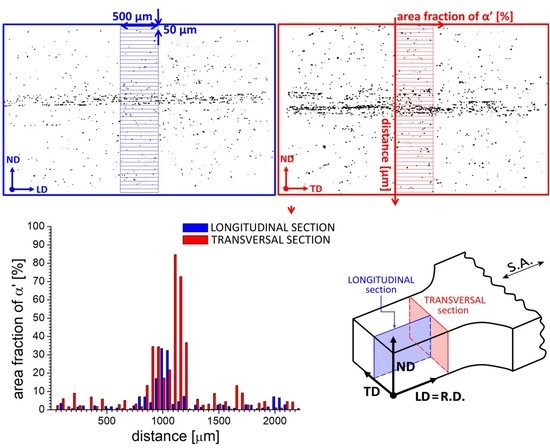
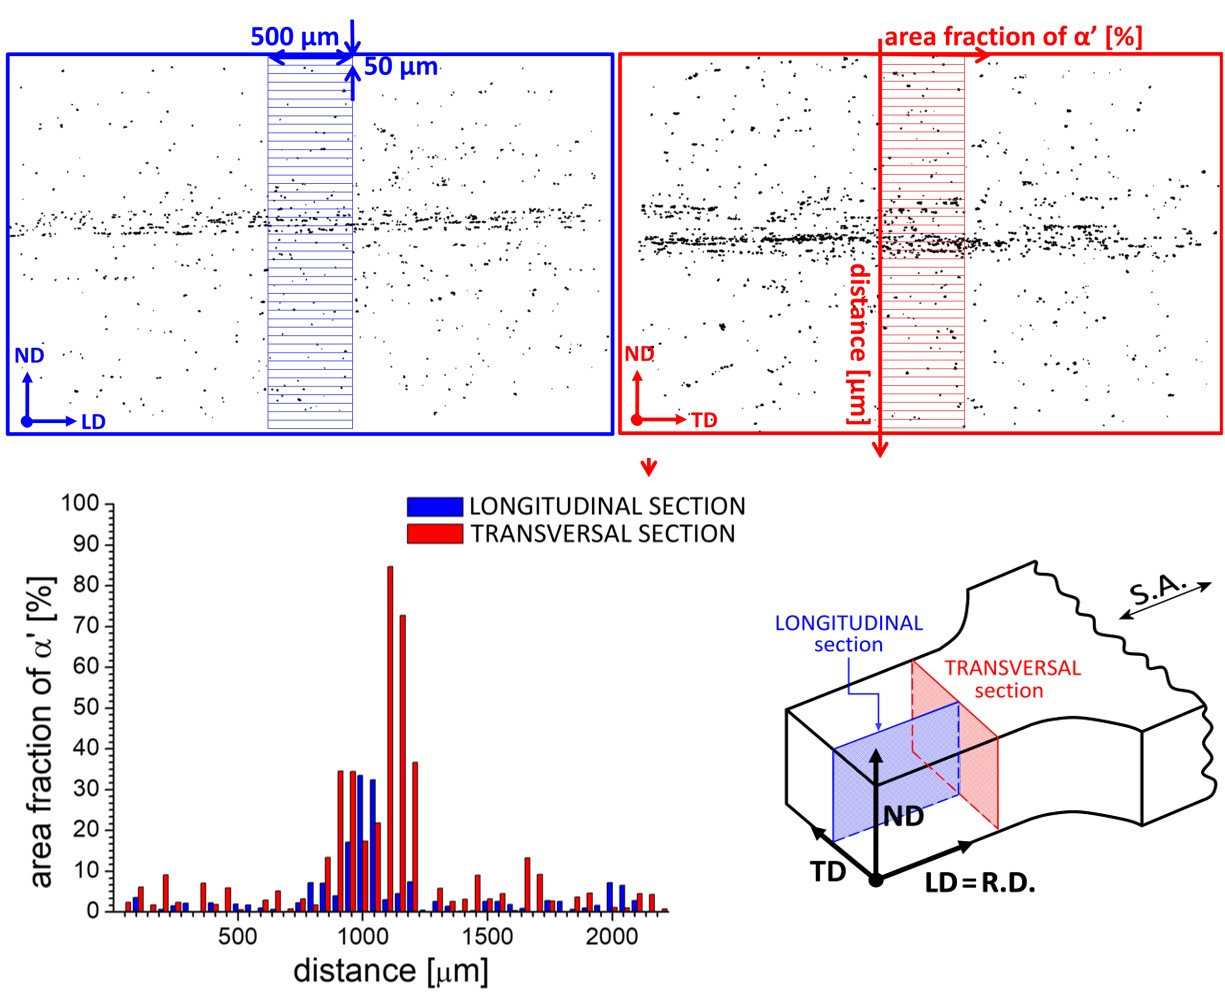
| Section | Analyzed Area (mm2) | α′-Martensite Fraction |
|---|---|---|
| Longitudinal | 7.97 | 0.931% |
| Transversal | 7.97 | 1.298% |
Disclaimer/Publisher’s Note: The statements, opinions and data contained in all publications are solely those of the individual author(s) and contributor(s) and not of MDPI and/or the editor(s). MDPI and/or the editor(s) disclaim responsibility for any injury to people or property resulting from any ideas, methods, instructions or products referred to in the content. |
© 2023 by the authors. Licensee MDPI, Basel, Switzerland. This article is an open access article distributed under the terms and conditions of the Creative Commons Attribution (CC BY) license (https://creativecommons.org/licenses/by/4.0/).
Share and Cite
Mikmeková, Š.; Man, J.; Ambrož, O.; Jozefovič, P.; Čermák, J.; Järvenpää, A.; Jaskari, M.; Materna, J.; Kruml, T. High-Resolution Characterization of Deformation Induced Martensite in Large Areas of Fatigued Austenitic Stainless Steel Using Deep Learning. Metals 2023, 13, 1039. https://doi.org/10.3390/met13061039
Mikmeková Š, Man J, Ambrož O, Jozefovič P, Čermák J, Järvenpää A, Jaskari M, Materna J, Kruml T. High-Resolution Characterization of Deformation Induced Martensite in Large Areas of Fatigued Austenitic Stainless Steel Using Deep Learning. Metals. 2023; 13(6):1039. https://doi.org/10.3390/met13061039
Chicago/Turabian StyleMikmeková, Šárka, Jiří Man, Ondřej Ambrož, Patrik Jozefovič, Jan Čermák, Antti Järvenpää, Matias Jaskari, Jiří Materna, and Tomáš Kruml. 2023. "High-Resolution Characterization of Deformation Induced Martensite in Large Areas of Fatigued Austenitic Stainless Steel Using Deep Learning" Metals 13, no. 6: 1039. https://doi.org/10.3390/met13061039