Article

Advantageous Description of Short Fatigue Crack Growth Rates in Austenitic Stainless Steels with Distinct Properties

1
CEITEC BUT, Purkyňova 123, 621 00 Brno, Czech Republic
2
CEITEC IPM, Institute of Physics of Materials, Czech Academy of Sciences, Žižkova 22, 616 62 Brno, Czech Republic
3
Institute of Physics of Materials, Czech Academy of Sciences, Žižkova 22, 616 62 Brno, Czech Republic
*
Author to whom correspondence should be addressed.
Metals 2021, 11(3), 475; https://doi.org/10.3390/met11030475
Submission received: 18 January 2021 / Revised: 3 March 2021 / Accepted: 9 March 2021 / Published: 13 March 2021
(This article belongs to the Special Issue Advanced Characterisation of Fatigue Behaviour in Metal Alloys)

Abstract

:
In this work two approaches to the description of short fatigue crack growth rate under large-scale yielding condition were comprehensively tested: (i) plastic component of the J-integral and (ii) Polák model of crack propagation. The ability to predict residual fatigue life of bodies with short initial cracks was studied for stainless steels Sanicro 25 and 304L. Despite their coarse microstructure and very different cyclic stress–strain response, the employed continuum mechanics models were found to give satisfactory results. Finite element modeling was used to determine the J-integrals and to simulate the evolution of crack front shapes, which corresponded to the real cracks observed on the fracture surfaces of the specimens. Residual fatigue lives estimated by these models were in good agreement with the number of cycles to failure of individual test specimens strained at various total strain amplitudes. Moreover, the crack growth rates of both investigated materials fell onto the same curve that was previously obtained for other steels with different properties. Such a “master curve” was achieved using the plastic part of J-integral and it has the potential of being an advantageous tool to model the fatigue crack propagation under large-scale yielding regime without a need of any additional experimental data.

1. Introduction

Austenitic stainless steels are widely used because of their excellent mechanical properties combined with corrosion resistance. The AISI 304L type steel (formerly known also as 18/8 type) is one of the most frequently used stainless steel for structural components. Due to its exceptional corrosion resistance and prominent mechanical and technological properties, it is utilized in diverse industrial, civil engineering and biological applications [1]. One of the most significant characteristics is extraordinary work-hardening stemming from an additional deformation mechanism, the strain-induced martensitic transformation (SIMT). Therefore, the 304L steel exhibits excellent ductility combined with appreciable strength. Recently, the Sanicro 25 stainless steel was developed for advanced heat-resistant components, such as coal-fired boilers and other power industry applications [2]. This material shows high resistance to steam oxidation combined with admirable creep, low cycle fatigue properties and long-term structural stability [2,3,4]. Such a combination of properties promotes this alloy as one of the most intriguing structural material for high temperature application.
Due to the typical utilization of both materials for critical power industry components, an important task is to establish a reliable fatigue lifetime prediction methodology. Since commercial materials inevitably contain defects, traceable by non-destructive techniques just in limited extend, the description of the short crack growth stage of fatigue life is an important aspect of the residual fatigue lifetime estimation. Since small-scale yielding conditions are not valid within short crack growth description, the usage of the stress intensity factor is violated. The correct description of the short crack behavior under large-scale yielding conditions, is still discussed [5,6,7,8,9,10,11,12,13,14,15,16,17,18]. Generally, two approaches are frequently used: (i) based on plastic strain range and (ii) based on J-integral (both are applied in this article). Strain parameters were introduced by Tomkins [6], Skelton [7,8] and Polák [9,10]. They found a clear relation between the applied plastic strain amplitude and the propagation of short cracks. The model by Polák [9,10] introduced “crack growth coefficient” which is dependent on the applied plastic strain amplitude and has clear relation with Manson–Coffin law. This coefficient then controls short crack propagation rate. Tomkins proposed the power law describing directly the relationship between short fatigue crack growth rate and applied plastic strain amplitude. However, it is easier to use J-integral value for the application to engineering structures, because its evaluation is implemented in commercial finite element software and can be easily applied also for the structures with high strain gradients and geometrically complicated defects. A direct application of the J-integral is not straightforward because of necessity to use its cyclic form [11,12]. The effect of the crack closure in large-scale yielding conditions also exists (however it is very limited) and has been studied in past [12,13,14]. Recently, the description of short fatigue cracks based on the plastic part of J-integral was proposed by Hutař [15,16]. This methodology [15] was successfully applied to experimental data obtained on ferritic-martensitic steel Eurofer 97, austenitic steel 316L, ferritic oxide dispersion strengthened (ODS) Eurofer steel, aluminium alloy EN-AW 6082/T6 and 2205 duplex stainless steel.
In this work two approaches for the description of short fatigue crack growth rate under large-scale yielding condition were comprehensively tested: (i) the plastic component of the J-integral and (ii) the Polák model of crack propagation. The ability to predict residual fatigue life of bodies with short initial cracks was studied for austenitic stainless steels Sanicro 25 and AISI 304L. The selected materials have coarse microstructure and different cyclic stress–strain response. Finite element modeling was used to determine the J-integrals and to simulate the evolution of crack front shapes. The numerical results were compared with crack shapes observed experimentally on both materials. The crack growth rates of both materials were compared with previously published data for other steels and the “master curve” for all presented materials was established.

2. Materials and Methods
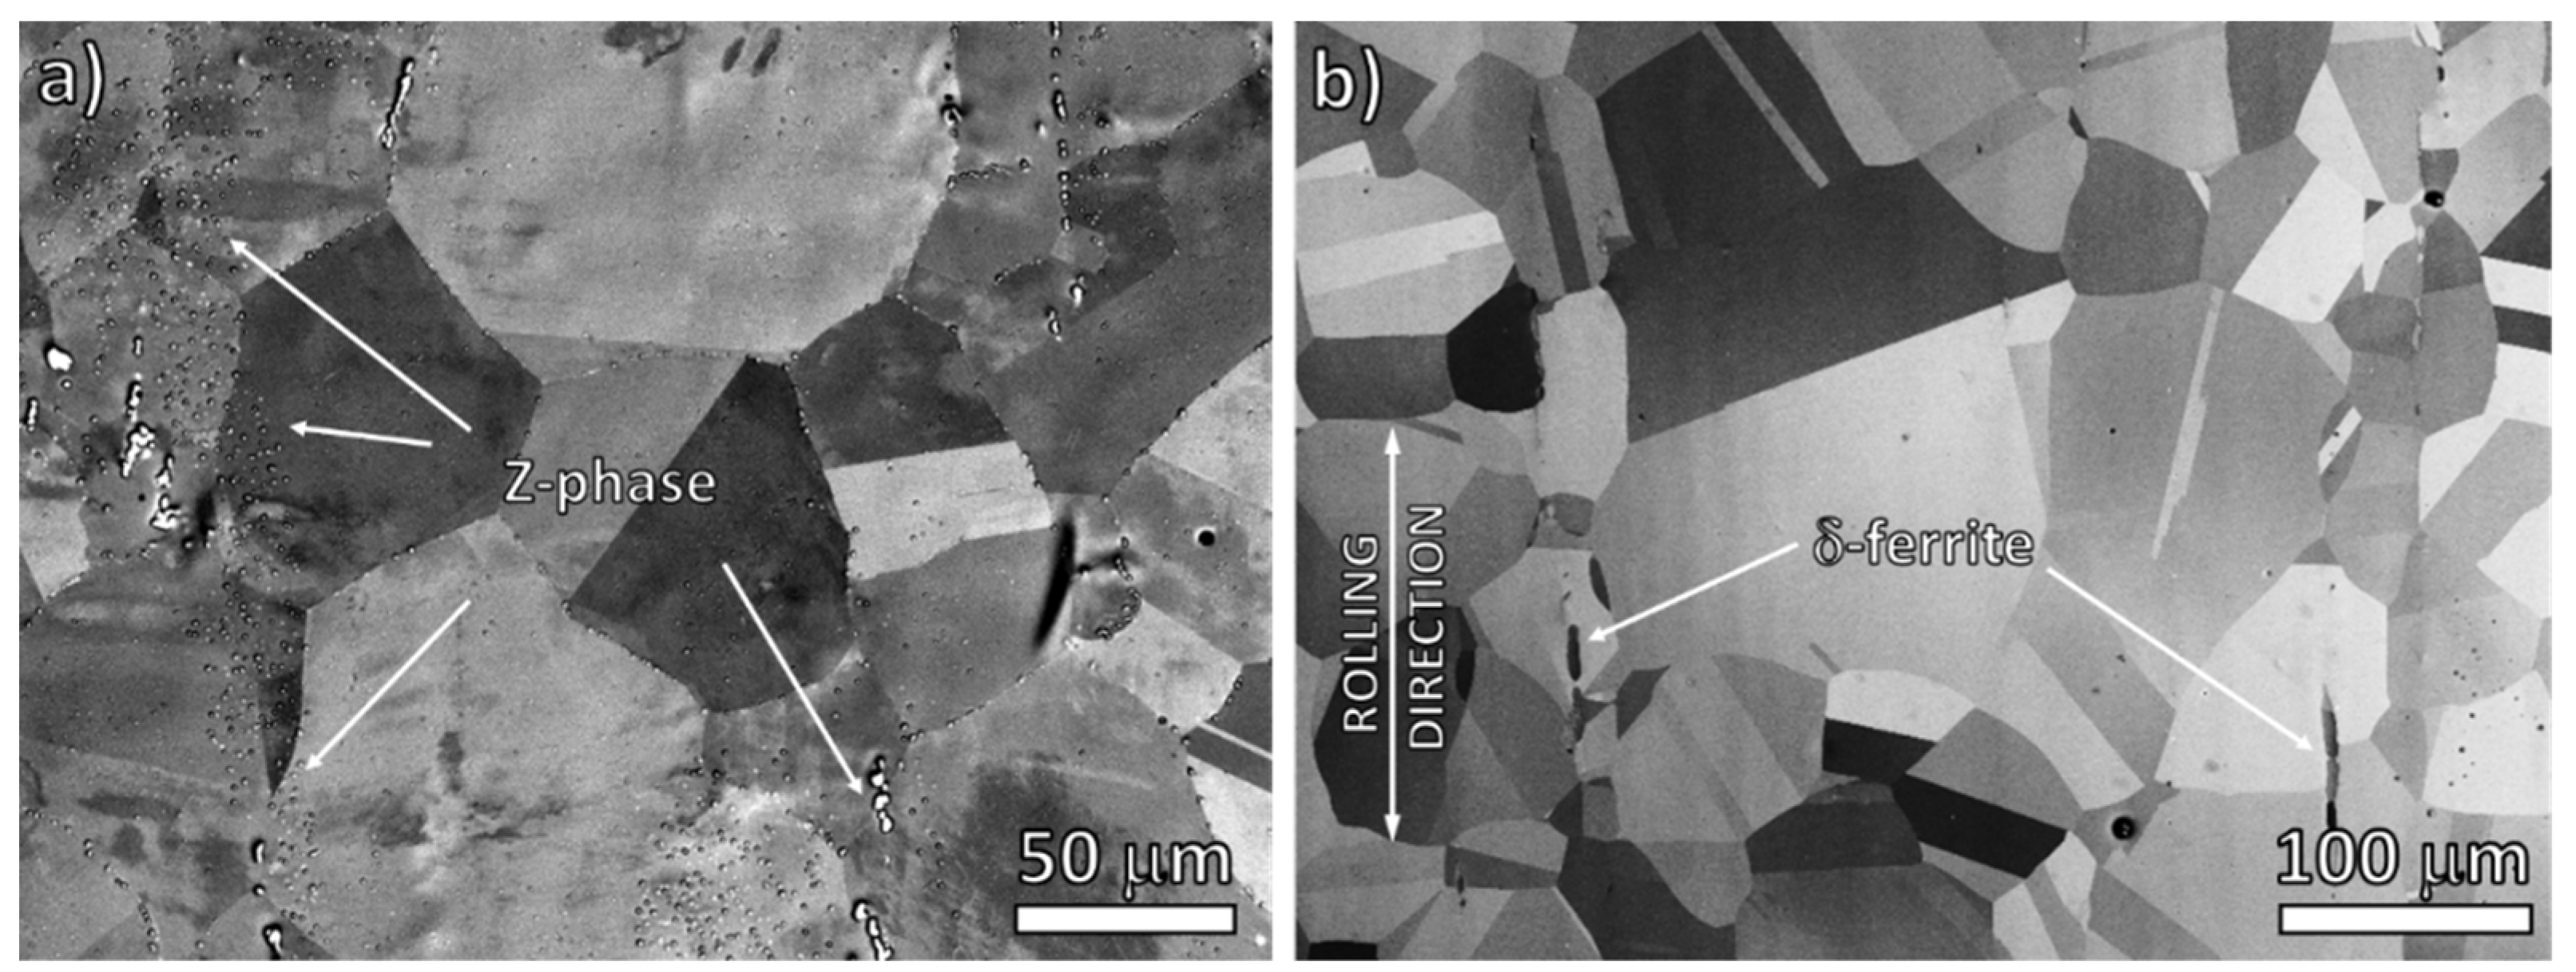
2.1. Materials

High alloyed austenitic stainless steel of grade UNS S31035, Sanicro 25, was produced by Sandvik, Sandviken, Sweden. Chemical composition of the material in as-received condition is listed in Table 1. Before the final machining, the specimens were annealed at 1200 °C for 1 h and subsequently cooled in air. Microstructure consisted of austenitic grains with of equiaxed shape and average grain size was 30 μm determined by linear intercept method without considering annealing twins. Several types of precipitates such as Z phase (Nb, N and Cr rich) was found at grain boundaries and also grain interior as shown in Figure 1a. More detailed analysis of the initial state of the material and basic monotonic and low cycle fatigue properties can be found elsewhere [17,18].
AISI 304L austenitic stainless steel, of chemical composition shown in Table 2, was provided in the form of a hot-rolled sheet. The original sheet was solution-treated at 1050 °C for 30 min followed by cooling in nitrogen flow. The microstructure (shown in Figure 1b) consists of equiaxed austenitic grains with numerous annealing twins and delta ferrite stringers, aligned along the rolling direction, which occupied approximately 0.53% of volume fraction (measured by Feritscope MP30, Helmut Fisher GmbH, Sindelfingen, Germany). The average grain size measured by linear intercept method was 48 ± 32 μm.

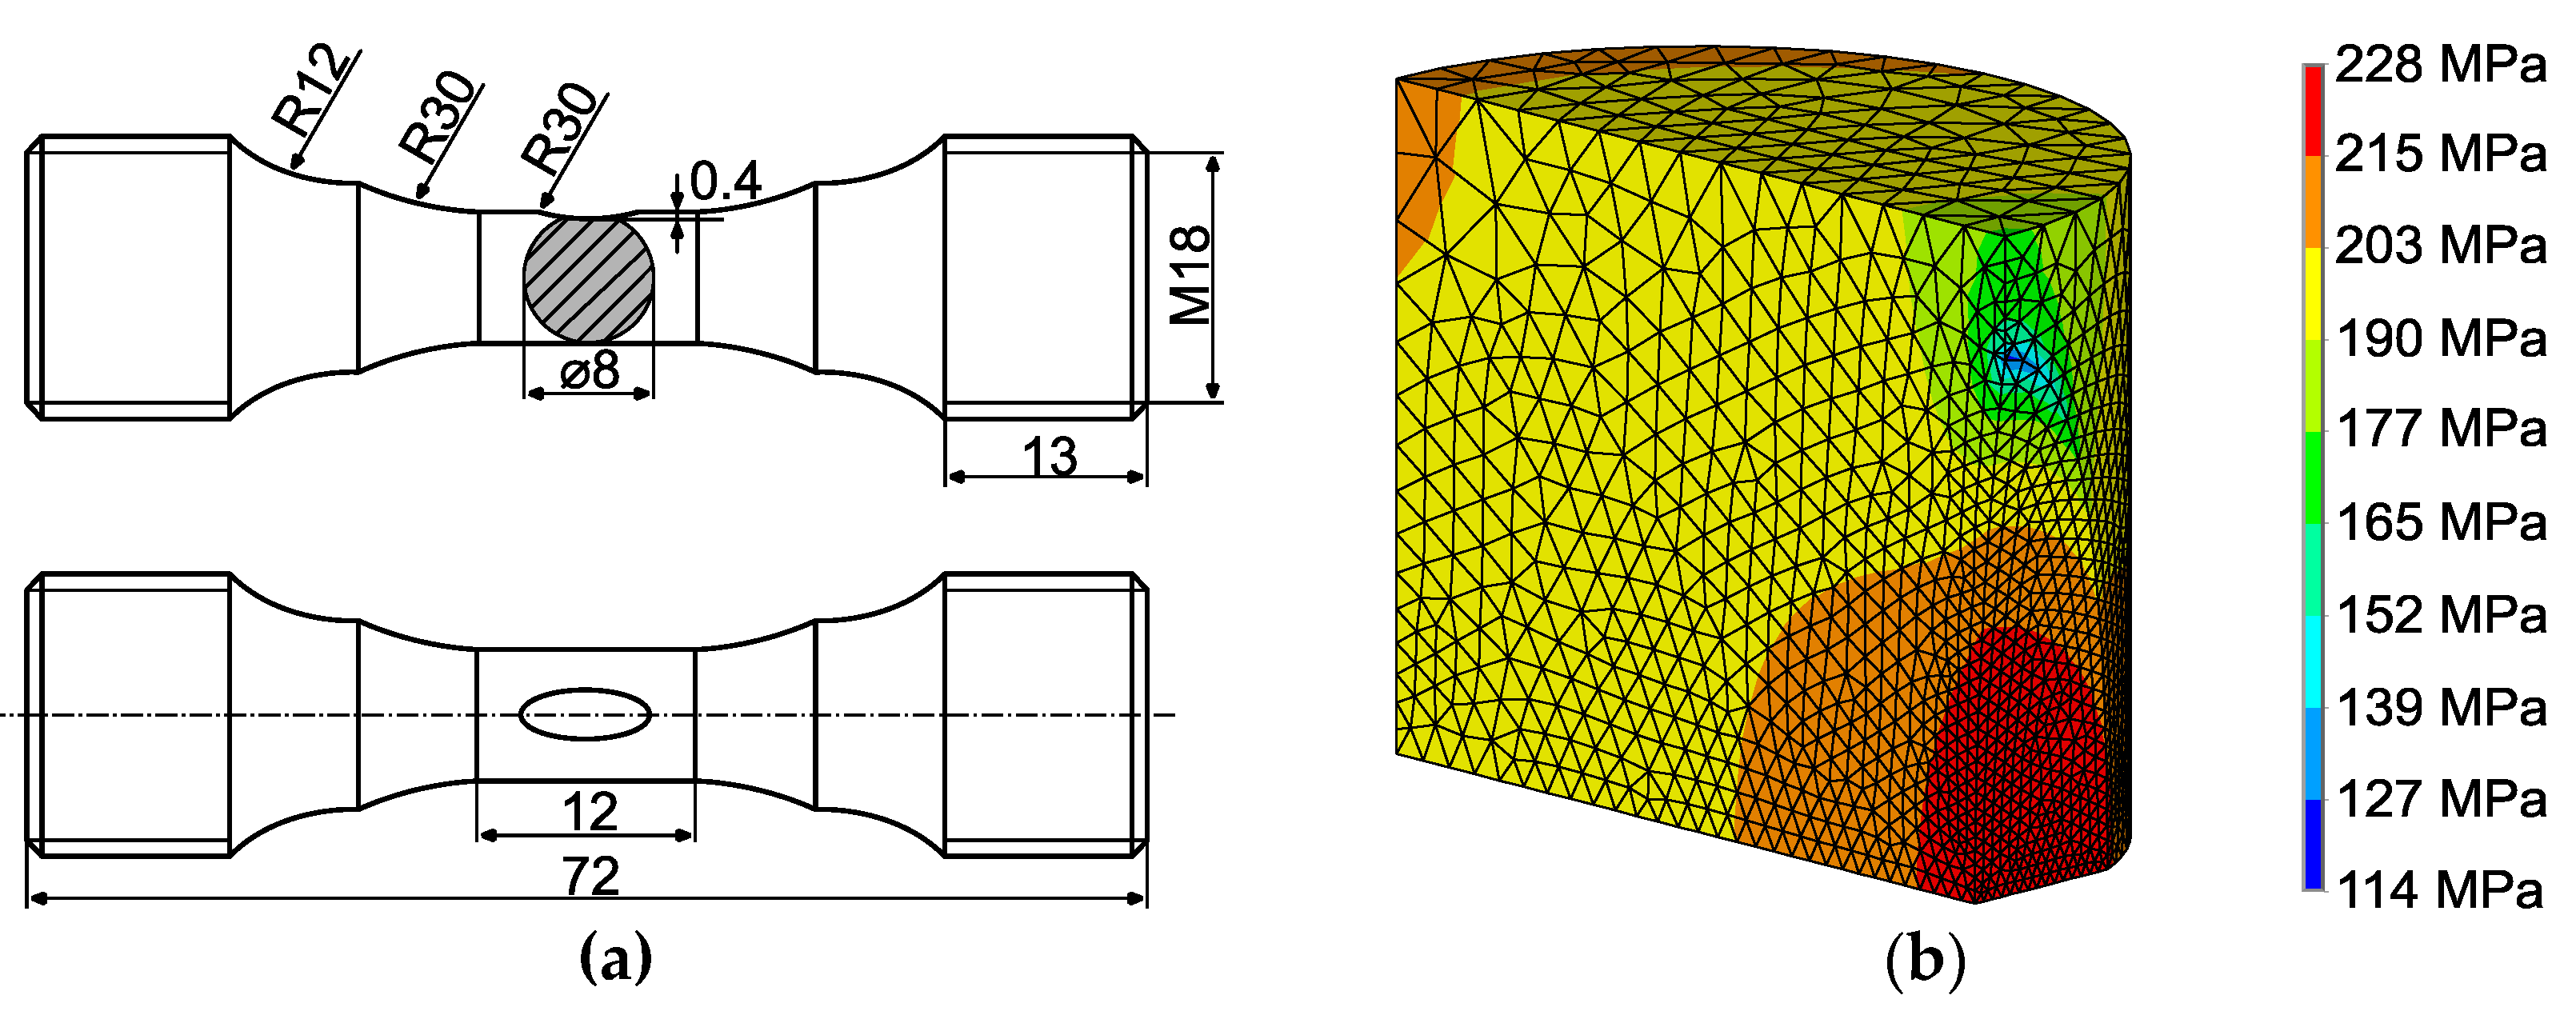
2.2. Low Cycle Fatigue Tests

Fatigue tests were carried out on the cylindrical specimens of 8 mm in diameter and 12 mm gauge length. Two types of the specimens were used in this study: (i) specimens with cylindrical gauge length for the cyclic stress–strain curve determination; (ii) specimens dedicated for short crack growth tests. The latter possesses a shallow notch of 0.4 mm in depth at the middle of the gauge length which was ground to facilitate the fatigue crack initiation within the area and to simplify the short crack growth observation. The specimen geometry, shown in Figure 2a, was identical for both types with the only difference in the presence of shallow notch.
Theoretical stress concentration factor of the shallow notch was estimated to be Kt = 1.14 using the FEM software ANSYS 19.2 (Ansys, Inc., Canonsburg, PA, USA), depicted in Figure 2b. The value is small enough to have only a minor impact on the crack nucleation in other locations of the gauge length but high enough to initiate the primary crack in the investigated area of the shallow notch. The specimen gauge length was mechanically and electrolytically polished to remove any residual deformation and to avoid preparation-induced martensite occurrence from specimen fabrication. Moreover, the high quality of specimen surface facilitates the observation of the crack growth using optical microscopy (OM). A solution of nitric acid, perchloric acid and ethanol in the volume ratio 1.5:5:100 was used as the electrolyte for both materials. It is important to note that in the case of 304L steel, a small pre-crack of semi-elliptical shape in the center of the shallow notch was prepared using focus ion beam (FIB) technique by a field emission gun scanning electron microscope (SEM) TESCAN LYRA 3 XMU (Tescan Orsay holding, Brno, Czech Republic). Pre-crack surface length in the range of 100–150 μm and the depth of approximately 100 μm. Any martensite induced by FIB beam wasn’t observed.
The uniaxial tension-compression tests were performed on an electrohydraulic computer-controlled MTS 810 test system (MTS Systems Corporation, Eden Prairie, MN, USA). The strain was controlled and measured using uniaxial extensometer having 8 mm gauge length. The tests were conducted under fully reversed (Rε = −1) strain-controlled cycling under constant strain rate ε ˙ = 0.005 s−1 and constant total strain amplitude εa regime. The cyclic tests for cyclic stress–strain curve determination were performed in total strain amplitude range of 0.25–1% and 0.3–1% for Sanicro 25 and 304L, respectively. Interrupted cyclic test dedicated to short crack growth characterization were performed in total strain amplitude range of 0.25–0.7% and 0.4–0.7% for Sanicro 25 and 304L, respectively.

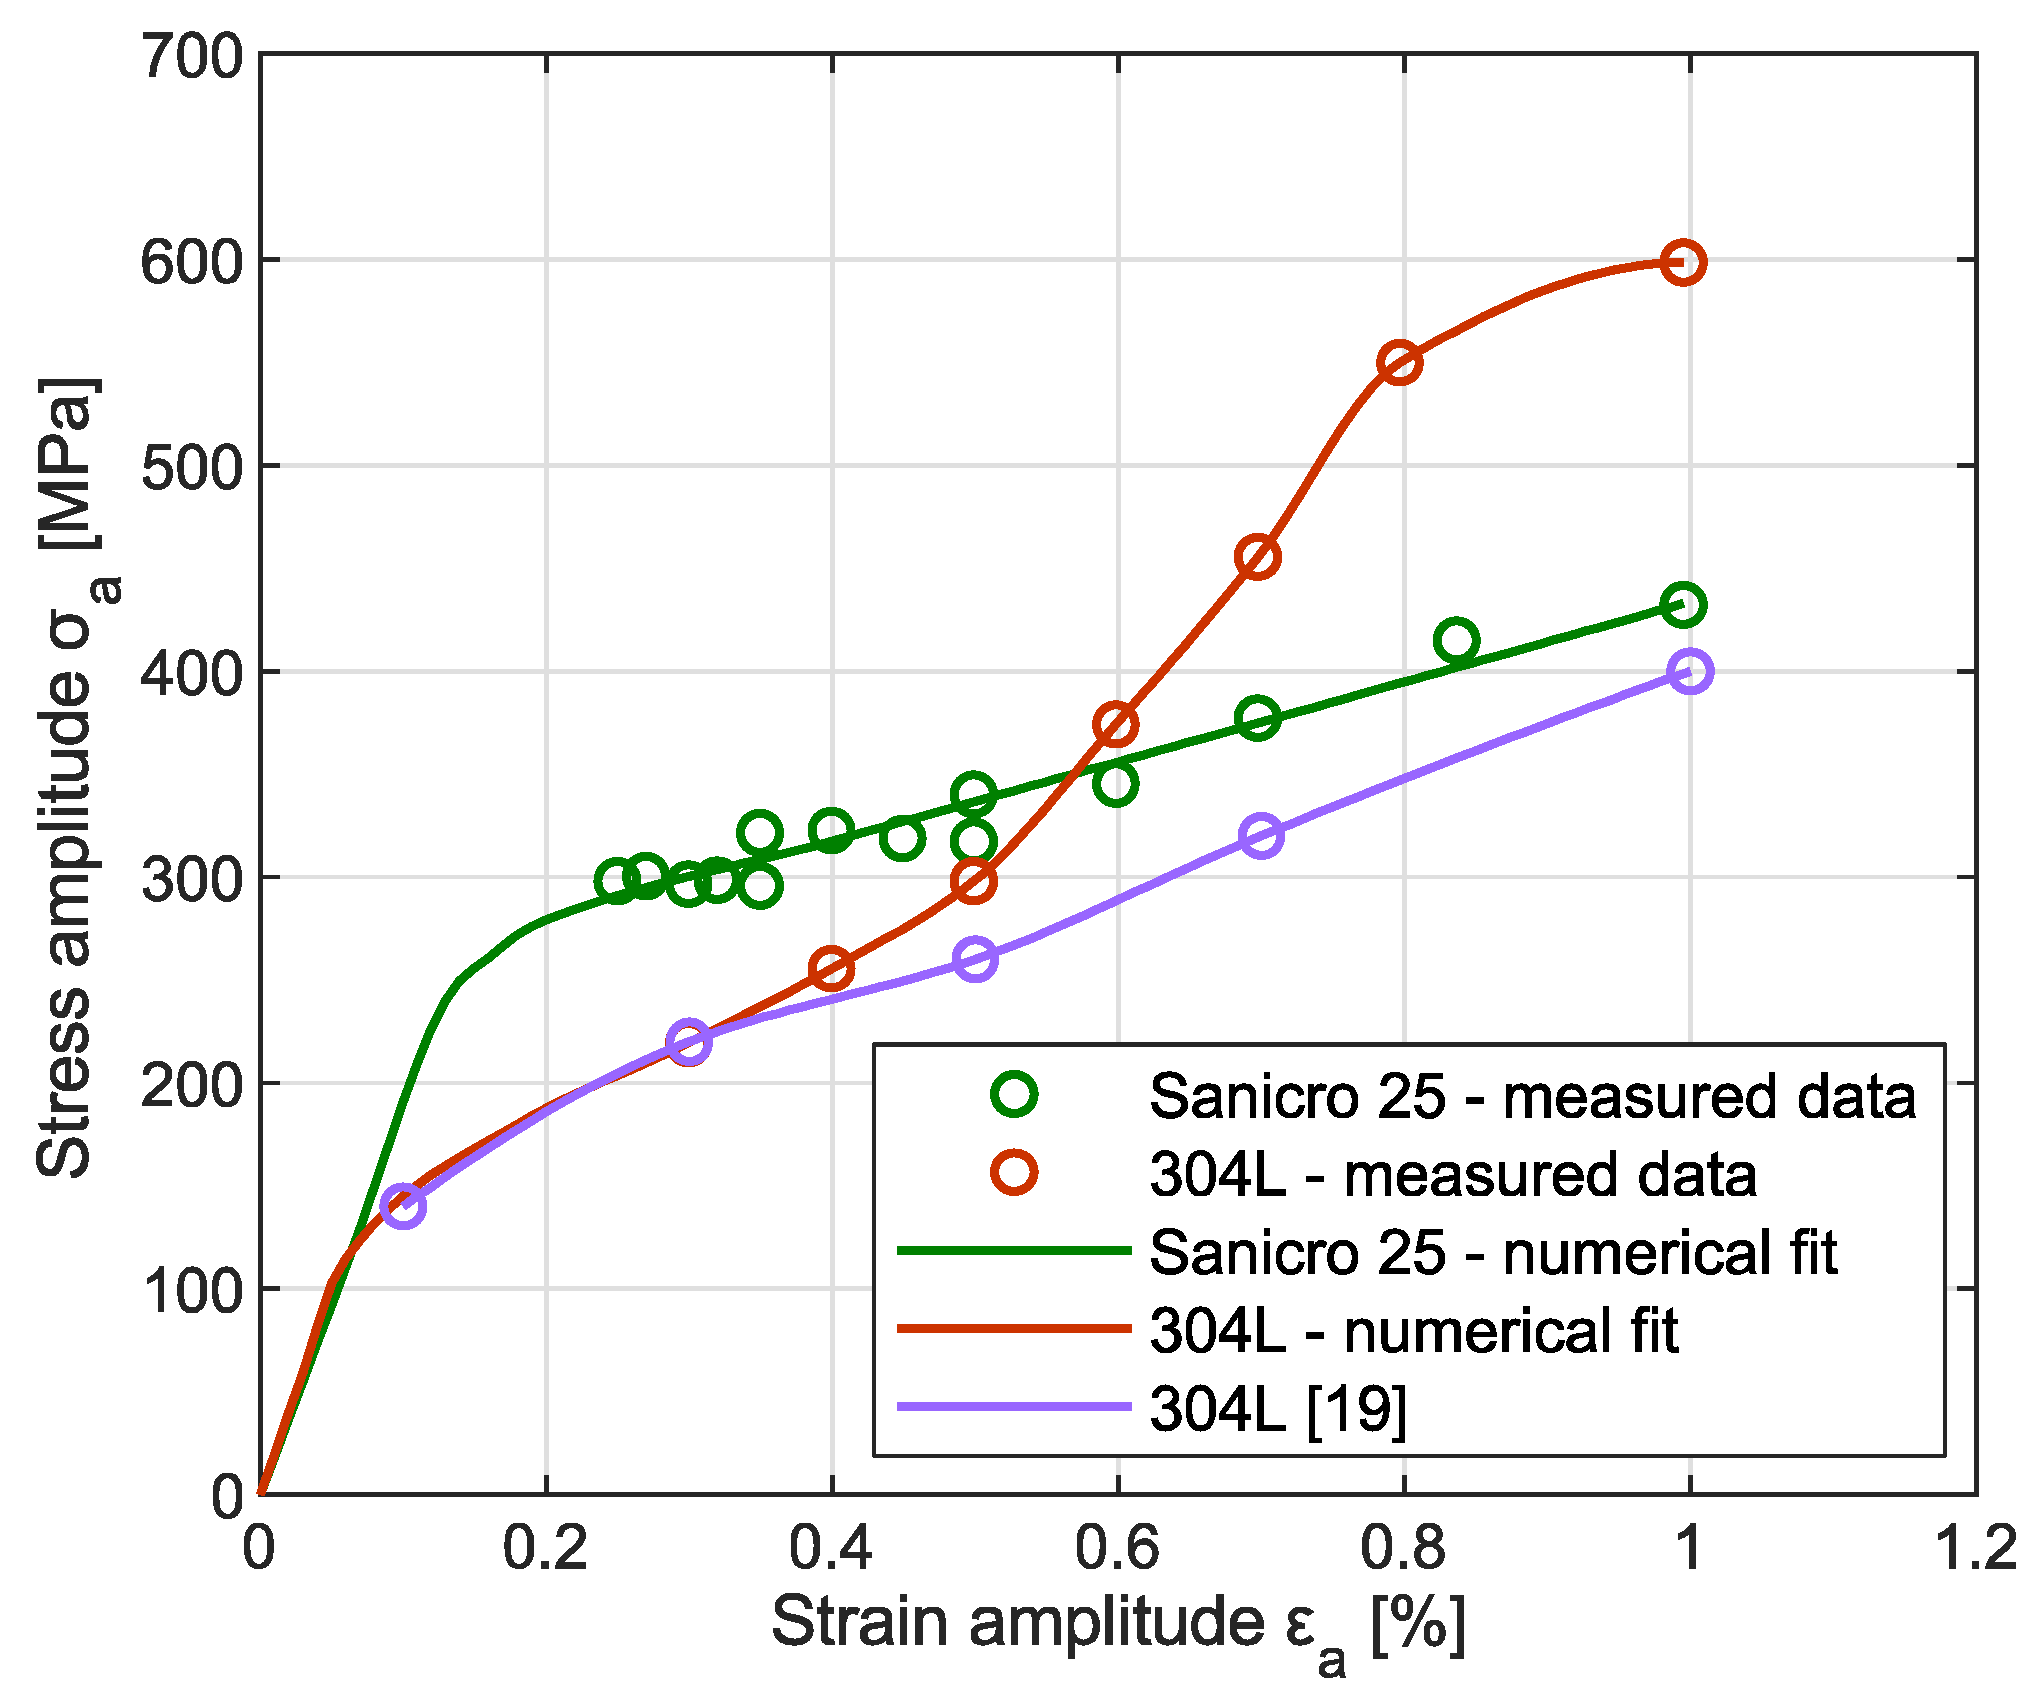
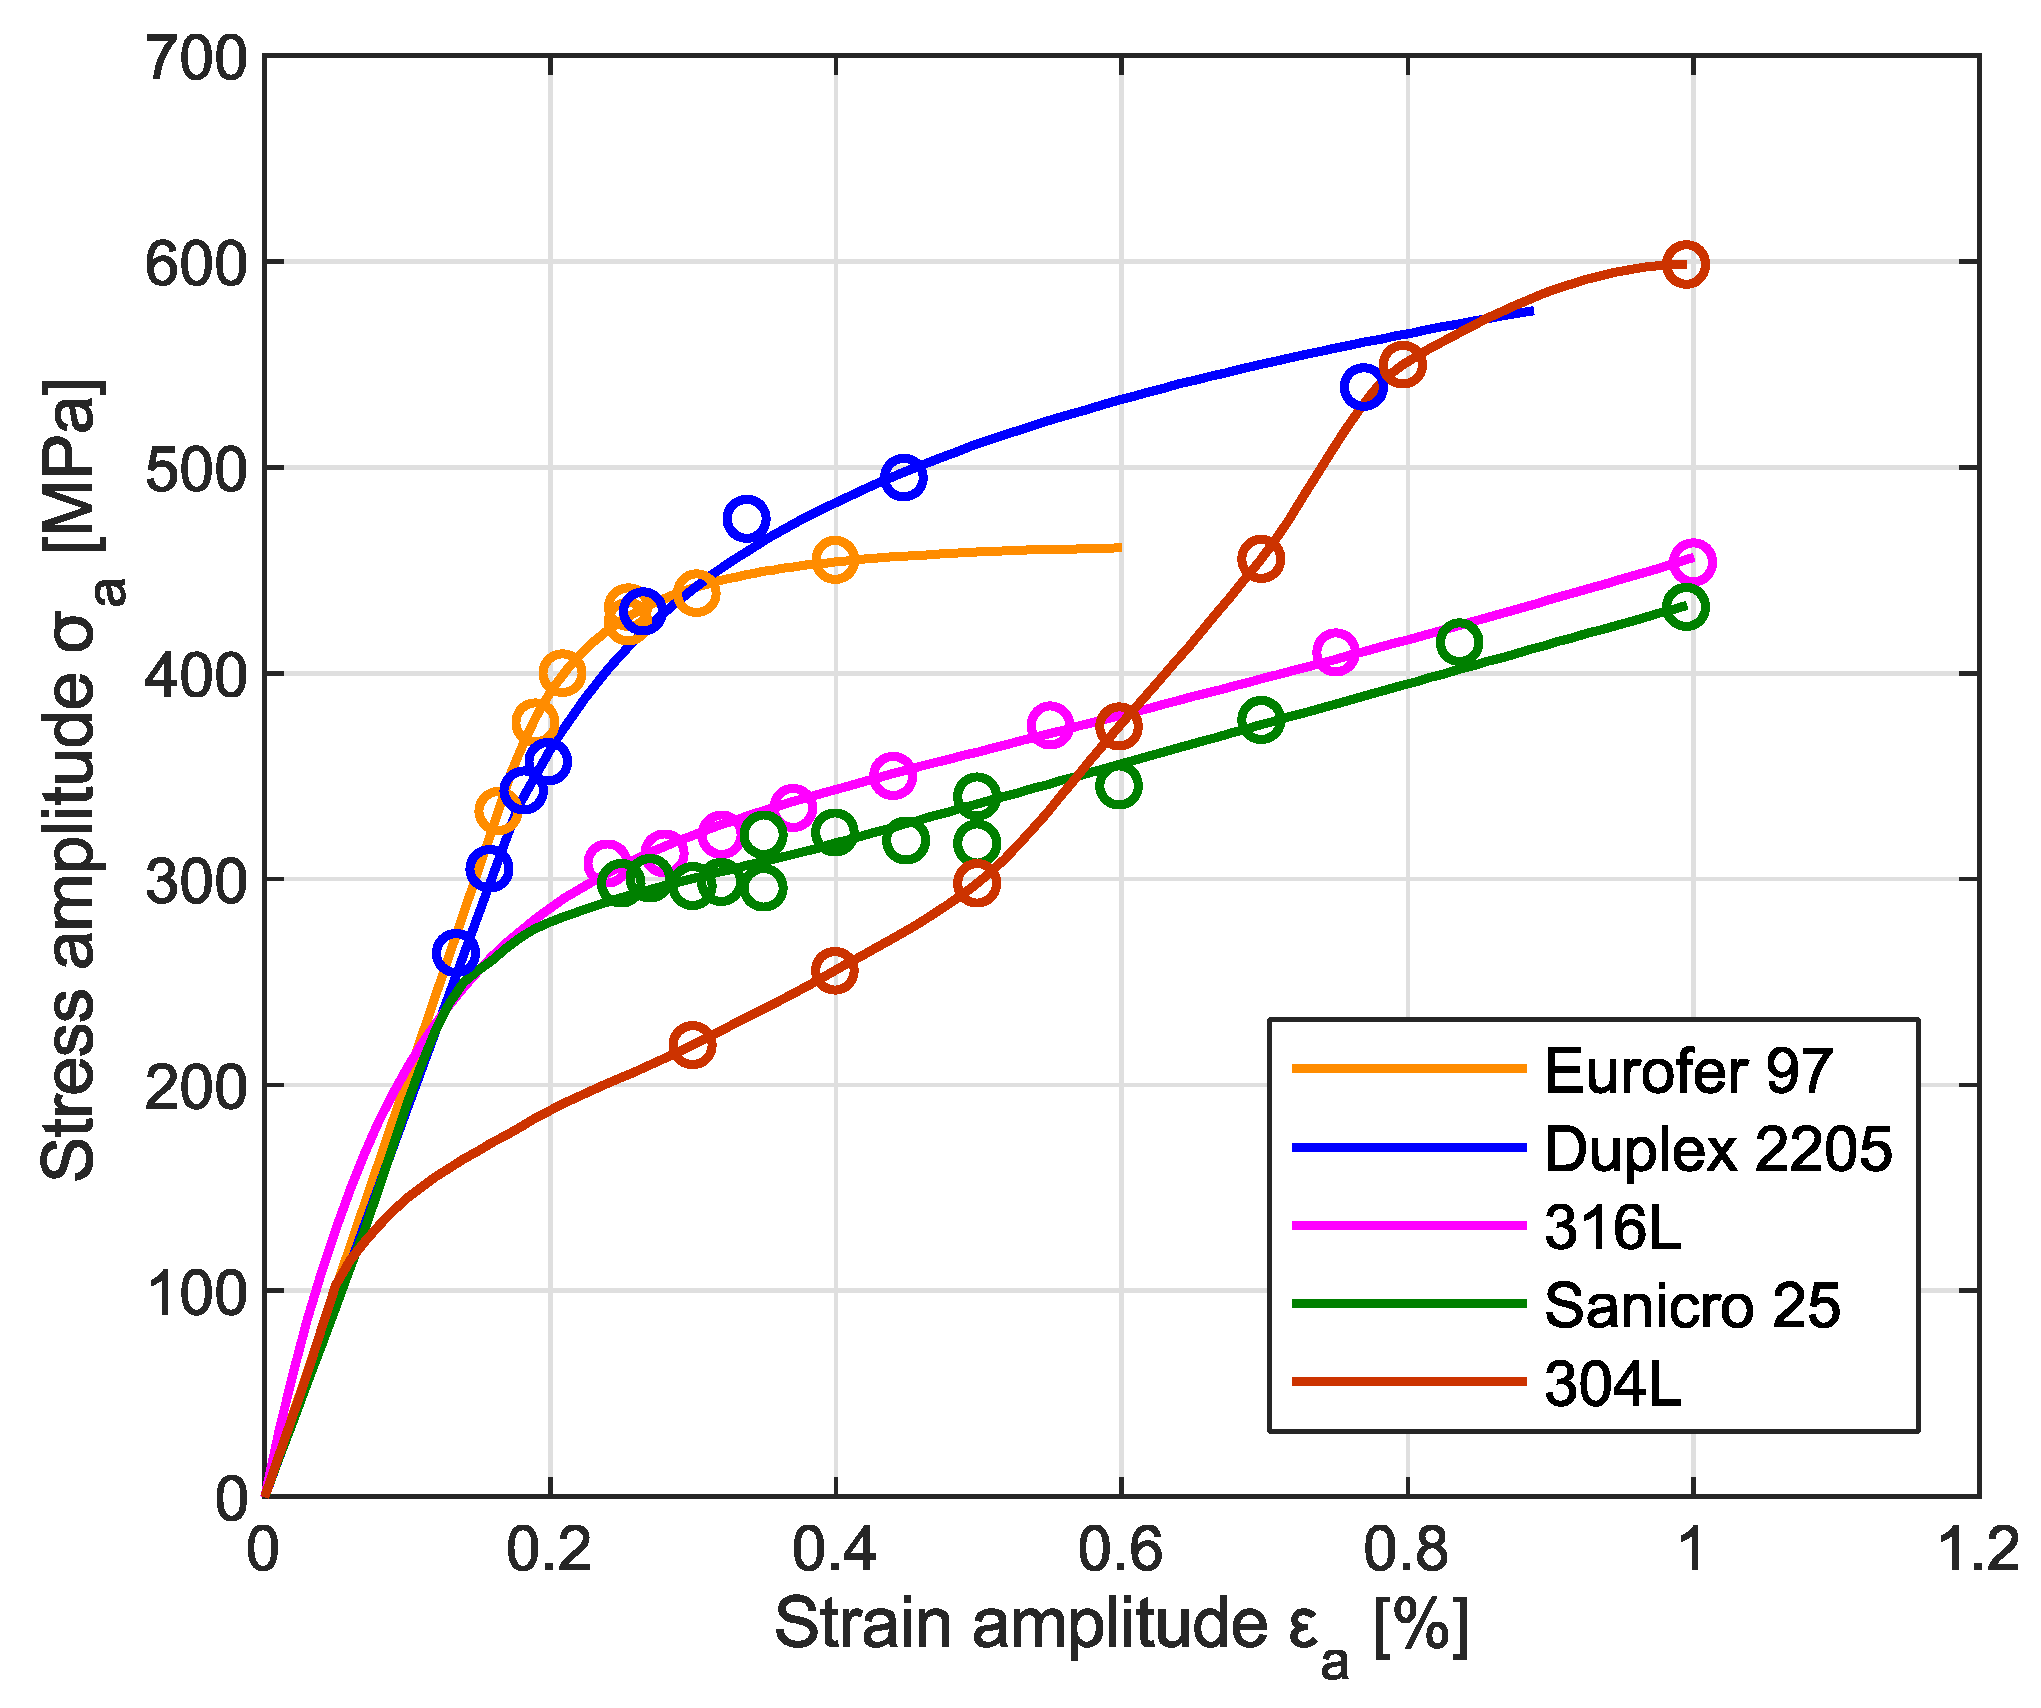
2.3. Cyclic Stress–Strain Response

Figure 3 depicts the cyclic stress–strain curves of investigated materials, an essential data input for material model in the numerical analysis. Experimental data, represented by symbols, were obtained from the hysteresis loops at half-life of each cyclic test held at various total strain amplitudes. Subsequently, data were fitted numerically. Notable difference in the cyclic response between Sanicro 25 and 304L steel can be mainly attributed to different chemical composition. The Sanicro 25 steel has high content of Ni and N which results in high stacking fault energy. This parameter determines deformation mechanisms of the material. Highly planar localization of cyclic plastic deformation, similar to 316 L steel, can be expected. Nearly linear character of cyclic hardening with increasing total strain amplitude can be ascribed to increasing dislocation density. Beside of this conventional cyclic hardening mechanism, the 304L grade steel possesses the susceptibility to the SIMT. With increasing total strain amplitude, the SIMT intensifies which results in significant cyclic hardening. Fatigue data of 304L steel for low stress amplitude region were adopted from reference [19] to achieve more appropriate numerical fit, since such a test was not performed in this study. At medium and high total strain amplitude, notable difference between two variants of 304L are stemming from various chemical composition, namely ferrite-stabilizing Cr and austenite-stabilizing Ni content. The material examined in this study had lower Ni content (see Table 2), compared to 10 wt % of reference [19], resulting in stronger SIMT. Therefore, the studied 304L exhibits much stronger cyclic hardening. The proportionality of cyclic hardening and volume fraction of strain-induced martensite has been documented in past [20]. Since this study focuses on fairly localized fatigue damage phenomenon, it is nearly impossible to quantify precisely the volume fraction of martensite in its vicinity by non-destructive measurement, such as Feritscope.

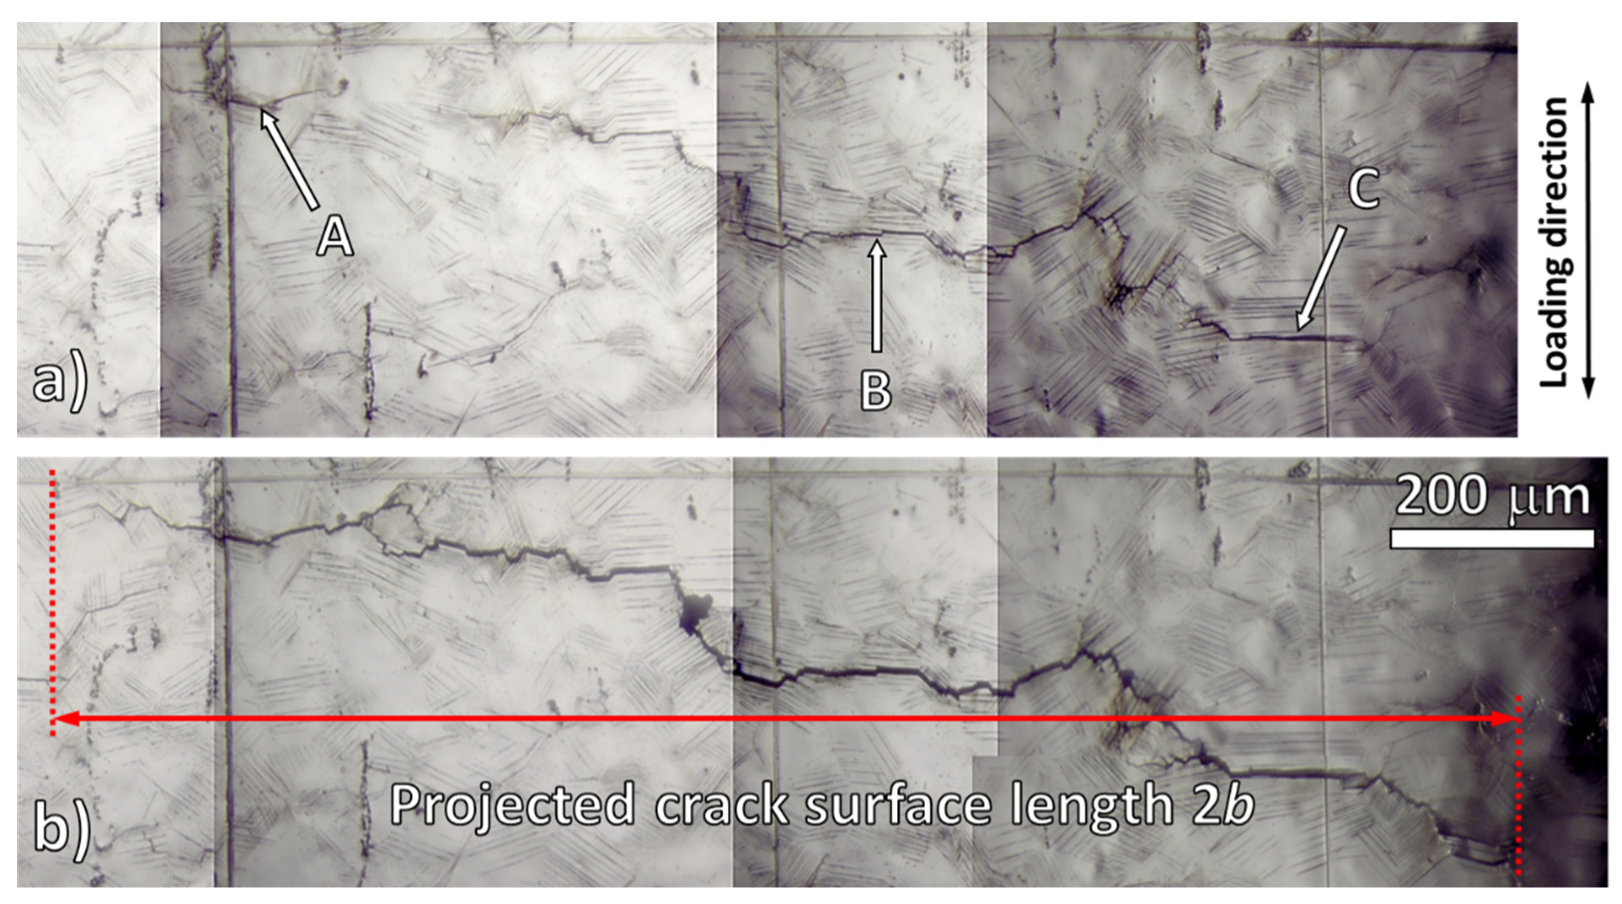
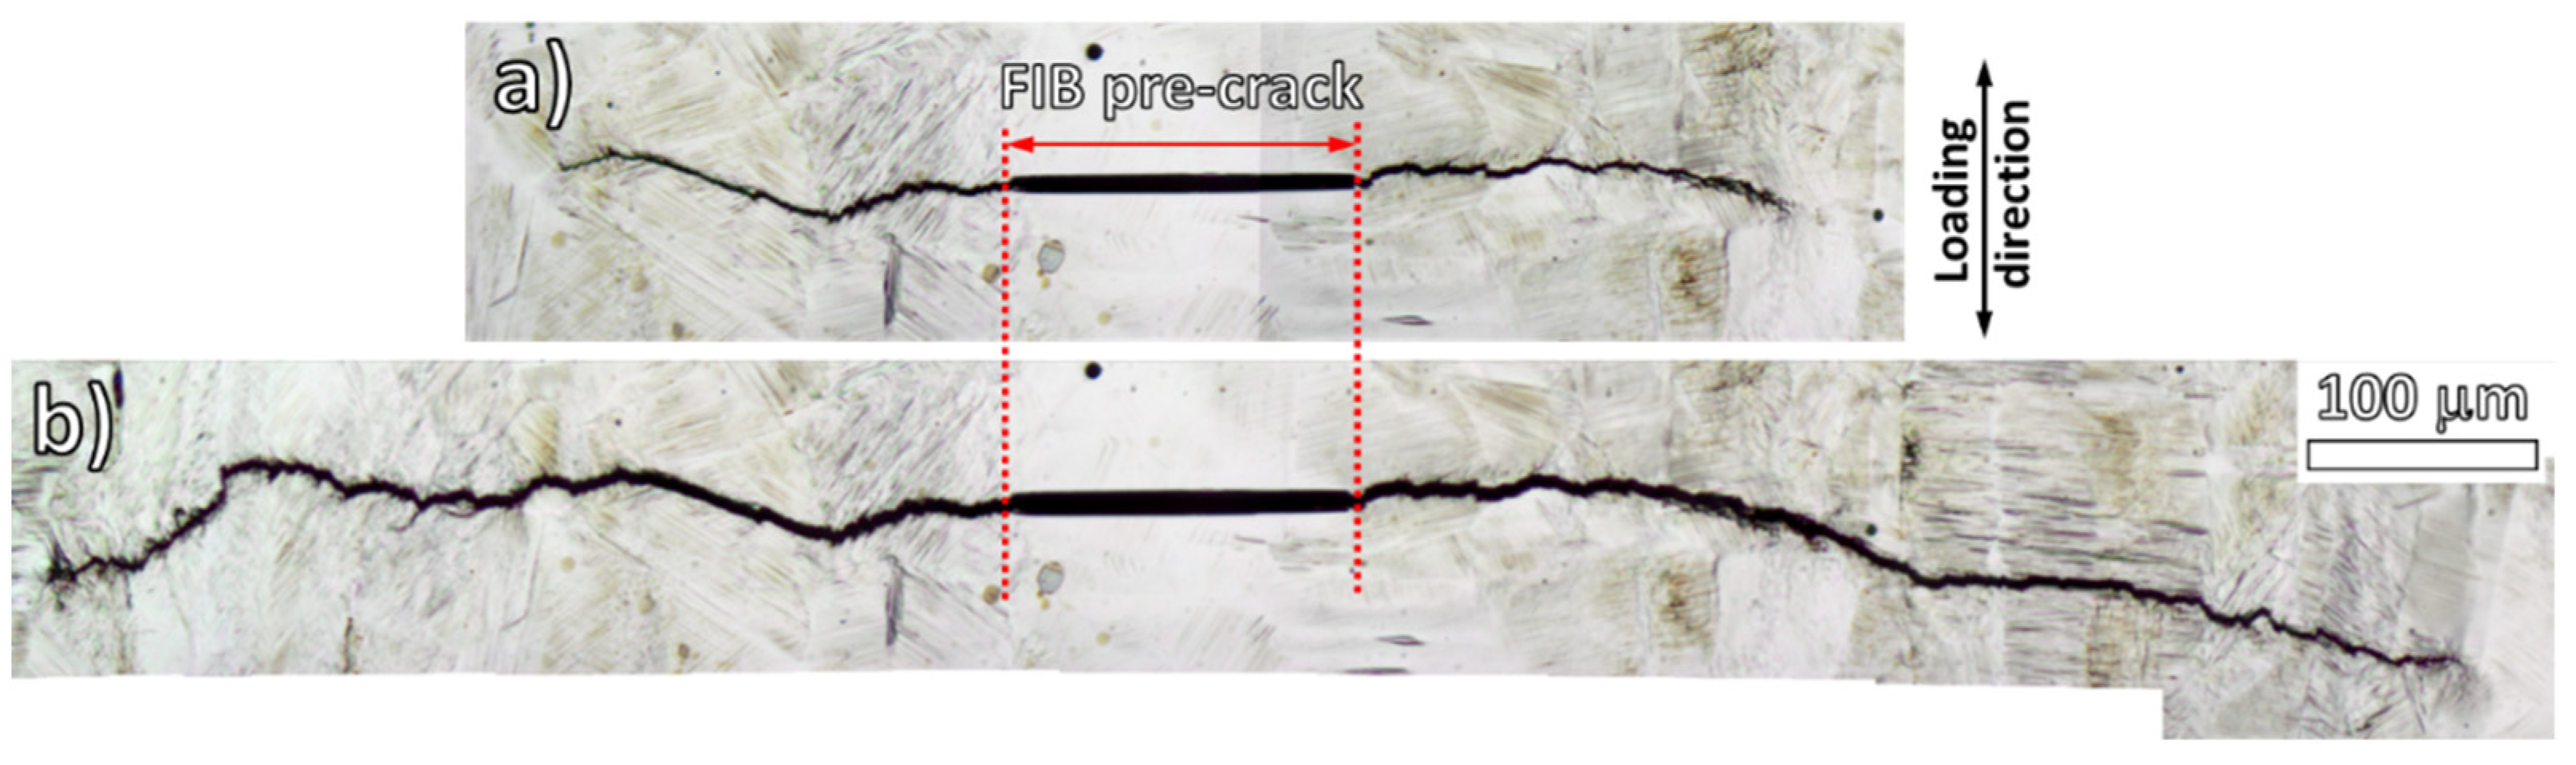
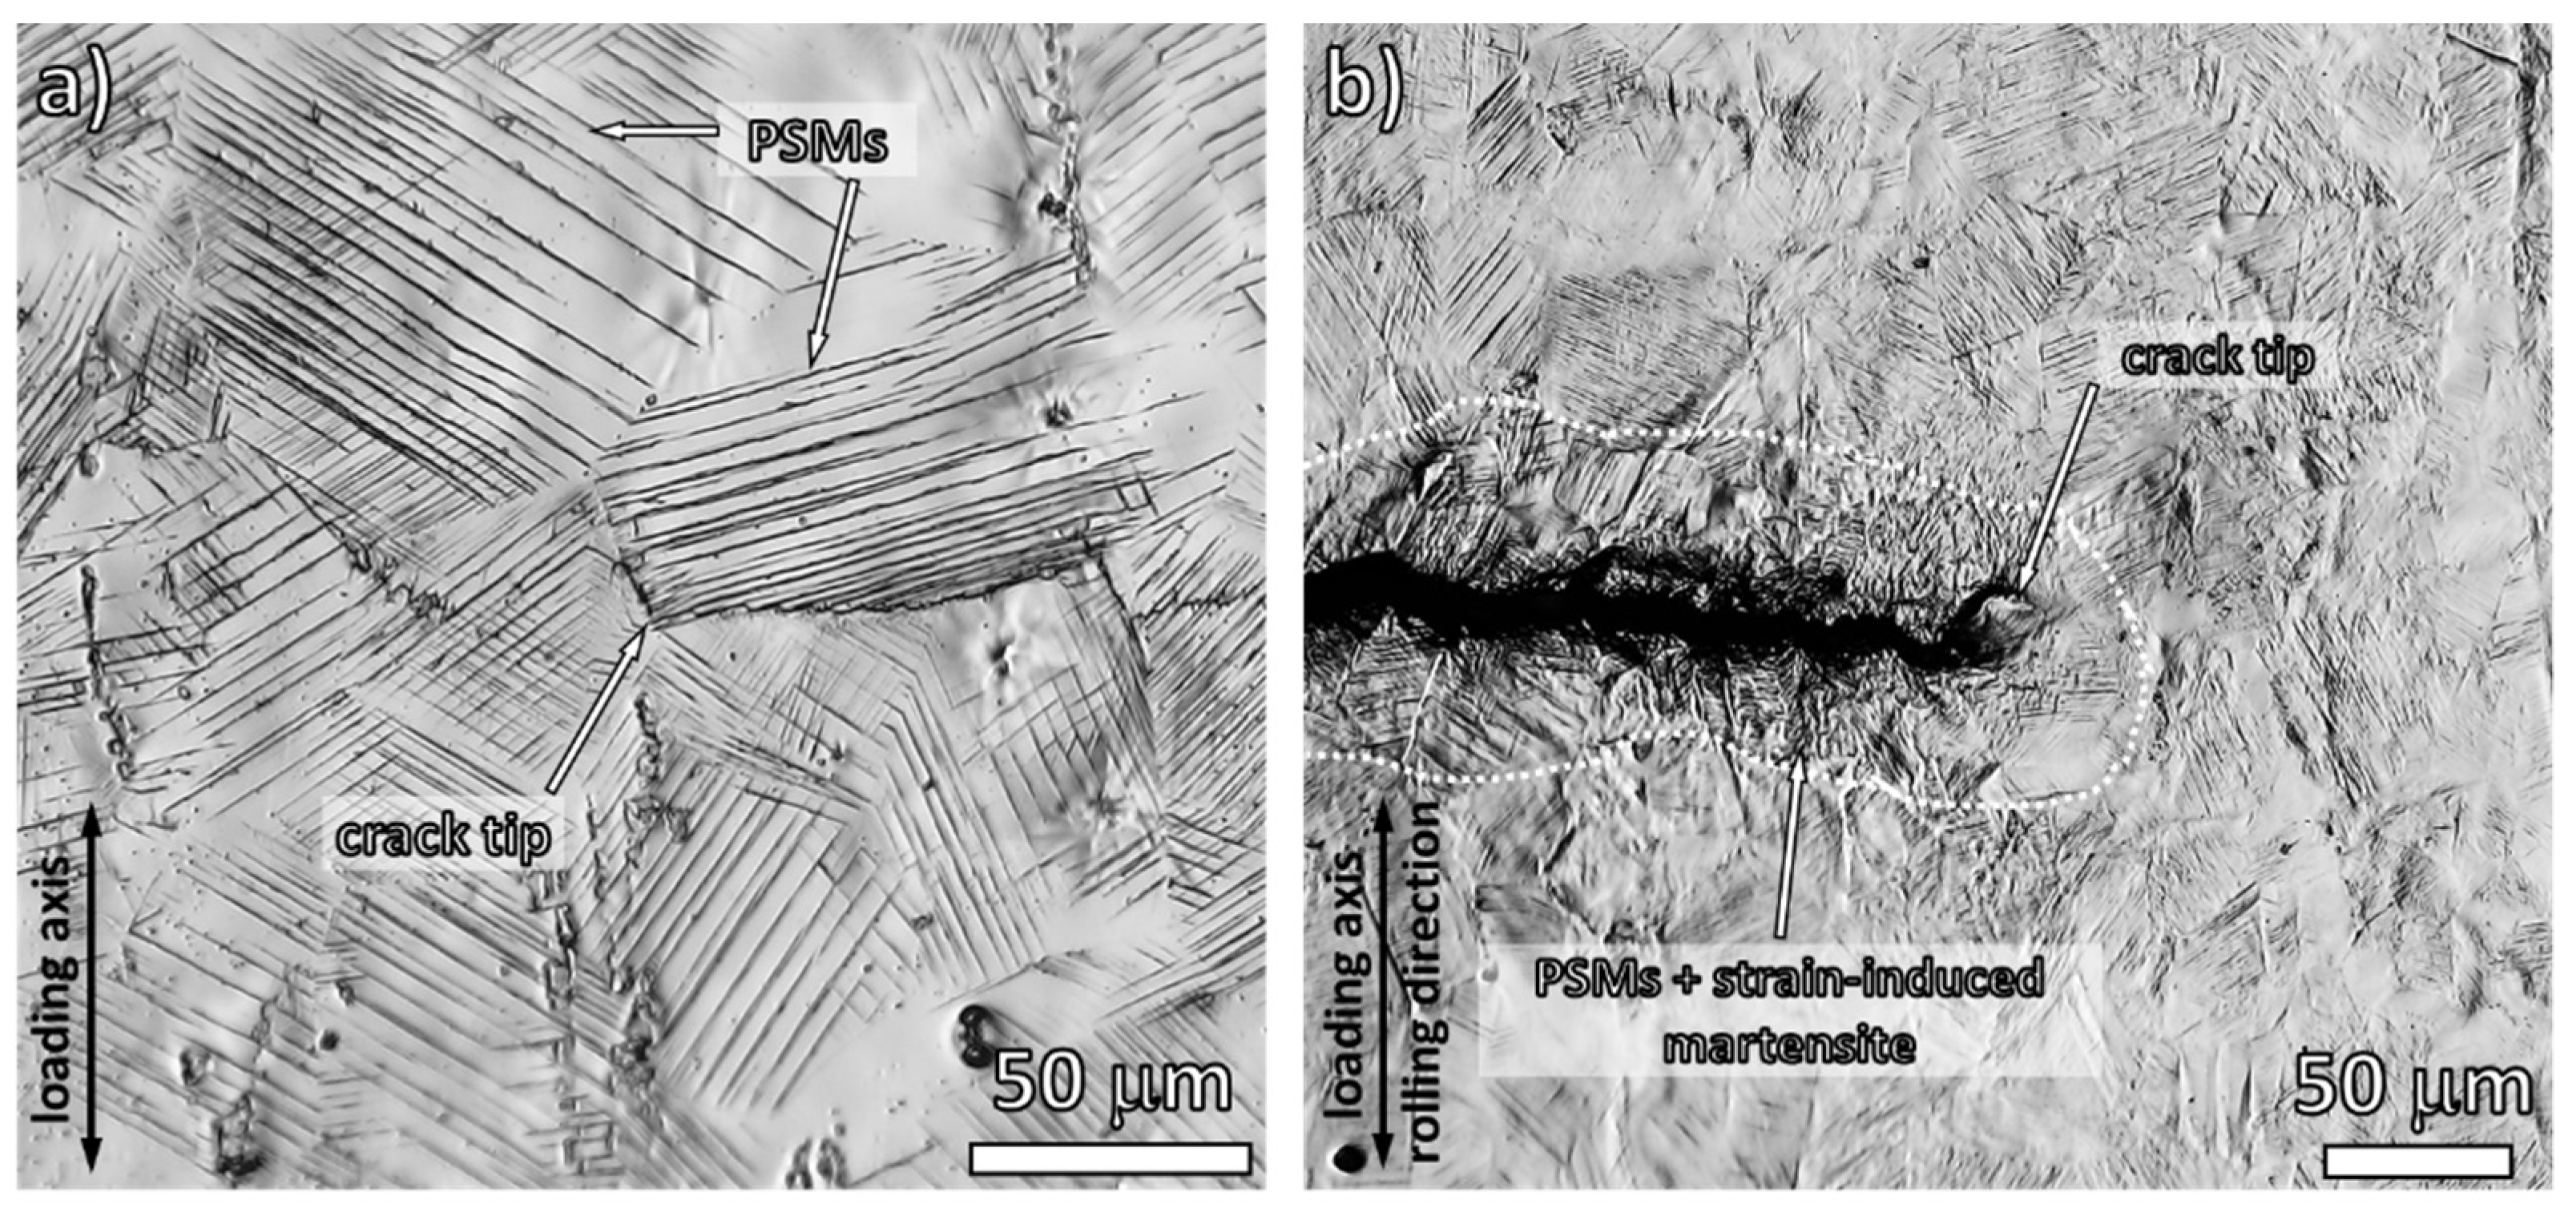
2.4. Short Crack Growth Measurement
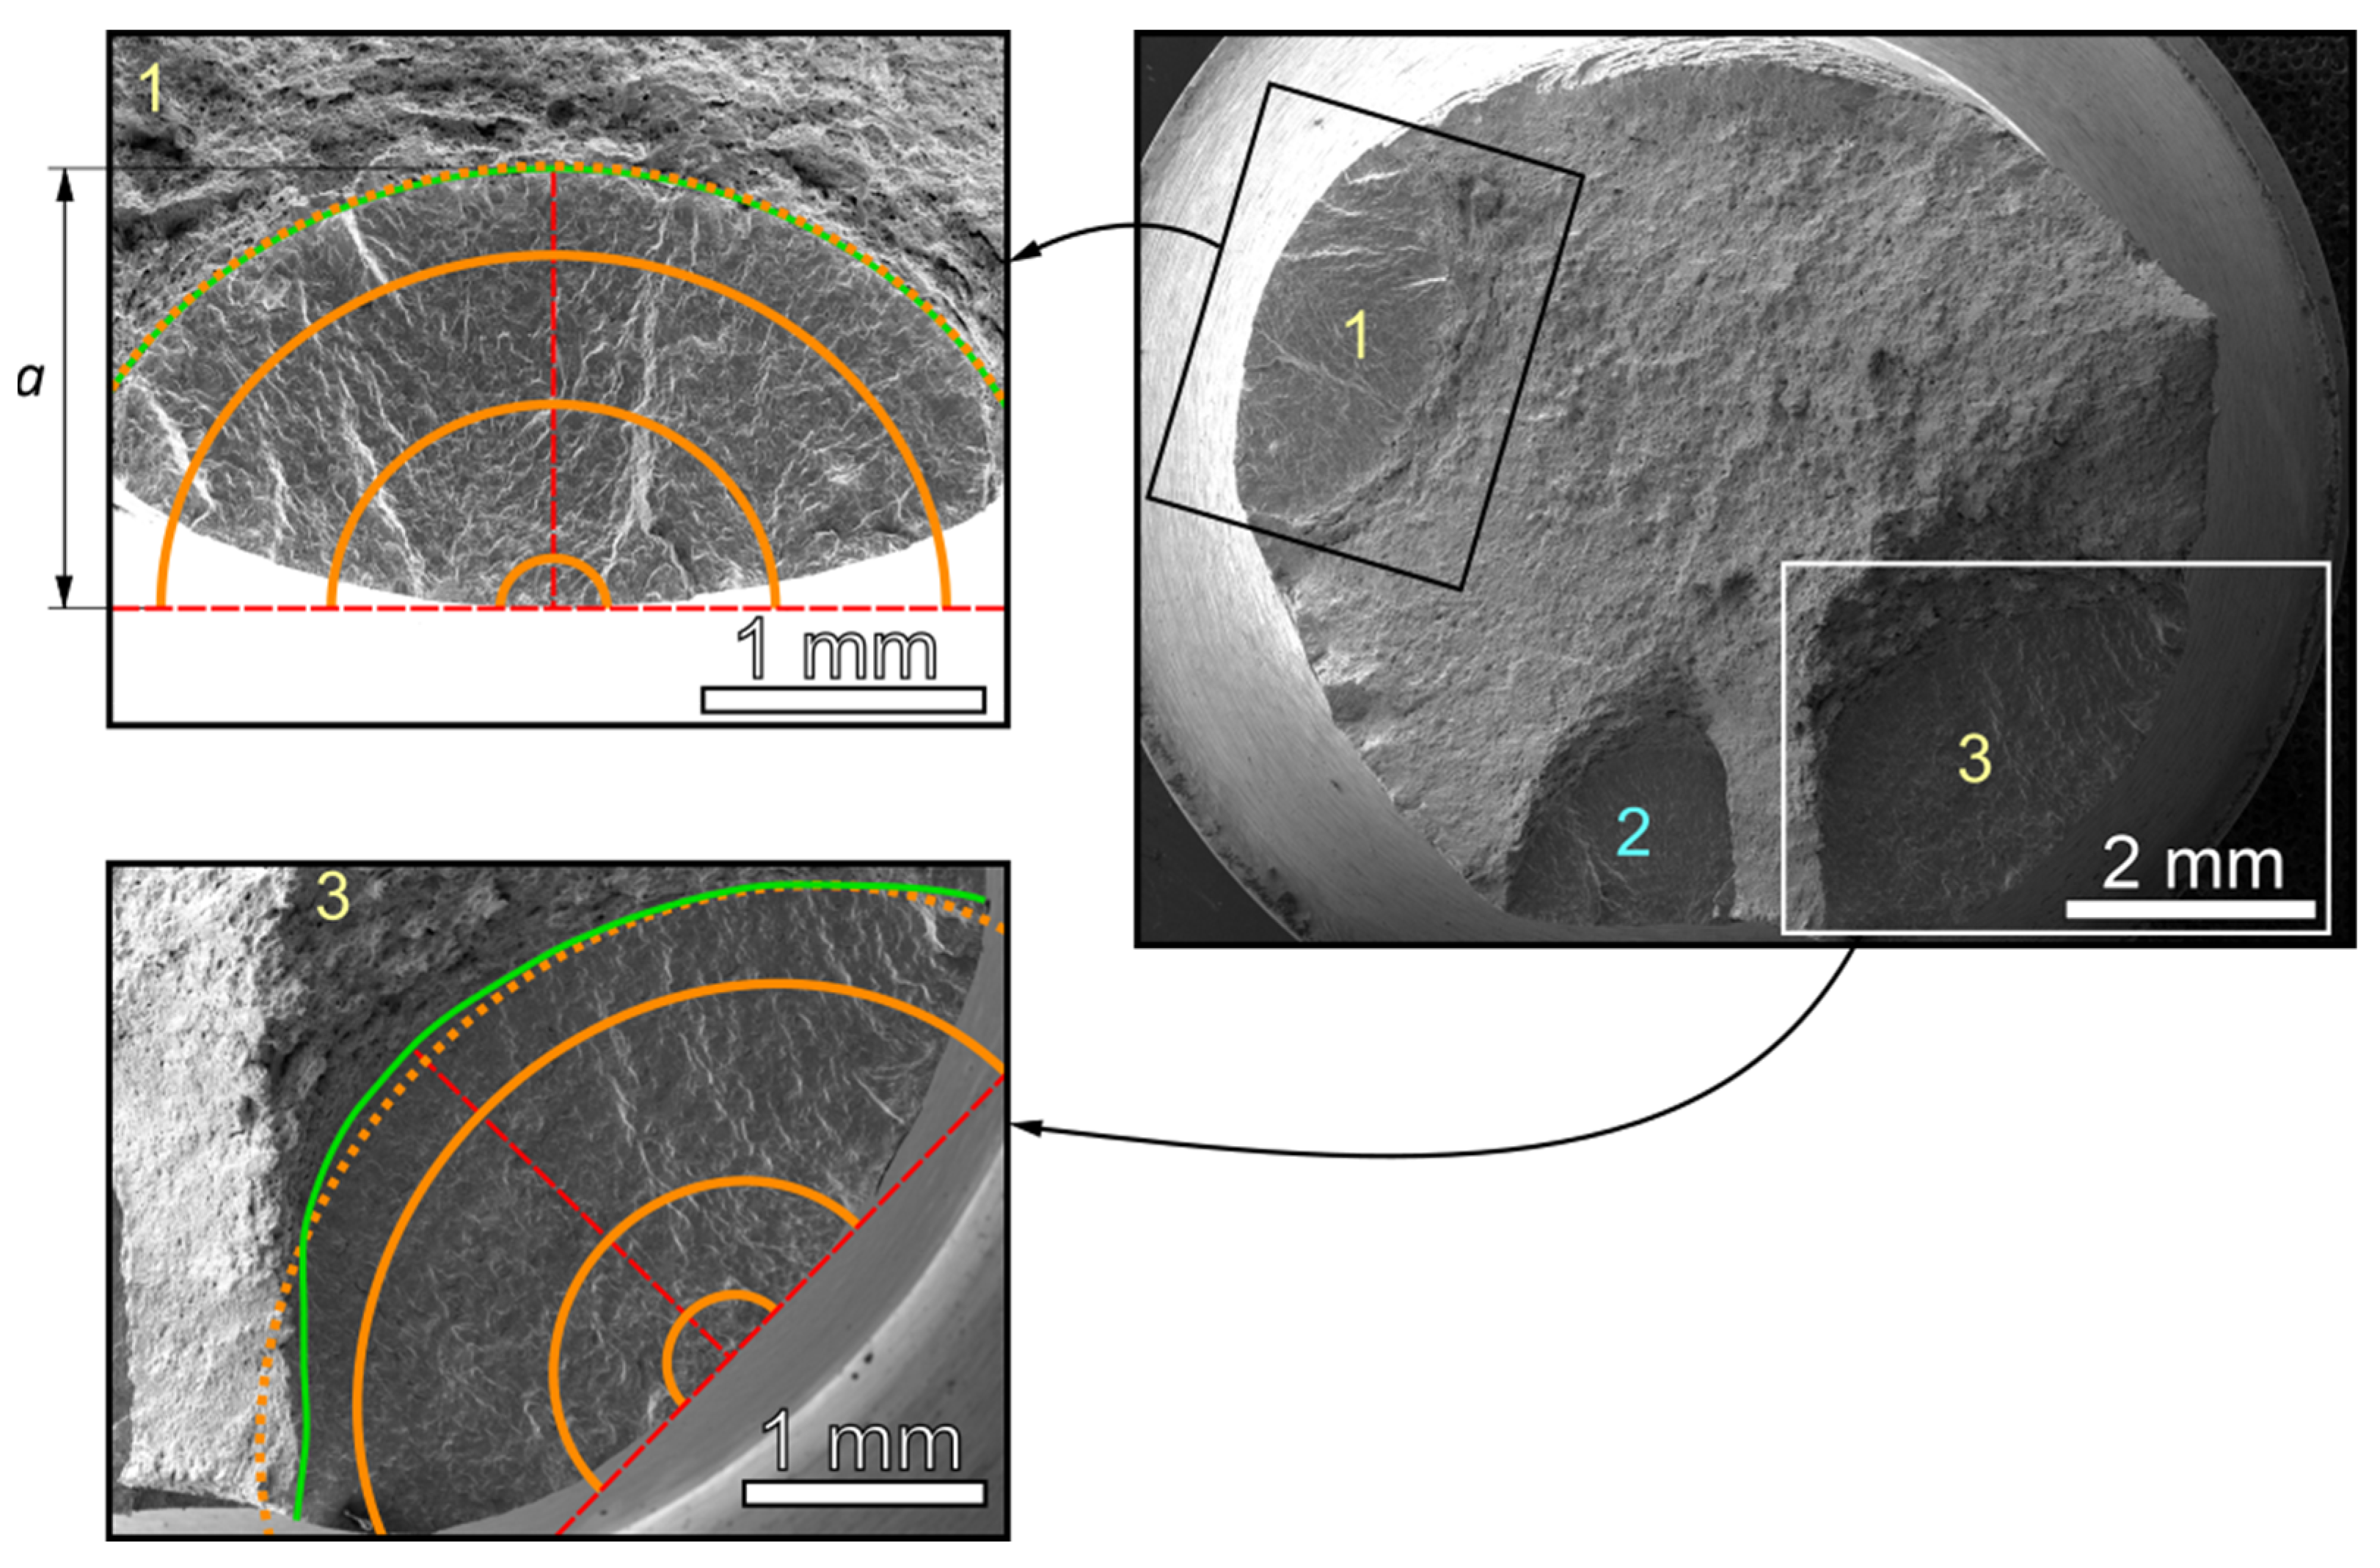
The notch area was regularly observed to record the crack growth during cyclic loading. Therefore, the fatigue tests were interrupted in specific number of cycles. With increasing crack growth rate during the specimen fatigue life, the number of cycles between two recordings was decreased. Stress and strain amplitudes were derived from the recorded hysteresis loops. Plastic strain amplitude was determined as the half-width of the hysteresis loop at mean stress.
The short crack growth was observed using a long focal length microscope Navitar (Navitar, Rochester, NY, USA) equipped with an Olympus DP 70 camera (Olympus corporation, Tokyo, Japan). The resolution was 0.15 μm/pixel. The specimens were kept in tension (at zero strain) to ensure crack opening during the image acquisition. The crack was characterized by the half of its surface length (the distance between crack tips) projected on a plane perpendicular to the loading axis as shown in Figure 4b, similarly as in [21,22]. The crack growth rate was then defined as the increment of the crack length, Δa, within the interval of cycles ΔN. In the case of Sanicro 25, which was tested without FIB pre-cracks, multiple crack initiation sites occurred within the notched area. Therefore, the growth of up to 5 cracks was followed and measured. The test was terminated after one of the cracks reached the edge of shallow notch. Measured maximum crack lengths were in range of 0.42–1.2 mm and 0.81–1.96 mm for Sanicro 25 and 304L, respectively. It means that experimental data of short fatigue crack propagation was measured predominantly for the cracks lengths below 1 mm.
The crack growth rates can be affected by microstructural aspects and mutual interactions between the cracks, for instance the crack coalescence and shielding. These effects can accelerate or even temporarily retard the growth of individual cracks. In such a way, “the equivalent crack” concept [17,23] is chosen to represent the growth of a typical largest growing crack. Especially due to crack coalescence the crack growth rate can experience sudden increase which is followed by short-term crack retardation when linked crack grow just in specimen interior to form again semi-elliptical crack front shape. Although these processes do not have effect on overall crack growth kinetics, the contribution to experimental data scatter is distinct as will be shown in following sections.
Figure 4a,b shows the notch area of Sanicro 25 in different stages of the cyclic testing. Nearly all austenitic grains underwent localization of cyclic plastic deformation into persistent slip bands which are characterized by the formation of persistent slip markings (PSMs) on the surface. These markings were aligned along {111} slip systems, stemming from the nature of face cubic centered lattice of the alloy. Typically, the PSMs consist of extrusions and intrusions which intensify during cyclic straining. As a consequence of PSMs evolution, the local stress concentration in the tip of intrusions is increasing and subsequently can result in the crack initiation. This is documented in in Figure 4a where cracks A, B and C initiated nearly simultaneously. During further cycling, the cracks path followed adjacent PSMs and at some point, the coalescence of cracks occurred. For a more detailed description, the reader is referred to the comprehensive study of Mazánová and Polák [17].
Figure 5 presents the results of crack growth observation carried out on the 304L steel. Since the crack initiation stage of fatigue life was skipped due to the FIB pre-crack formation, the number of cycles indicating the image acquisition represents only the fatigue crack propagation stage, thus, it is indexed by “P”. The specimen surface contained PSMs but also strain-induced martensite. It is widely accepted [24,25] that such a phase transformation can hinder the subsequent crack growth by the introduction of additional interfaces and residual stress fields.
Figure 6 depicts the vicinity of crack tip to elucidate in detail the different appearance of specimen surfaces of both materials. Due to predominantly planar character of cyclic plastic deformation reflected by frequent PSMs, the zig-zag crack path was typical for Sanicro 25, as shown in Figure 6a. Contrary to that, the crack path in 304L (Figure 6b) consists of the straight sections where the crack propagated along PSM and the sections with fine-rugged crack path stemming from more difficult crack growth due to the SIMT. Increased roughness of the surface in the vicinity of the crack has been documented as a clear evidence of strain-induced martensite occurrence [26,27].

2.5. Fractography

The fracture surfaces analysis was carried out on the cylindrical specimens without shallow notch. The SEM observation was focused mainly on the crack front shape and its comparison with the modeled one.

3. Results and Discussion

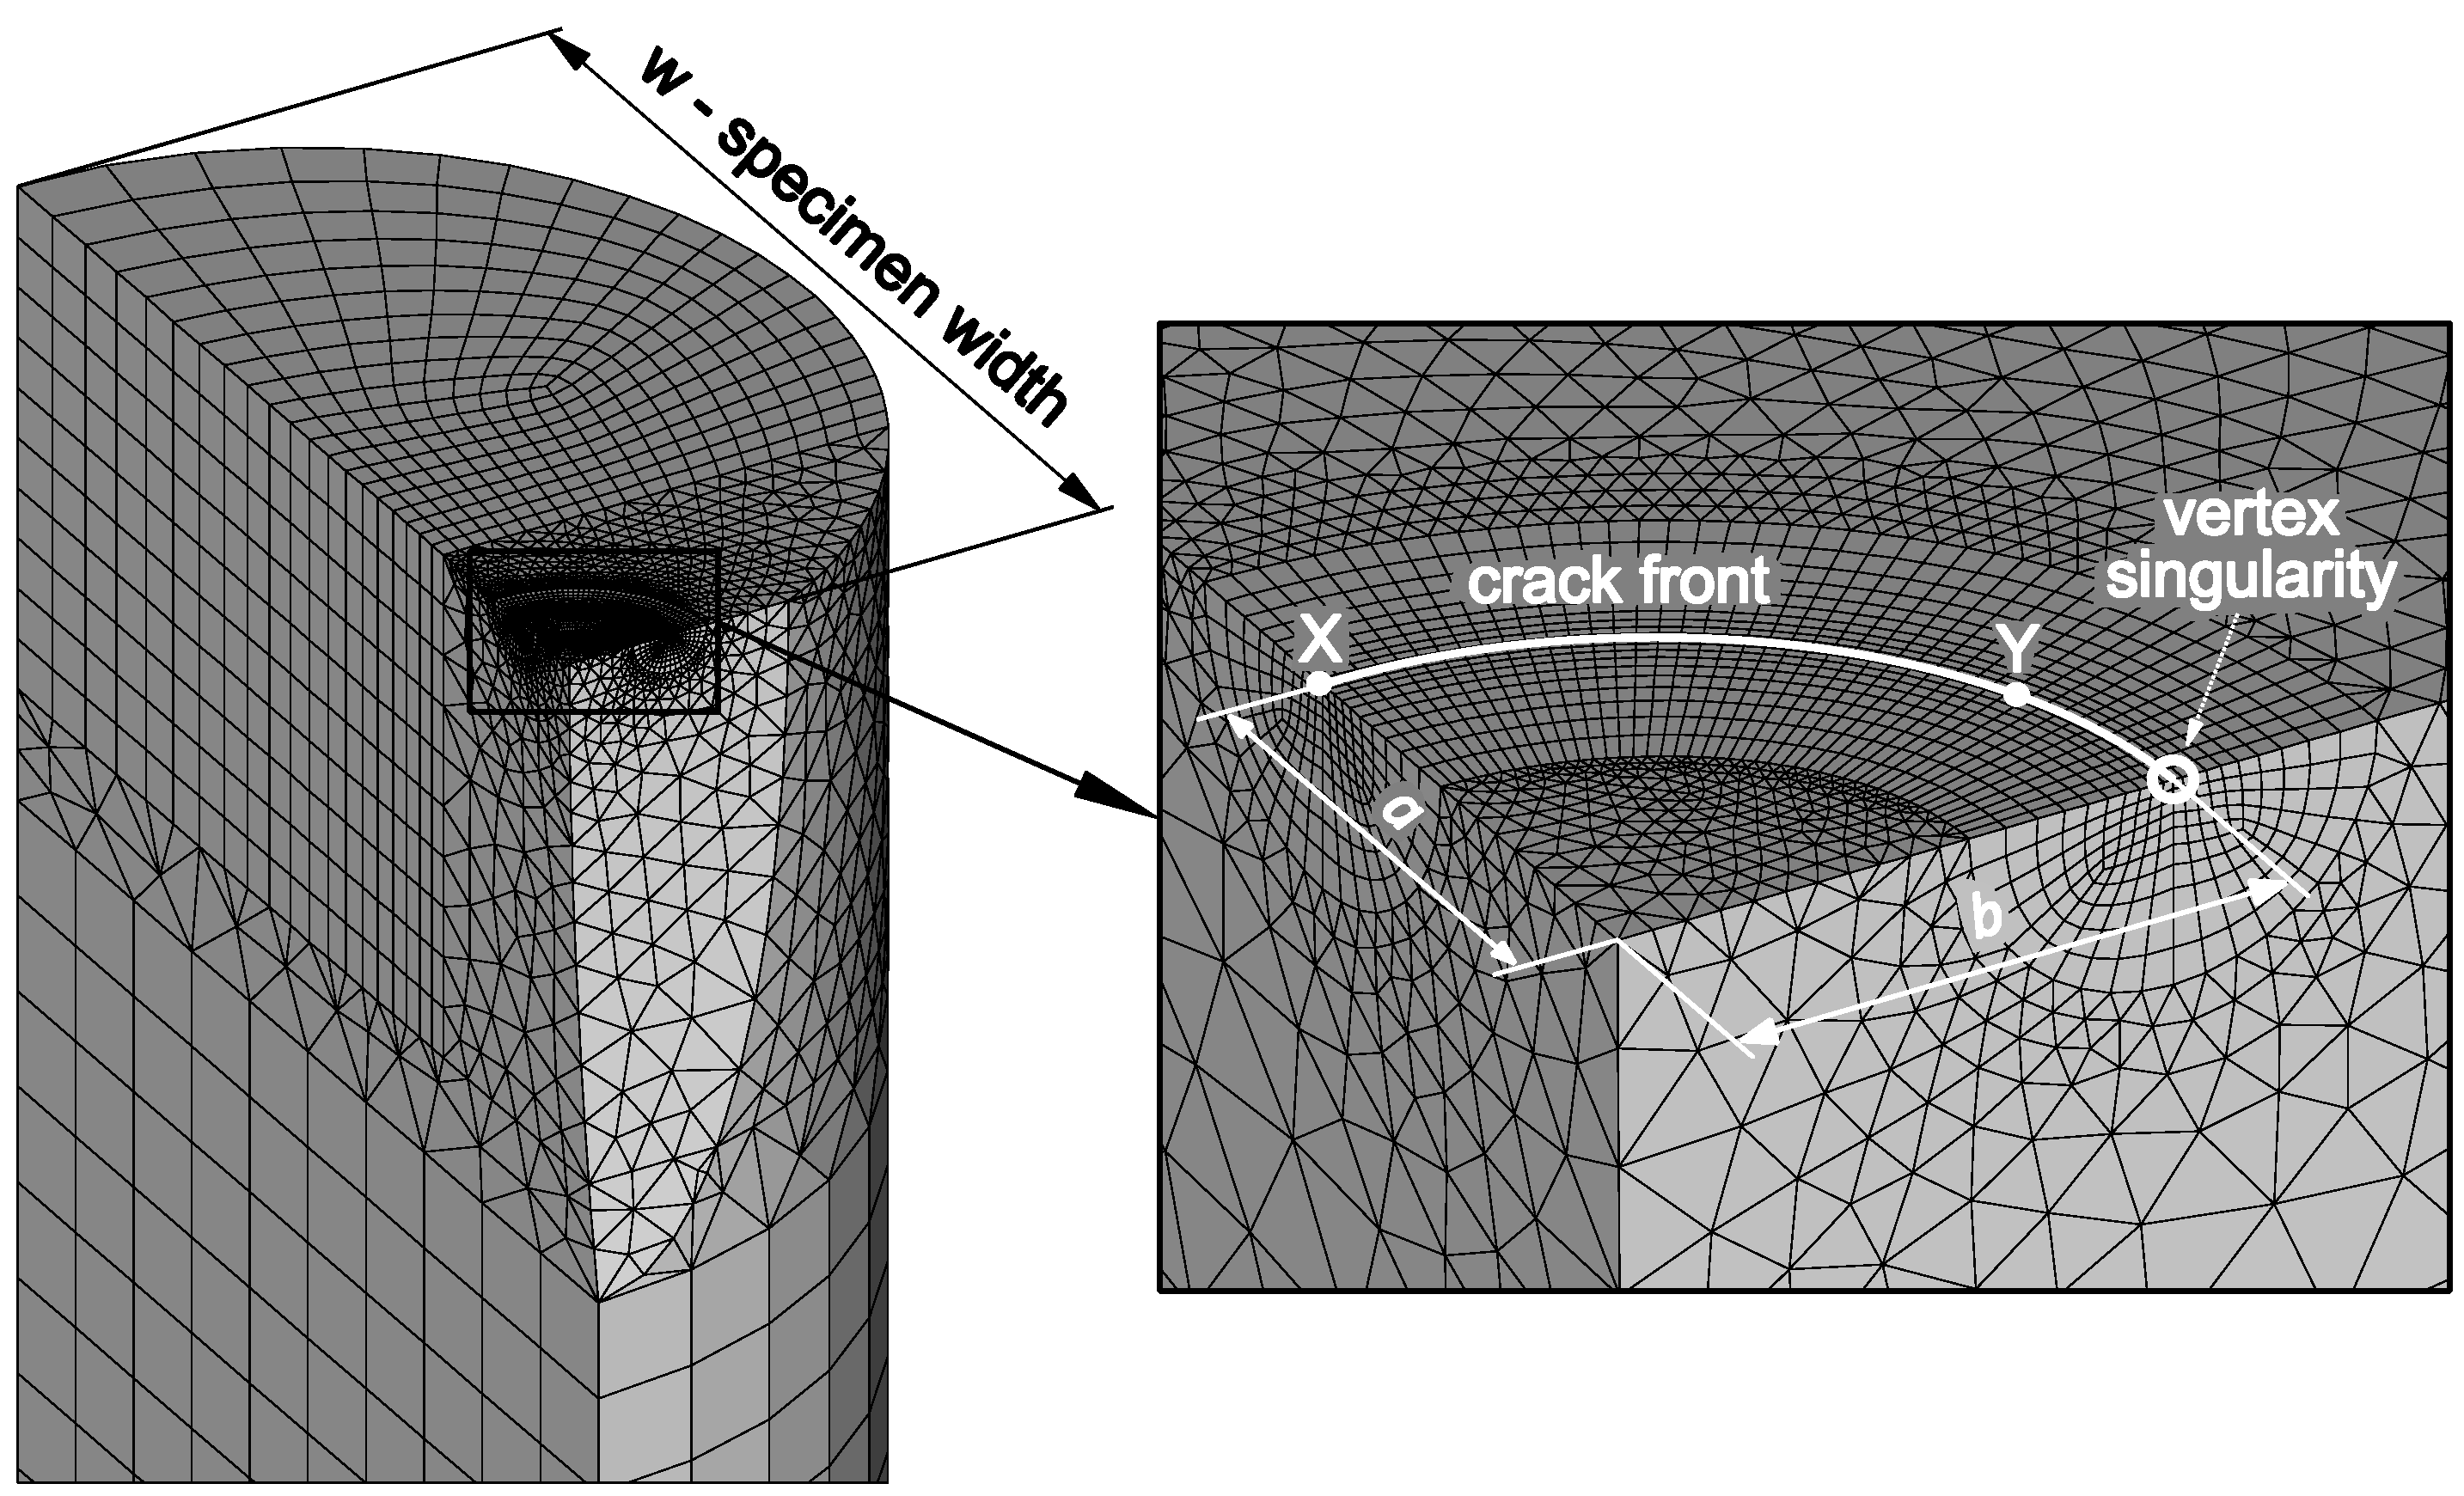
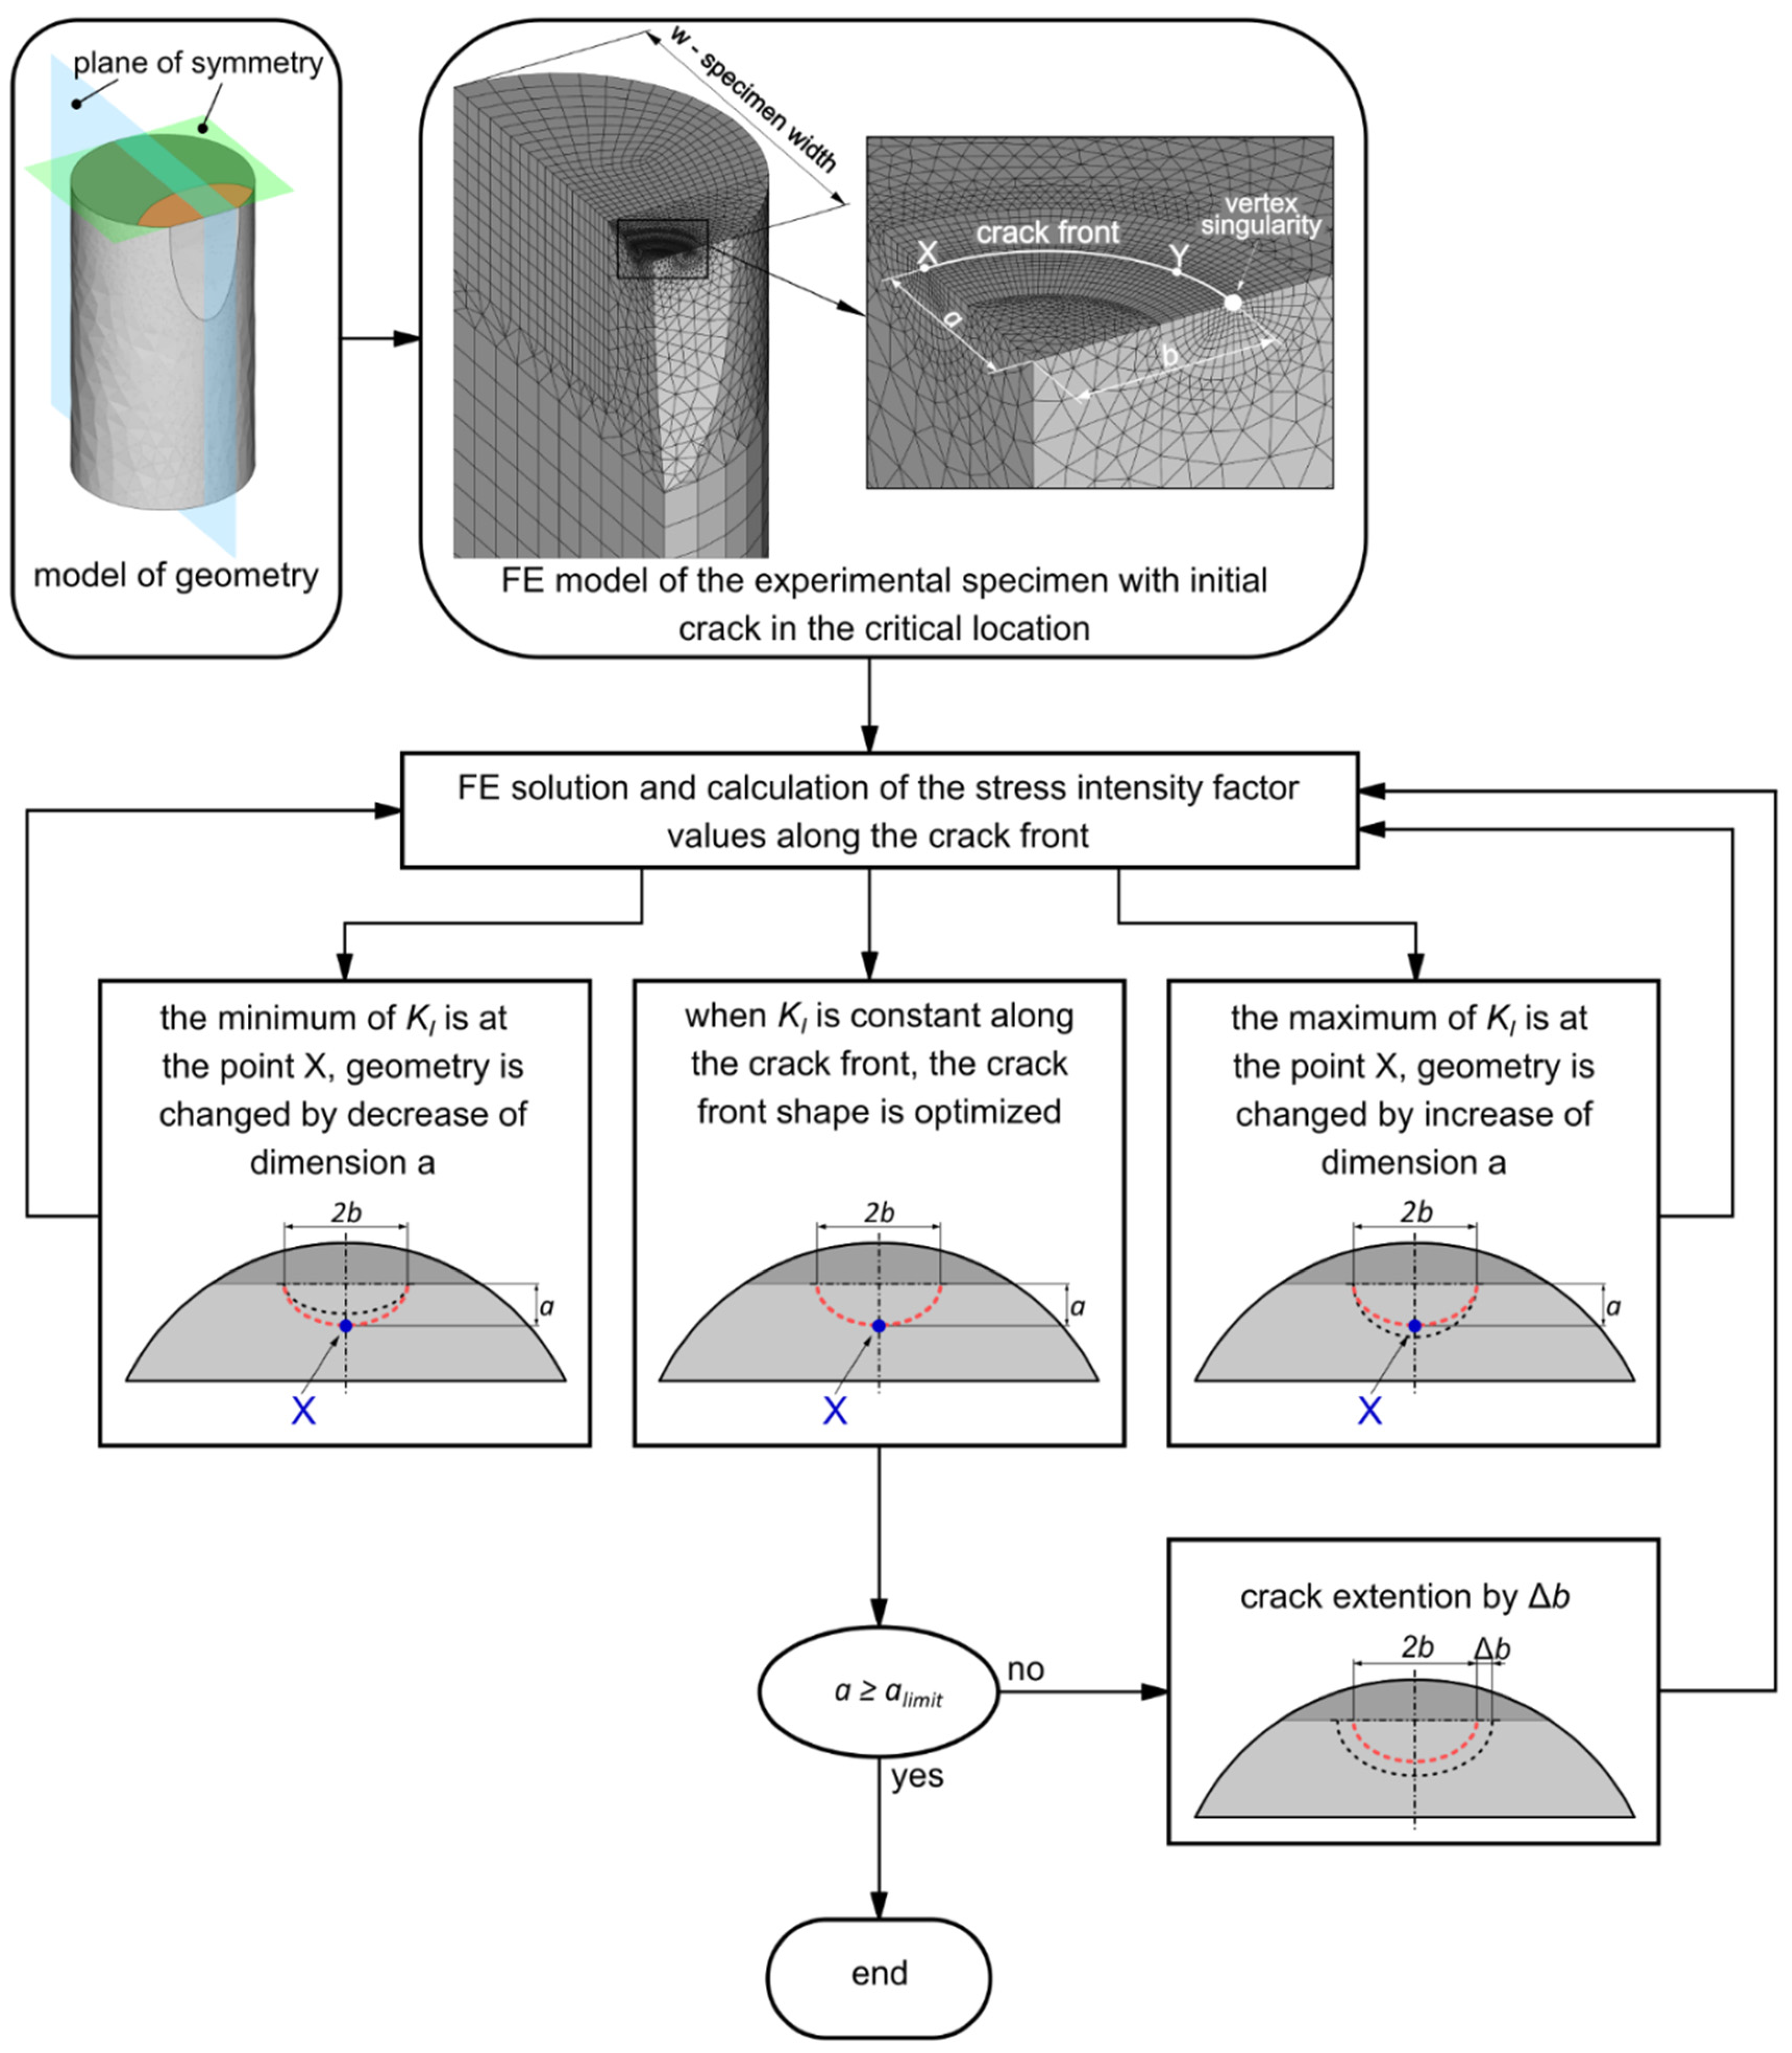
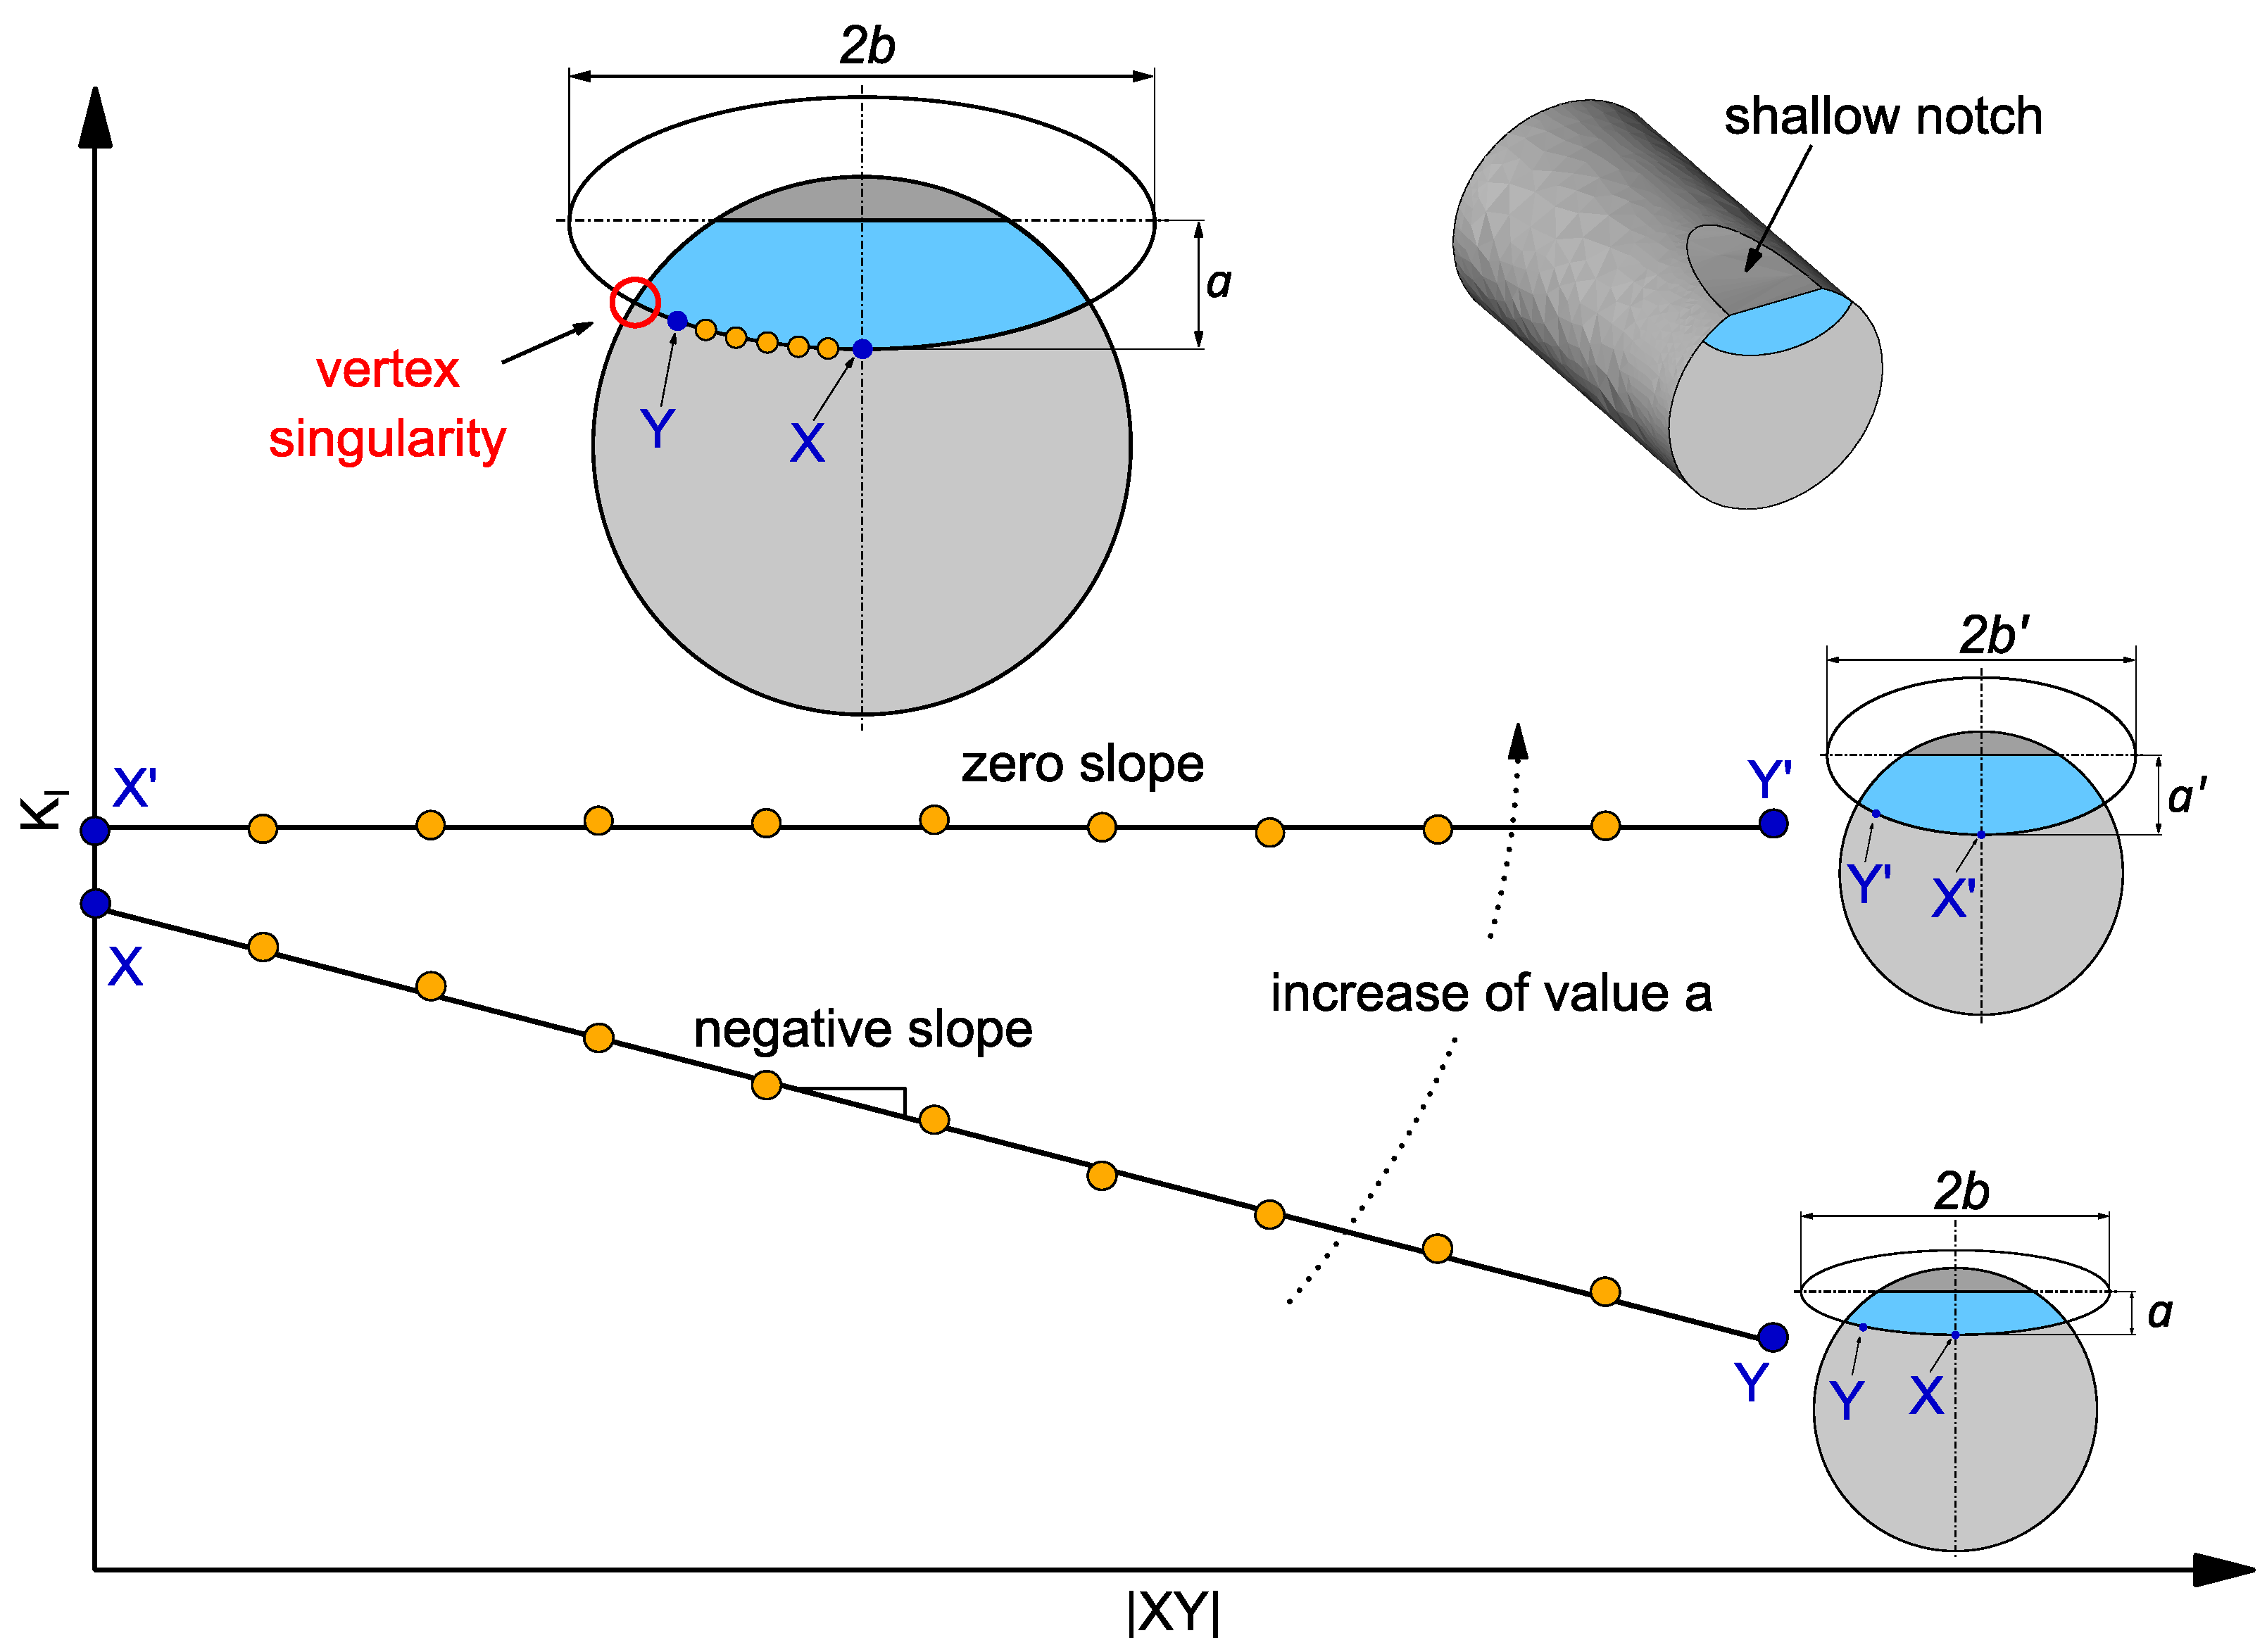
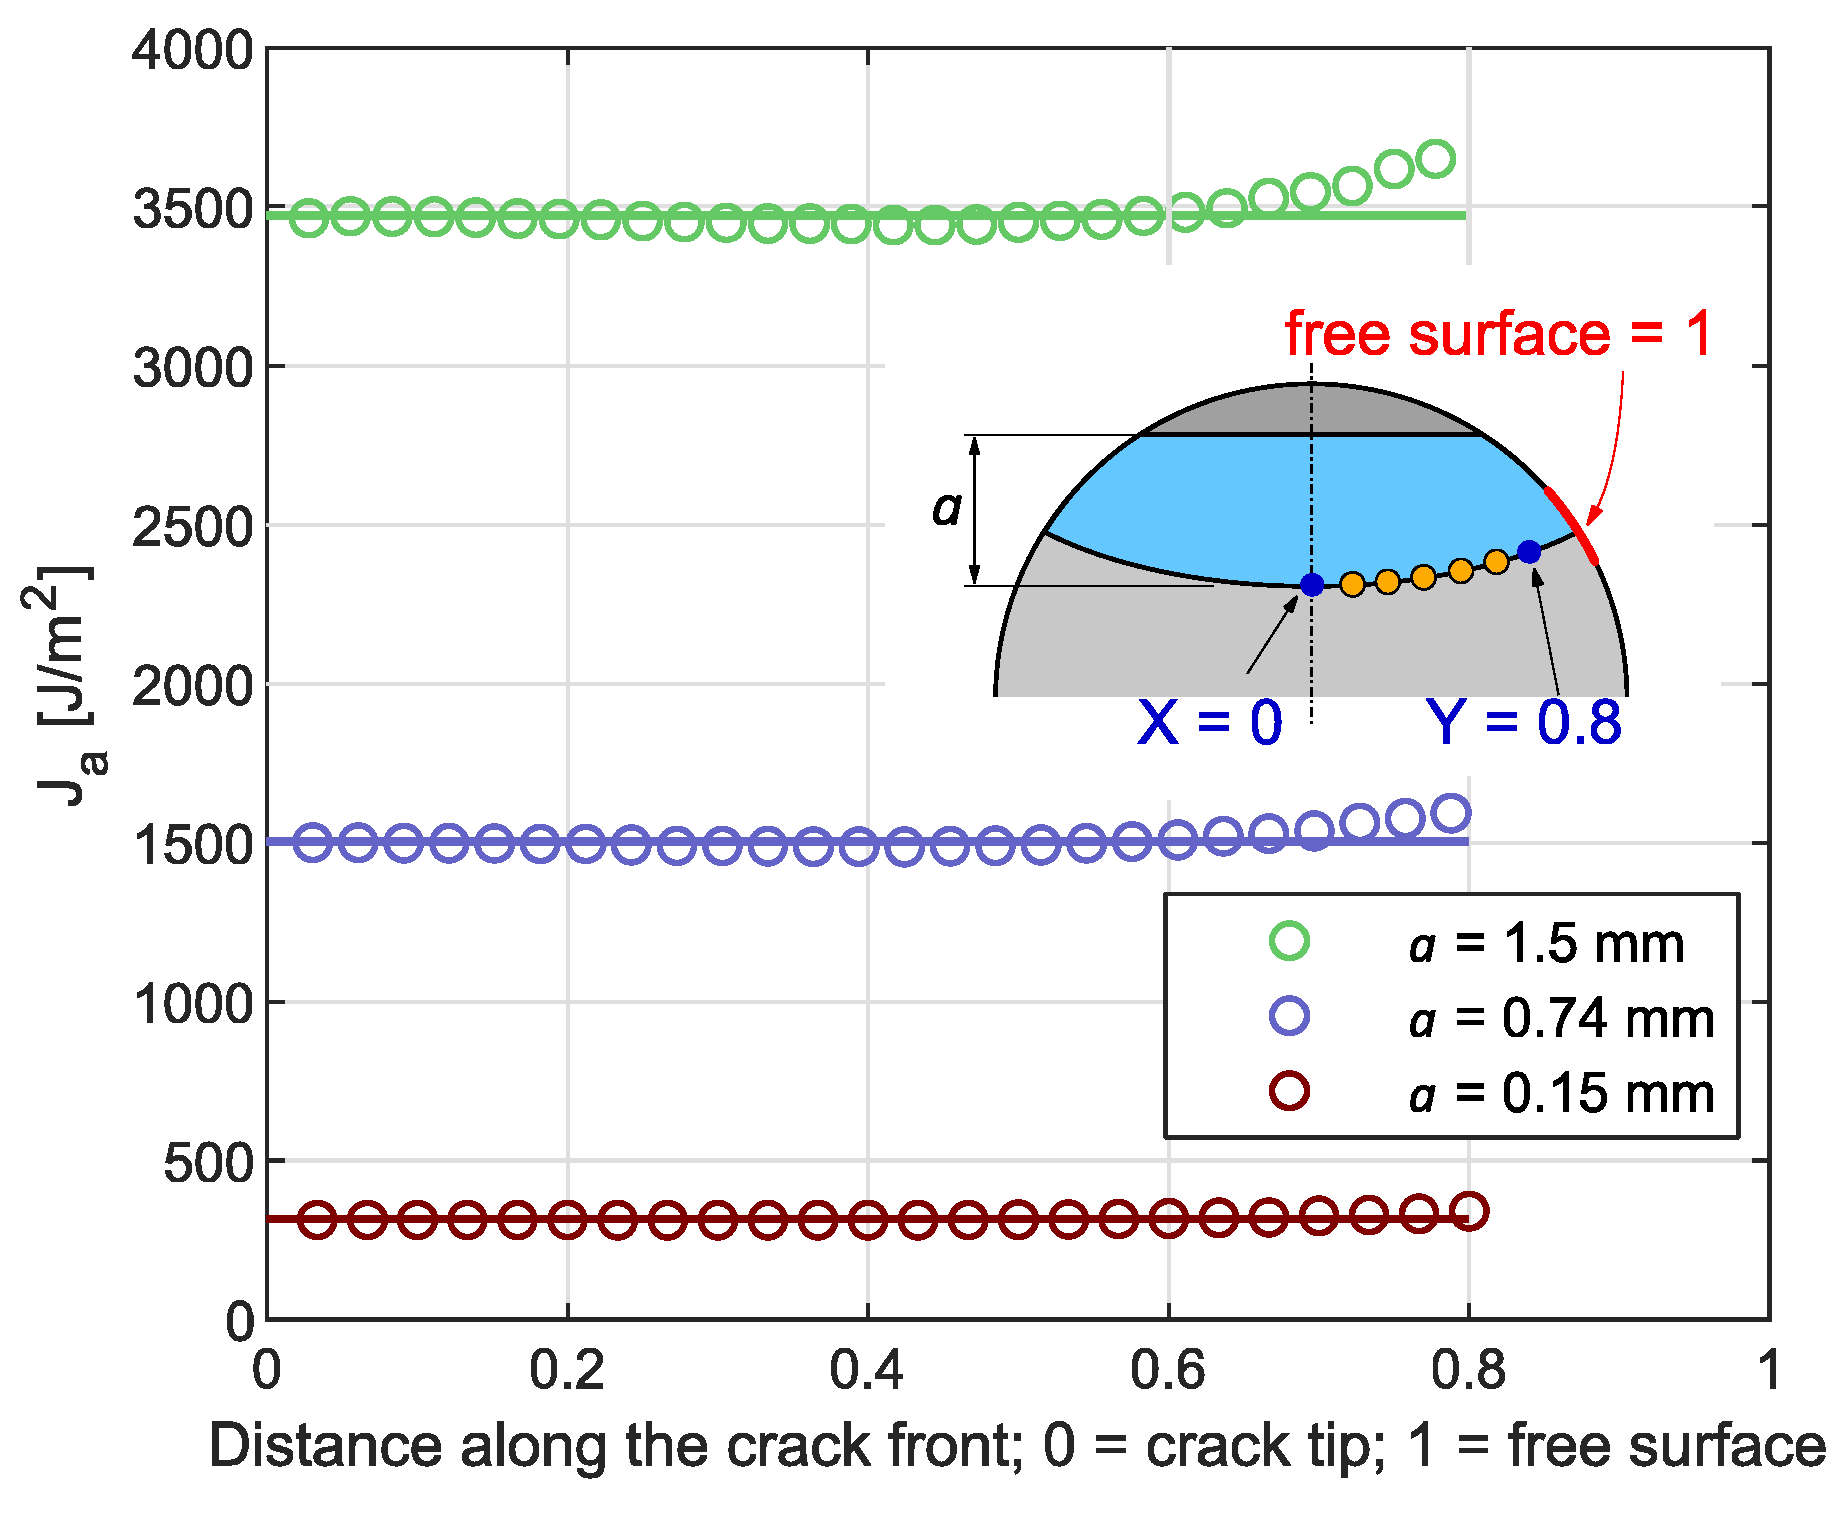
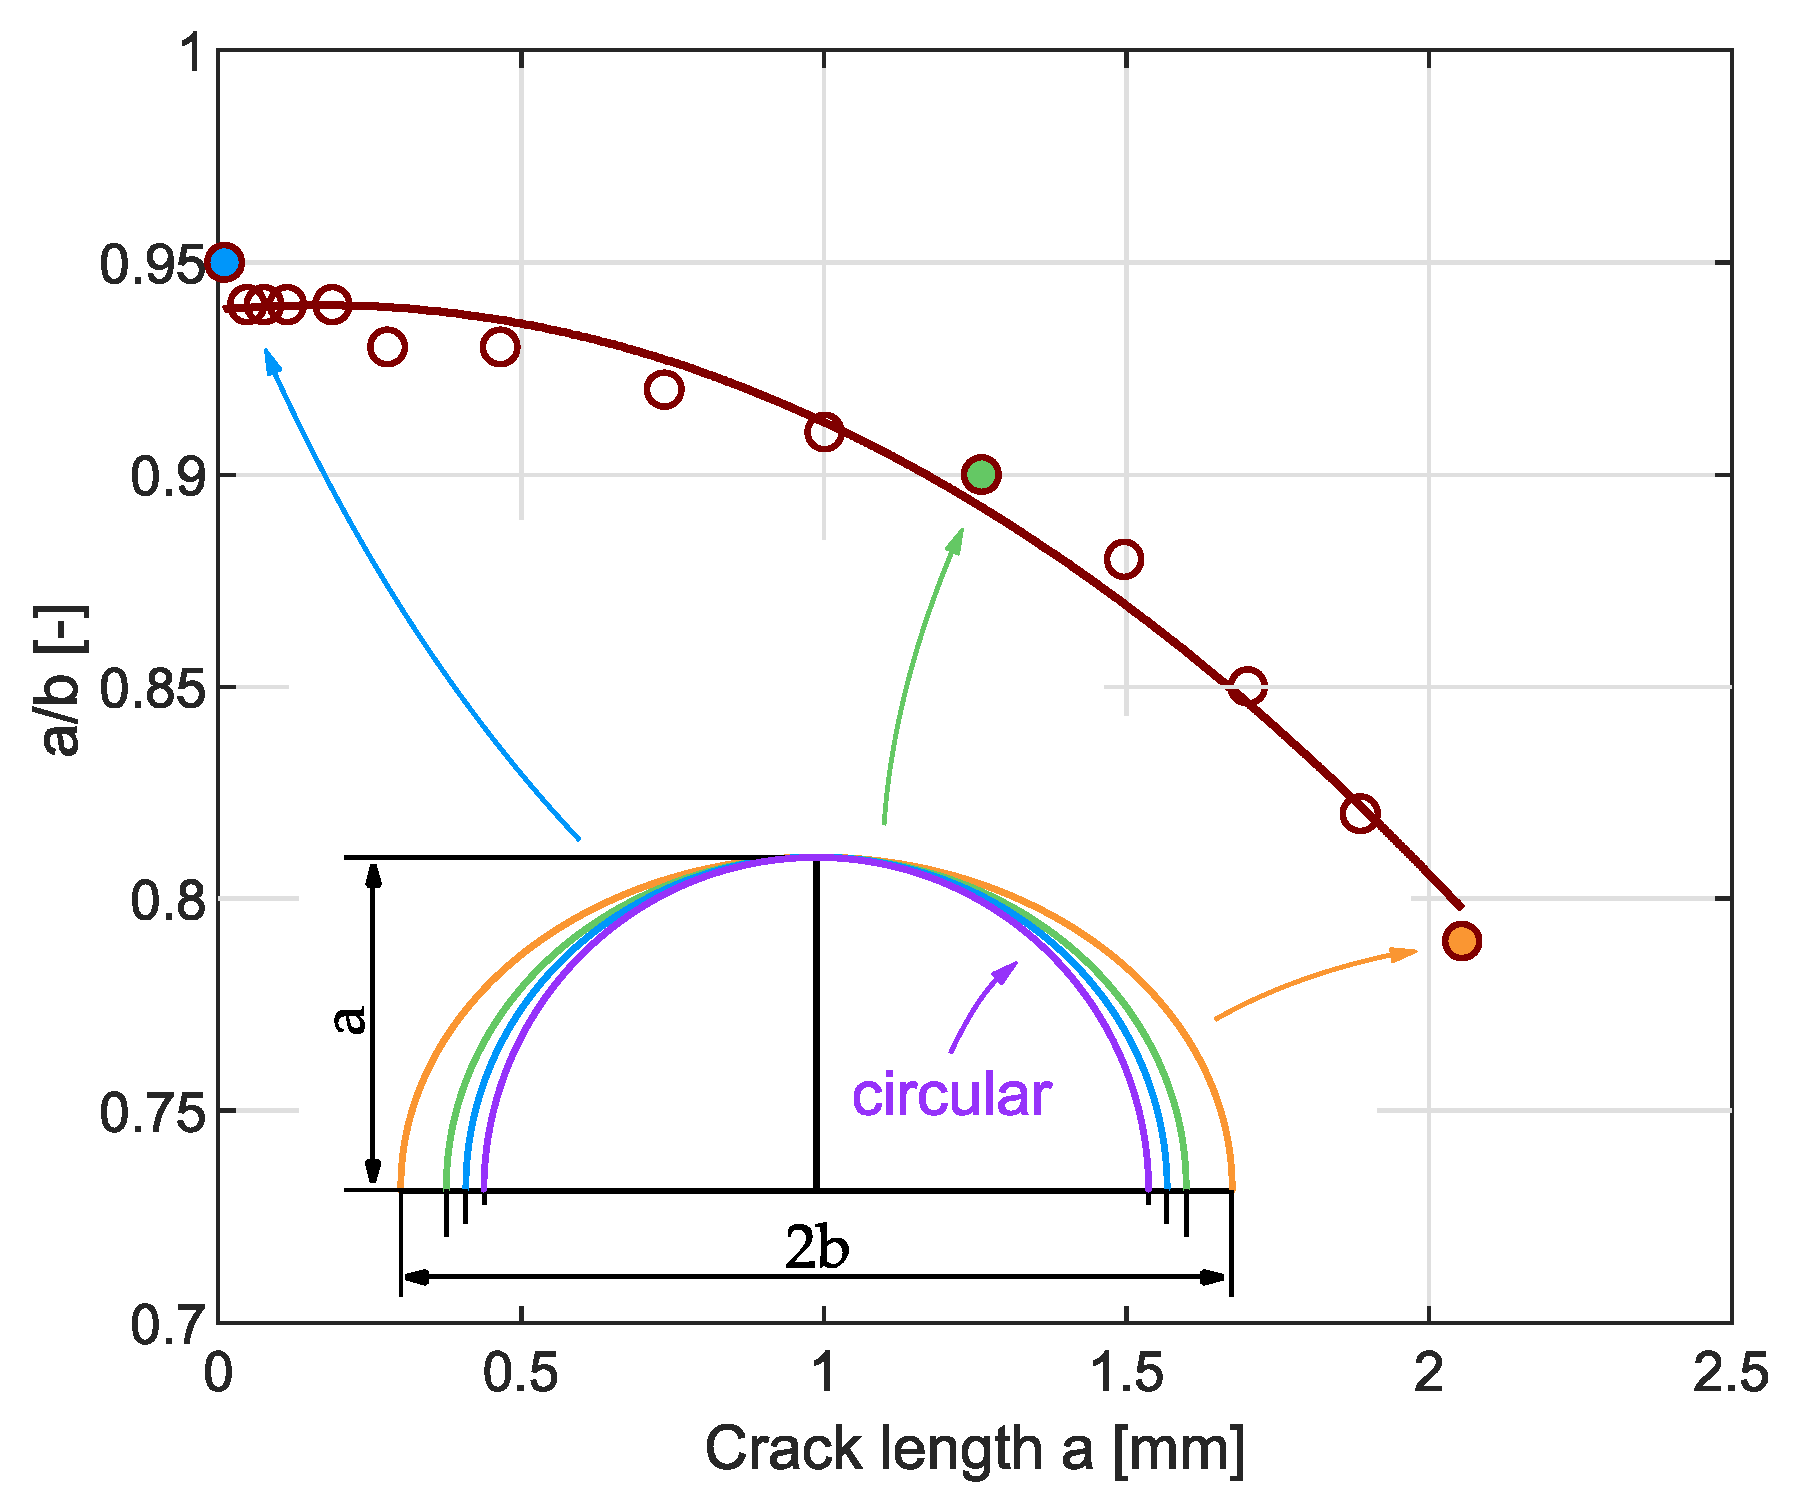
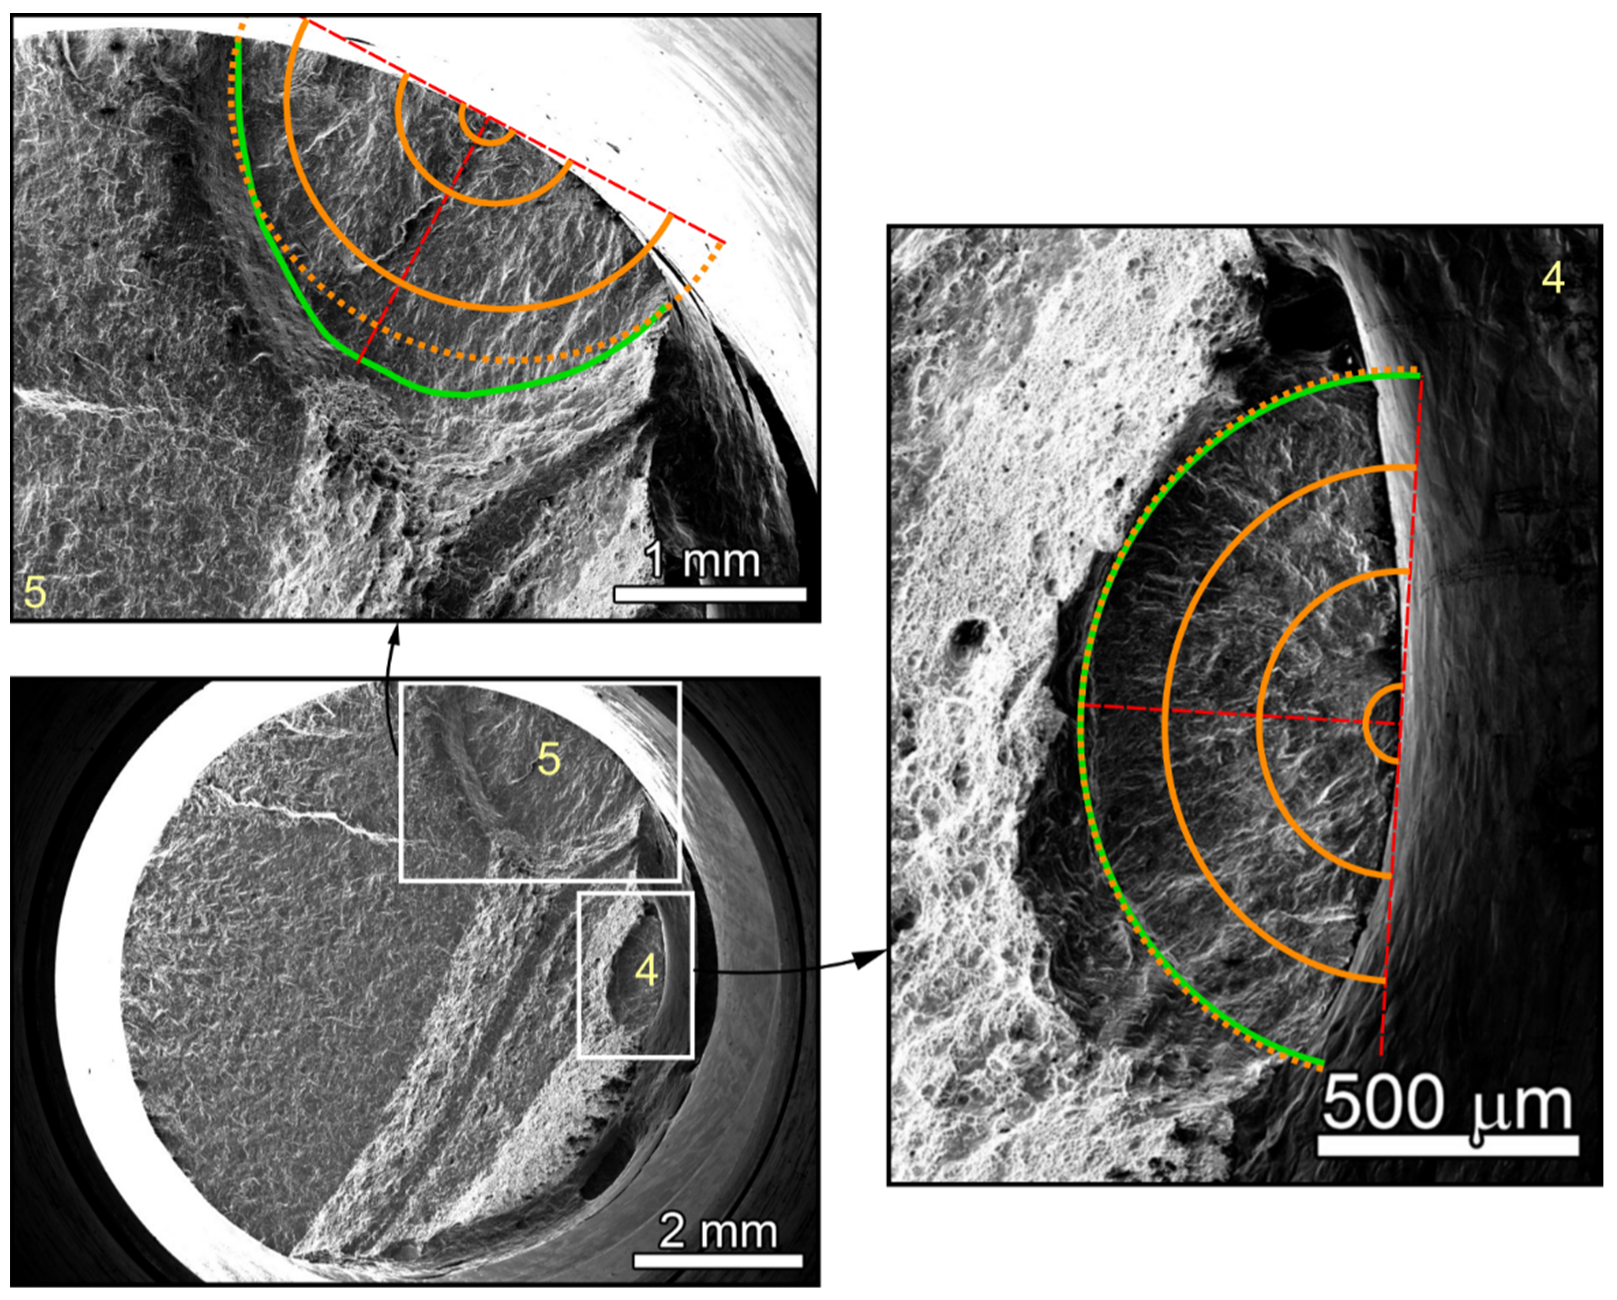
3.1. Optimization of the Fatigue Crack Front Shape during Crack Propagation

Finite element modeling was performed to simulate short crack growth in the specimens and to calculate fracture mechanics parameters like stress intensity factor or J-integral. Previously published papers that dealt with a similar topic [11,15,16,28] usually considered the crack front shape as a simple semi-circle.
However, it is well known that the crack is rather semi-elliptical and the ratio between the axes of ellipse vary during the crack propagation. In order to evaluate the residual fatigue lifetime more precisely, it is necessary to model the crack front shape as a semi-elliptical with changing ratio between the crack axes with increasing crack length.
According to Sih [29,30], the shape of a crack front is given by minimization of the strain energy density, which means that the value of strain energy density is constant along the crack front during crack propagation. There is a direct relation between strain energy density and stress intensity factor or J-integral. It means that for the propagating crack, the value of stress intensity factor (J-integral) is constant along the crack front. This assumption is in agreement with the comprehensive study about the effect of free surface performed by Oplt et al. [31], therefore it was used for the estimation of the ratio between the crack axes during crack propagation also in this case.
Due to a complicated geometry of the crack front, it was necessary to calculate fracture parameters numerically. Figure 7 shows a typical numerical model used in the calculation in the software ANSYS 19.2. In order to save calculation time, symmetry of the specimen was used. Only a quarter of the central part of cylindrical specimen with the shallow notch was modeled. A typical 3D numerical model contained approximately 40,000 isoparametric elements. Fine finite element mesh was generated near the crack front to describe the stress field gradient near the crack front properly (see the details in the Figure 7). According to the real experimental conditions, a uniform displacement was applied, so only loading Mode I was considered. To save computational time during simulations, first optimization was prepared based on elastic model and stress-intensity factor values. Then optimized crack shape was controlled by elastoplastic analysis taking into account non-linear material properties according to the measured cyclic stress–strain curves shown in Figure 3. Basic mechanical properties of both steels are listed in Table 3.
Table 3. Basic mechanical properties of both materials.
Young’s Modulus E [GPa]Poisson’s Ratio υProof Yield Strength Rp0.2 [MPa]Ultimate Tensile Strength Rm [MPa]Elongation at Break [%]
Sanicro 25 [32]1850.337578749
304L2010.323665183
The values of stress intensity factor (correspond to elastic part of J-integral) were calculated in each of 40 points distributed along the crack front. It is important to note that the stress field near the free surface is affected by so-called ‘vertex singularity‘ [33,34], which influences also the crack propagation in this area [35,36]. Due to this fact, approximately 20% of the crack front close to the vertex point was not taken into account during the crack front shape optimization. Hence, the calculations were carried out within the distance of the crack front in between the crack tip X and point Y as marked in Figure 7.
The shape of the crack front changes continuously during the cycling of physically short cracks up to the length of approximately 2 mm at the specimen surface. Therefore, it is important to optimize the crack shape depending on its size. The algorithm for the crack front shape optimization is described in Figure 8, for more details see [37].
The initial crack shape was modeled as a semi-circle since the ratio of the axes of the very short semi-elliptical crack a/b is close to 1. Then, the stress intensity factor KI was calculated as described above. The values of stress intensity factor as a function of the distance between X point and Y point at the crack front were fitted by a linear function, as presented in Figure 9. According to a slope of the linear function, three options may occur: (i) the slope is negative, whereas the ratio a/b increases due to increasing a; (ii) the slope is positive and the ratio a/b increases due to decreasing a; (iii) the slope is equal to zero, when the crack shape is optimized. Next step follows this procedure, only when the value of the axis b is higher. This loop was repeated until reaching the limit for physically short cracks of a = 2 mm, adopted from [38], which is also correspond to the maximum of experimentally captured crack length.
It is important to note that the crack front shape optimization can also be performed by calculating J-integral in elasto-plastic analysis. It was verified that the resulting crack front shape was the same for both elasto-plastic J-integral and KI and that they were constant between the points X and Y, see Figure 10. The difference was only in calculation time for the elasto-plastic analysis which was longer by one order of magnitude. Therefore, to save the calculation time, the elastic analysis was performed for the crack front shape optimization and the elasto-plastic simulations were used just for the validation of the final crack shape.
The resulting crack front shapes confirmed that the initial crack front shape is close to a semi-circle, e.g., the ratio a/b is 0.94 for a = 0.047 mm. The larger the crack is, the lower the ratio a/b is (for crack length a = 1.89 mm the ratio is a/b = 0.82). This dependence is demonstrated in Figure 11. The predictions are in agreement with the fractographic observations of the crack front evolution shown in Figure 12 and Figure 13.
Figure 12 shows the fracture surface of Sanicro 25 subjected to cyclic loading at total strain amplitude of 0.7%. Here, three developed cracks can be clearly distinguished, denoted as 1, 2 and 3. The growth of the crack 2 was probably influenced by microstructure and mutual interaction with crack 3, therefore its shape was irregular. In the details of Figure 12, depicting the cracks 1 and 3, the real crack front shapes are highlighted by green color and numerically predicted crack front shapes are highlighted by orange full or dotted lines. In the case of crack 3, it might be observed that the crack front correlates well with numerically predicted shape. Although the part of the crack front that lies close to the crack 2 is slightly irregular. On the other hand, the crack 1 was far enough to propagate independently. Therefore, the crack front shape is in very good agreement with numerical prediction (highlighted by orange color).
The same analysis was carried out for the 304L specimen cycled at total strain amplitude of 0.4%. The fracture surface of this sample containing two cracks denoted 4 and 5 is shown in Figure 13. In the case of the crack 5, the real crack front shape is slightly different from the numerical prediction presumably due to microstructural effects. However, the crack 4 is characterized by regular crack front shape and the predicted shape is nearly identical with the real one. It can be concluded that the crack front shapes predicted by continuum mechanics correspond well to the experimentally obtained crack front shapes with slight deviations induced by possible microstructural irregularities (such as precipitates or inclusions) and the effect of SIMT.

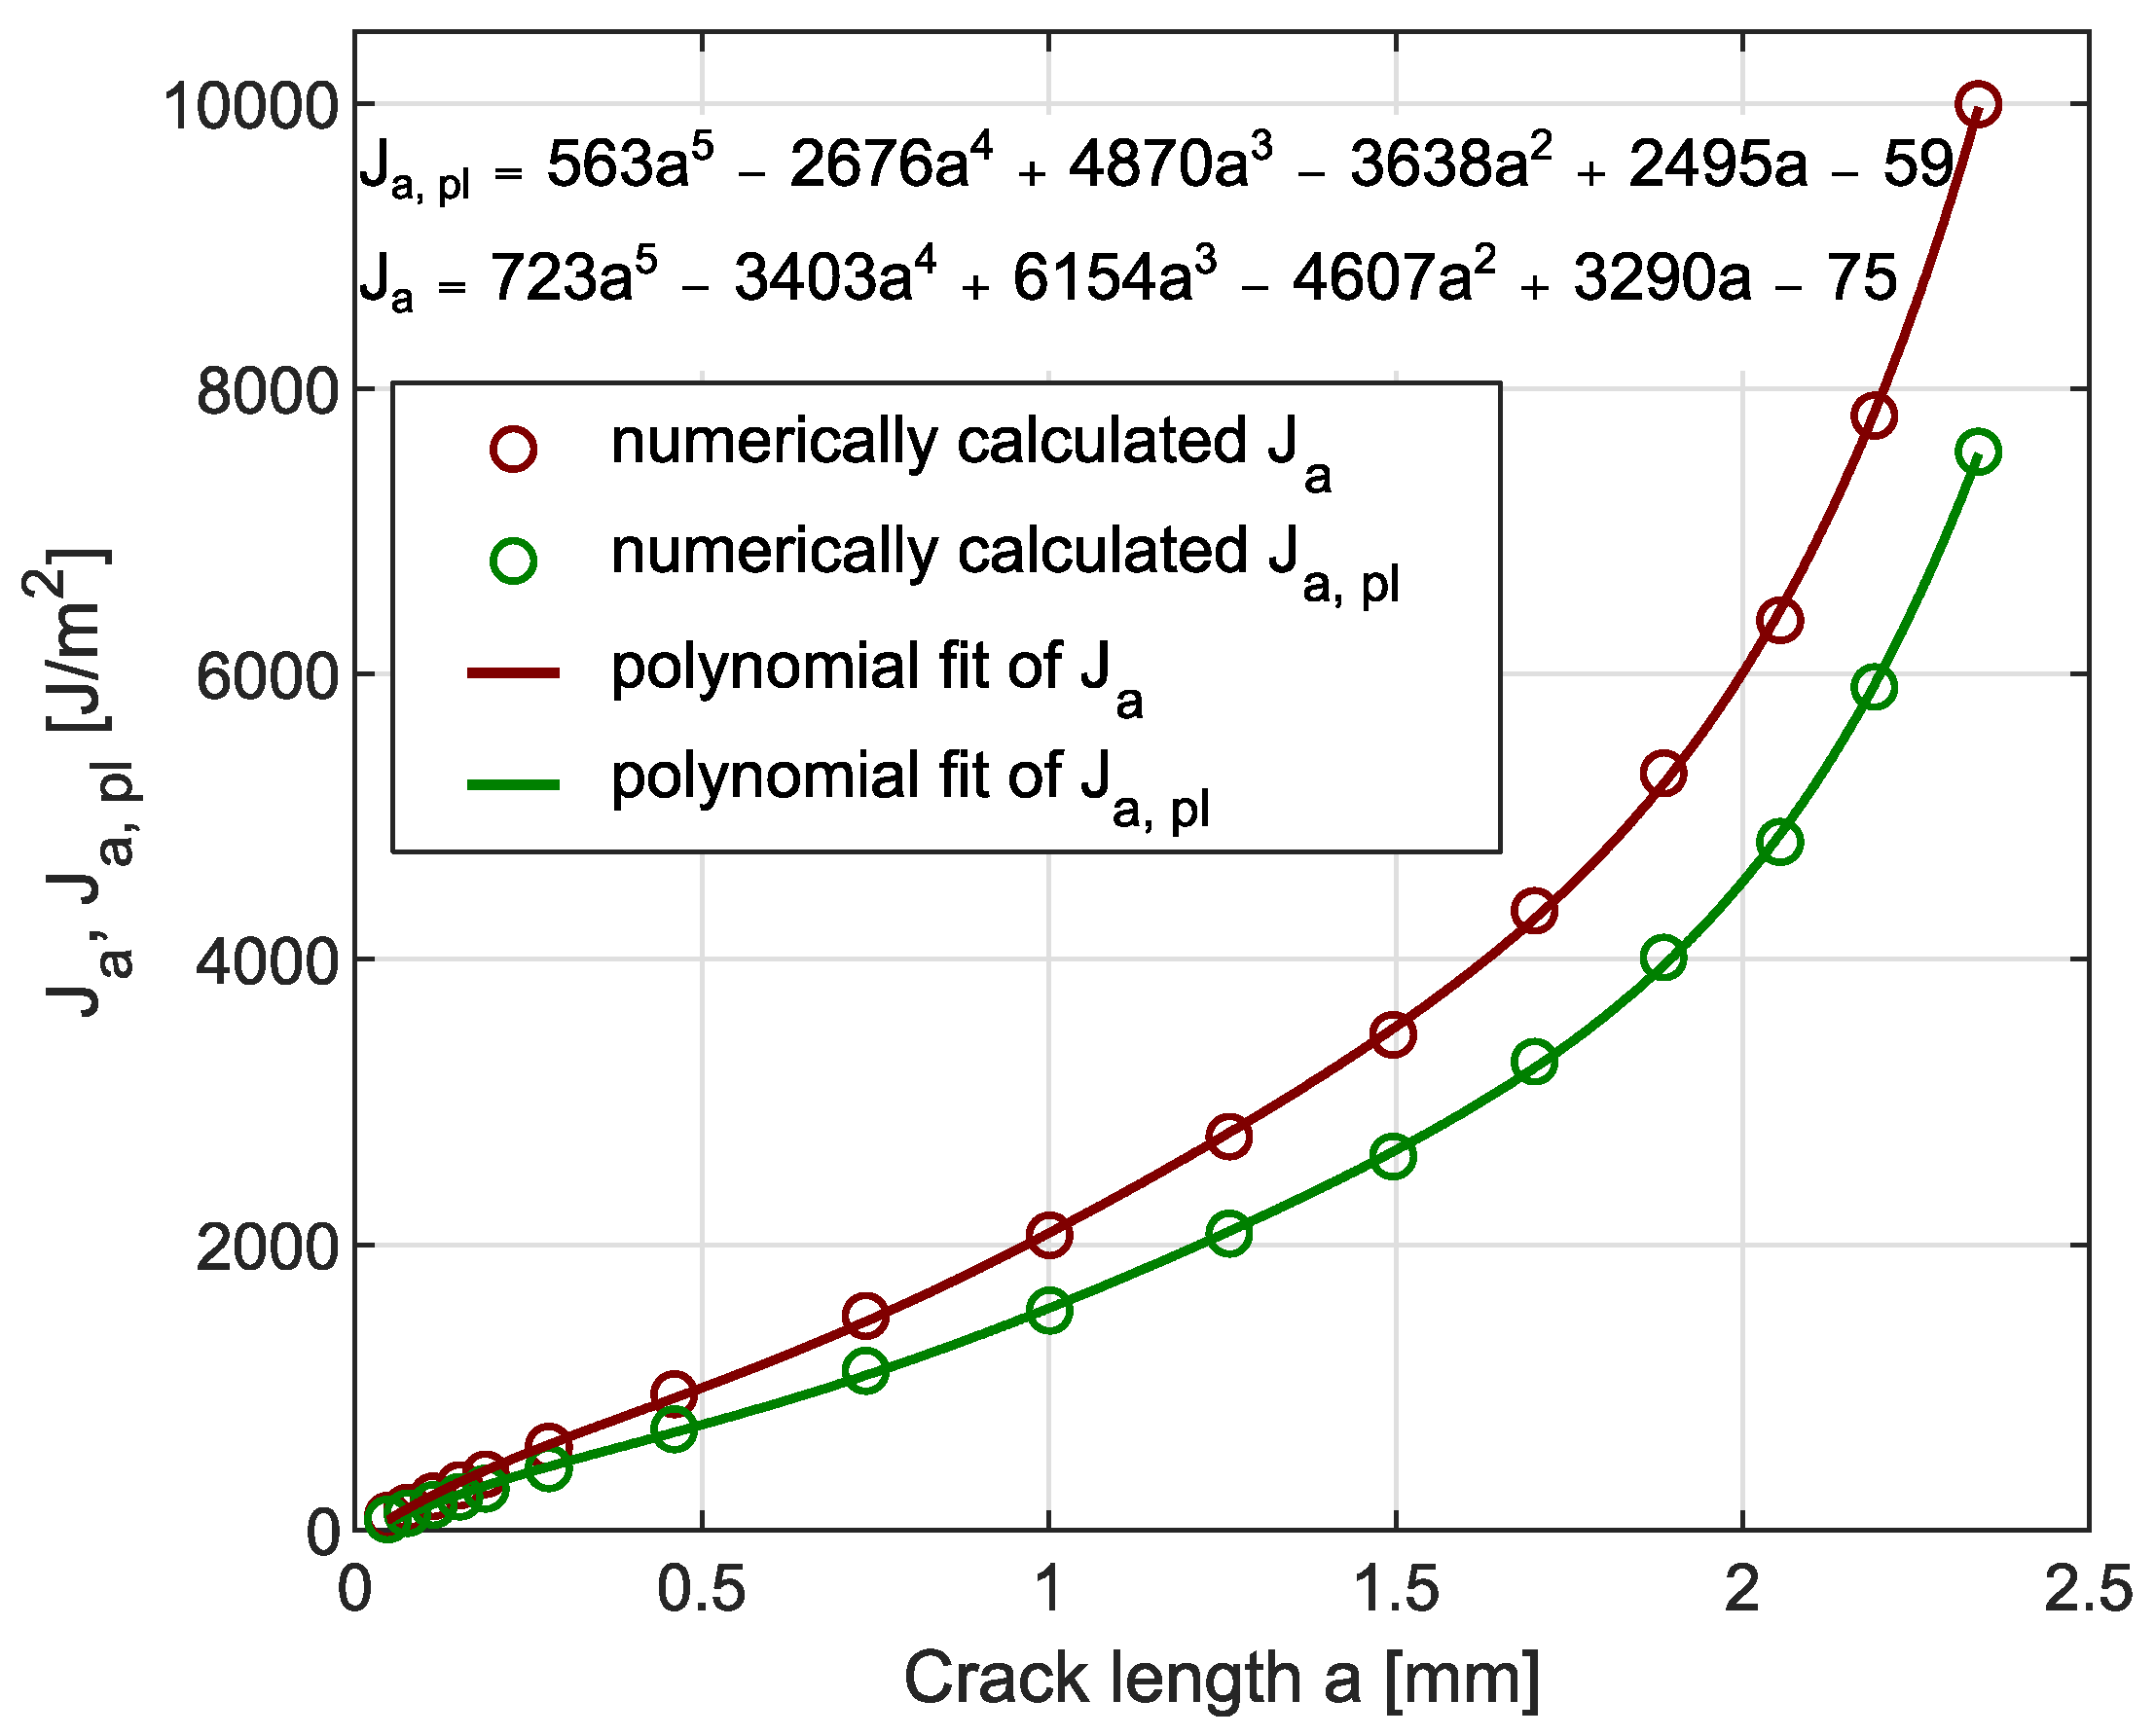
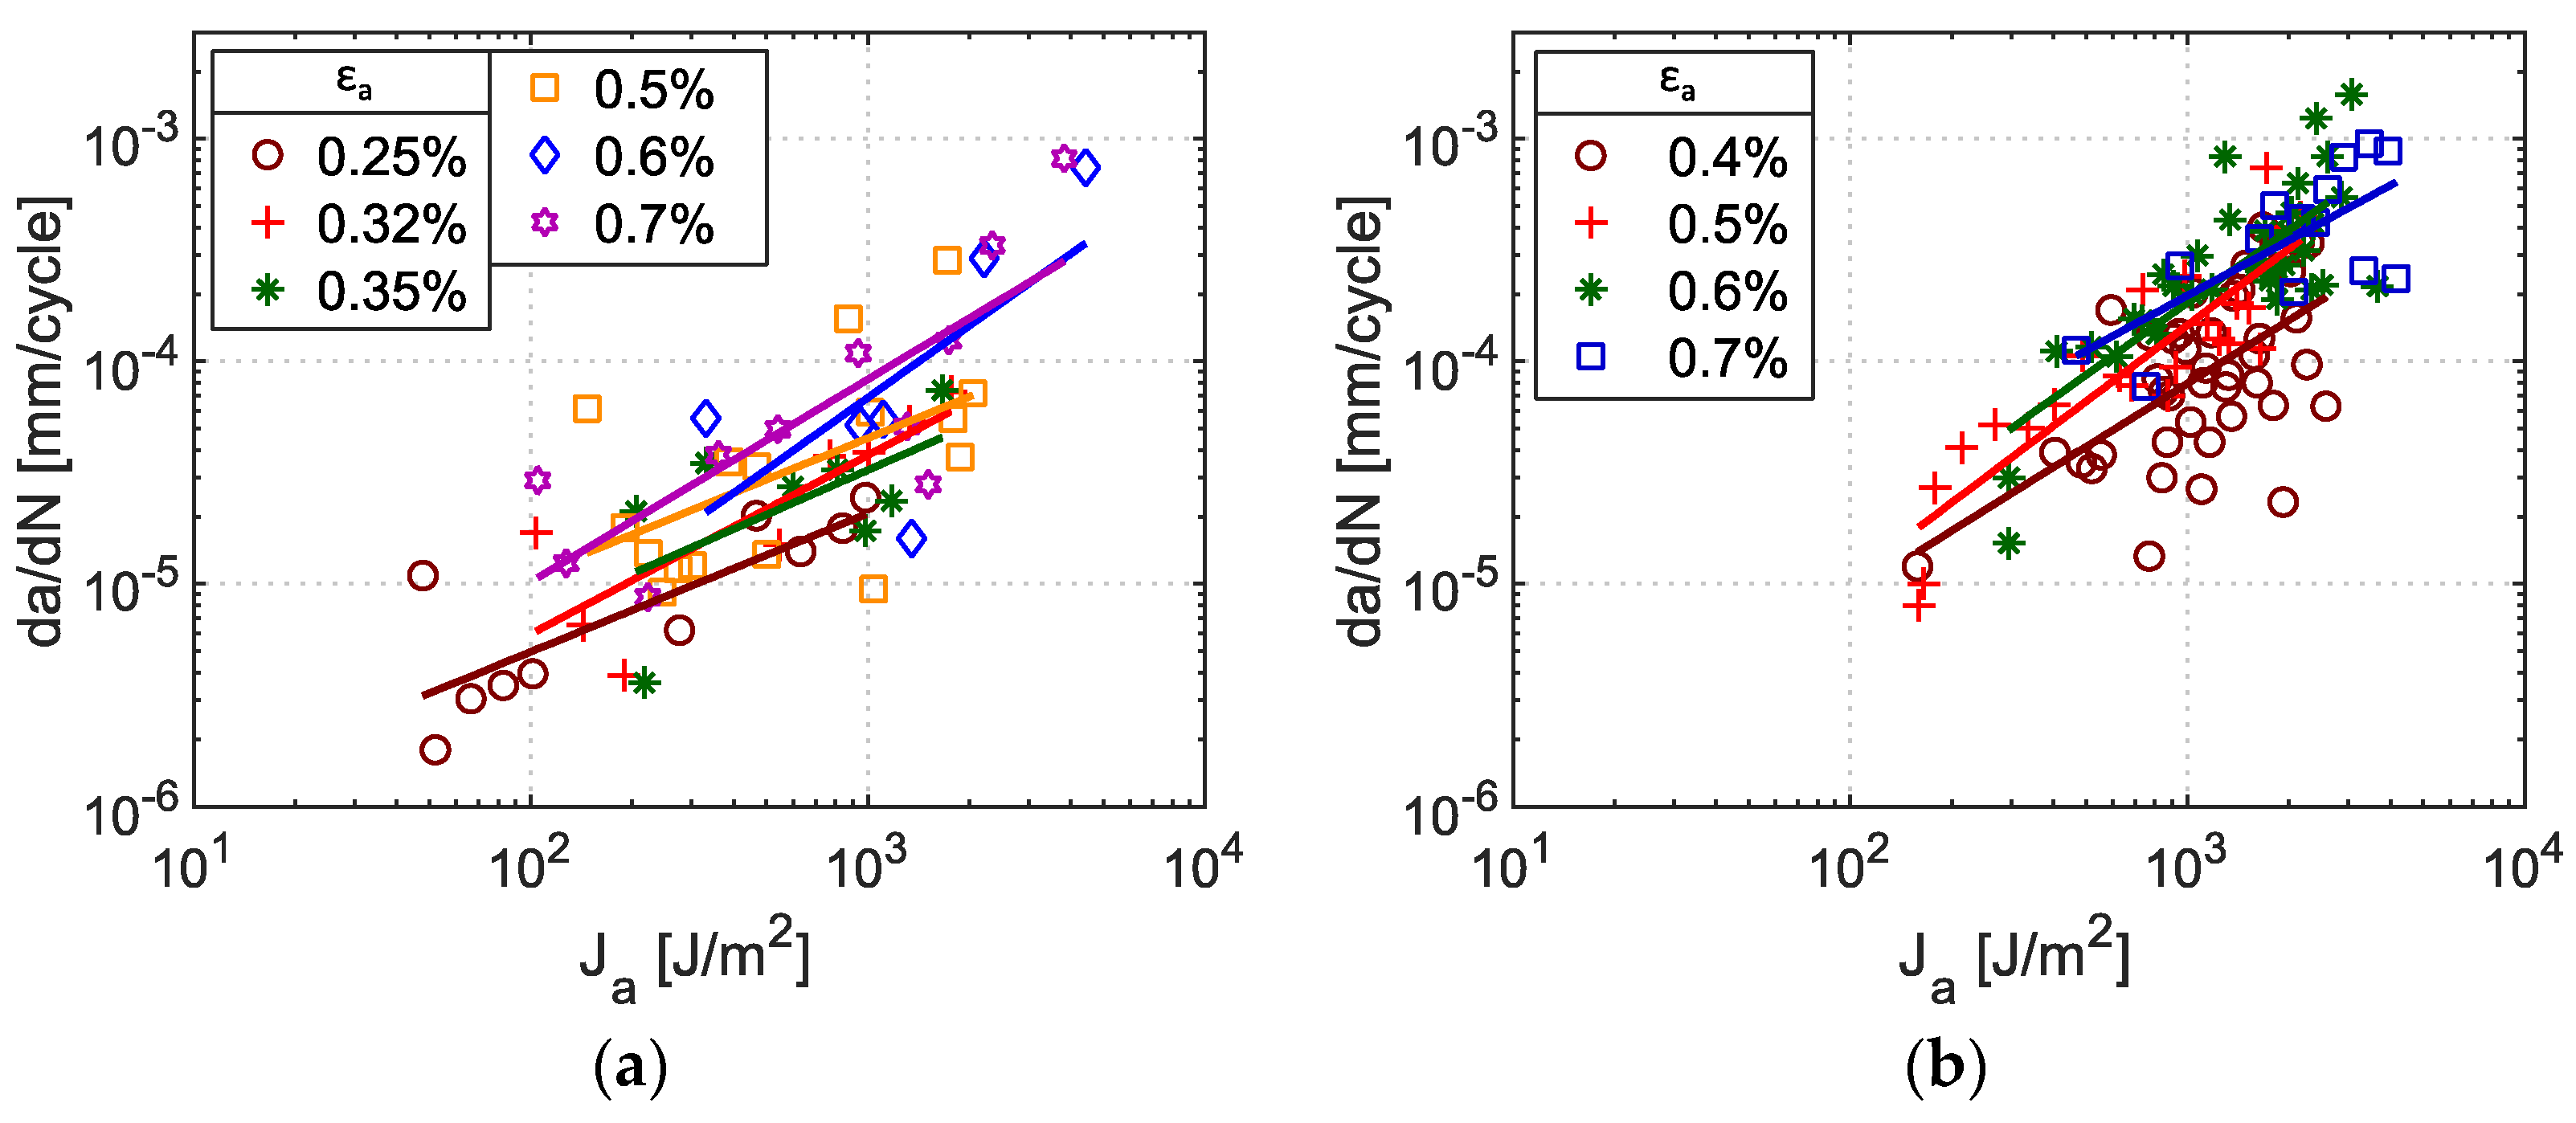
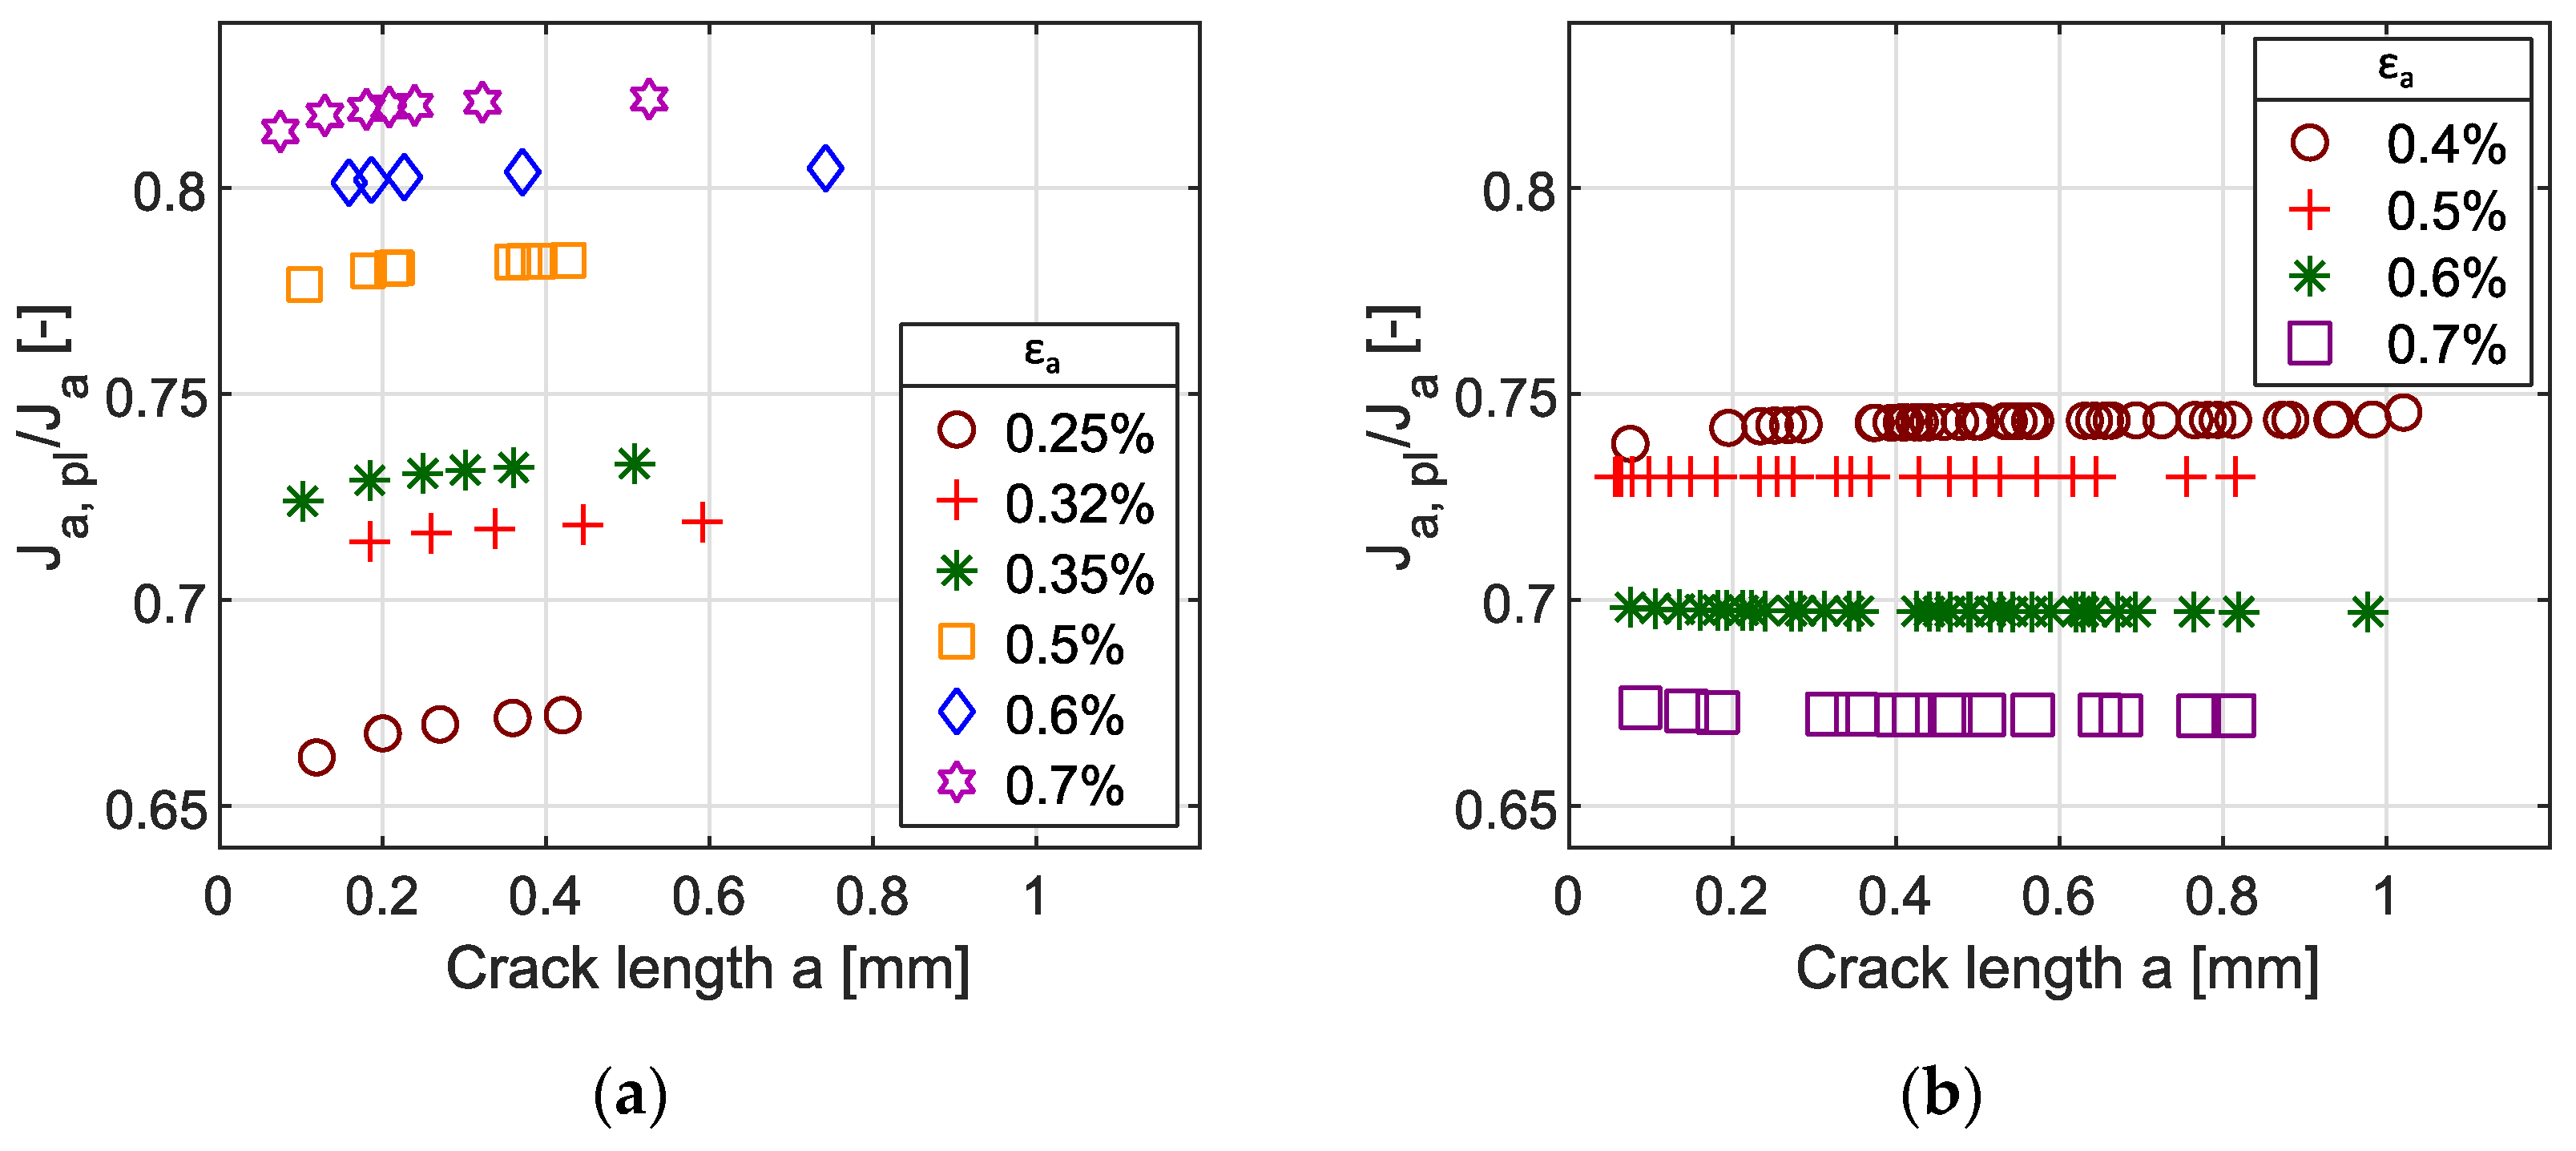
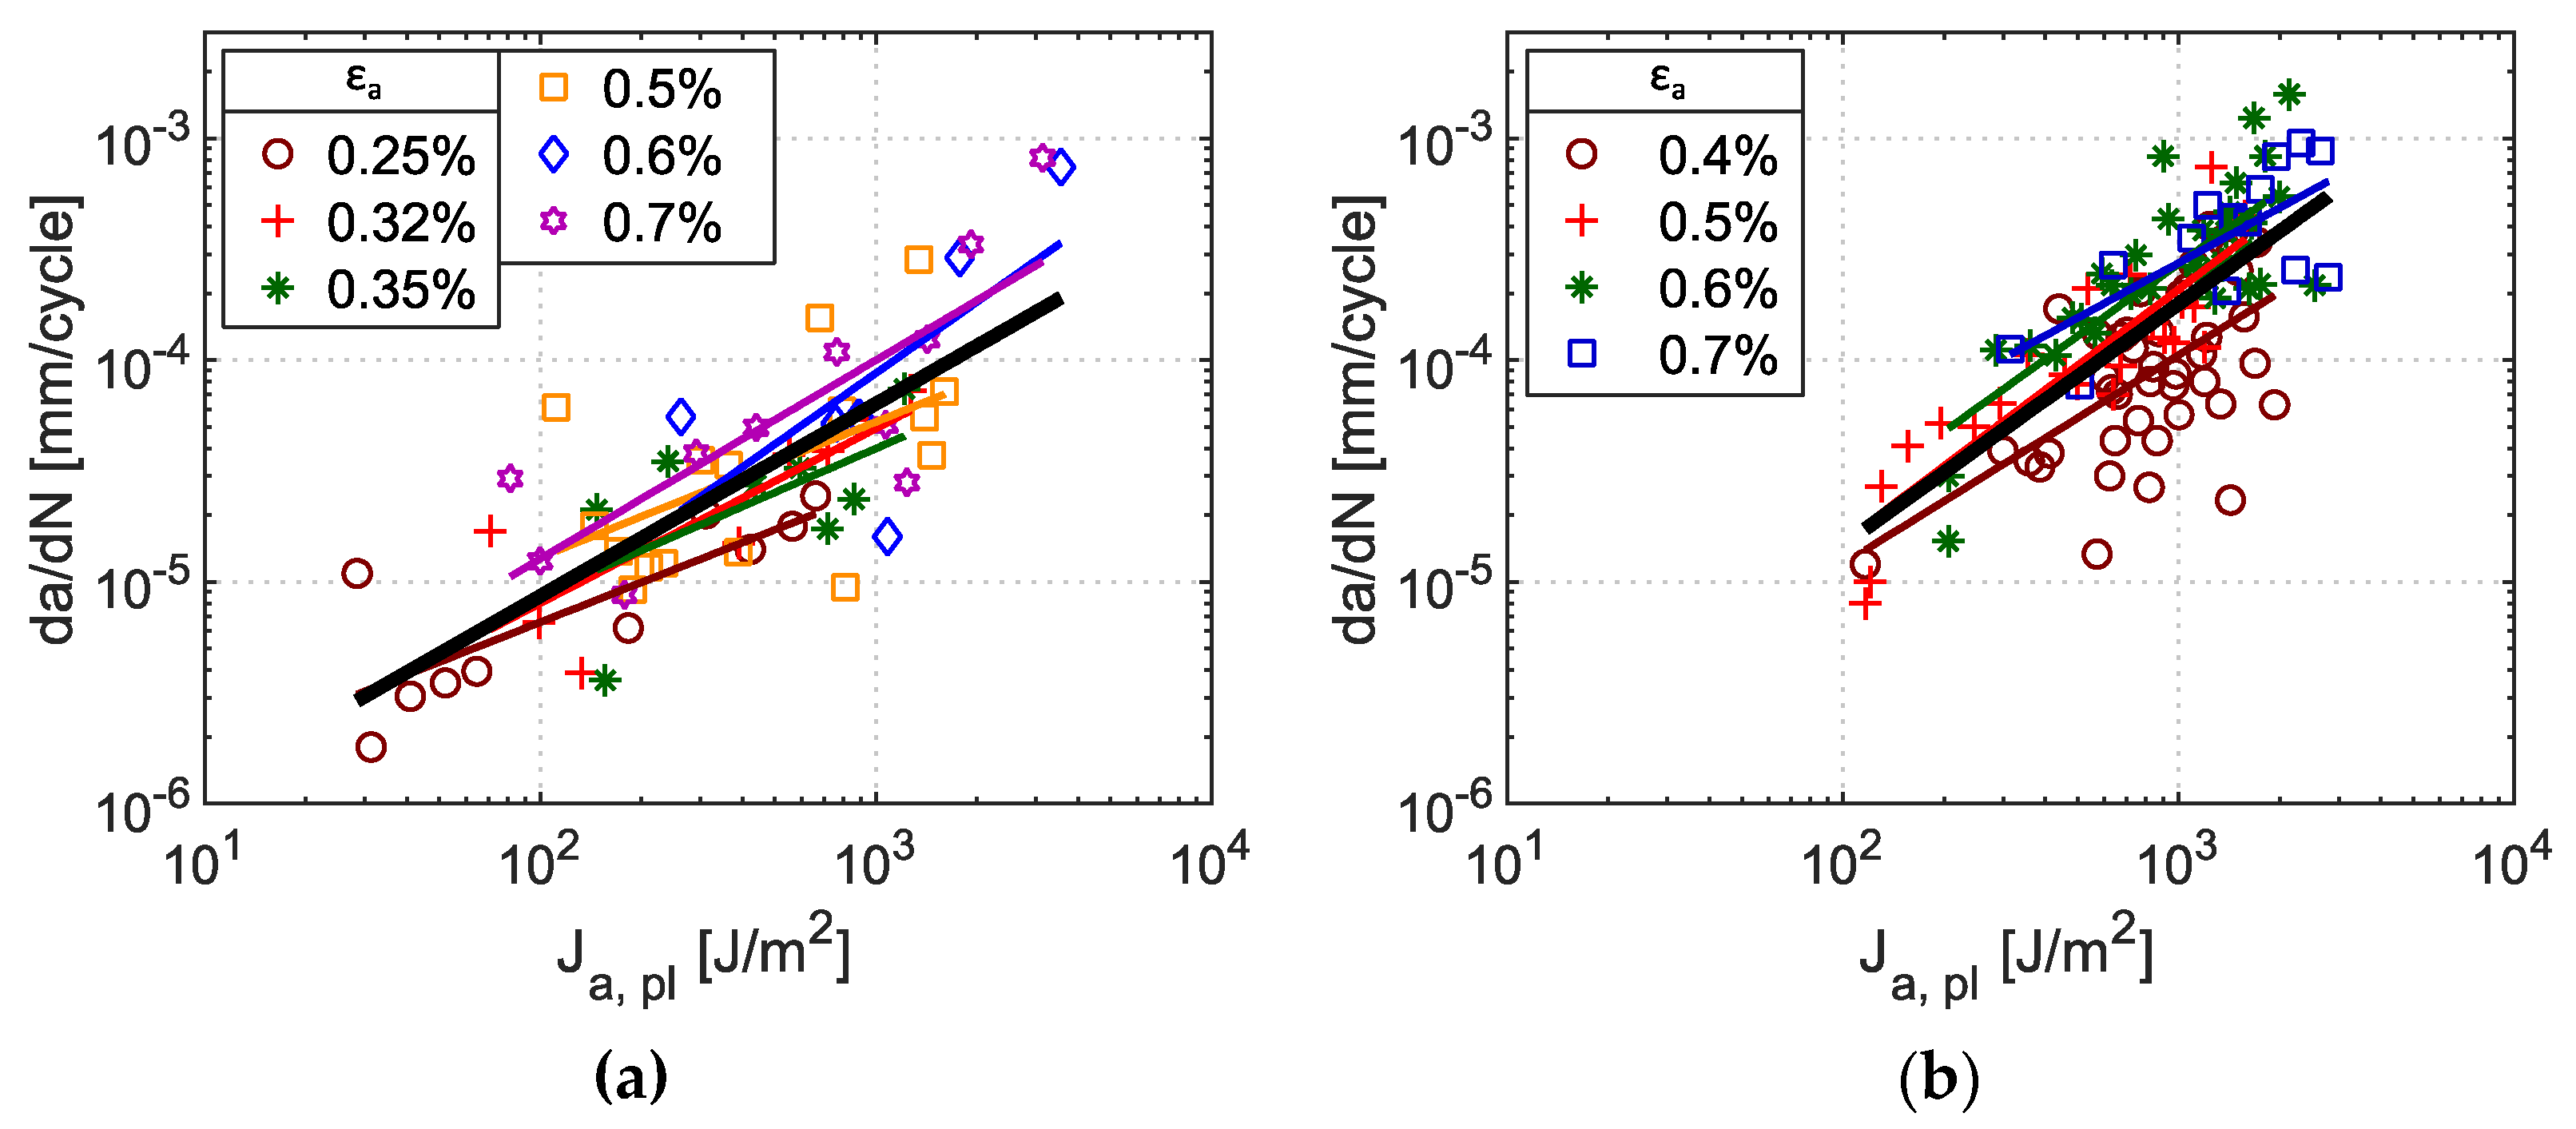
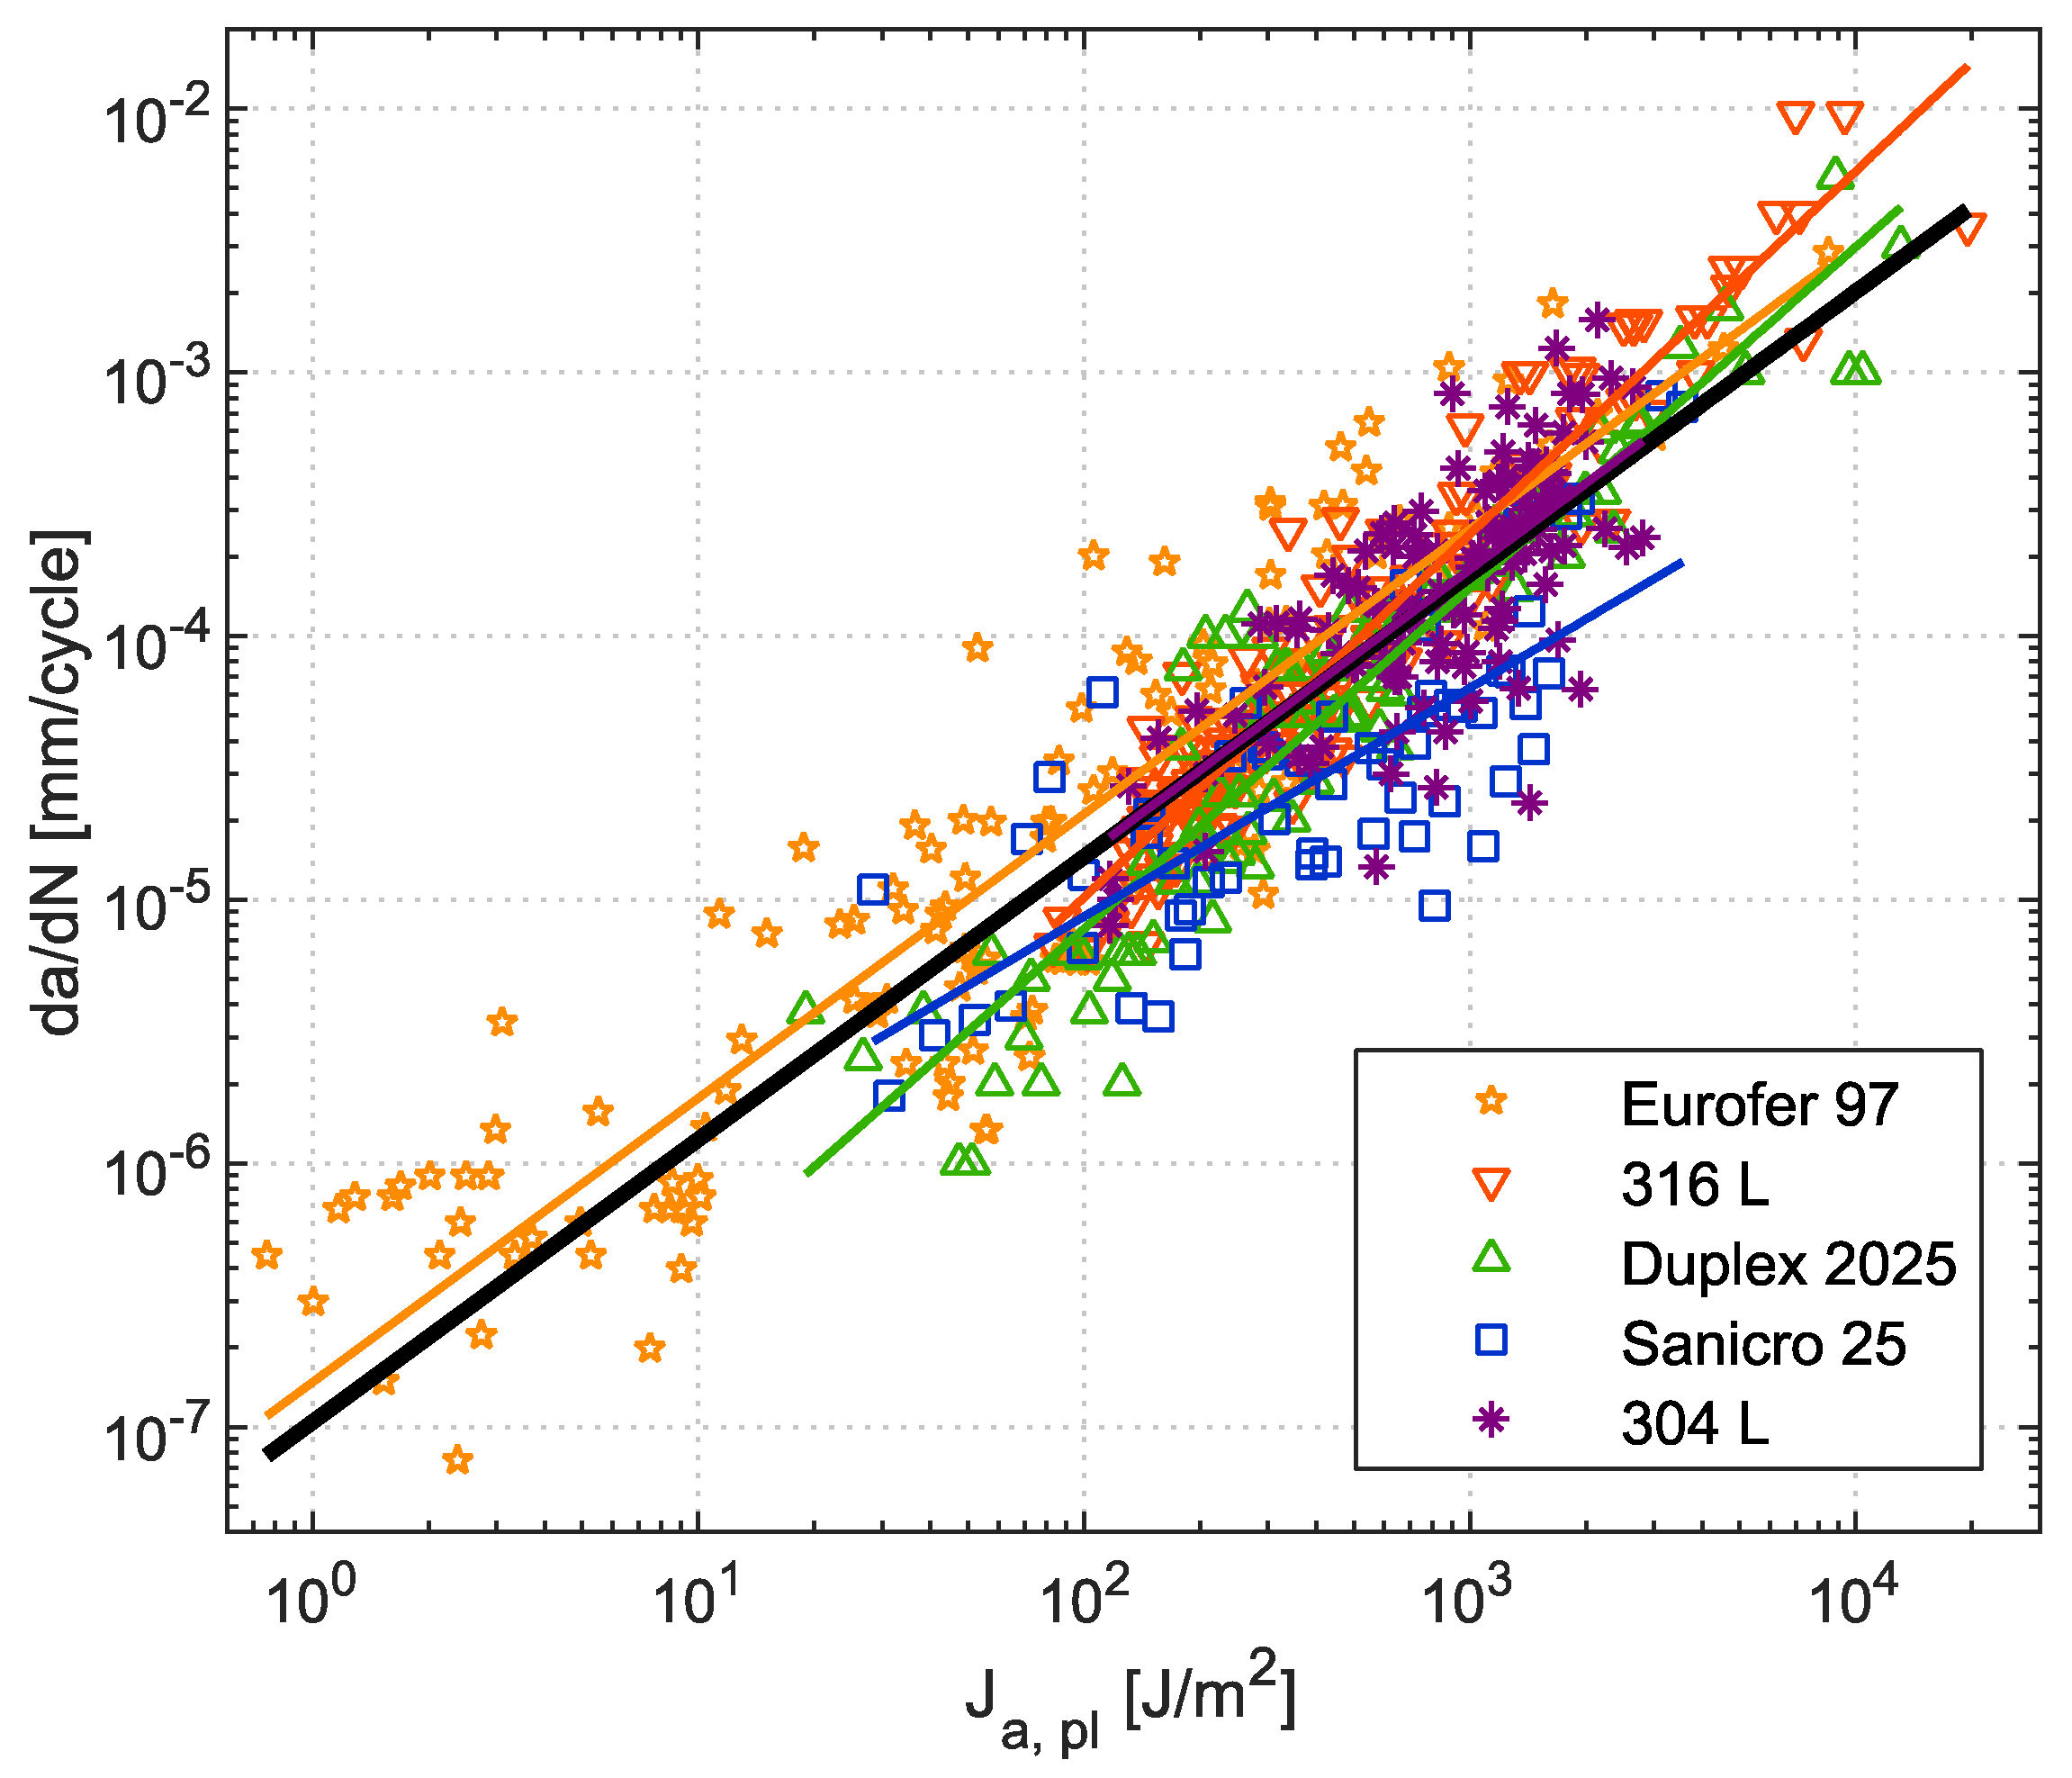
3.2. Description of Short Fatigue Crack Growth Rate Based on J-Integral

In order to describe short fatigue crack propagation rates, it is necessary to determine an appropriate fracture mechanics parameter. As was reported in [15,16], the stress intensity factor is not suitable due to violation of small-scale yielding conditions. Therefore, it is necessary to use elastic-plastic fracture mechanics parameter, such as J-integral [39].
The J-integral was proposed by Rice [40] as a parameter describing the intensity of elasto-plastic stress fields ahead of the crack tip. Rice explained the physical significance of J-integral as energy release rate and demonstrated the relationship of the stress intensity factor and J-integral. The J-integral is given by the sum of elastic and plastic part [41]. For the loading Mode I it can be expressed as:
J = J e l + J p l = K I 2 E * + J p l ,
where KI is the Mode I stress intensity factor, J is the J-integral and Jel and Jpl are its elastic and plastic part. The identity E* = E is valid for plane stress conditions and E* = E/(1 − ν2) for plain strain conditions.
For the J-integral calculation, the identical numerical model as described in Chapter 3.1 was used. Material properties were homogenous, isotropic and nonlinear, corresponding to the measured cyclic stress–strain curves, see Figure 3. The crack shapes were modeled according to the results of optimized crack front shape from Chapter 3.1. For every single crack configuration and applied strain amplitude the J-integral and the plastic part of J-integral were calculated. The resulted values were then fitted by a polynomial function presented in Figure 14. Using this function, it is possible to determine the J-integral values for previously measured cracks and, consequently, to describe the crack growth rates.
In Figure 15, the amplitude of J-integral is used for the description of short fatigue crack growth rates in both Sanicro 25 and 304L steels. The plots show a certain dependence on the applied total strain amplitude. Moreover, the data exhibit notable scatter given mainly by the coarse microstructure of both materials and the fact that Sanicro 25 was tested without FIB pre-cracks. Therefore, multiple short cracks initiated in the shallow notch area. In later stage of fatigue life, the crack coalescence appeared, as shown in Figure 4b, resulting in sudden increase of crack growth rate. In the case of cyclic testing of 304L with the FIB pre-crack, only one short fatigue crack initiated. Therefore, the crack coalescence effect on experimental data scatter is not present. However, the SIMT effectively retards the crack growth in suitably oriented grains with respect to the loading axis. Such a process leads to frequent drops of the crack growth rates notable in Figure 15b.
As was proposed previously [15,16,42], the plastic part of J-integral is more important than its elastic part in the case of large-scale yielding conditions. This statement is in accordance with Figure 16 where the fraction of plastic part of J-integral is plotted as the ratio of Ja,pl/Ja. The fraction increases with increasing total strain amplitude in the case of Sanicro 25 (see Figure 16a). However, the SIMT in front of the crack tip, typical for 304L and other metastable austenitic stainless steels, results in significant cyclic hardening. As a consequence, the elastic and plastic parts of the J-integral do not increase in the same rate with increasing total strain amplitude. Therefore, the ratio Ja,pl/Ja slightly decreases, as presented in Figure 16b. However, the plastic part of J-integral is dominant for all total strain amplitudes and therefore, it was used for the description of short fatigue crack growth as it has been recommended [15,16,28].
The results plotted in Figure 17 can be compared with previously published data of various steels [15,16,28]. These investigations were based on the short crack growth measurement carried out without the use of FIB pre-cracks. The specimen geometry was identical with the present study. The general dependence of short crack growth rate on plastic part of J-integral is plotted in Figure 18 for ferritic-martensitic Eurofer 97 steel, austenitic-ferritic duplex 2025 steel and austenitic steels 304L, 316L and Sanicro 25. All these data were fitted by one master curve. Furthermore, Figure 18 shows that the highest crack growth rate was found for 316 L steel, whereas the lowest rate has Sanicro 25 steel. This can be explained by microstructural aspects. Distinct zig-zag propagation of the short fatigue cracks preferentially retards fatigue crack growth rate (especially for very short cracks), see Figure 6. The effect of coarse microstructure in the case of 304L steel was partially reduced by a FIB pre-crack and experimental data fit well the resulting crack propagation rates of other steels. The results summarized in Figure 18 demonstrate similar behavior of the short fatigue cracks in all studied materials, regardless of distinct cyclic stress–strain responses summarized in Figure 19. It suggests that driving force for short crack growth is given mainly by the amount of plasticity at the crack tip, which corresponds well to the physical models.

3.3. Residual Fatigue Lifetime Estimation

In low cycle fatigue regime, the fatigue crack propagation rate can be described by the relation proposed by Hutař et al. [42]:
d a d N = C J p ( J a ,     p l ) m J p ,
where Ja,pl is the amplitude of plastic part of J-integral and CJp and mJp are material characteristics obtained by experimental measurements listed in Table 4 and Table 5. The mentioned importance of the effect of plasticity corresponds well with the Polák model [9]. The model suggests that the fatigue lifetime is controlled by the plastic strain amplitude upon constant total strain amplitude loading. Based on this fact, the following model of short fatigue crack propagation rate was proposed:
d a d N = k g a ,
where a is the crack length and kg is the crack growth coefficient corresponding to the relative increment of the crack length in one cycle. The coefficient kg mainly depends on the applied plastic strain amplitude using a power law:
k g = k g 0 ε a p d .
The parameters kg0 and d are material parameters listed in Table 4 and Table 5.
By integration of Equation (2), the number of cycles between two particular crack lengths can be estimated. In the case of this study, this interval was chosen as 0.1 mm to 0.5 mm, in order to compare the predicted number of cycles with experimental data. At first, the parameters of the Equation (2) were taken from the fit of single material (plotted in Figure 17) and then the calculation was performed again using the master curve for all tested materials (plotted in Figure 18). These two data sets are plotted in Figure 20 for both materials along with experimental data and data calculated from Polák model using Equation (3).
The results showed that the Polák model fits very well the experimental data for both materials. The advantage of this model is that it can be directly related to the Manson–Coffin law of a particular material and consequently with the lifetime of experimental specimens. The model is able to integrate various effects influencing crack propagation, such as microstructure, crack coalescence or zig-zag crack propagation. In contrast, the model of the crack propagation based on plastic part of the J-integral, describes the propagation of a single crack and it is based on stress field close to the crack front. The advantage of this model is that it can be easily applied to bodies with complex geometry containing a defect, better application to complex stress fields around a small crack (e.g., high stress and strain gradient) and the possibility of direct application to longer cracks. As can be seen in Figure 20, fatigue lives predicted using plastic part of J-integral as crack driving force are generally in agreement with experimental data, however, in the case of high total strain amplitudes, longer fatigue lives are predicted. This is the result of dependence of experimental data on the strain amplitude, as shown in Figure 17, which is possibly caused by multiple coalescence of several cracks and which affects the growth rates preferentially under high amplitude loading. Due to this effect, the numerically predicted lifetime curve has a different slope than the experimental data.
It is important to note that the master curve (fit of data for all tested steels, see Figure 18) was also able to give acceptable lifetime predictions. Fatigue lives of the 304L specimens were predicted very well using this general data, however in the case of Sanicro 25, the experimental data differ from the prediction. It is due to the shift of the Sanicro 25 crack propagation data to lower crack propagation rates (see Figure 18). The cause can be at least partially attributed to the combination of (i) the the zig-zag crack propagation due to strong planar character of cyclic plastic deformation and (ii) relatively coarse microstructure. This results in imperfectly perpendicular crack path with respect to the loading axis, as shown in Figure 4.
It is possible to conclude that even for materials with relatively coarse microstructure the fatigue life of the specimen can be predicted with sufficient accuracy using the presented simple methodologies based on continuum mechanics. It should be emphasized that the presented approaches were able to describe well the short crack growth rates in materials with a great variety of chemical composition, structural composition and completely different cyclic stress–strain response. The conveniently chosen approach lead to similar short crack propagation rates, which is given mainly by the amount of cyclic plastic deformation at the crack tip. Therefore, the “master curve” can be used to roughly predict the fatigue lifetime of bodies containing short cracks without the need of additional experimental data. It needs to be noted that this methodology is valid for the cracks exceeding the size of typical microstructural unit but smaller than 2 mm.

4. Conclusions

Two approaches for the description of short fatigue crack propagation under large-scale yielding conditions were tested. Namely, the use of plastic part of the J-integral and the Polák model of exponential crack length growth. Both approaches were checked how correctly the residual fatigue life of bodies with short initial cracks can be predicted. The studied materials Sanicro 25 steel and 304L steel had relatively coarse grains and very distinct cyclic stress–strain responses. The 304L steel exhibits very steep strain hardening for large strain amplitudes due to martensitic transformation. Despite the regime of short crack growth in coarse microstructure, the two continuum mechanics approaches were reasonably successful in description of the crack growth kinetics.
One of the advantages of the plastic part of J-integral is that it covers the effect of ratio of the plastic strain to the total strain, which is anomalously decreasing for larger total strain amplitudes in the 304L steel. Therefore, this ratio varied for the studied materials at different strain amplitudes, while the crack growth rate curves for both materials fell approximately to one curve, using the parameter Ja, pl for plotting of the crack growth rate results.
The values of Jpl were determined by 3D finite element modeling of the cracked specimens considering the cyclic stress–strain curves of the materials. The numerical model was also used for the simulation of the crack front shape evolution during crack growth. It helped to verify the relationship between the measured crack length at the specimen surface and the true in-depth crack length during the experiments. The resulting crack front shapes were in agreement with those measured post mortem at fracture surfaces.
According to the obtained da/dN-Jpl relationships for the materials as well as to the Polák model parameters (related to the Manson–Coffin law parameters), the residual fatigue life of individual specimens was calculated for the same initial short crack lengths. The results were in good agreement with the measured number of cycles to failure. It should be noted that such a result is not so self-evident, since each specimen was loaded by different strain amplitude, which may cause problems in some other approaches.
Additionally, the crack growth rate curves da/dN-Ja, pl for the two tested steels fell onto the same so-called “master curve”, which was previously measured for various other steels with different properties (such as 316L, Eurofer 97 and duplex 2025). This is a reasonable result, since the plastic part of the J-integral corresponds well to the physical mechanism of crack propagation given by cyclic plastic deformation in the crack tip area. It means that it is possible to use the “master curve” advantageously to predict roughly the fatigue life by considering the short crack propagation rates without necessity for any other experimental data.

Author Contributions

Conceptualization, M.Š., P.H. and L.T.; methodology, P.H.; software, L.T.; validation, P.H., T.V. and J.P.; formal analysis, M.Š. and P.H.; investigation, M.Š., P.H., L.T., I.K and V.M.; resources, M.Š. and P.H.; data curation L.T.; writing—original draft preparation, L.T., P.H., V.M. and I.K.; writing—review and editing, P.H., M.Š., J.P., V.M. and T.V.; visualization, L.T., M.Š., I.K. and V.M.; supervision, P.H. and J.P.; project administration, M.Š.; funding acquisition, M.Š. All authors have read and agreed to the published version of the manuscript.

Funding

This research was funded by the Czech Science Foundation by the project 19-25591Y.

Institutional Review Board Statement

Not applicable.

Informed Consent Statement

Not applicable.

Data Availability Statement

The data presented in this study are available on request from the corresponding author.

Acknowledgments

The authors are grateful for financial support of Czech Science Foundation by the project 19-25591Y. The research infrastructure CEITEC—Central European Institute of Technology were used during the research activities.

Conflicts of Interest

The authors declare that they have no conflict of interest.

References

  1. Lo, K.H.; Shek, C.H.; Lai, J.K.L. Recent developments in stainless steels. Mat. Sci. Eng. 2009, 65, 39–104. [Google Scholar] [CrossRef]
  2. Chai, G.; Forsberg, U. 12—Sanicro 25: An advanced high-strength, heat-resistant austenitic stainless steel. In Materials for Ultra-Supercritical and Advanced Ultra-Supercritical Power Plants, 1st ed.; Di Gianfrancesco, A., Ed.; Woodhead Publishing: Cambridge, UK, 2017; pp. 391–421. [Google Scholar]
  3. Suo, J.; Peng, Z.; Yang, H.; Chai, G.; Yu, M. Formation of Laves Phase in Sanicro 25 Austenitic Steel During Creep-Rupture Test at 700 °C. Met. Mic. and Anal. 2019, 8, 281–286. [Google Scholar] [CrossRef]
  4. Rautio, R.; Bruce, S. Alloy for ultrasupercritical coal fired boilers. Adv. Mater. Process. 2008, 166, 35–37. [Google Scholar]
  5. Krupp, U.; Alvarez-Armas, I. Short fatigue crack propagation during low-cycle, high cycle and very-high-cycle fatigue of duplex steel—An unified approach. Int. J. Fatigue 2014, 65, 78–85. [Google Scholar] [CrossRef]
  6. Tomkins, B. Fatigue crack propagation—an analysis. Philos. Mag. 1968, 18, 1041–1066. [Google Scholar] [CrossRef]
  7. Skelton, R. The prediction of crack growth rates from total endurance in high strain fatigue. Fat. Frac. Eng. Mat. Struct. 1979, 2, 305–318. [Google Scholar] [CrossRef]
  8. Skelton, R. The prediction of crack growth rates from total endurances in high strain fatigue-thirty years on. Fat. Frac. Eng. Mat. Struct. 2009, 32, 81–83. [Google Scholar] [CrossRef]
  9. Polák, J. Plastic strain-controlled short crack growth and fatigue life. Int. J. Fatique 2005, 27, 1192–1201. [Google Scholar] [CrossRef]
  10. Polák, J. Mechanisms and kinetics of the early fatigue damage in crystalline materials. Mat. Sci. Eng. 2007, 468–470, 33–39. [Google Scholar] [CrossRef]
  11. Beretta, S.; Foletti, S.; Patriarca, L. Discussion of models for LCF small crack growth. Proc. Eng. 2011, 10, 3642–3649. [Google Scholar] [CrossRef] [Green Version]
  12. Radaj, D.; Vormwald, M. Advanced Methods of Fatigue Assessment; Springer: Berlin/Heidelberg, Germany, 2013; pp. 101–265. [Google Scholar]
  13. Pippan, R.; Grosinger, W. Fatigue crack closure: From LCF to small scale yielding. Int. J. Fatique 2013, 46, 41–48. [Google Scholar] [CrossRef] [Green Version]
  14. Rabbolini, S.; Beretta, S.; Foletti, S. Fatigue crack growth in low cycle fatigue: An analysis of crack closure based on image correlation. Proc. Struc. Int. 2016, 1, 158–165. [Google Scholar] [CrossRef] [Green Version]
  15. Hutař, P.; Poduška, J.; Šmíd, M.; Kuběna, I.; Chlupová, A.; Náhlík, L.; Polák, J.; Kruml, T. Short fatigue crack behaviour under low cycle fatigue regime. Int. J. Fatique 2017, 103, 207–215. [Google Scholar] [CrossRef]
  16. Hutař, P.; Poduška, J.; Chlupová, A.; Šmíd, M.; Kruml, T.; Náhlík, L. Description of short fatigue crack propagation under low cycle fatigue regime. Proc. Struc. Int. 2016, 2, 3010–3017. [Google Scholar] [CrossRef] [Green Version]
  17. Mazánová, V.; Polák, J. Initiation and growth of short fatigue cracks in austenitic Sanicro 25 steel. Fat. Frac. Eng. Mat. Struct. 2018, 41, 1529–1545. [Google Scholar] [CrossRef]
  18. Polák, J.; Petráš, R.; Heczko, M.; Kuběna, I.; Kruml, T.; Chai, G. Low cycle fatigue behavior of Sanicro25 steel at room and at elevated temperature. Mat. Sci. Eng. 2014, 615, 175–182. [Google Scholar] [CrossRef]
  19. Li, Y. Fatigue Crack Initiation (in 304L steel): Influence of the Microstructure and Variable Amplitude Loading. Ph.D. Thesis, Ecole Centrale Paris, Paris, France, 2012. [Google Scholar]
  20. Yu, D.; An, K.; Chen, X.; Chen, X. Revealing the cyclic hardening mechanism of an austenitic stainless steel by real-time in situ neutron diffraction. Sci. Mat. 2014, 89, 45–48. [Google Scholar] [CrossRef]
  21. Obrtlík, K.; Polák, J. Fatigue growth of surface cracks in the elastic-plastic region. Fat. Frac. Eng. Mat. Struct. 1985, 8, 23–31. [Google Scholar] [CrossRef]
  22. Blochwitz, C.; Richter, R. Plastic strain amplitude dependent surface path of microstructurally short fatigue cracks in face-centred cubic metals. Mat. Sci. Eng. 1999, 267, 120–129. [Google Scholar] [CrossRef]
  23. Lindstedt, U.; Karlsson, B.; Nystr, M. Small fatigue cracks in an austenitic stainless steel. Fat. Frac. Eng. Mat. Struct. 2002, 21, 85–98. [Google Scholar] [CrossRef]
  24. Stolarz, J.; Baffie, N.; Magnin, T. Fatigue short crack behavior in metastable austenitic stainless steels with different grain sizes. Mat. Sci. Eng. 2001, 319–321, 521–526. [Google Scholar] [CrossRef]
  25. Roth, I.; Kübbeler, M.; Krupp, U.; Christ, H.-J.; Fritzen, C.-P. Crack initiation and short crack growth in metastable austenitic stainless steel in the high cycle fatigue regime. Proc. Eng. 2010, 2, 941–948. [Google Scholar] [CrossRef] [Green Version]
  26. Weidner, A.; Glage, A.; Biermann, H. In-situ characterization of the microstructure evolution during cyclic deformation of novel cast TRIP steel. Proc. Eng. 2010, 2, 1961–1971. [Google Scholar] [CrossRef] [Green Version]
  27. Roth, I.; Krupp, U.; Christ, H.-J.; Kübbeler, M.; Fritzen, C.-P. Deformation induced martensite formation in metastable austenitic steel during in situ fatigue loading in a scanning electron microscope. In Proceedings of the ESOMAT 2009—8th European Symposium on Martensitic Transformations, Prague, Czech Republic, 7 –11 September 2009; EDP Sciences: Les Ulis, France, 2009. [Google Scholar]
  28. Kruml, T.; Hutař, P.; Náhlík, L.; Seitl, S.; Polák, J. Fatigue cracks in Eurofer 97 steel: Part II. Comparison of small and long fatigue crack growth. J. Nucl. Mater. 2011, 412, 7–12. [Google Scholar] [CrossRef]
  29. Hartranft, R.J.; Sih, G.C. Stress singularity for a crack with an arbitrarily curved front. Eng. Fract. Mech. 1977, 9, 705–718. [Google Scholar] [CrossRef]
  30. Sih, G.C.; Lee, Y.D. Review of triaxial crack border stress and energy behavior. Theor. Appl. Fract. Mech. 1989, 12, 1–17. [Google Scholar] [CrossRef]
  31. Oplt, T.; Hutař, P.; Pokorný, P.; Náhlík, L.; Chlup, Z.; Berto, F. Effect of the free surface on the fatigue crack front curvature at high stress asymmetry. Int. J. Fatique 2019, 118, 249–261. [Google Scholar] [CrossRef]
  32. Dymáček, P.; Jarý, M.; Dobeš, F.; Kloc, L. Tensile and Creep Testing of Sanicro 25 Using Miniature Specimens. Materials 2018, 11, 142. [Google Scholar] [CrossRef] [PubMed] [Green Version]
  33. Benthem, J.P. State of stress at the vertex of a quarter-infinite crack in a half-space. Int. J. Solid. Struct. 1977, 13, 479–492. [Google Scholar] [CrossRef]
  34. Pook, L.P. Some implications of corner point singularities. Eng. Fract. Mech. 1994, 48, 367–378. [Google Scholar] [CrossRef]
  35. Carpinteri, A. Part-through cracks in round bars under cyclic combined axial and bending loading. Int. J. Fatique 1996, 18, 33–39. [Google Scholar] [CrossRef]
  36. Hutař, P.; Náhlík, L.; Knésl, Z. The effect of a free surface on fatigue crack behaviour. Int. J. Fatique. 2010, 32, 1265–1269. [Google Scholar] [CrossRef]
  37. Náhlík, L.; Pokorný, P.; Ševčík, M.; Fajkoš, R.; Matušek, P.; Hutař, P. Fatigue lifetime estimation of railway axles. Eng. Fail. Anal. 2017, 73, 139–157. [Google Scholar] [CrossRef]
  38. Suresh, S. Fatigue of Materials, 2nd ed.; Cambridge University Press: Cambridge, UK, 1998; pp. 541–544. [Google Scholar]
  39. Simha, N.; Fischer, F.; Shan, G.; Chen, C.; Kolednik, O. J-integral and crack driving force in elastic–plastic materials. J. Mech. Phys. Solids. 2008, 56, 2876–2895. [Google Scholar] [CrossRef]
  40. Rice, J. A Path Independent Integral and the Approximate Analysis of Strain Concentration by Notches and Cracks. J. Appl. Mech. 1968, 35, 379–386. [Google Scholar] [CrossRef] [Green Version]
  41. Anderson, T. Fracture mechanics: Fundamentals and applications, 3rd ed.; Taylor & Francis: Boca Raton, FL, USA, 2005; pp. 103–120. [Google Scholar]
  42. Hutař, P.; Kuběna, I.; Ševčík, M.; Šmíd, M.; Kruml, T.; Náhlík, L. Small fatigue crack propagation in Y2O3 strengthened steels. J. Nucl. Mater. 2014, 452, 370–377. [Google Scholar] [CrossRef]
Figure 1. Backscattered electron image of initial microstructure: (a) Sanicro 25, (b) 304L.
Metals 11 00475 g001
Figure 2. Overview of the specimen geometry: (a) The specimen with a shallow notch in the middle of the gauge length. (b) The gauge length segment of the finite element model used for the estimation of theoretical stress concentration factor of the notch (Y axis is the loading direction). Stress distribution under monotonic loading.
Metals 11 00475 g002
Figure 3. Experimentally measured and numerically modeled cyclic stress–strain curves.
Metals 11 00475 g003
Figure 4. Crack growth at the surface of Sanicro 25 cycled at εa = 2.5 × 10⁻³. Crack propagation is shown in two stages of cycling: (a) at N = 25,000 cycles where A, B, C depicts independently initiated cracks; (b) Nf = 37,500 cycles where underwent coalescence of cracks is evident. The estimation of projected surface crack length is outlined.
Metals 11 00475 g004
Figure 5. Crack growth at the surface of 304L cycled at εa = 4 × 10⁻³. Crack propagation is shown in two stages of cycling: (a) at NP1 = 12,000 cycles and (b) at NP2 = 15,100 cycles.
Metals 11 00475 g005
Figure 6. Detail of the crack tip vicinity: (a) Sanicro 25—distinct planar character of cyclic plastic deformation; (b) 304L—slip plane markings accompanied with significant surface roughness indicating the occurrence of the strain-induced martensitic transformation (SIMT) within crack plastic zone.
Metals 11 00475 g006
Figure 7. Finite element model used for the optimization of the fatigue crack front shape.
Metals 11 00475 g007
Figure 8. Scheme of the procedure describing numerical estimation of the real crack front shape.
Metals 11 00475 g008
Figure 9. Scheme of procedure describing the numerical estimation of the real crack front shape.
Metals 11 00475 g009
Figure 10. Change of elastoplastic J-integral for selected crack lengths in 304L in the case of cyclic test with total strain amplitude εa = 0.4%.
Metals 11 00475 g010
Figure 11. Ratio of the semi-axes of semi-elliptical crack a/b vs. crack length a.
Metals 11 00475 g011
Figure 12. Fracture surface of Sanicro 25 cycled at εa = 0.7%. Three developed cracks are denoted by numbers 1, 2 and 3. Cracks 1 and 3 were used for the comparison of numerically predicted crack front shapes with real crack front shapes, shown in the insets.
Metals 11 00475 g012
Figure 13. Fracture surface of 304L cycled at εa = 0.4%. Two developed cracks are notable and denoted by numbers 4 and 5. The shapes of both cracks 4 and 5 were used for comparison with numerically predicted crack front shapes.
Metals 11 00475 g013
Figure 14. Amplitude of J-integral and amplitude of plastic part of J-integral vs. crack length a for 304L in the case of cyclic test at total strain amplitude εa = 0.4%. The data is fitted by the polynomial function, which can be used for the calculation of J-integral (or the plastic part of J-integral) for any particular crack length within the interval from 0.1–2.4 mm.
Metals 11 00475 g014
Figure 15. Short crack growth rate vs. J-integral amplitude under cycling with total strain amplitudes εa: (a) Sanicro 25, εa = 0.25%–0.7%, (b) 304L, εa = 0.4%–0.7%.
Metals 11 00475 g015
Figure 16. Ratio between plastic part of J-integral and J-integral vs. crack length in (a) Sanicro 25 and (b) 304L.
Metals 11 00475 g016
Figure 17. Short crack growth rate vs. plastic part of J-integral amplitude under cycling with total strain amplitude εa; (a) Sanicro 25, εa = 0.25–0.7%, (b) 304L, εa = 0.4–0.7%. All data points are fitted by a black curve.
Metals 11 00475 g017
Figure 18. Comparison of the short crack growth rate vs. Ja, pl of Sanicro 25 and 304L steels with previously published data of Eurofer 97 steel [28], 316L steel [16] and duplex 2025 steel [15]. Experimental data of each material include all tested amplitudes merged together. These particular datasets were fitted by the master curve.
Metals 11 00475 g018
Figure 19. Comparison of experimentally measured and numerically modeled cyclic stress–strain curves of selected materials.
Metals 11 00475 g019
Figure 20. Total strain amplitude εa vs. number of cycles required for the crack growth from the length of 0.1 mm to 0.5 mm in (a) Sanicro 25, (b) 304L.
Metals 11 00475 g020
Table 1. The chemical composition of Sanicro 25 in wt % provided by producer.
CCrNiWCoCuMnNbNSiFe
0.122.5253.61.530.50.50.230.2Bal.
Table 2. The chemical composition of 304L in wt.% provided by producer.
CCrNiMnSPSiFe
0.02318.128.181.790.0030.040.17Bal.
Table 4. Parameters for Hutař model for every tested strain amplitude.
Sanicro 25
εa (%)0.250.320.350.50.60.7
mJp0.600.790.660.611.070.90
CJp4.23 × 10−72.13 × 10⁻⁷ 4.22 × 10⁻⁷ 7.72 × 10⁻⁷ 0.65 × 10⁻⁷ 2.06 × 10⁻⁷
304L
εa (%)0.40.50.60.7
mJp0.941.141.080.82
CJp1.57 × 10−7 0.79 × 10⁻⁷ 1.54 × 10⁻⁷ 9.23 × 10⁻⁷
Table 5. Material parameters for both Hutař and Polák models.
CJpmJpkg0d
Sanicro 251.59 × 10−70.8670.5441.393
304L9.78 × 10−81.08741912.8
Master Curve1.05 × 10−71.072
Publisher’s Note: MDPI stays neutral with regard to jurisdictional claims in published maps and institutional affiliations.

