
Thermodynamic Modeling of the Al–Co–Pd Ternary System, Aluminum Rich Corner


1
Institute of Materials Research, Slovak Academy of Sciences, Watsonova 47, 040 01 Košice, Slovakia
2
Institute of Physics of Materials, Academy of Sciences of the Czech Republic, Žižkova 22, 616 62 Brno, Czech Republic
*
Author to whom correspondence should be addressed.
Metals 2021, 11(11), 1803; https://doi.org/10.3390/met11111803
Submission received: 6 October 2021
/
Revised: 5 November 2021
/
Accepted: 7 November 2021
/
Published: 9 November 2021
(This article belongs to the Special Issue Progress of Computational Metal Science and Technology)
Abstract
:The aluminum-rich corner of the Al–Co–Pd ternary system was thermodynamically modeled by the CALPHAD method in the present study. The ternary system is a complex system with many ternary phases (W, V, F, U, Y2, C2). All ternary phases, except phase U, were modeled as stoichiometric compounds. The order–disorder model was used to describe the BCC–B2 and BCC-A2 phases. Solubility of the third element in binary intermetallic phases (Al5Co2, Al3Co, Al9Co2, Al13Co4, Al3Pd and Al3Pd2) was modeled. The experimental results collected from the literature were used in the optimization of the thermodynamic parameters. A good agreement between the experimental results and the calculations was achieved.
1. Introduction
Thermodynamic assessment for the Al–Co–Pd ternary system has not yet been published. However, the system is of interest for the possible use of the Al–Pd based materials, for example, for catalysts [1] or as coatings with good oxidation resistance, low adhesion and high hardness [2,3,4] and also in electronics as semiconductors [5,6]. In addition, the system is also interesting from a scientific point of view because it contains a large number of complicated intermetallics, quasicrystals and quasi-crystalline approximants [7,8].
The ternary system was experimentally studied by several authors in papers [7,8,9,10,11,12,13,14,15]. The main interest was given especially to the aluminum-rich region. Very comprehensive experimental information of the phase diagram was given by Yurechko et al. [10]. They published isothermal sections at 1323, 1273, 1213 and 1063 K for 50–100 at.% Al. Černičková et al. studied the evolution of phases in several Al–Pd–Co alloys after long-term annealing [12] and during continuous cooling [13]. Černičková et al. also focused on the homogeneity range of ε, U and F phases at 1123 K in the study [14]. Recently, a part of the isothermal section of the system at 1293 K was published by Ďuriška in the paper [15]. The mentioned authors [8,9,10,11,12,13,14,15] observed six equilibrium ternary phases (W, V, F, U, Y, C2) and structurally complex ε-family phases in the ternary system.
The present work is focused on the modeling of the Al–Co–Pd ternary system in an Al-rich corner by the Calphad method using experimental results collected from the literature.
2. Binary Subsystems and Al-Rich Corner of the Ternary System
2.1. Al–Co
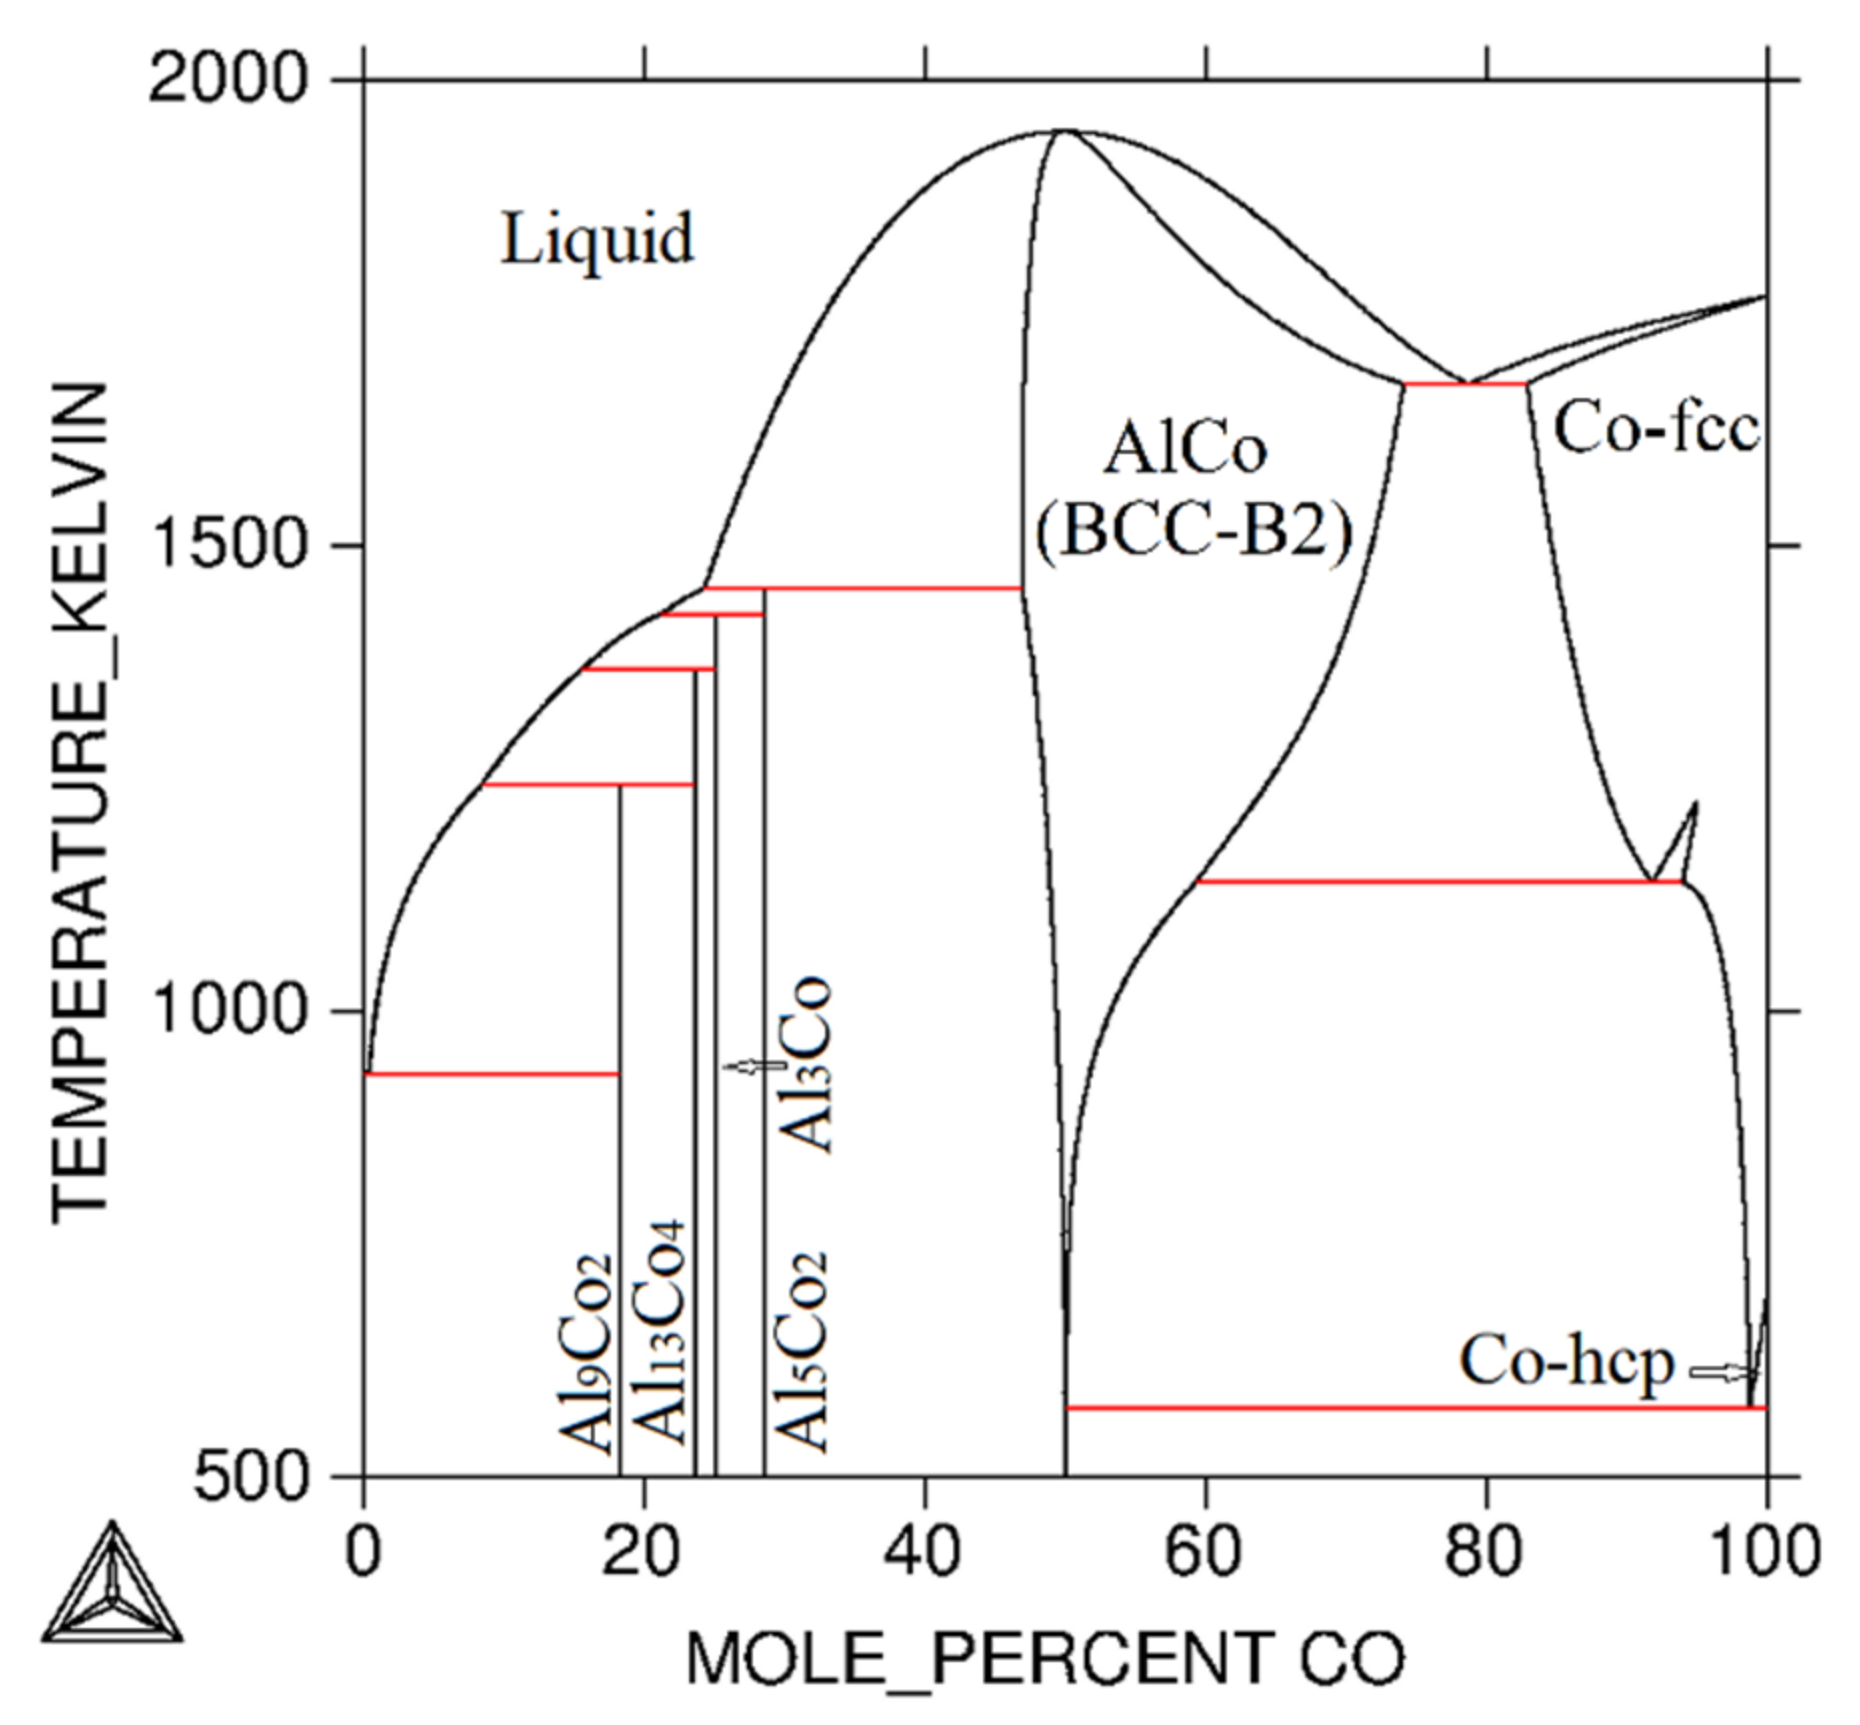
The Al–Co binary subsystem contains liquid, Co-hcp and FCC-solid solutions, ordered AlCo-B2 (BCC-B2) phase with a wide homogeneity range and asymmetric shape, and several intermetallic phases Al5Co2, Al3Co, Al9Co2 and Al13Co4. The last mentioned intermetallic phase (Al13Co4) represents three compositionally closely related phases M-Al13Co4, O-Al13Co4 and Y-Al13Co4. The calculated phase diagram of the binary system is shown in Figure 1. For the calculation, thermodynamic data from [16] were used. Based on the study [16], all types of Al13Co4 intermetallic phases are modeled as one stoichiometric Al13Co4 phase. The AlCo-B2 phase is described by the order–disorder model. BCC-A2 phase is an unstable disordered phase in the Al–Co system.
2.2. Co–Pd
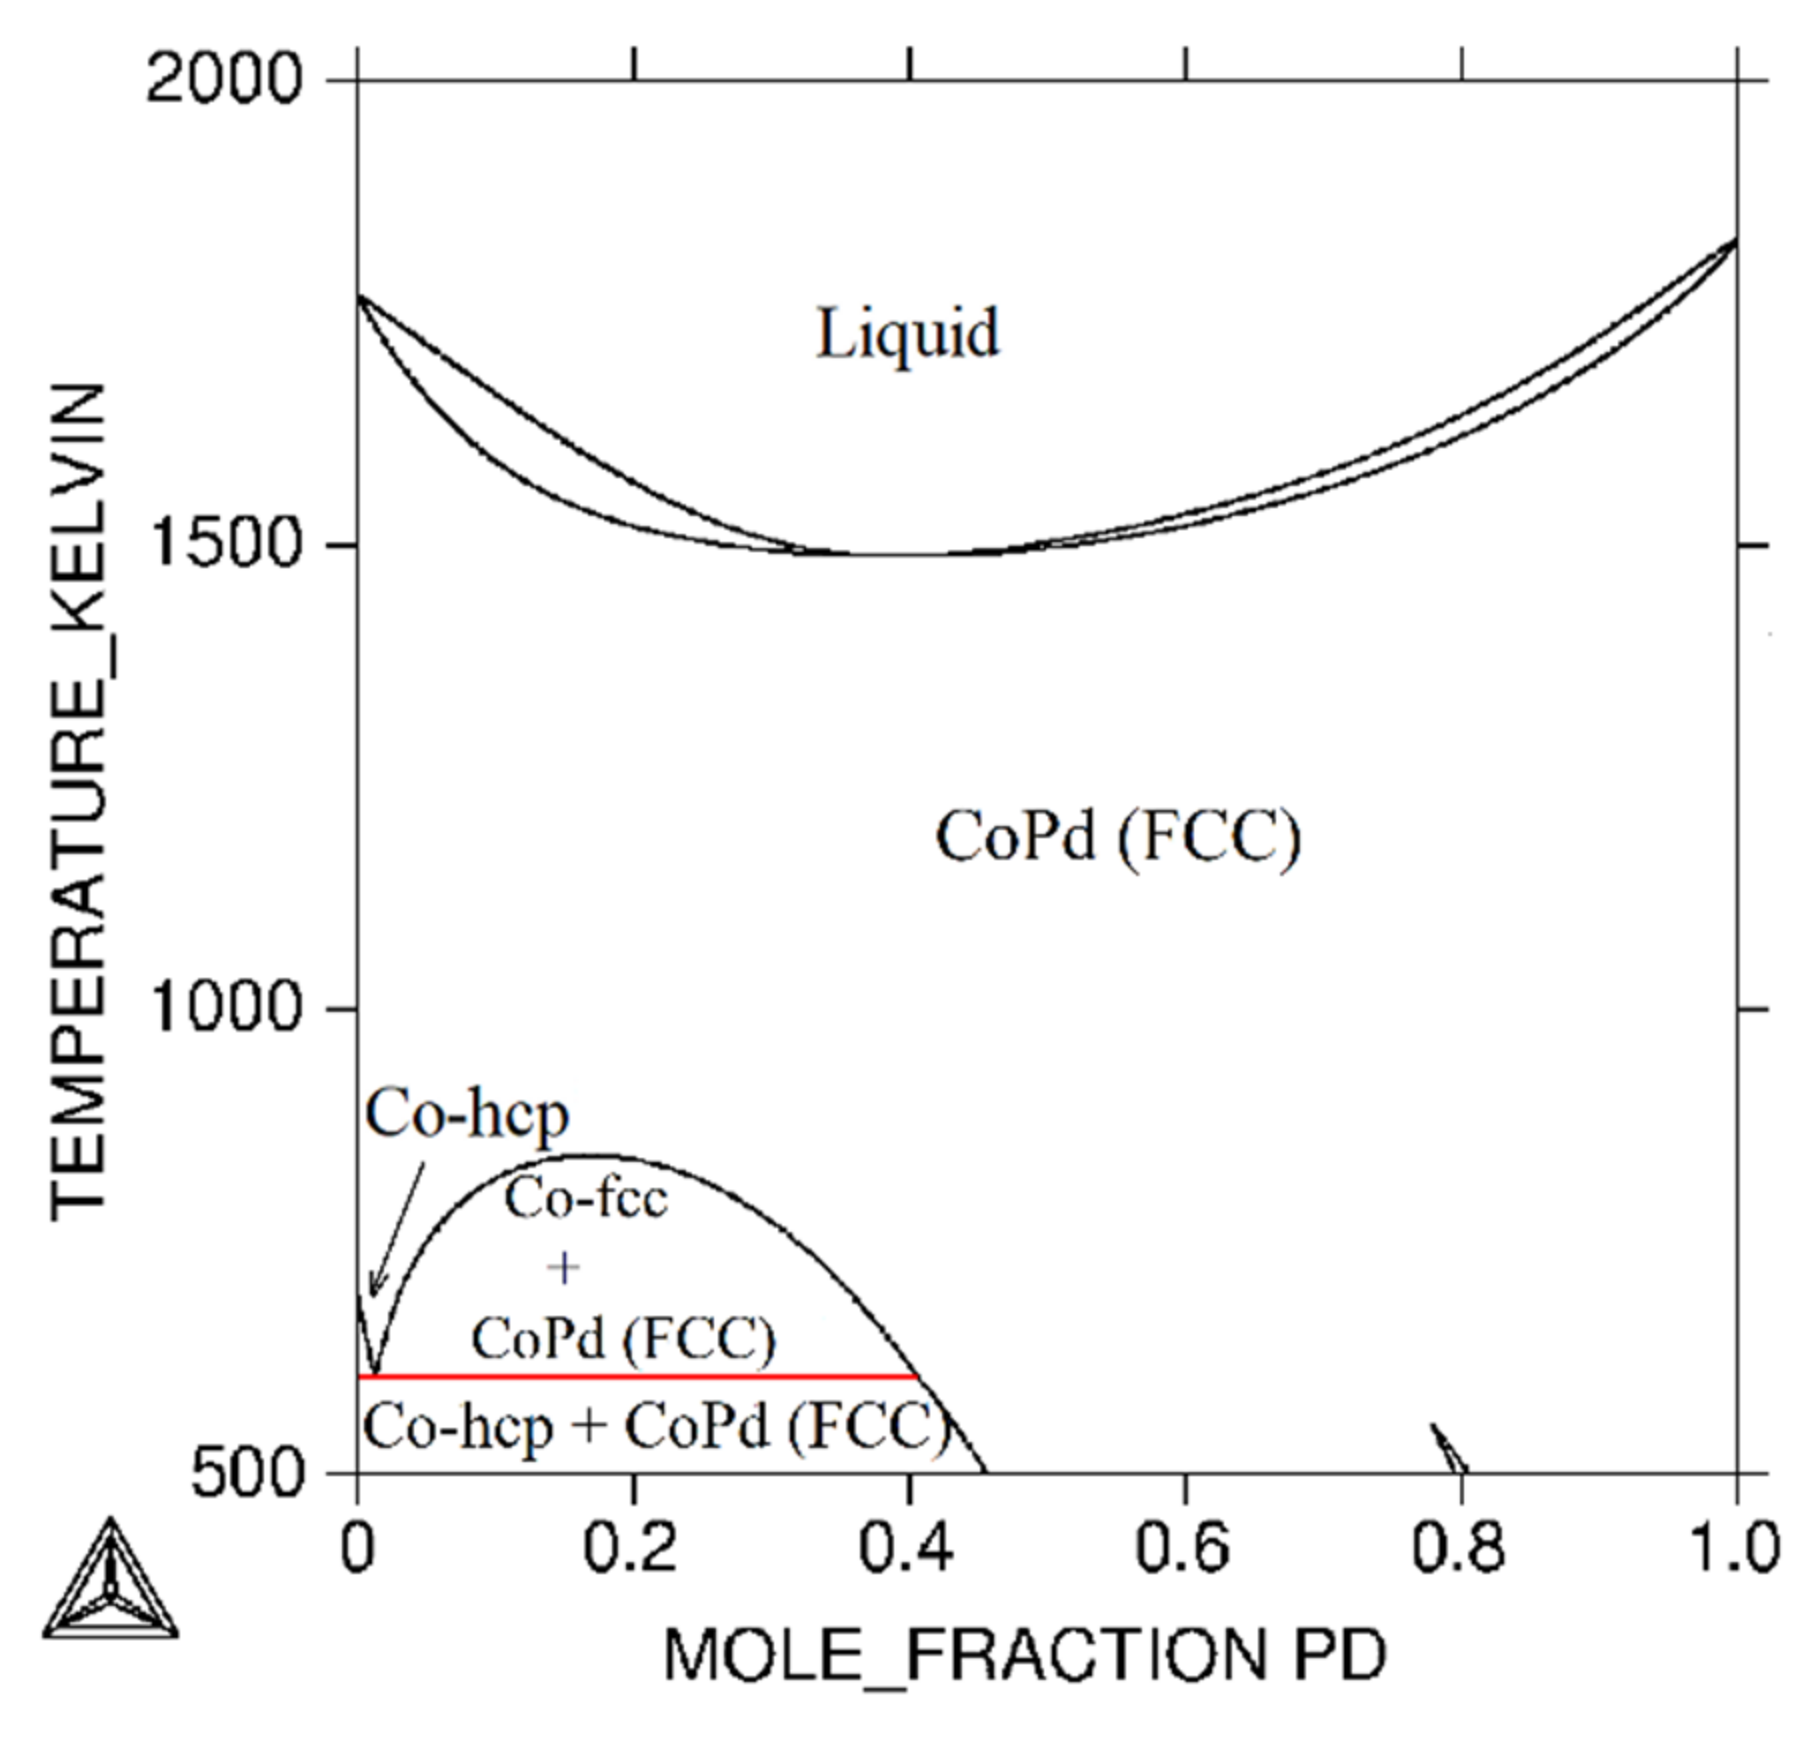
The phase diagram of the Co–Pd binary system is presented in Figure 2. The diagram was calculated based on the thermodynamic data from study [17]. Part of the diagram at temperatures below 1400 K was not shown in the mentioned study [17] and consistent experimental results concerning the miscibility gap in the FCC phase at low temperatures have not been found in the literature. The diagram presented in Figure 2 was calculated using the mentioned thermodynamic data [17]. Liquid, Co-rich hcp solid solution and FCC solid solution with complete solubility are equilibrium phases present in the system.
2.3. Al–Pd
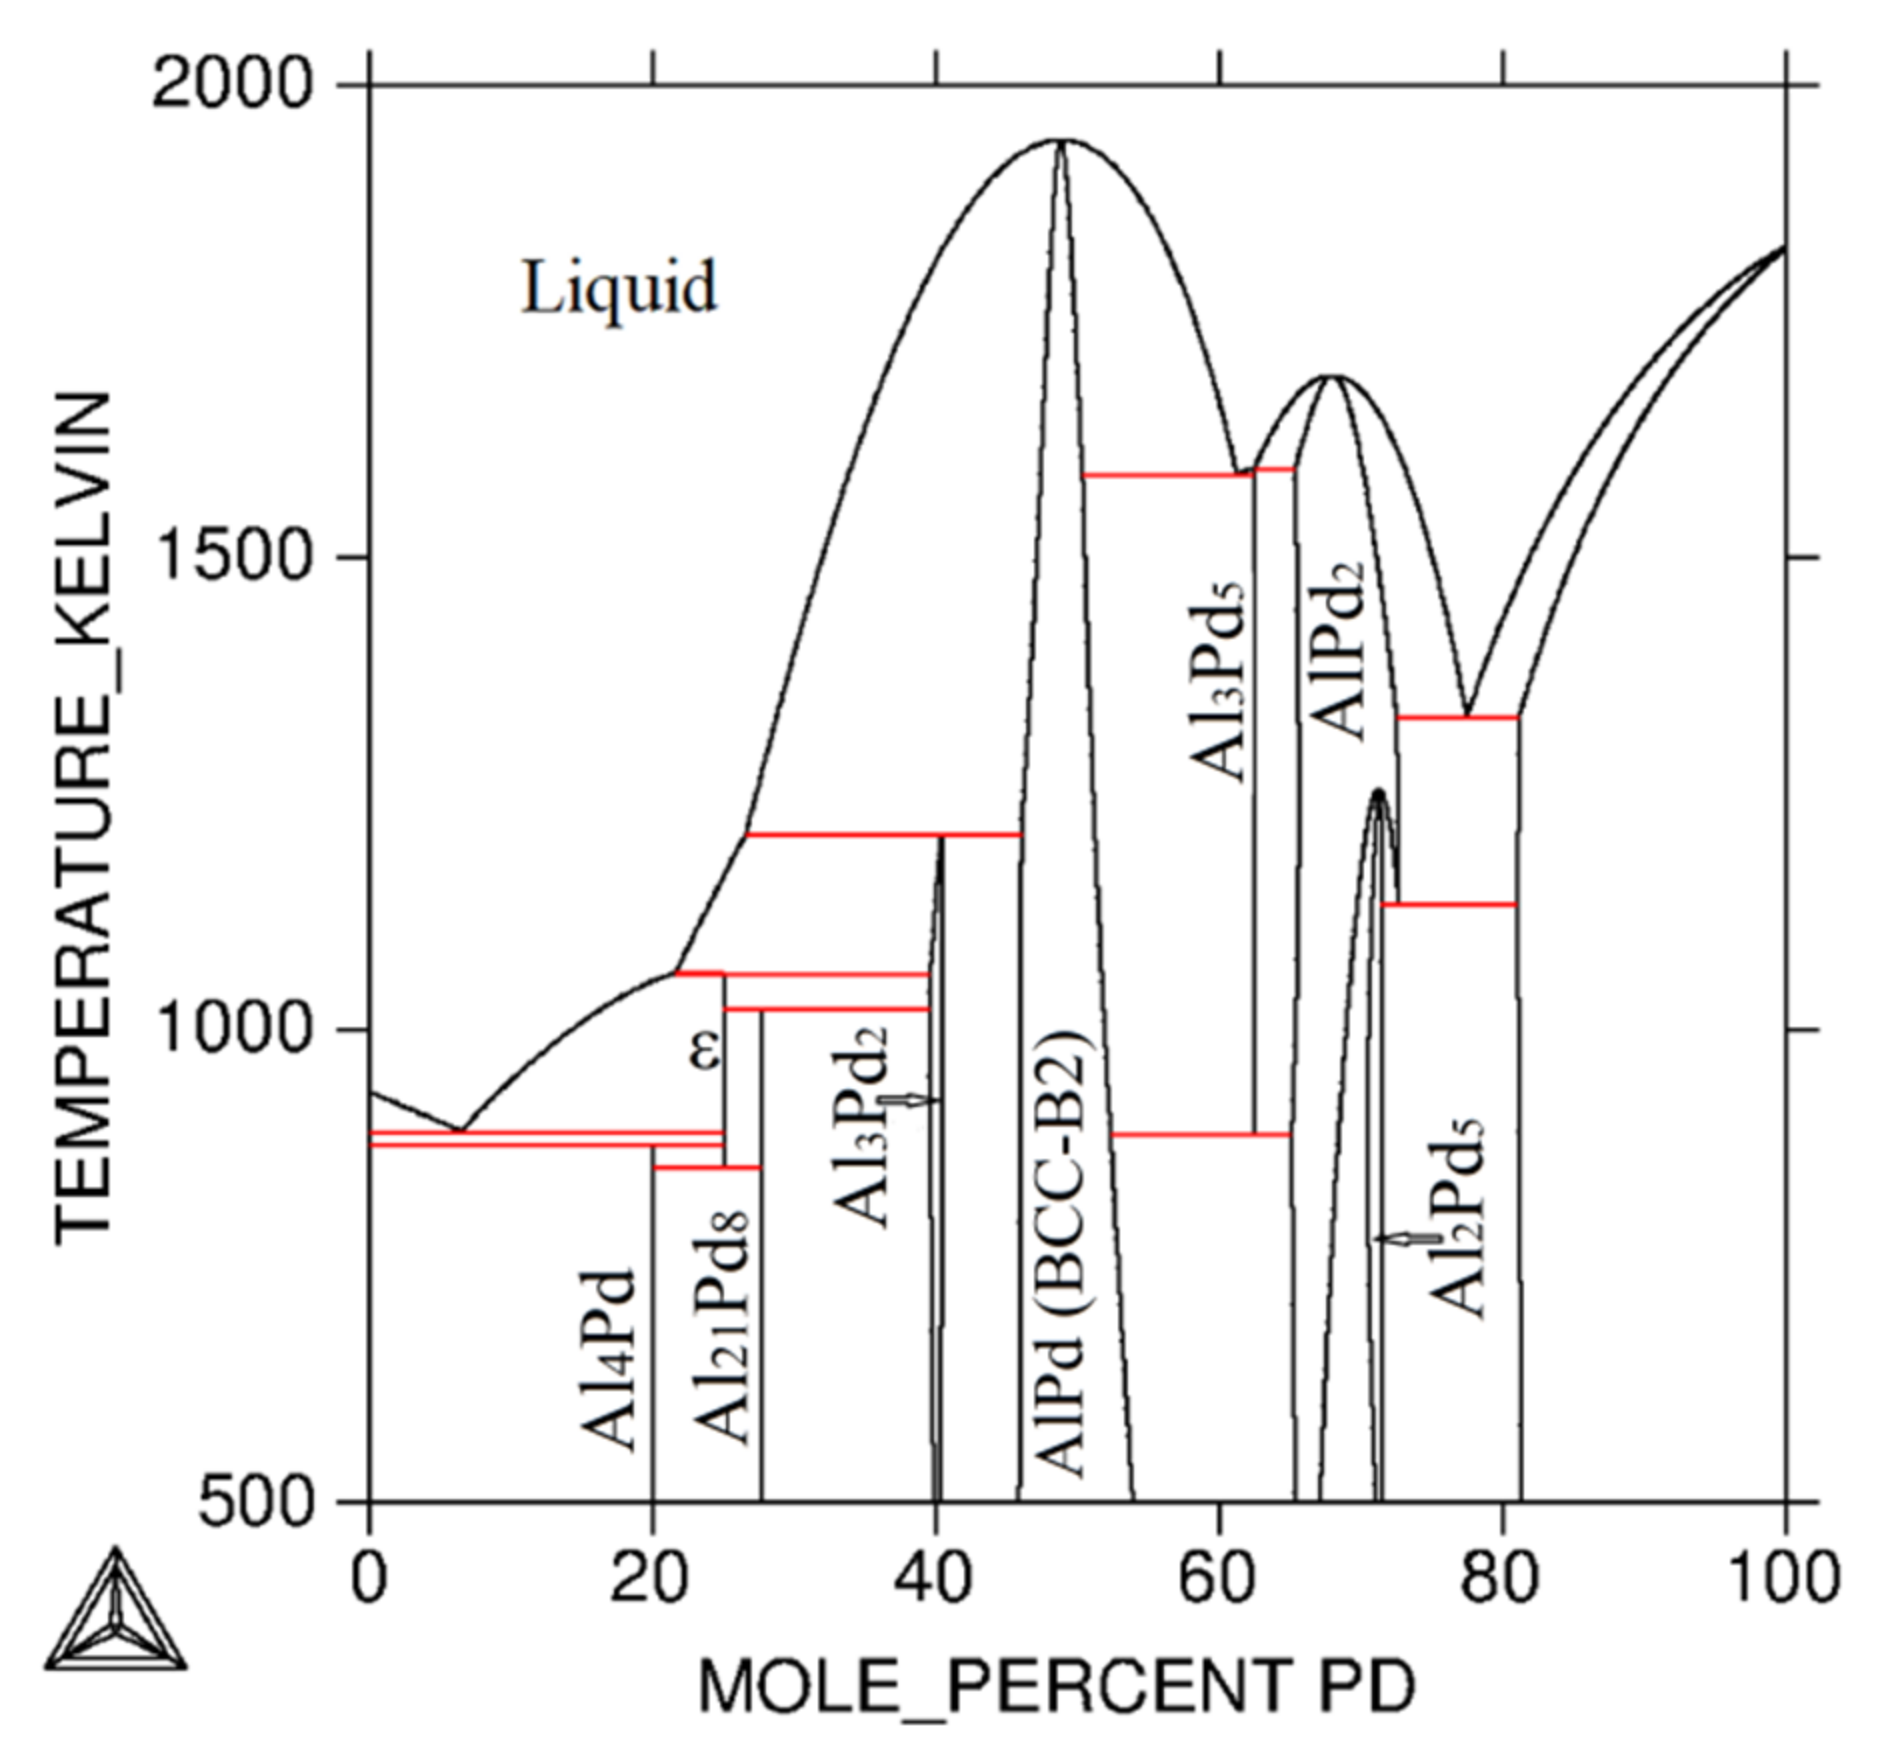
Thermodynamic data for the Al–Pd binary subsystem can be found in papers Li et al. [18] and Duriska et al. [19]. The AlPd phase (having the BCC-B2 crystallographic structure) with a wide homogeneity range was described by a sublattice asymmetrical model (Al%, Pd)(Pd%, Va) in both studies [18,19]. Extrapolation of the Al–Pd binary system to the ternary Al–Pd–Co system requires compatibility of models in corresponding binary subsystems. In the Al–Co binary system [16], the BCC-B2 phase corresponding to the AlPd phase in Al–Pd system is described by the order–disorder model. Therefore, the order–disorder model was used for the BCC phases also in an Al–Pd system. The ordered BCC-B2 phase (AlPd) is the stable phase and disordered BCC-A2 is an unstable phase in the Al–Pd system. The low-temperature modification of the AlPd phase (α-AlPd) has not been modeled in previously published assessments [18,19]. BCC-B2 is modeled as stable also at low temperatures. As a result of incomplete experimental information on the existence of a low-temperature modification of this phase and completely missing information on the possible existence of a low-temperature phase in the Al–Co system, the BCC-B2 phase was modeled as equilibrium also at low temperatures similarly as in study [18].
The phase diagram of the system is shown in Figure 3. There are seven other intermetallic phases (Al4Pd, Al3Pd (ε), Al21Pd8, Al3Pd2, Al3Pd5, Al2Pd5 and AlPd2), liquid and FCC solid solutions in the diagram.
2.4. Al-Rich Corner of Al–Co–Pd System
In the aluminum-rich corner of the Al–Co–Pd system, binary phases Al5Co2, Al3Co, Al9Co2, phases of Al13Co4 family, phases of ε–family (Al3Pd), and Al3Pd2 were observed [8,9,10,11,12,13,14,15]. In addition, phases Al4Pd and Al21Pd8 exist in the Al-rich corner of the ternary system; however, the research area of the studies [8,9,10,11,12,13,14,15] was outside the area (either temperature or concentration) of the existence of these phases. In addition to the binary phases, the system also contains several stable ternary phases: orthorhombic W, monoclinic V and U, cubic F and C2, and Y-phase [8,9,10,11,12,13,14,15]. Crystallographic data of the equilibrium phases of the Al–Co–Pd ternary systems and its binary subsystems are shown in Table 1.
3. Thermodynamic Models
Thermodynamic modeling by the Calphad method was performed by Thermo-Calc software (Thermo-Calc Software AB, Solna, Sweden) [23]. Parameters for pure elements were taken from Dinsdale [24].
3.1. Thermodynamic Models for FCC Solid Solution
The Gibbs energy of the FCC solid solution phase in the system is described using the two-sublattice model (Al,Co,Pd)1(Va)1. This two-sublattice model with the vacancies in the second sublattice was used to ensure the consistency with the model used for this phase in large metal-based databases (e.g., for steels), where the interstitial elements in the FCC phase play an important role. As there are no interstitial elements in this system, yVa is always 1 and the model is generally equal to the model for liquid (see below).
The Gibbs energy for the FCC phase is expressed as:
In Equation (1), y represents the site fraction of component i in the relevant sublattice. is the Gibbs energy of pure element i in the phase.
All values of G are given relative to the Stable Element Reference state (SER) that is defined as the stable state of the element under standard conditions (298.15 K and 105 Pa). Interaction parameters L are expressed by a Redlich–Kister–Muggianu polynomial [25]:
The temperature dependence of the Lv parameter is expressed as follows:
Gmag in Equation (1) is the magnetic contribution to the Gibbs energy. Its value is calculated according to the model of Hillert and Jarl [26].
3.2. Thermodynamic Models for Liquid and Hcp Solid Solution
The liquid phase is described by a single sublattice. Its Gibbs energy is described as follows:
where xi is a mole fraction of the component i.
The hcp phase is also described using single sublattice model as in the case of the liquid phase.
3.3. Thermodynamic Model for Stoichiometric Phases
The Al4Pd, Al21Pd8, Al3Pd5 phases are described as stoichiometric phases with two sublattices (Al)a(Pd)c. The Gibbs energy per mole of the phase AlaPdc is expressed by the Gibbs energy of formation relative to the chosen reference state as follows:
can be given by the following expression
where m and n are the parameters to be evaluated in the present work. These parameters correspond to the enthalpy and entropy of formation of a given stoichiometric phase, respectively, with respect to SER.
The Al3Pd (ε), Al3Co, Al5Co2, Al13Co4, Al9Co2 phases are also described using the model with two sublattices, but the solubility of the third element is taken into account. The Gibbs energy per mole of the formula Ala(Co,Pd)c is given as follows:
The W, V, F, Y2, C2 ternary phases are described as stoichiometric phases with a three sublattices model with formula (Al)a(Pd)b(Co)c. In the case of W: a = 0.72 b = 0.04 c = 0.24, for V: a = 0.7 b = 0.09 c = 0.21, for F: a = 0.73 b = 0.09 c = 0.18, for Y2: a = 0.765 b = 0.03 c = 0.205, for C2: a = 0.63 b = 0.27 c = 0.1. Their Gibbs energy is described as follows:
The U ternary phase is described by a three sublattices model with (Al)0.704(Pd)0.113(Co,Pd)0.183 formula. The model used for this phase is an extension of the model described by Equation (7).
3.4. Thermodynamic Model for Intermediate Phases with Homogeneity Ranges
There are several phases with a homogeneity range in the Al–Pd binary system. The AlPd2 phase is described with a two-sublattice model with formula (Al%,Pd)1(Al,Pd%)2. The symbol % denotes a major component in the corresponding sublattice. Gibbs energy is given as follows:
The Al3Pd2 phase is described with two-sublattice models with formula (Al%,Pd)3(Al,Co,Pd%)2. The Gibbs energy is expressed as:
The Al2Pd5 phase is also described with a two-sublattice model; however, the first sublattice is occupied only by aluminum. The formula of the Al2Pd5 phase is (Al)2(Al,Pd%)5. The Gibbs energy of the intermediate phase is expressed as:
3.5. Thermodynamic Model for BCC Ordered and Disordered Phases
The BCC-B2 phase is an ordered phase described with a two-sublattice model (Al,Co, Pd,Va)0.5(Al,Co,Pd,Va)0.5 based on the model used in [16]. The model of the phase is based on a BCC-A2 solid solution model with formula (Al,Co,Pd,Va)1. The BCC-A2 is an unstable phase in the investigated Al–Pd–Co system; however, it is modeled to achieve consistency with other systems when the system is extrapolated to the higher systems. The single function describing the Gibbs energy of the ordered and disordered phase together is given by the following equation:
Term is the Gibbs energy of the disordered BCC-A2 phase and can be calculated by a solution model similarly to the hcp-phase or liquid. is the ordering contribution. The sublattices of the BCC-B2 phase model are crystallographically equivalent to each other, therefore = and i,j,k,l = Al,Co,Pd,Va.
4. Results and Discussion
4.1. Al–Pd Binary System
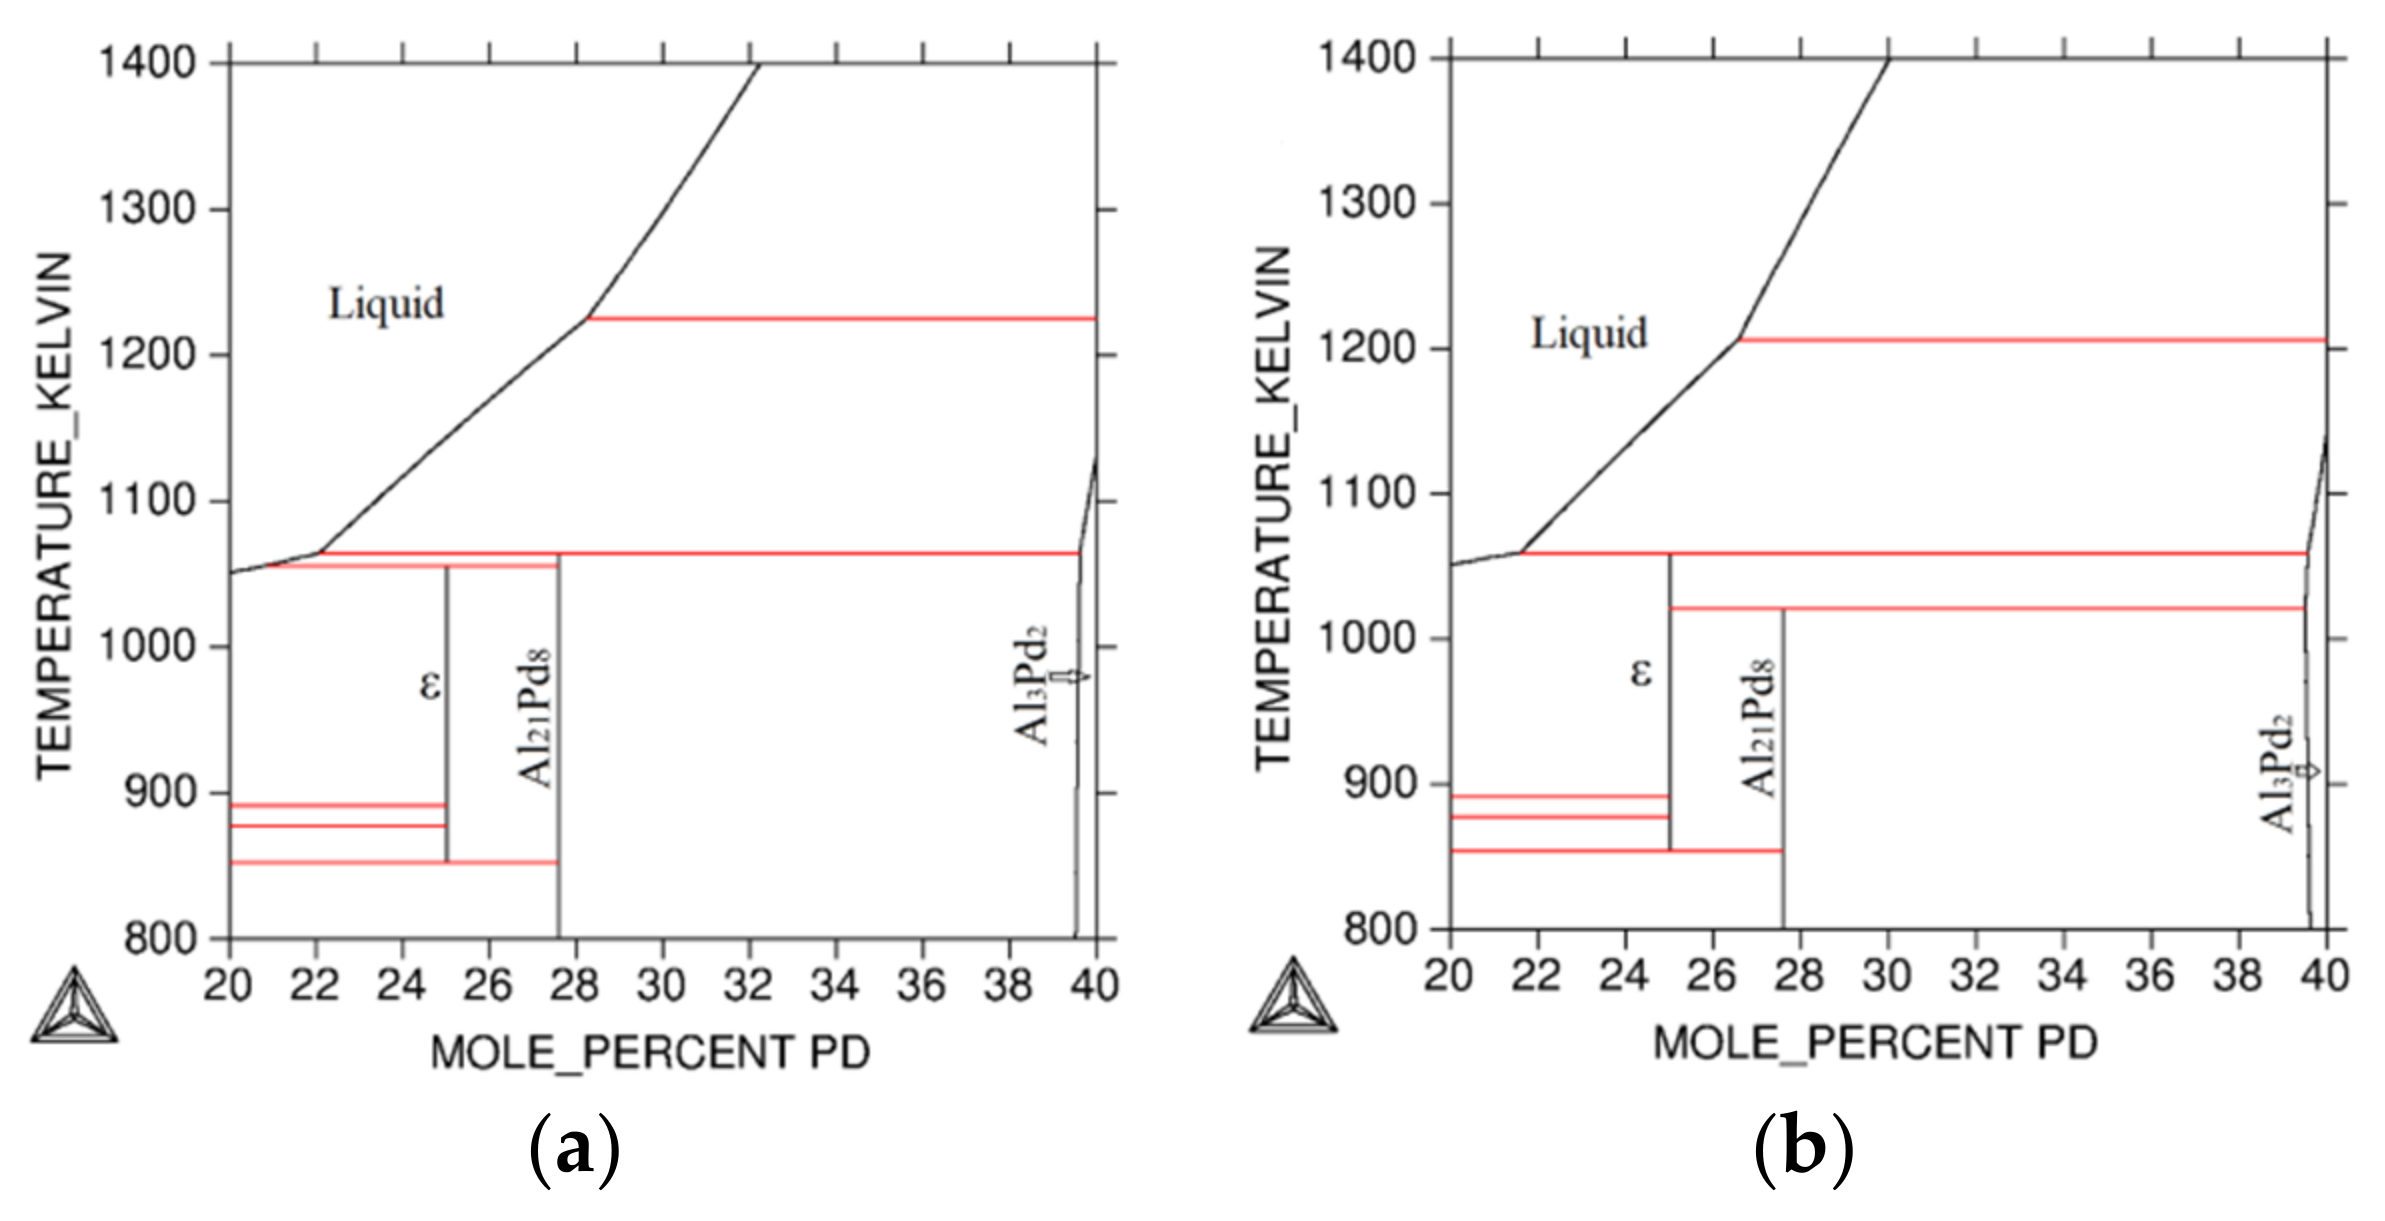
The Al–Pd binary phase diagram is based on an assessment created by Li et al. [18]. However, in contrast to [18], the intermediate AlPd phase with a wide homogeneity range is modeled as the ordered BCC-B2 phase to achieve compatibility of description with other binary subsystems of the studied ternary system. For this purpose, also the BCC-A2 phase, unstable in the Al–Pd binary system, was modeled. This change of the model resulted in the necessary reassessment of the system and also parameters for Al3Pd2 and Al3Pd5 Al21Pd8 intermediate phases had to be slightly modified. Parameters for Al21Pd8 were modified with the aim of achieving better agreement with experimental results [21], which show that the Al3Pd phase forms by peritectic reaction liquid+Al3Pd2↔ Al3Pd at 1062 K. On the contrary, according to assessment [18] (Figure 4a), the Al3Pd phase formed as a result of different (liquid+Al21Pd8↔ Al3Pd) reactions based on the study [27]. According to Grushko [21], reaction liquid + Al21Pd8 ↔ Al3Pd at 1055 K that was suggested in study [27] is considered as quite uncertain because only a weak kink associated with this reaction was observed in a DTA plot of the study [27]. The result of this reassessment is shown in Figure 3 and Figure 4b.
4.2. Al–Co–Pd Ternary System
In addition to a large number of binary phases, the Al–Co–Pd system also contains several stable ternary phases (W, V, F, U, Y, C2).
The homogeneity range of the W, V, C2 and Y phases is generally narrow. Therefore, they were modeled as stoichiometric phases. The F phase has a very narrow homogeneity range at 1323 and 1063 K, and slightly wider at 1273 and 1213 K according to Yurechko et al. [10]. The composition range of this phase at 1273 K is from 71.6Al-17.2Co-11.2Pd to 71.8Al-18.8Co-9.4Pd, and at 1213 K from 71.3Al-12.4Co-16.3Pd to 72.3Al-8.8Co-18.9Pd. Because the range of composition is relatively narrow, the phase was also modeled as a stoichiometric phase. For the U phase, the model described by formula (Al)0.704(Pd)0.113(Co,Pd)0.183 was used. This model takes into account the homogeneity region of the phase. The experimentally determined width of the homogeneity region of the U-phase is about 5 at.% with a constant amount of aluminum [10].
The model for Al13Co4 covers all phases of the Al13Co4 family (M-Al13Co4, O-Al13Co4 and Y- Al13Co4) in the binary system and is suitable for the Al–Co binary system (Figure 1). On the other hand, the Y-phase observed in the Al–Co–Pd system by Yurechko et al. [10] has a similar structure to the high-temperature binary phase Y-Al13Co4 in the Al–Co system [28]. However, no continuous range between the ternary Y phase and the binary Y-Al13Co4 was observed in the Al–Co–Pd system [10]. Therefore, in the presented calculations, Y is presented as a ternary phase, and a different model was used. This phase was modeled as a stoichiometric phase from approximately 1063 to 1213 K based on the experimental results from Yurechko et al. [10]. The phase was presented as a separate ternary phase also in other experimental studies [11,12,13,14].
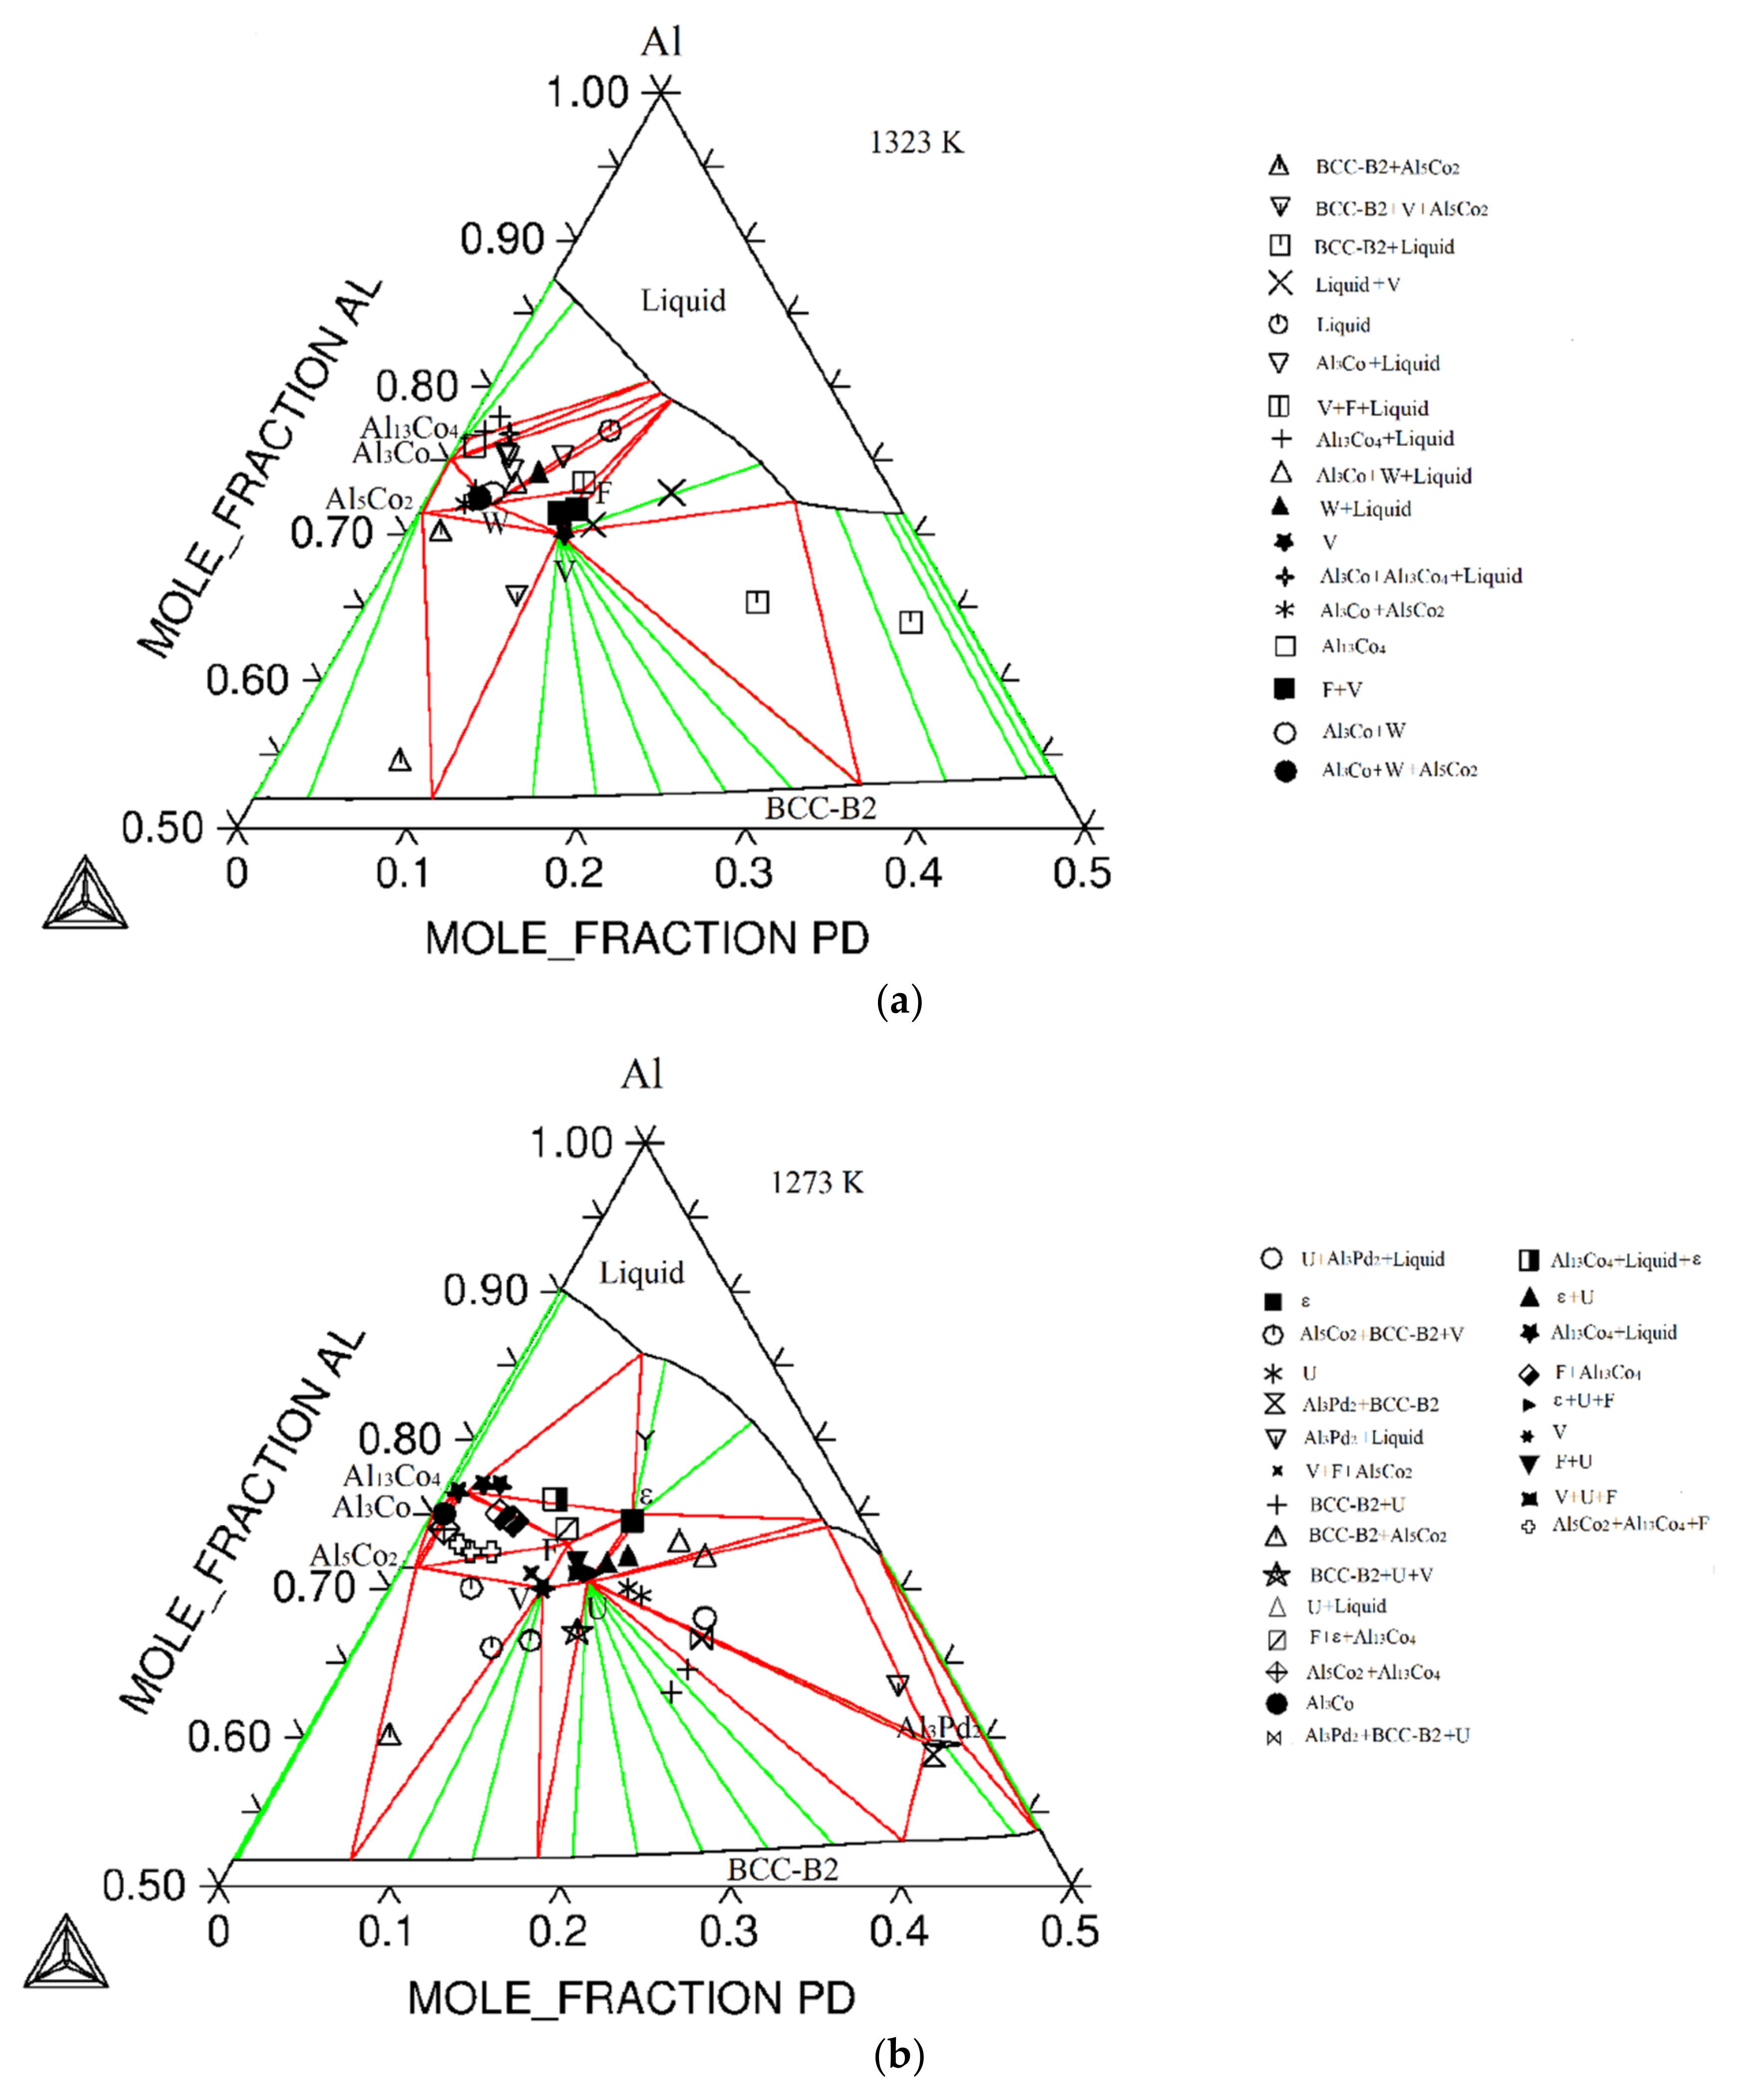
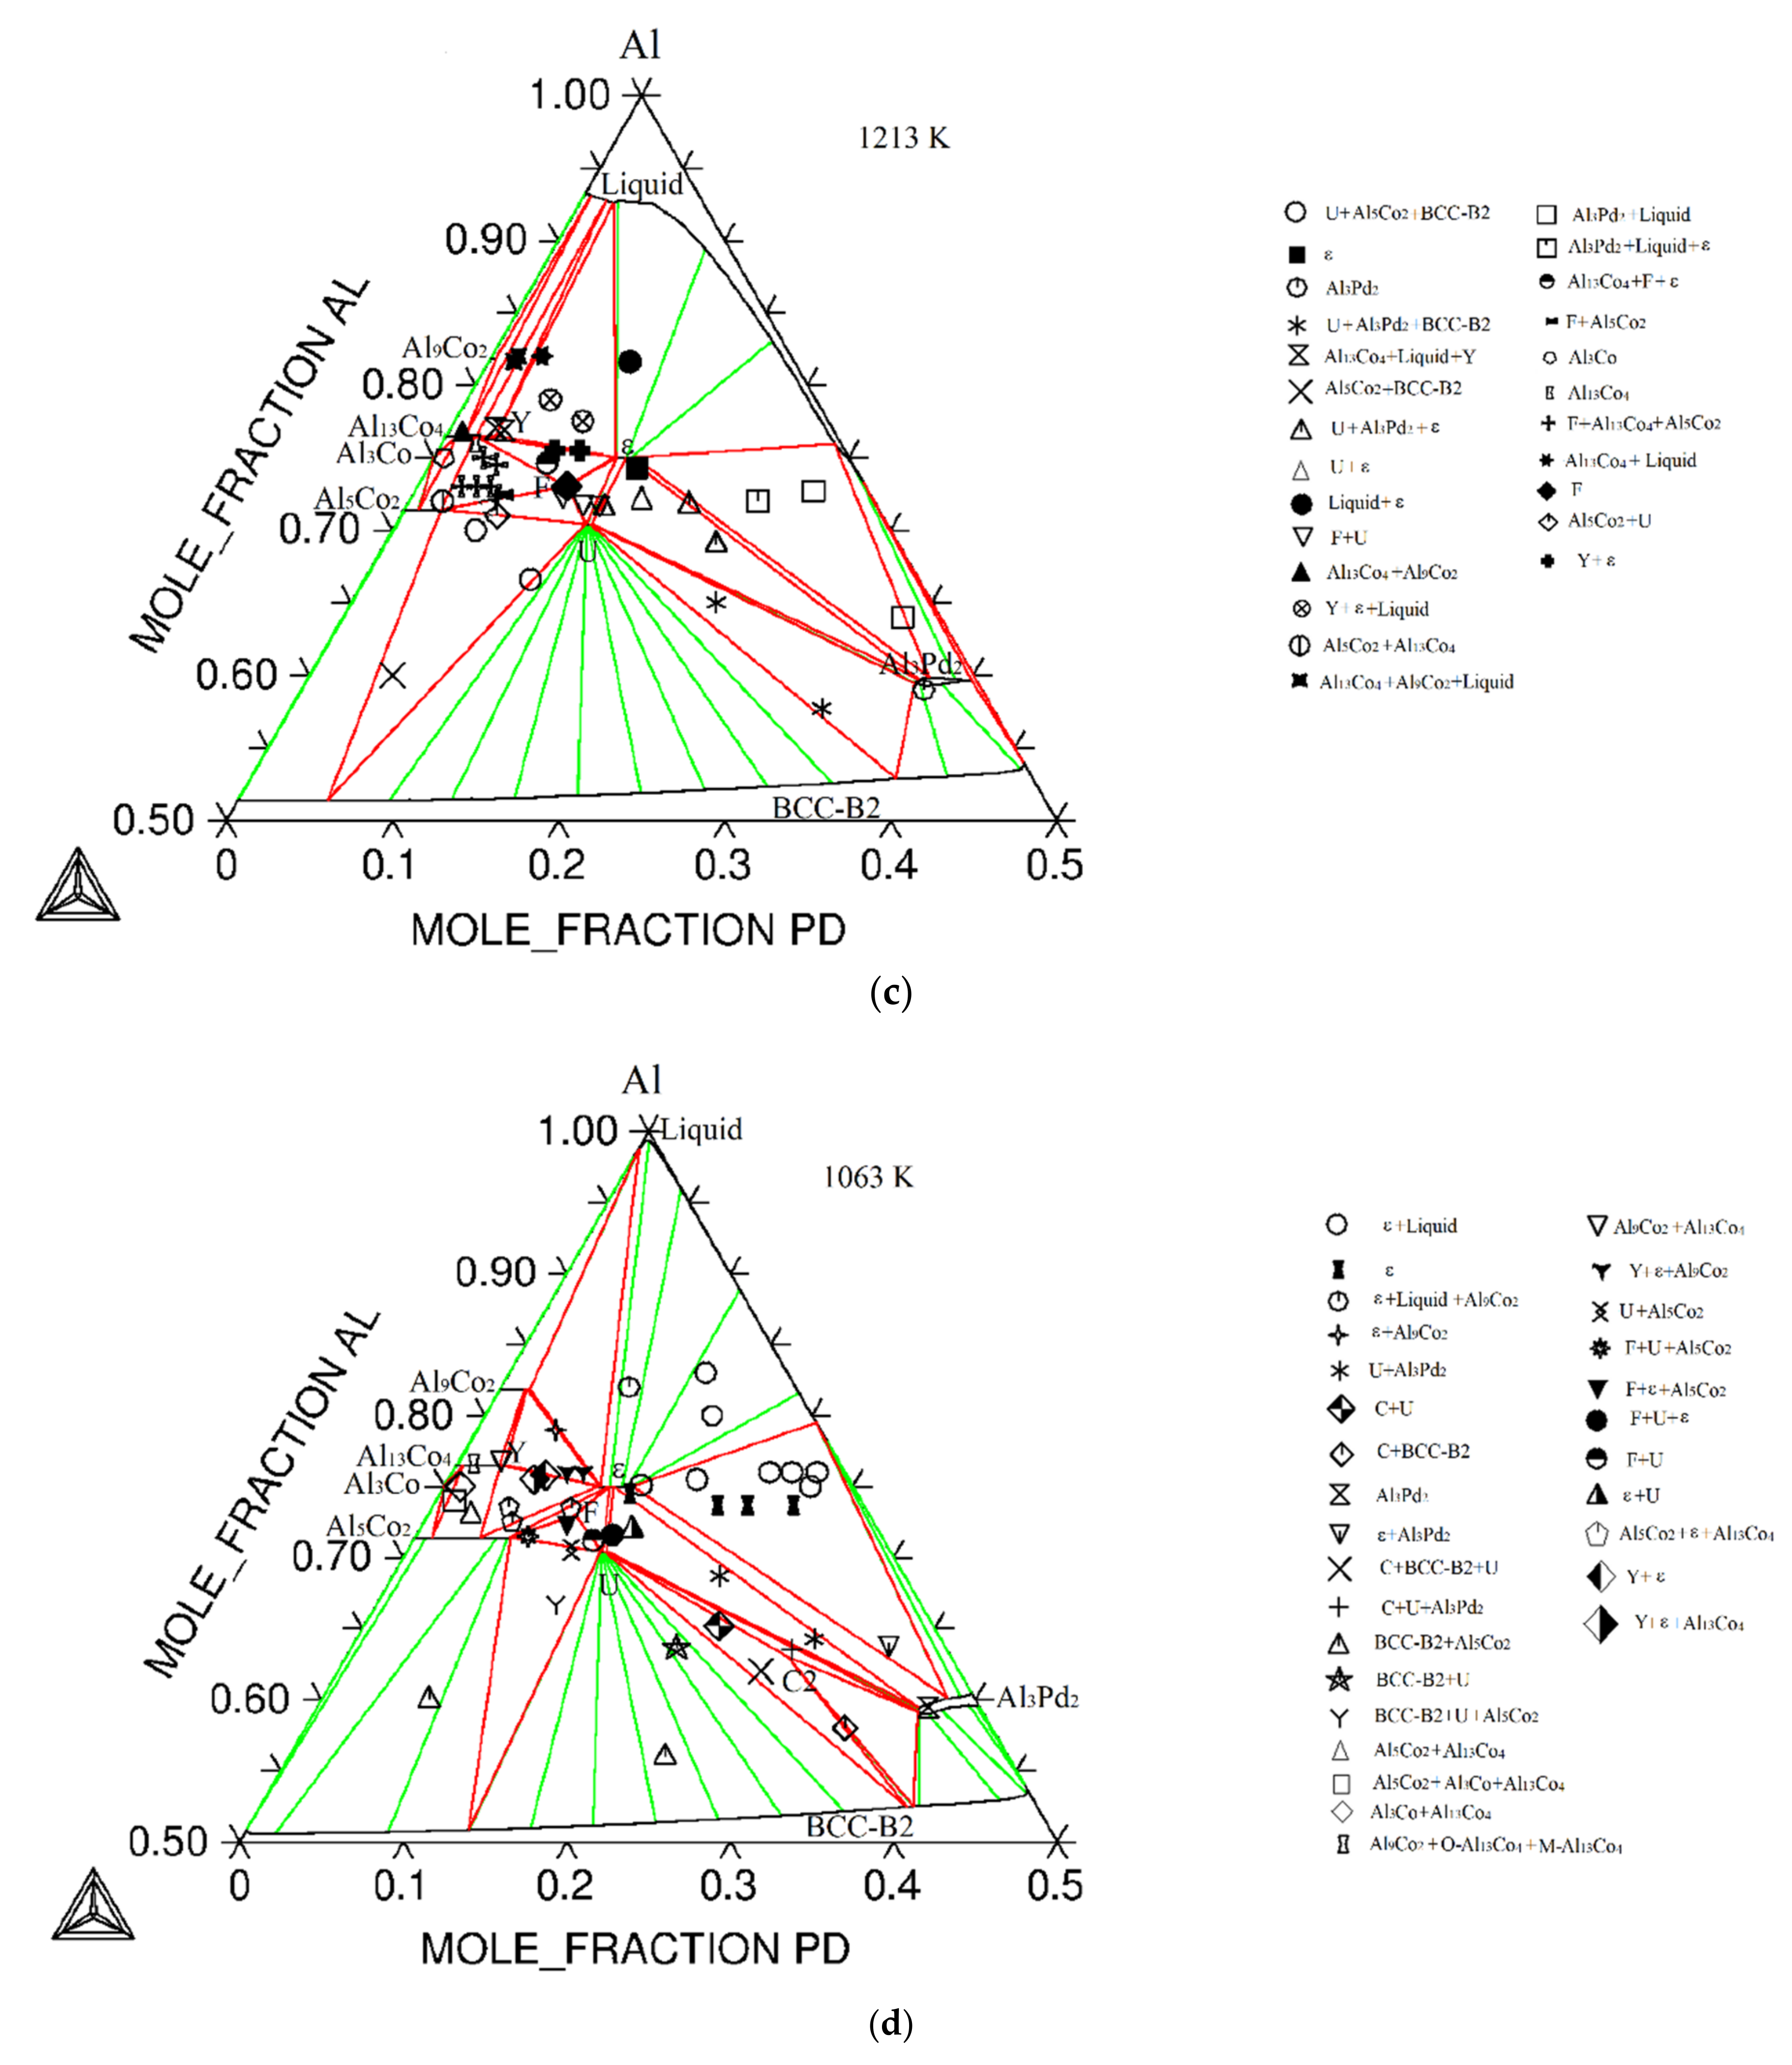
Figure 5a–d shows the isothermal sections of the Al–Co–Pd system at various temperatures. The calculated three-phase equilibria are in agreement with the experimentally determined results according to Yurechko et al. [10]. Only the experimentally determined three-phase equilibrium Al9Co2+M-Al13Co4+O-Al13Co4 at 1213 K (Table 2) cannot exist in the calculated isothermal section (Figure 5c) because the M-Al13Co4 and O-Al13Co4 phases are modeled as single phase.
At 1063 K (Figure 5d), the Al3Pd+Al3Pd2+liquid equilibrium was calculated. The equilibrium is not presented in a phase diagram according to Yurechko et al. [10]. Yurechko presented homogeneity range of the Al3Pd phase from binary system (Al3Pd) to 73.7Al-11.1Pd-15.2Co at this temperature. However, the Al3Pd phase forms by peritectic reaction liquid + Al3Pd2 ↔ Al3Pd at 1062 K in the binary system according to Grushko [21], which is in accordance with the presented calculations.
Al3Pd phase represents phases of ε-family (ε6, ε28 known from the binary system and ε16 ε22 ε34 observed in the ternary system [8]). The Al3Pd model was taken from the work of Li et al. [18] and was extended to the ternary system by the addition of Co into the model. The homogeneity range of the phase increases with decreasing temperature (Figure 5), which is in accordance with the experimental results from [10,13]. Nevertheless, such a wide range of homogeneity as in [10] was not achieved at lower temperatures.
The modeled isothermal sections of the Al-rich corner of the Al–Co–Pd phase diagram (Figure 5) take into account information about the formation of the ternary phases in the system. According to [10], the F, V and W ternary phases solidified from a liquid above 1323 K. V and W decompose between 1273-1213 and 1323-1273 K, respectively. F is observed at all studied temperatures. U melts between 1273 and 1323 K. The C2 is formed from a solid phase. The C2 was observed at 1063 K. The calculations are consistent with these experimental findings.
Better agreement between the experimentally determined maximum solubility of the third element in binary phases (Pd in Al5Co2, Al3Co, Al13Co4, Al9Co2; Co in Al3Pd, Al3Pd2), and the calculation was obtained for lower temperatures. The calculated solubility of Co is 4 and 15 at.% in Al3Pd2 and Al3Pd, respectively, at 1063 K. Yurechko et al. [10] observed the same values of solubility in these phases. The calculated solubility of Pd is 1.7, 2.7, 0.45, and 5 in Al9Co2, Al13Co4, Al3Co and Al5Co2, respectively. Experimentally determined values are 2.6, 2.7, 1.6, and 3 at.% in the same phases, respectively [10]. Slightly larger differences between experimental and calculated values of solubility are in Al–Co binary phases at 1323 K, but due to the relatively small Pd solubility in these phases (about 3 at.% [10]), this does not have a significant effect on the character of the phase equilibria.
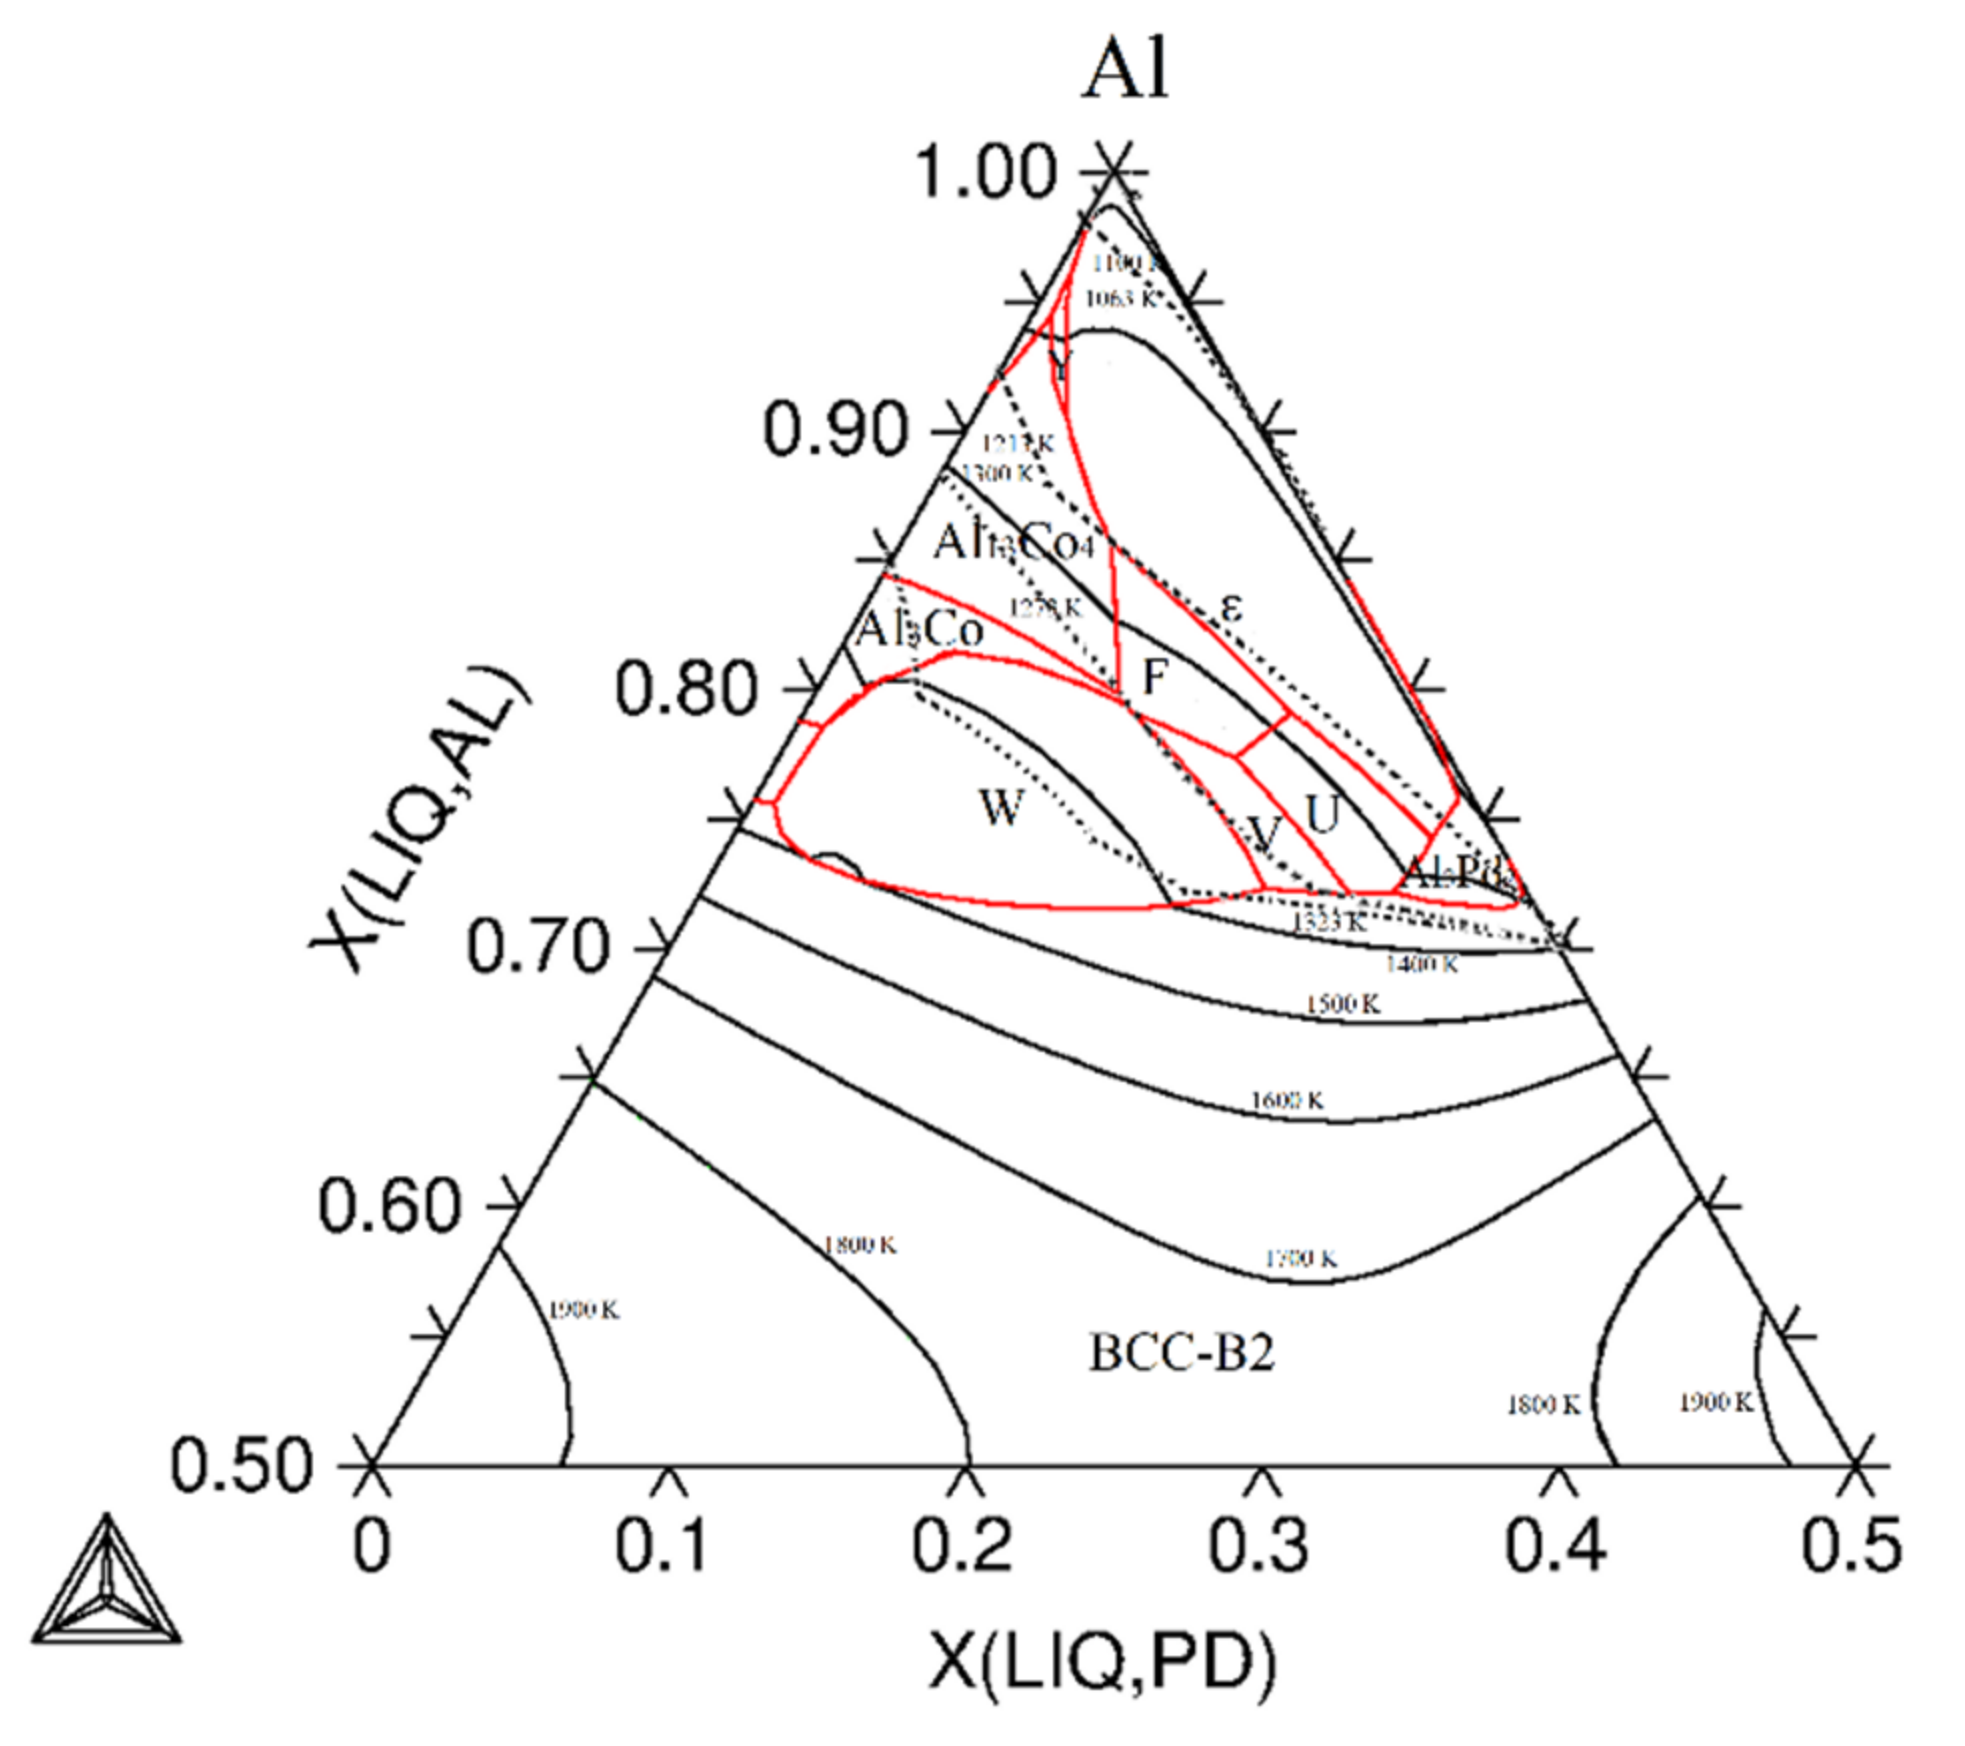
The liquidus surface prediction of the system was calculated and is shown in Figure 6. The calculations are in good agreement with liquidus lines presented in the isothermal sections in study [10] for higher temperatures. The agreement is slightly worse close to the Al-rich corner. Here the reason can be partially explained by observed disagreement between the calculated and experimental isotherms very close to the binary Al–Co and Al–Pd subsystems, which influences the shape of the isotherms in the ternary region as well. For example, in the Al–Pd system, the compositions of the binary system for the melting temperatures 1323, 1273 and 1213 K extrapolated from the experimental isotherms are very close to each other; nevertheless, they still reasonably correspond to the values obtained from the theoretical assessment of the binary Al–Pd system. On the other hand, the extrapolated position of the experimental isotherm at 1063 K is much closer to the Al corner than the calculated one. Similar disagreement can be found for the Al–Co binary especially close to the Al-rich corner. The discrepancies existing in binary subsystems indicate some doubts about the precision of experimentally established isotherms.
The thermodynamic parameters assessed in this work are given in Table 3. The parameters for phases of the Al–Co–Pd system from the region below 50 at.% of aluminum were not modified because experimental results are missing in the literature for this part of the diagram. Al3Pd5 has been modified in connection with the modification of the Al–Pd binary diagram as mentioned above.
5. Summary and Conclusions
The work deals with modeling of an Al-rich corner of the Al–Co–Pd phase diagram by the CALPHAD method using available experimental literature data. The achieved results can be summarized as follows:
- The assessment of the Al–Pd binary system was modified. Intermediate AlPd phase with a wide homogeneity range in the binary system was modeled as an ordered BCC-B2 phase using order–disorder model to achieve compatibility of the description of the phases with other binary subsystems of the studied Al–Co–Pd ternary system. For this purpose, also the BCC-A2 phase, unstable in the Al–Pd binary system, was modeled. Parameters for Al3Pd2, Al3Pd5 and Al21Pd8 intermediate phases were slightly modified.
- Thermodynamic assessment of Al–Co–Pd was performed. All ternary phases, except the U phase, were modeled as stoichiometric phases. The U phase was described by the (Al)0.704(Pd)0.113(Co,Pd)0.183 formula. The solubility of the third element in binary phases (Al5Co2, Al3Co, Al13Co4, Al9Co2, Al3Pd and Al3Pd2) was modeled. In addition, liquidus surface prediction was calculated. The binary phases from the region under 50 at.% Al were not modified.
- The calculated phase diagram is in good agreement with experimental results from the literature.
Author Contributions
Conceptualization, V.H.; methodology, V.H. and A.K.; validation, V.H. and A.K.; formal analysis, V.H. and A.K.; investigation, V.H. and A.K.; data curation, V.H. and A.K.; writing—original draft preparation, V.H.; writing—review and editing, V.H. and A.K.; visualization, V.H.; supervision, V.H.; project administration, V.H. All authors have read and agreed to the published version of the manuscript.
Funding
This research was funded by Slovak Research and Development Agency, grant number APVV-15-0049 and by Slovak Grant Agency (VEGA) under project No. 2/0038/21.
Institutional Review Board Statement
Not applicable.
Informed Consent Statement
Not applicable.
Data Availability Statement
The data presented in this study (including TDB file) are available on request from the corresponding author.
Acknowledgments
The present work was supported by Slovak Research and Development Agency under project No. APVV-15-0049 and by Slovak Grant Agency (VEGA) under project No. 2/0038/21.
Conflicts of Interest
The authors declare no conflict of interest.
References
- Feng, X.; Ling, L.X.; Can, Y.T.; Zhang, R.G.; Fan, M.H.; Wang, B.J. A DFT study on the catalytic CO oxidative coupling to dimethyl oxalate on Al-doped core-shell Pd cluster. J. Phys. Chem. C 2018, 122, 1169–1179. [Google Scholar] [CrossRef]
- Vodenitcharova, T.; Kong, Y.; Shen, L.M.; Dayal, P.; Hoffman, M. Nano/Micro mechanics study of nanoindentation on thin Al/Pd films. J. Mater. Res. 2015, 30, 699–708. [Google Scholar] [CrossRef]
- Kong, Y.; Shen, L.; Proust, G.; Ranzi, G. Al-Pd interatomic potential and its application to nanoscale multilayer thin films. Mater. Sci. Eng. A 2011, 530, 73–86. [Google Scholar] [CrossRef]
- Balbyshev, V.N.; King, D.J.; Khramov, A.N.; Kasten, L.S.; Donley, M.S. Investigation of quaternary Al-based quasicrystal thin films for corrosion protection. Thin Solid Films 2004, 447, 558–563. [Google Scholar] [CrossRef]
- Smontara, A.; Smiljanic, I.; Bilusic, A.; Grushko, B.; Balanetskyy, S.; Jaglicic, Z.; Vrtnik, S.; Dolinsek, J. Complex epsilon-phases in the Al-Pd-transition-metal systems: Towards a combination of an electrical conductor with a thermal insulator. J. Alloys Compd. 2008, 450, 92–102. [Google Scholar] [CrossRef]
- Takagiwa, Y.; Kimura, K. Metallic-covalent bonding conversion and thermoelectric properties of Al-based icosahedral quasicrystals and approximants. Sci. Technol. Adv. Mater. 2014, 15, 044802. [Google Scholar] [CrossRef] [PubMed] [Green Version]
- Janovec, J.; Černičková, I.; Priputen, P. Complex metallic alloys-microstructure characterization. Key Eng. Mater. 2014, 592–593, 483–488. [Google Scholar] [CrossRef]
- Černičková, I.; Švec, P.; Watanabe, S.; Čaplovič, Ľ.; Mihalkovič, M.; Kolesár, V.; Priputen, P.; Bednarčík, J.; Janičkovič, D.; Janovec, J. Fine structure of phases of ε-family in Al73.8Pd11.9Co14.3 alloy. J. Alloys Compd. 2014, 609, 73–79. [Google Scholar] [CrossRef]
- Yurechko, M.; Grushko, B. A study of the Al–Pd–Co alloy system. Mater. Sci. Eng. 2000, 294–296, 139–142. [Google Scholar] [CrossRef]
- Yurechko, M.; Grushko, B.; Velikanova, T.; Urban, K. Isothermal sections of the Al–Pd–Co alloy system for 50–100 at.% Al. J. Alloys Compd. 2002, 337, 172–181. [Google Scholar] [CrossRef]
- Kahalová, Ľ.; Kusý, M.; Buršík, J.; Svoboda, M.; Illeková, E.; Švec, P.; Dolinšek, J.; Janovec, J. Microstructure evolution of an Al-Pd-Co alloy. Kovove Mater. 2008, 46, 221–227. [Google Scholar]
- Černičková, I.; Priputen, P.; Liu, T.Y.; Zemanová, A.; Illeková, E.; Janickovi, D.; Svec, P.; Kusý, M.; Caplovi, L.; Janovec, J. A Evolution of phases in Al-Pd-Co alloys. Intermetallics 2011, 19, 1586–1593. [Google Scholar] [CrossRef]
- Černičková, I.; Ďuriška, L.; Drienovský, M.; Janičkovič, D.; Janovec, J. Phase transitions in selected Al-Pd-Co alloys during continuous cooling. Kovove Mater. 2017, 55, 403–411. [Google Scholar] [CrossRef] [Green Version]
- Černičková, I.; Ďuriška, L.; Priputen, P.; Janičkovič, D.; Janovec, J. Isothermal section of the Al-Pd-Co phase diagram at 850 °C delimited by homogeneity ranges of phases Epsilon, U and F. J. Phase Equilib. Diffus. 2016, 37, 301–307. [Google Scholar] [CrossRef]
- Ďuriška, L.; Černičková, I.; Priputen, P.; Janovec, J. Partial experimental isothermal section of Al-Pd-Co phase diagram for Al-rich corner at 1020 °C. J. Phase Equilib. Diffus. 2019, 40, 45–52. [Google Scholar] [CrossRef]
- Stein, F.; He, C.; Dupin, N. Melting behaviour and homogeneity range of B2 CoAl and updated thermodynamic description of the Al-Co system. Intermetallics 2013, 39, 58–68. [Google Scholar] [CrossRef]
- Ghosh, G.; Kantner, C.; Olson, G.B. Thermodynamic modeling of the Pd-X(X = Ag, Co, Fe, Ni) systems. J. Phase Equilib. Diffus. 1999, 20, 295–308. [Google Scholar] [CrossRef]
- Li, M.; Li, C.; Wang, F.; Zhang, W. Thermodynamic assessment of the Al-Pd system. Intermetallics 2006, 14, 39–46. [Google Scholar] [CrossRef]
- Ďuriška, L.; Černičková, I.; Čička, R.; Janovec, J. Contribution to thermodynamic description of Al-Pd system. J. Phys. Conf. Ser. 2017, 809, 012008. [Google Scholar] [CrossRef] [Green Version]
- Okamoto, H. Al-Pd (Aluminum-Palladium). J. Phase Equilib. Diffus. 2014, 35, 106–107. [Google Scholar]
- Grushko, B. Again regarding the Al-Pd phase diagram. J. Alloys Compd. 2013, 557, 102–111. [Google Scholar] [CrossRef]
- Noori, M.; Hallstedt, B. Thermodynamic modelling of the Al–Co–Mn system. Calphad 2020, 71, 101793. [Google Scholar] [CrossRef]
- Thermo-Calc Software Homepage. Available online: https://thermocalc.com (accessed on 7 November 2021).
- Dinsdale, A.T. SGTE Data for pure elements. Calphad 1991, 15, 317–425. [Google Scholar] [CrossRef]
- Redlich, O.; Kister, A. Thermodynamics of nonelectrolyte solutions-x-y-t relations in a binary system. Indust. Eng. Chem. 1948, 40, 341–345. [Google Scholar] [CrossRef]
- Hillert, M.; Jarl, M. A model for alloying in ferromagnetic metals. Calphad 1978, 2, 227–238. [Google Scholar] [CrossRef]
- Yurechko, M.; Fattah, A.; Velikanova, T.; Grushko, B. A contribution to the Al–Pd phase diagram. J. Alloys Comp. 2001, 329, 173–181. [Google Scholar] [CrossRef]
- Ma, X.L.; Koster, U.; Grushko, B. Al13Os4-type monoclinic phase and its orthorhombic variant in the Al-Co alloy system. Z. Kristallogr. 1998, 213, 75–78. [Google Scholar] [CrossRef]
Figure 1.
Phase diagram of the Al–Co binary system, data for calculation were taken from [16].
Figure 1.
Phase diagram of the Al–Co binary system, data for calculation were taken from [16].

Figure 2.
Phase diagram of the Co–Pd binary system, data for calculation were taken from [17].
Figure 2.
Phase diagram of the Co–Pd binary system, data for calculation were taken from [17].

Figure 3.
Phase diagram of the Al–Pd binary system.

Figure 4.
Detail of the calculated Al–Pd diagram (a) according to study [18]; (b) according to this work with respect to the experimental results from [21].

Figure 5.
Calculated Al-rich corner of the isothermal section of the Al–Co–Pd system with experimental data points from the literature [10] (a) 1323 K; (b) 1273 K; (c) 1213 K; (d) 1063 K.
Figure 5.
Calculated Al-rich corner of the isothermal section of the Al–Co–Pd system with experimental data points from the literature [10] (a) 1323 K; (b) 1273 K; (c) 1213 K; (d) 1063 K.


Figure 6.
Calculated liquidus surface prediction of the Al–Co–Pd system. Dotted lines represent liquidus lines from isothermal sections from study [10].
Figure 6.
Calculated liquidus surface prediction of the Al–Co–Pd system. Dotted lines represent liquidus lines from isothermal sections from study [10].


Table 1.
Crystallographic data of equilibrium phases relevant to the Al–Co–Pd system.
| System | Phase | Pearson Symbol | Space Group | Reference |
|---|---|---|---|---|
| Al–Pd | ||||
| Al-fcc | cF4 | Fm3m | [18] | |
| Al3Pd2 | hP5 | P3m1 | [18] | |
| Al4Pd | hP | P6322 | [20] | |
| Al21Pd8 | tI116 | I41/a | [18] | |
| AlPd-β | cP2 | Pm3m, | [20] | |
| AlPd-α | cP8 | P213 | [20] | |
| AL3Pd5 | oP16 | Pbam | [18] | |
| AlPd2 | oP12 | Pnma | [18] | |
| Al2Pd5 | oP28 | Pbmn | [18] | |
| ε6 ~ AL3Pd | o | Pna21 | [21] | |
| ε28 ~ AL3Pd | o | C2mm | [21] | |
| Pd-fcc | cF4 | Fm3m | [18] | |
| Al–Co | ||||
| Al9Co2 | mP22 | P21/a | [22] | |
| M-Al13Co4 | mC102 | C2/m | [22] | |
| O-Al13Co4 | oP102 | Pmn21 or Pnmn | [22] | |
| Al3Co | ? | P2/m | [22] | |
| Al5Co2 | hP28 | P63/mmc | [22] | |
| AlCo-β | cP2 | Pm3m | [22] | |
| Co-hcp | hP2 | P63/mmc | [22] | |
| Co-fcc | cF4 | Fm3m | [22] | |
| Al–Co–Pd | ||||
| W | Pmn21 | [10] | ||
| V | P121, P1m1 or P12/m1 | [10] | ||
| F | P21/a3 | [10] | ||
| U | C121, C1m1 or C12/m1 | [10] | ||
| Y2 | Immm | [10] | ||
| C2 | Fm3 | [10] | ||
| ε ε16 | Amm2 | [8] | ||
| ε22 | orthorombic | [10] | ||
| ε34 | orthorombic | [10] |
Table 2.
Experimentally determined three-phase regions of the Al–Co–Pd system in the Al-rich corner of the phase diagram [10].
Table 2.
Experimentally determined three-phase regions of the Al–Co–Pd system in the Al-rich corner of the phase diagram [10].
| 1323 K | 1273 K | 1213 K | 1063 K |
|---|---|---|---|
| Al5Co2 + V + BCC-B2 | Al5Co2 + V + BCC-B2 | Al5Co2 + U + BCC-B2 | Al5Co2 + U + BCC-B2 |
| Al5Co2 + V + W | Al5Co2 + V + F | Al5Co2 + U + F | Al5Co2 + U + F |
| V + W + F | V + W + U | M-A13Co4 + A9Co2 + liquid | ε + A9Co2 + liquid |
| V + BCC-B2 + liquid | V + U + BCC-B2 | M-A13Co4 + Y + liquid | M-A13Co4 + Y + Al9Co2 |
| V + F + liquid | U + F + ε | U + F + ε | U + F + ε |
| Al5Co2 + W + Al3Co | Al5Co2 + M-Al13Co4 + Al3Co | Al5Co2 + M-Al13Co4 + Al3Co | Al5Co2 + M-Al13Co4 + Al3Co |
| W + F + liquid | Al5Co2 + M-Al13Co4 + F | Al5Co2 + M-Al13Co4 + F | Al5Co2 + M-Al13Co4 + ε |
| Al3Co + W + liquid | M-Al13Co4 + F + ε | M-Al13Co4 + F + ε | Al5Co2 + F + ε |
| M-A13Co4 + Al3Co + liquid | M-A13Co4 + ε + liquid | M-A13Co4 + ε + Y | M-A13Co4 + ε + Y |
| U + ε + liquid | Y + ε + liquid | Y + ε + Al9Co2 | |
| U + Al3Pd2 + liquid | U + Al3Pd2 + ε | U + Al3Pd2 + ε | |
| U + Al3Pd2 + BCC-B2 | U + Al3Pd2 + BCC-B2 | U + Al3Pd2 + C | |
| Al3Pd2 + BCC-B2 + liquid | Al3Pd2 + ε + liquid | U + C + BCC-B2 | |
| Al9Co2 + M-Al13Co4 + O-Al13Co4 | C + Al3Pd2 + BCC-B2 |
Table 3.
Thermodynamic parameters of the Al–Pd system.
| Phase | Thermodynamic Model | Parameters | Literature |
|---|---|---|---|
| Al4Pd | (Al)4(Pd)1 | G0(Al:Pd) = 4GALFCC + GPDFCC −170,737.44 + 51.21T | [18] |
| Al21Pd8 | (Al)21(Pd)8 | G0(Al:Pd) = 21GALFCC + 8GPDFCC-1281100 + 299*T | this work |
| Al3Pd2 | (Al%,Pd)3(Al,Co,Pd%)2 | G0(Al:Pd) = 3GALFCC + 2GPDFCC −269,541.8 + 37.214*T G0(Al:Co) = 3GALFCC + 2GCOHCP + 10,000 G0(Al:Al) = 5*GALFCC + 100,000 G0(Pd:Pd) = 5*GPDFCC + 50,000 G0(Pd:Co) = 3GPDFCC + 2GCOHCP + 10,000 G0(Pd:Al) = 2*GALFCC + 3*GPDFCC −55,033.89 + 20.82*T L0(Al,Pd:Pd) = −450,180.01 + 38.01*T L0(Al,Pd:Al) = −450,180.01 + 38.01*T L0(Al:Al,Pd) = −197,701.77 + 139.11*T L0(Pd:Al,Pd) = −197,701.77 + 139.11*T L0(Al:Co,Pd) = −182,000 L1(Al:Co,Pd) = 404,064.2 − 305.4*T L2(Al:Co,Pd) = −90,000 | this work this work [18] [18] this work [18] [18] [18] [18] [18] this work this work this work |
| Al3Pd5 | (Al)3(Pd)5 | G0(Al:Pd) = 3GALFCC + 5GPDFCC − 412146.0 + 22.799T | this work |
| AlPd2 | (Al%,Pd)1(Al,Pd%)2 | G0(Al:Pd) = GALFCC + 2GPDFCC −144,760.82 + 10.18T-0.596Tln(T) G0(Al:Al) = 3GALFCC + 100,000 G0(Pd:Pd) = 3GPDFCC + 100,000 G0(Pd:Al) = 2GALFCC + GPDFCC + +23,168.36 + 42.11T L0(Al:Al,Pd) = −392,380.23 + 110.03T L0(Pd:Al,Pd) = −392,380.23 + 110.03T L0 (Al,Pd:Al) = −235,761.01 + 45.04T L0(Al,Pd:Al) = −235,761.01 + 45.04T | [18] [18] [18] [18] [18] [18] [18] [18] |
| Al2Pd5 | (Al)2(Al,Pd%)5 | G0(Al:Pd) = 2GALFCC + + 5GPDFCC-329,912.86 + 21.86T G0(Al:Al) = 7GALFCC + 100,000 L0(Al:Al,Pd) = −660,821.07 + 94.89T | [18] [18] [18] |
| Al3Pd (ε) | (Al)3(Co,Pd)1 | G0(Al:Pd) = + 3GALFCC + GPDFCC −151,076.48 + 26.51*T G0(Al:Co) = 3GALFCC + GCOHCP + 3000 L0(Al:Co, Pd) = −643,900 + 300*T L1(Al:Co, Pd) = −1,199,323.4 + 741.8*T | [18] this work this work this work |
| AlPd-β (BCC-B2) | (Al,Co,Pd,Va)0.5(Al,Co,Pd,Va)0.5 | G0(Al:Pd) = G0(Pd:Al) = −78,155 + 4.229*T G0(Al:Co) = G0(Co:Al) = −90,643.5 + 28.66*T G0(Co:Pd) = G0(Pd:Co) = 0G0(Al:Al) = 0 G0(Pd:Pd) = 0 G0(Va:Va) = 0 G0(Co:Co) = 0 G0(Co:Va) = G0(Va:Co) = 0 G0(Al:Va) = G0(Va:Al) = 0 G0(Pd:Va) = G0(Va:Pd) = 0 L0(Co,Va:Al) = L0(Al:Co,Va) = −56,770 − 18*T L0(Pd,Va:Al) = L0(Al:Pd,Va) = −130,957.6 + 17.796*T L1(Pd,Va:Al) = L1(Al:Pd,Va) = 6610 − 24.2*T L0(Pd:Al,Va) = L0(Al,Va:Pd) = −138,953.4 + 14.48*T L0(Al,Pd:Al) = L0(Al:Al,Pd) = 5000 Tc0(Al:Co) = −1400 Tc0(Co:Al) = −1400 | this work [16] this work this work this work [16] [16] [16] this work this work [16] this work this work this work this work [16] [16] |
| BCC-A2* | (Al,Co,Pd,Va)1 | G0(Va) = 30*T | [16] |
| L0(Al,Va) = 46,912 | [16] | ||
| L0(Al,Va) = 46,912 L0(Co,Va) = 126,184 L0(Al,Co) = −95,207 + 2.52*T L0(Al,Pd) = −110,580.8 + 25.373*T L1(Al,Pd) = −10,000 + 33.33*T L2(Al,Pd) = 65,384 − 30*T L0(Pd,Va) = 46,989 + 17.5*T L1(Pd,Va) = 20,000 L2(Pd,Va) = 0 BM0(Co) = 1.35 Tc0(Co) = 1450 | [16] [16] [16] this work this work this work this work this work this work [16] [16] | ||
| FCC | (Al,Co,Pd)1(Va) | L0(Al,Pd:Va) = −164,947.99 + 23.32T L1(Al,Pd:Va) = 112,770.39 − 29.38T L0(Co,Pd:Va) = −3823.8058 − 11.2238*T L1(Co,Pd:Va) = 14,981.6511 + 4.5668*T L2(Co,Pd:Va) = 7750.8429 − 11.3802*T L0(Al,Co:Va) = −124,200 + 17.24*T L1(Al,Co:Va) = 0 L2(Al,Co:Va) = 28,740 BM0(Co:Va) = 1.35 Tc0(Co:Va) = 1396 BM0(Al,Co:Va) = 10 Tc0(Al,Co:Va) = −1500 Tc1(Al,Co:Va) = 650 BM0(Co,Pd:Va) = 1.3224 BM1(Co,Pd:Va) = −1.5504 Tc0(Co,Pd:Va) = 1110.1 Tc1(Co,Pd:Va) = −536.76 | [18] [18] [17] [17] [17] [16] [16] [16] [16] [16] [16] [16] [16] [17] [17] [17] [17] |
| Al9Co2 | (Al)9(Co,Pd)2 | G0(Al:Co) = 2GCOHCP + 9GALFCC −329,700 + 53.14*T + G0(Al:Pd) = 9GALFCC + 2GPDFCC + 5500 L0(Al:Co, Pd) = −1,260,660 + 820T | [16] this work this work |
| Al13Co4 | (Al)13(Co,Pd)4 | G0(Al:Co) = 13GALFCC + 4GCOHCP-659,712 + +125*T G0(Al:Pd) = 13GALFCC + 4GPDFCC + 10,000 L0(Al:Co, Pd) = −2,526,800 + 1600*T | [16] this work this work |
| Al3Co | (Al)3(Co,Pd) | G0(Al:Co) = 3GALFCC + GCOHCP-164946 + + 32.725*T G0(Al:Pd) = 3GALFCC + GPDFCC + 4000 L0(Al:Co, Pd) = −82,400 | [16] this work this work |
| Al5Co2 | (Al)5(Co,Pd)2 | G0(Al:Co) = 5GALFCC + 2GCOHCP − 329,990 +73.45*T | [16] |
| G0(Al:Pd) = 5GALFCC + 2*GPDFCC + 3500 L0(Al:Co, Pd) = −1,493,000 + 1000*T | this work this work | ||
| liquid | (Al,Co,Pd)1 | L0(Al,Pd) = −226,803.7 + 52.2T + 0.048Tln(T) L1(Al,Pd) = 82,765.11 − 17.86T L0(Co,Pd) = 7138.5759 − 25.3266*T L1(Co,Pd) = 577.0929 + 11.6265*T L2(Co,Pd) = −4644.7671 − 3.7536*T L0(Al,Co) = −150,510 + 33.729*T L1(Al,Co) = −54,090 + 26.8*T L2(Al,Co) = 65,430 − 22.4*T | [18] [18] [17] [17] [17] [16] [16] [16] |
| hcp | (Al,Co)1 | ΒM0(Co) = 1.35 Tc0(Co) = 1396 | [16] [16] |
| V | (Al)0.7(Pd)0.09(Co)0.21 | G0(Al:Pd:Co) = 0.7GALFCC + 0.09GPDFCC + + 0.21GCOHCP-56,869.78 + 15.86*T | this work |
| F | (Al)0.73(Pd)0.09(Co)0.18 | G0(Al:Pd:Co) = 0.73GALFCC + 0.09GPDFCC + 0.18GCOHCP-134,614.25644 + +517.7995419654*T-61.361890945*T*LN(T) −330,383.260065641*T**(-1) | this work |
| W | (Al)0.72(Pd)0.04(Co)0.24 | G0(Al:Pd:Co) = 0.72GALFCC + 0.04GPDFCC + 0.24GCOHCP-33540 | this work |
| U | (Al)0.704(Pd)0.113(Co,Pd)0.183 | G0(Al:Pd:Co) = 0.704GALFCC + 0.113GPDFCC + 0.183GCOHCP-61,957.8334 + +19.8334*T G0(Al:Pd:Pd) = 0.704GALFCC + 0.296GPDFCC + 1000 L0(Al:Pd:Co,Pd) = −92,107.538461 + 48.153846*T | this work this work this work |
| Y | (Al)0.765(Pd)0.03(Co)0.205 | G0(Al:Pd:Co) = 0.765GALFCC + 0.03GPDFCC + +0.205GCOHCP-49,460.165936 + 15.353872*T | this work |
| C2 | (Al)0.63(Pd)0.27(Co)0.1 | G0(Al:Pd:Co) = 0.63GALFCC + 0.27GPDFCC + +0.1GCOHCP-70,201.48479706 + +22.86122746*T | this work |
Publisher’s Note: MDPI stays neutral with regard to jurisdictional claims in published maps and institutional affiliations. |
© 2021 by the authors. Licensee MDPI, Basel, Switzerland. This article is an open access article distributed under the terms and conditions of the Creative Commons Attribution (CC BY) license (https://creativecommons.org/licenses/by/4.0/).
Share and Cite
MDPI and ACS Style
Homolová, V.; Kroupa, A. Thermodynamic Modeling of the Al–Co–Pd Ternary System, Aluminum Rich Corner. Metals 2021, 11, 1803. https://doi.org/10.3390/met11111803
AMA Style
Homolová V, Kroupa A. Thermodynamic Modeling of the Al–Co–Pd Ternary System, Aluminum Rich Corner. Metals. 2021; 11(11):1803. https://doi.org/10.3390/met11111803
Chicago/Turabian StyleHomolová, Viera, and Aleš Kroupa. 2021. "Thermodynamic Modeling of the Al–Co–Pd Ternary System, Aluminum Rich Corner" Metals 11, no. 11: 1803. https://doi.org/10.3390/met11111803
Note that from the first issue of 2016, this journal uses article numbers instead of page numbers. See further details here.