3.1. Heat-Treated (Initial) State of the Alloys
Characterization of the microstructure of the heat-treated (initial) state of the materials is very complex, as it is presented below. The HT alloys contain eutectic phases at grain boundaries; eutectic volume fraction was observed comparable for both alloys—an overview is shown in
Figure 1.
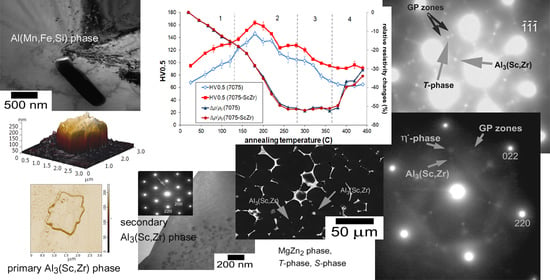
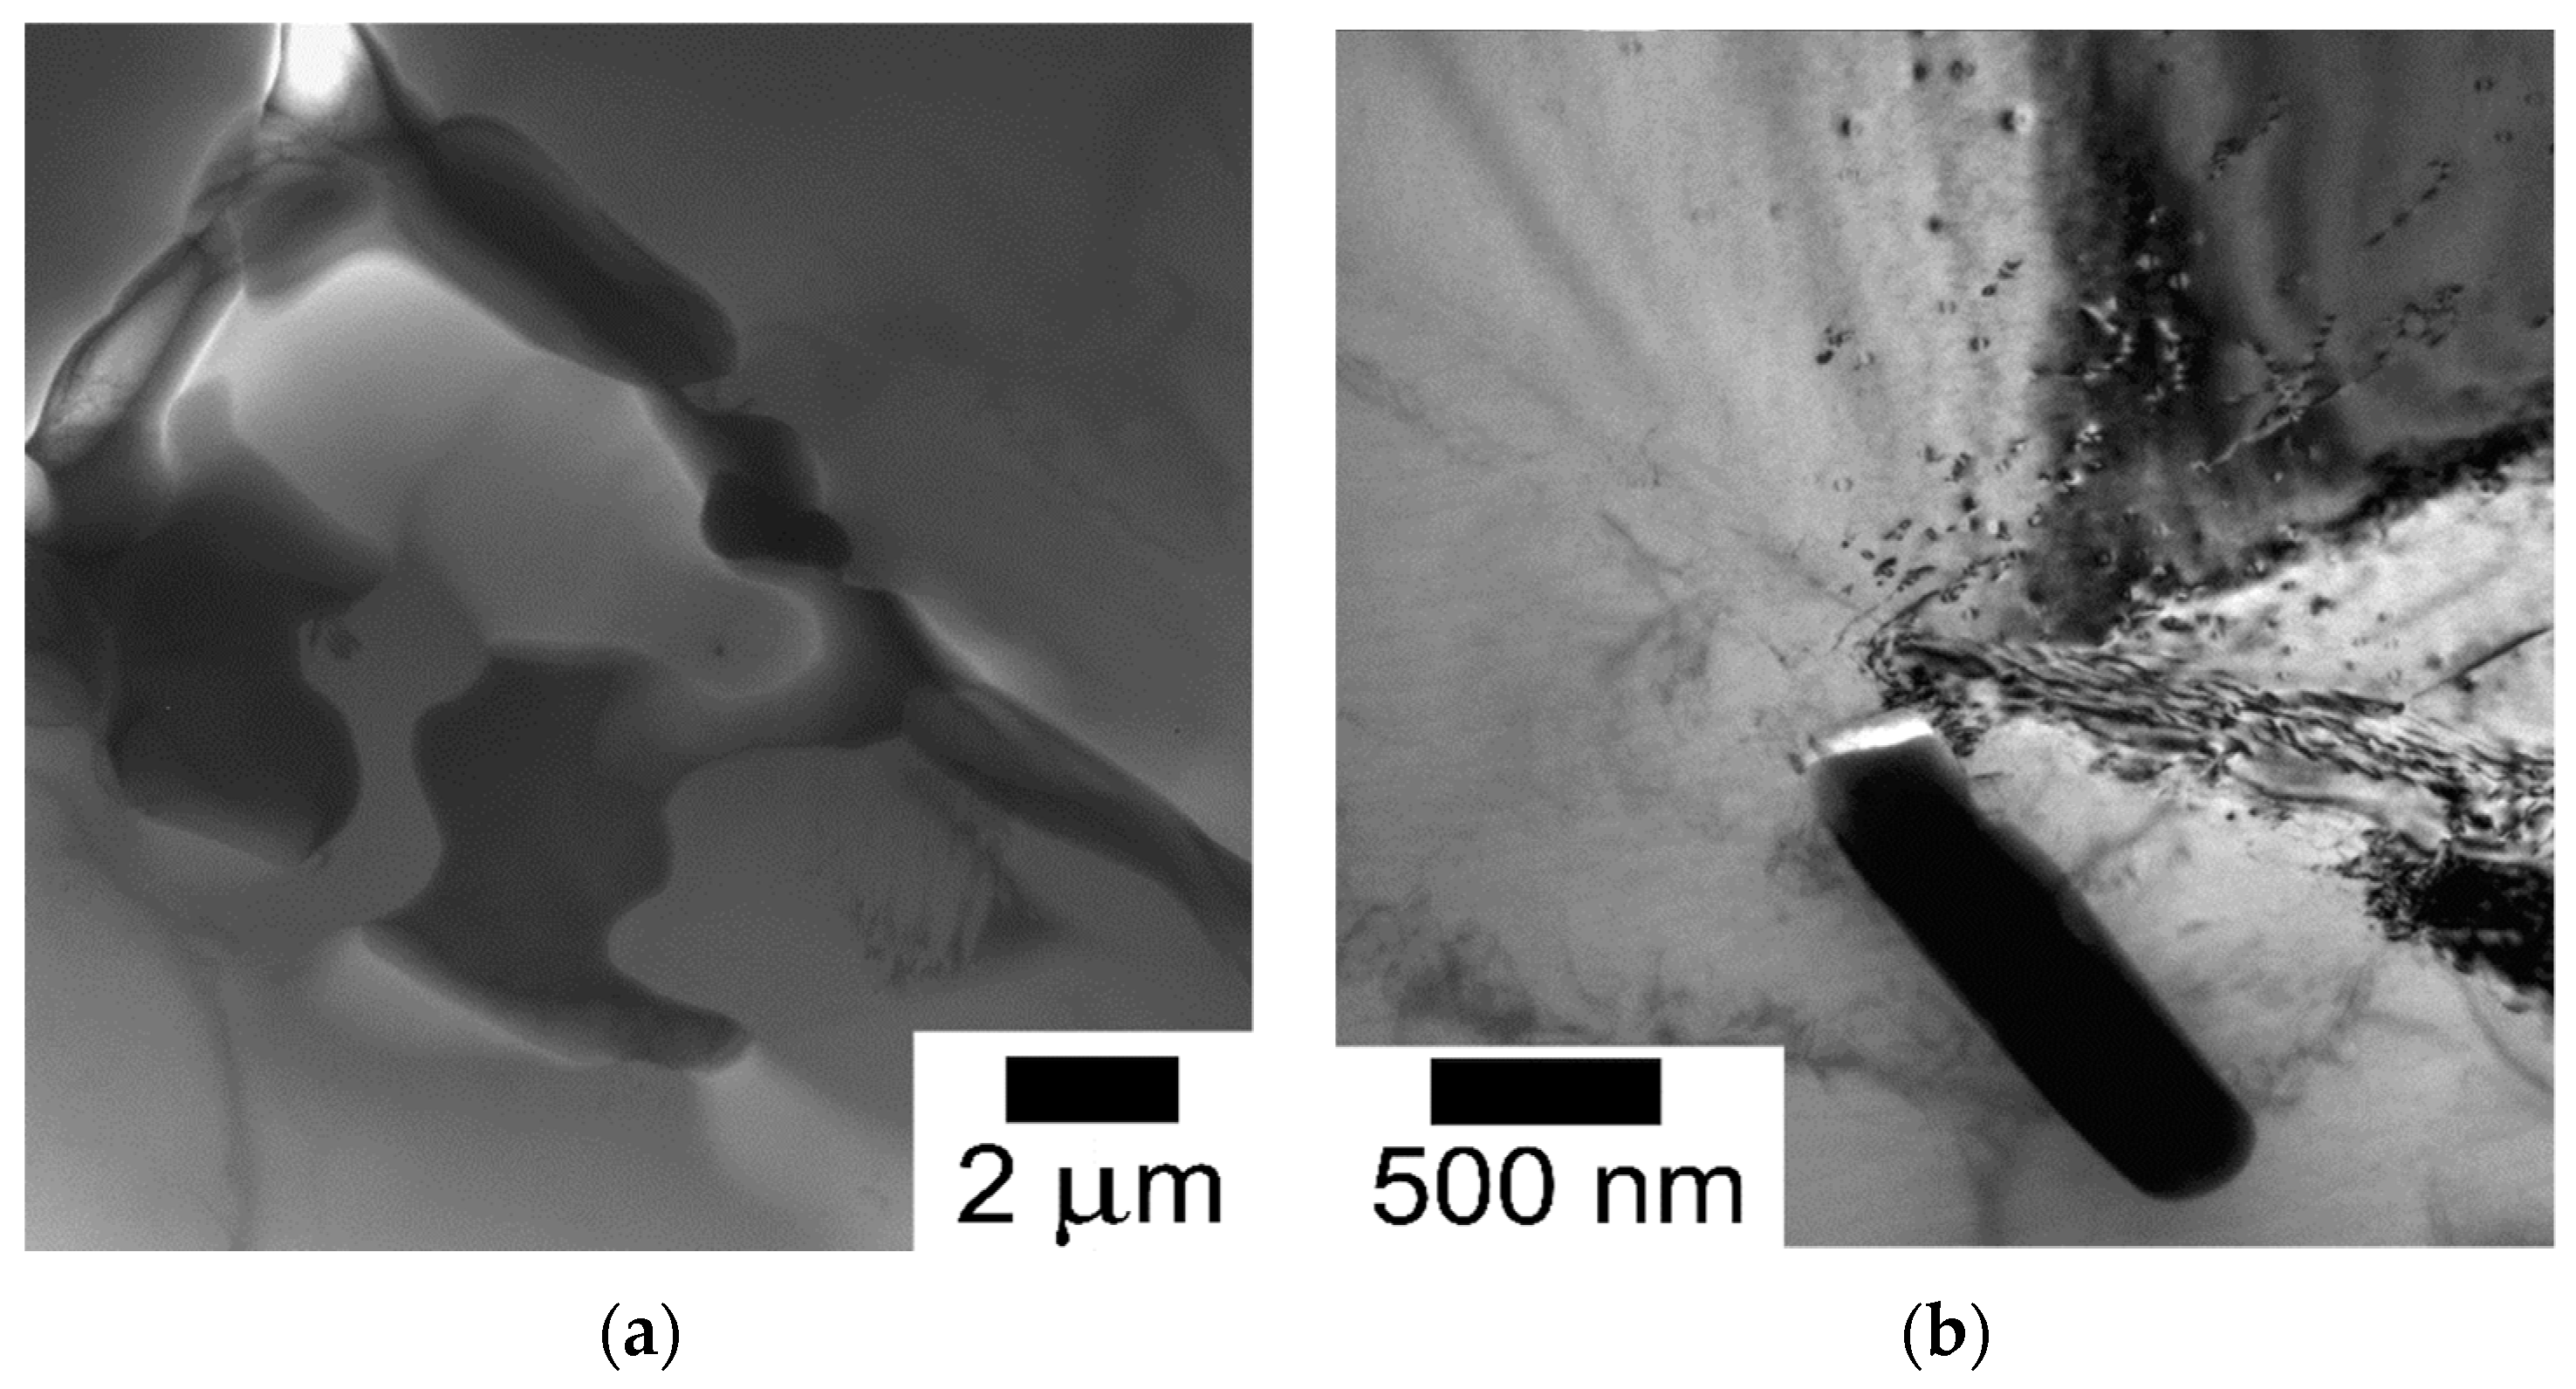
Figure 2 presents TEM picture of the eutectic phase(s) and the Mn,Fe,Si-containing particle at grain boundary of the 7075-ScZr alloy. Eutectic boundary phases and their composition in the alloy containing Sc–Zr addition were determined by EDS match as the MgZn
2 phase and
S-phase (Al
2CuMg). Although electron diffraction (ED) was not sufficiently conclusive, it can be assumed in the light of our previous research in the hot-deformed 7075(-ScZr) alloys (see References [
15,
20]) that the Mn,Fe,Si-containing particle is very likely the primary cubic
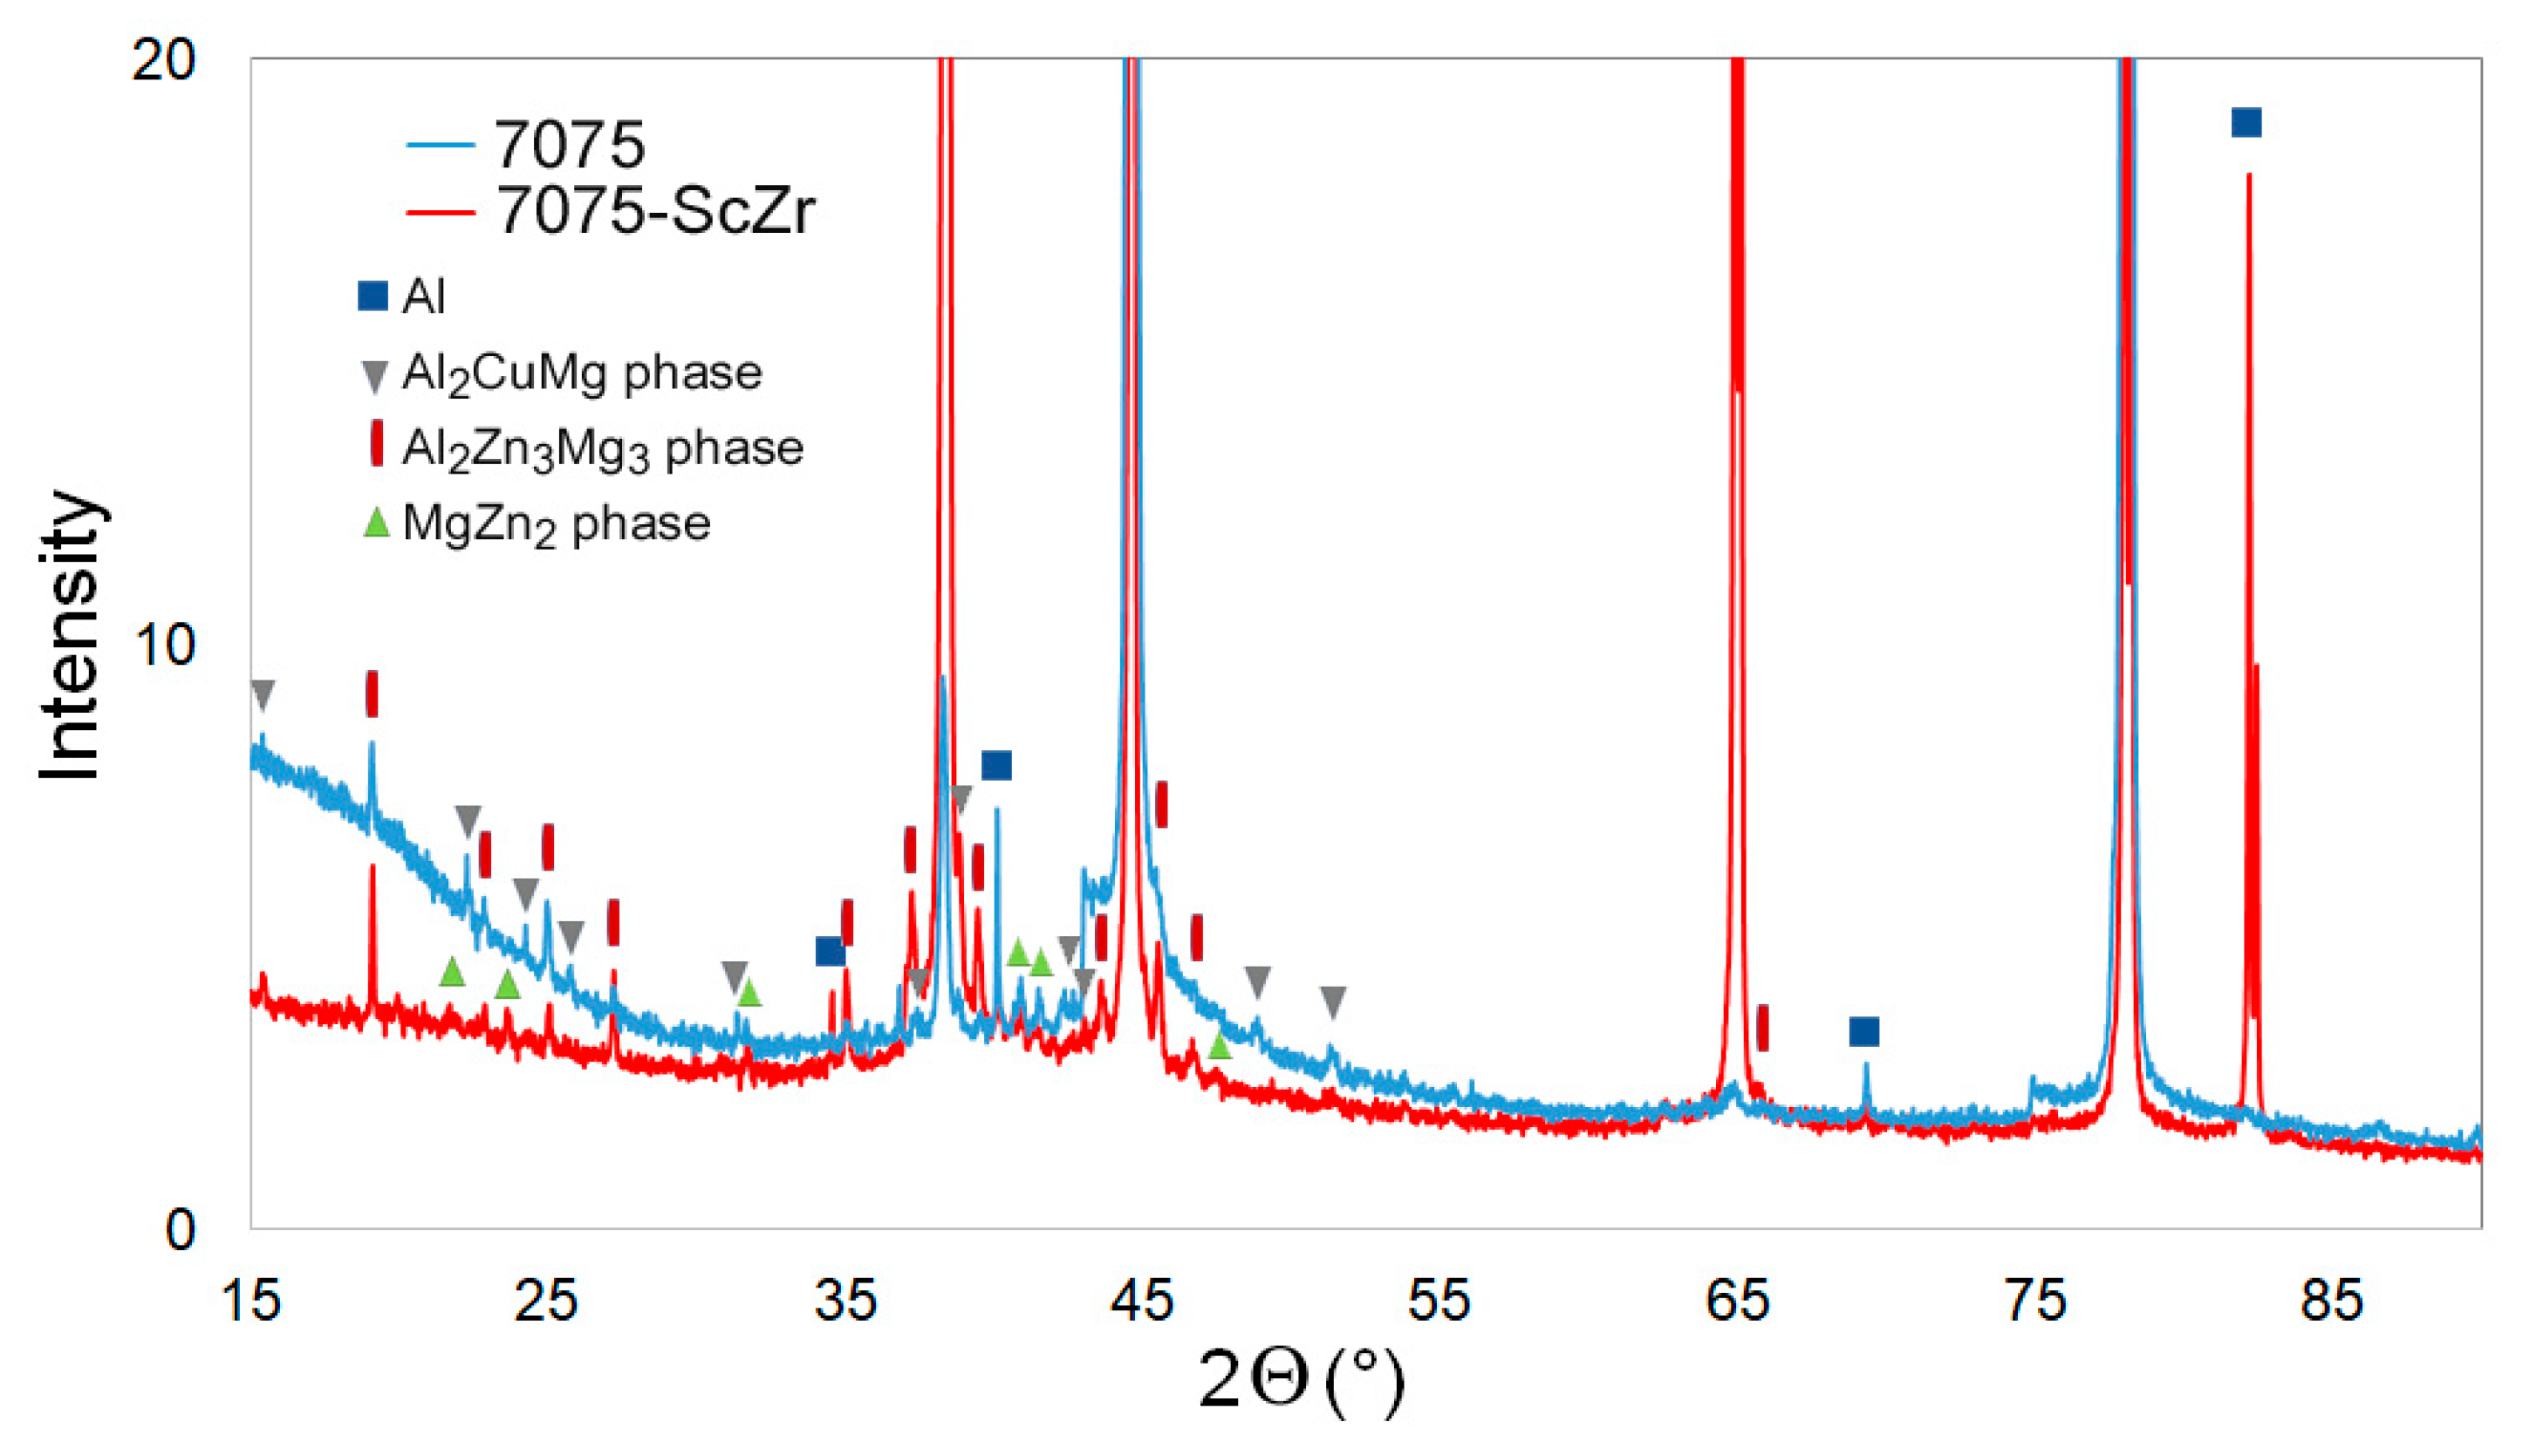
λ-Al(Mn,Fe,Si) phase. The presence (indirectly also the composition) of the eutectic phases was confirmed by XRD, see
Figure 3. In these measurements another phase was proved:
T-phase (the phase belongs to the Al
2Zn
3Mg
3 or Mg
32(Al,Cu,Zn)
49 structural type of phases). The same eutectic phase in the as-cast and hot-deformed state of the Al–Zn–Mg–Cu-based alloys was observed—see References [
15,
19,
20]. With respect to the TEM and EDS results, it can be assumed that the MgZn
2 phase is also distinguishable in the XRD results, although the peaks of this phase are very weak and may be affected by the background. In view of results obtained by XRD, it can be said that the content of primary Mn,Fe,Si-containing particles observed by TEM may be relatively small and inhomogeneous.
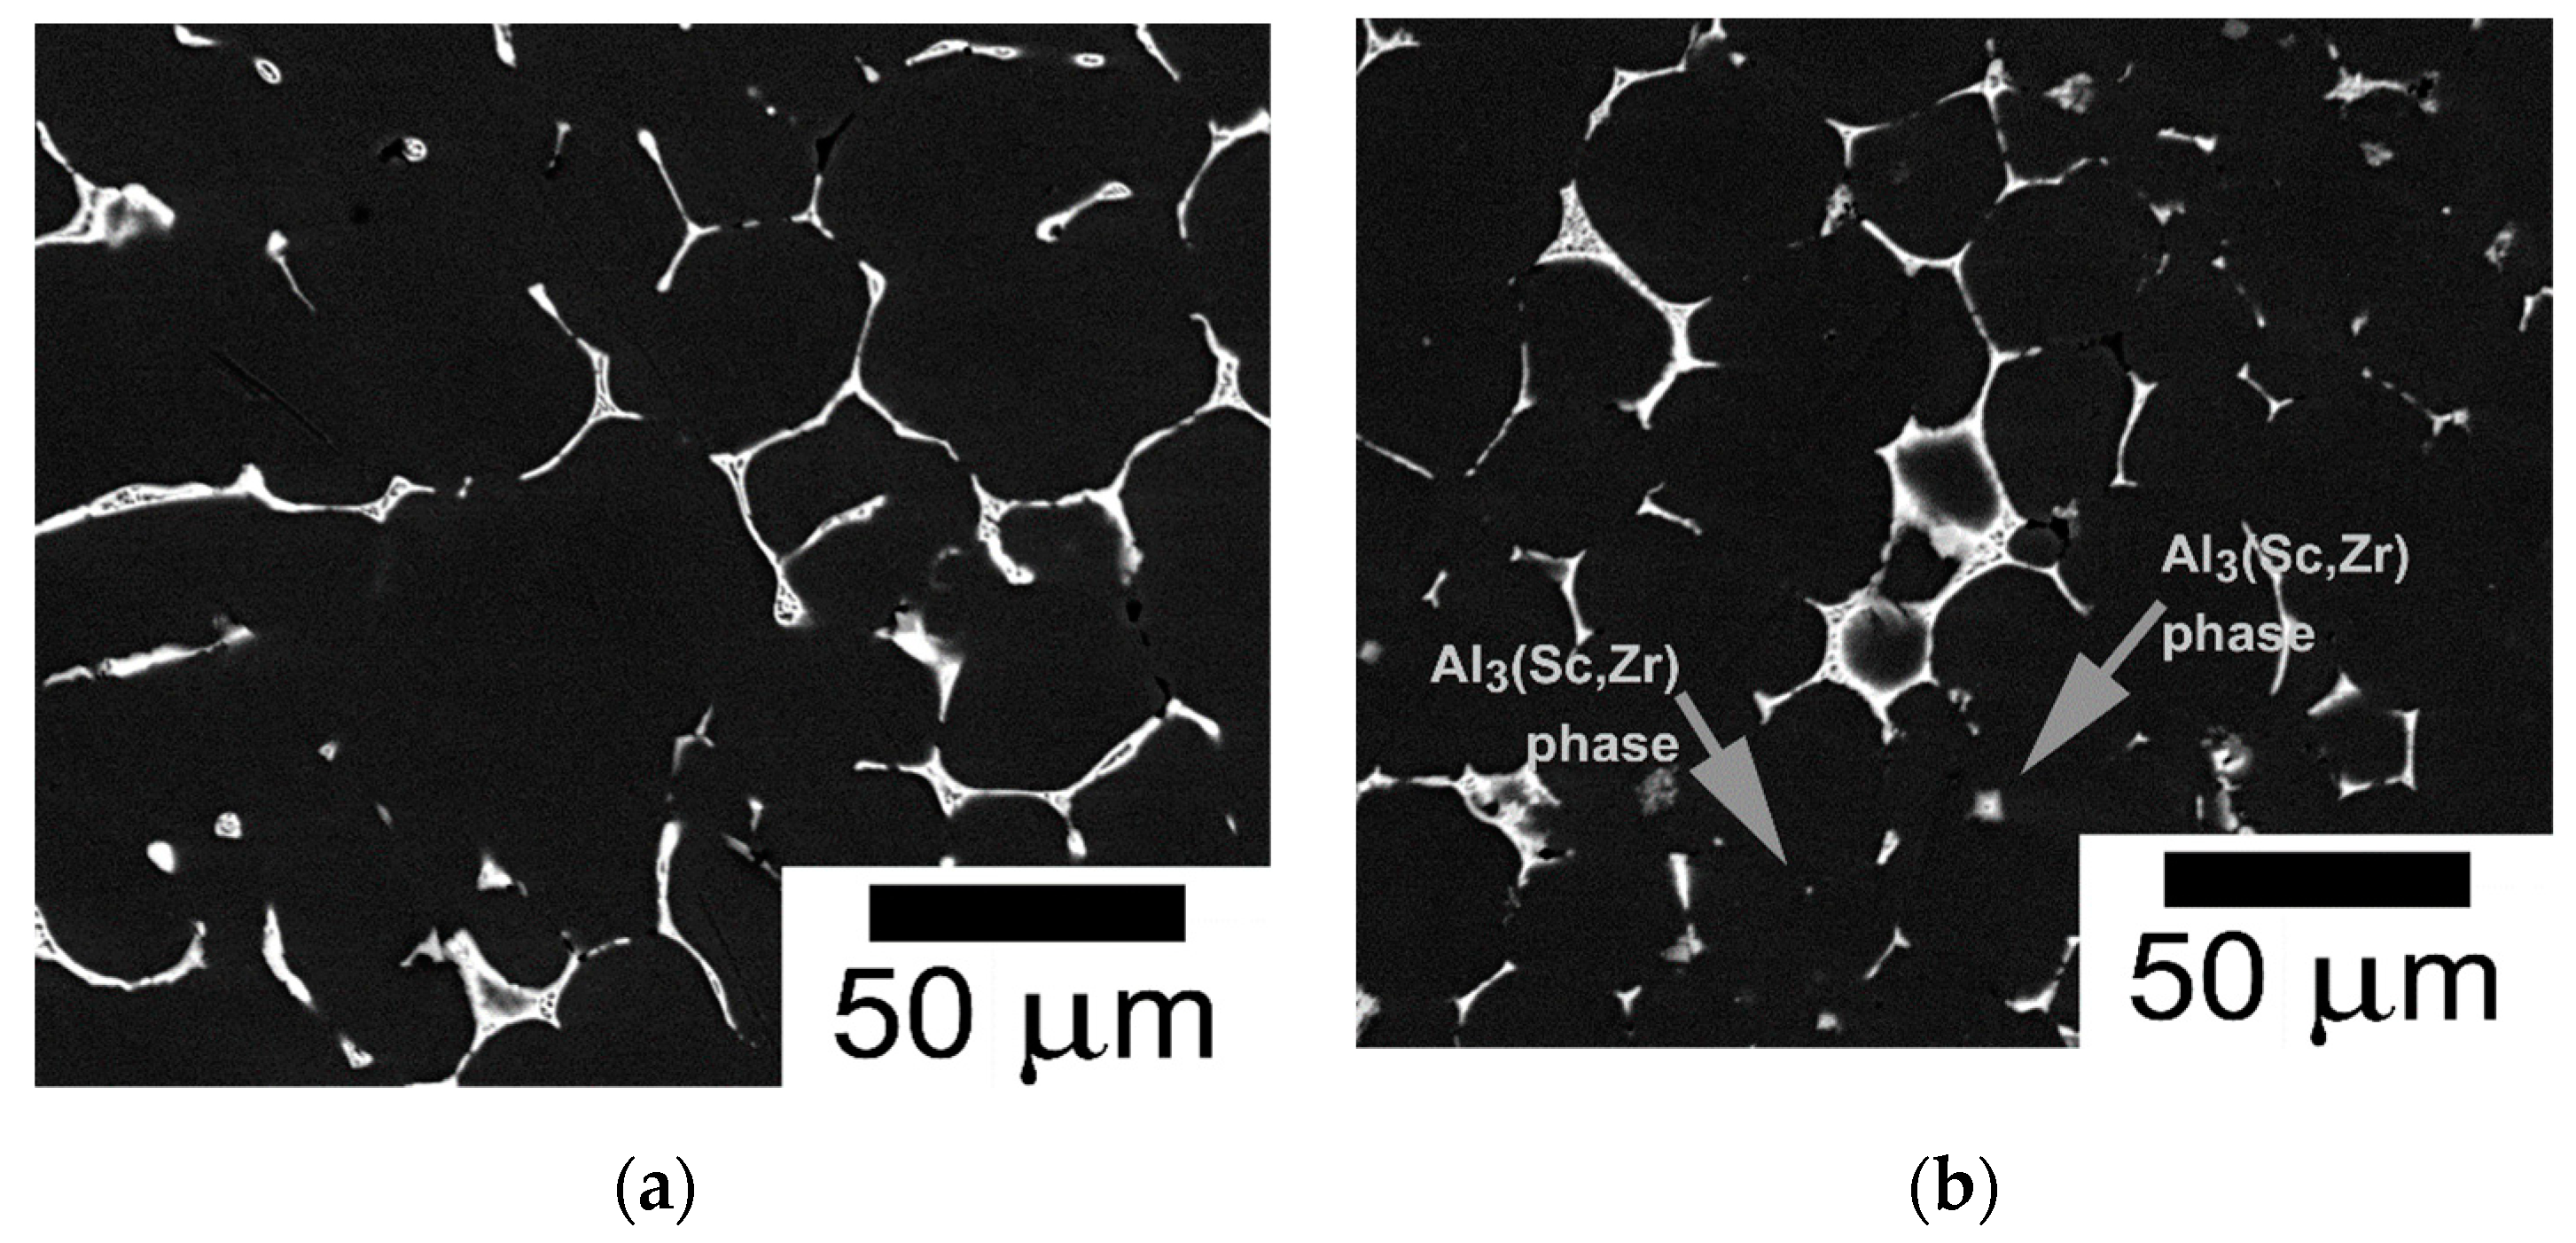
The Sc,Zr-containing particles that correspond to the primary phase were also revealed in the 7075-Sc,Zr alloy in the HT state in several grains (
Figure 1 and
Figure 4). Although the structure of the Sc(Zr)-containing particles is greatly dependent on the composition (and heat treatment routes), very similar structure (square and polygonal shapes) of the primary Sc,Zr-containing particles was detected in the Al–Mg–Sc-based [
45,
46,
47] and Al–Zn–Mg–Sc-based alloys [
15,
19,
20,
48].
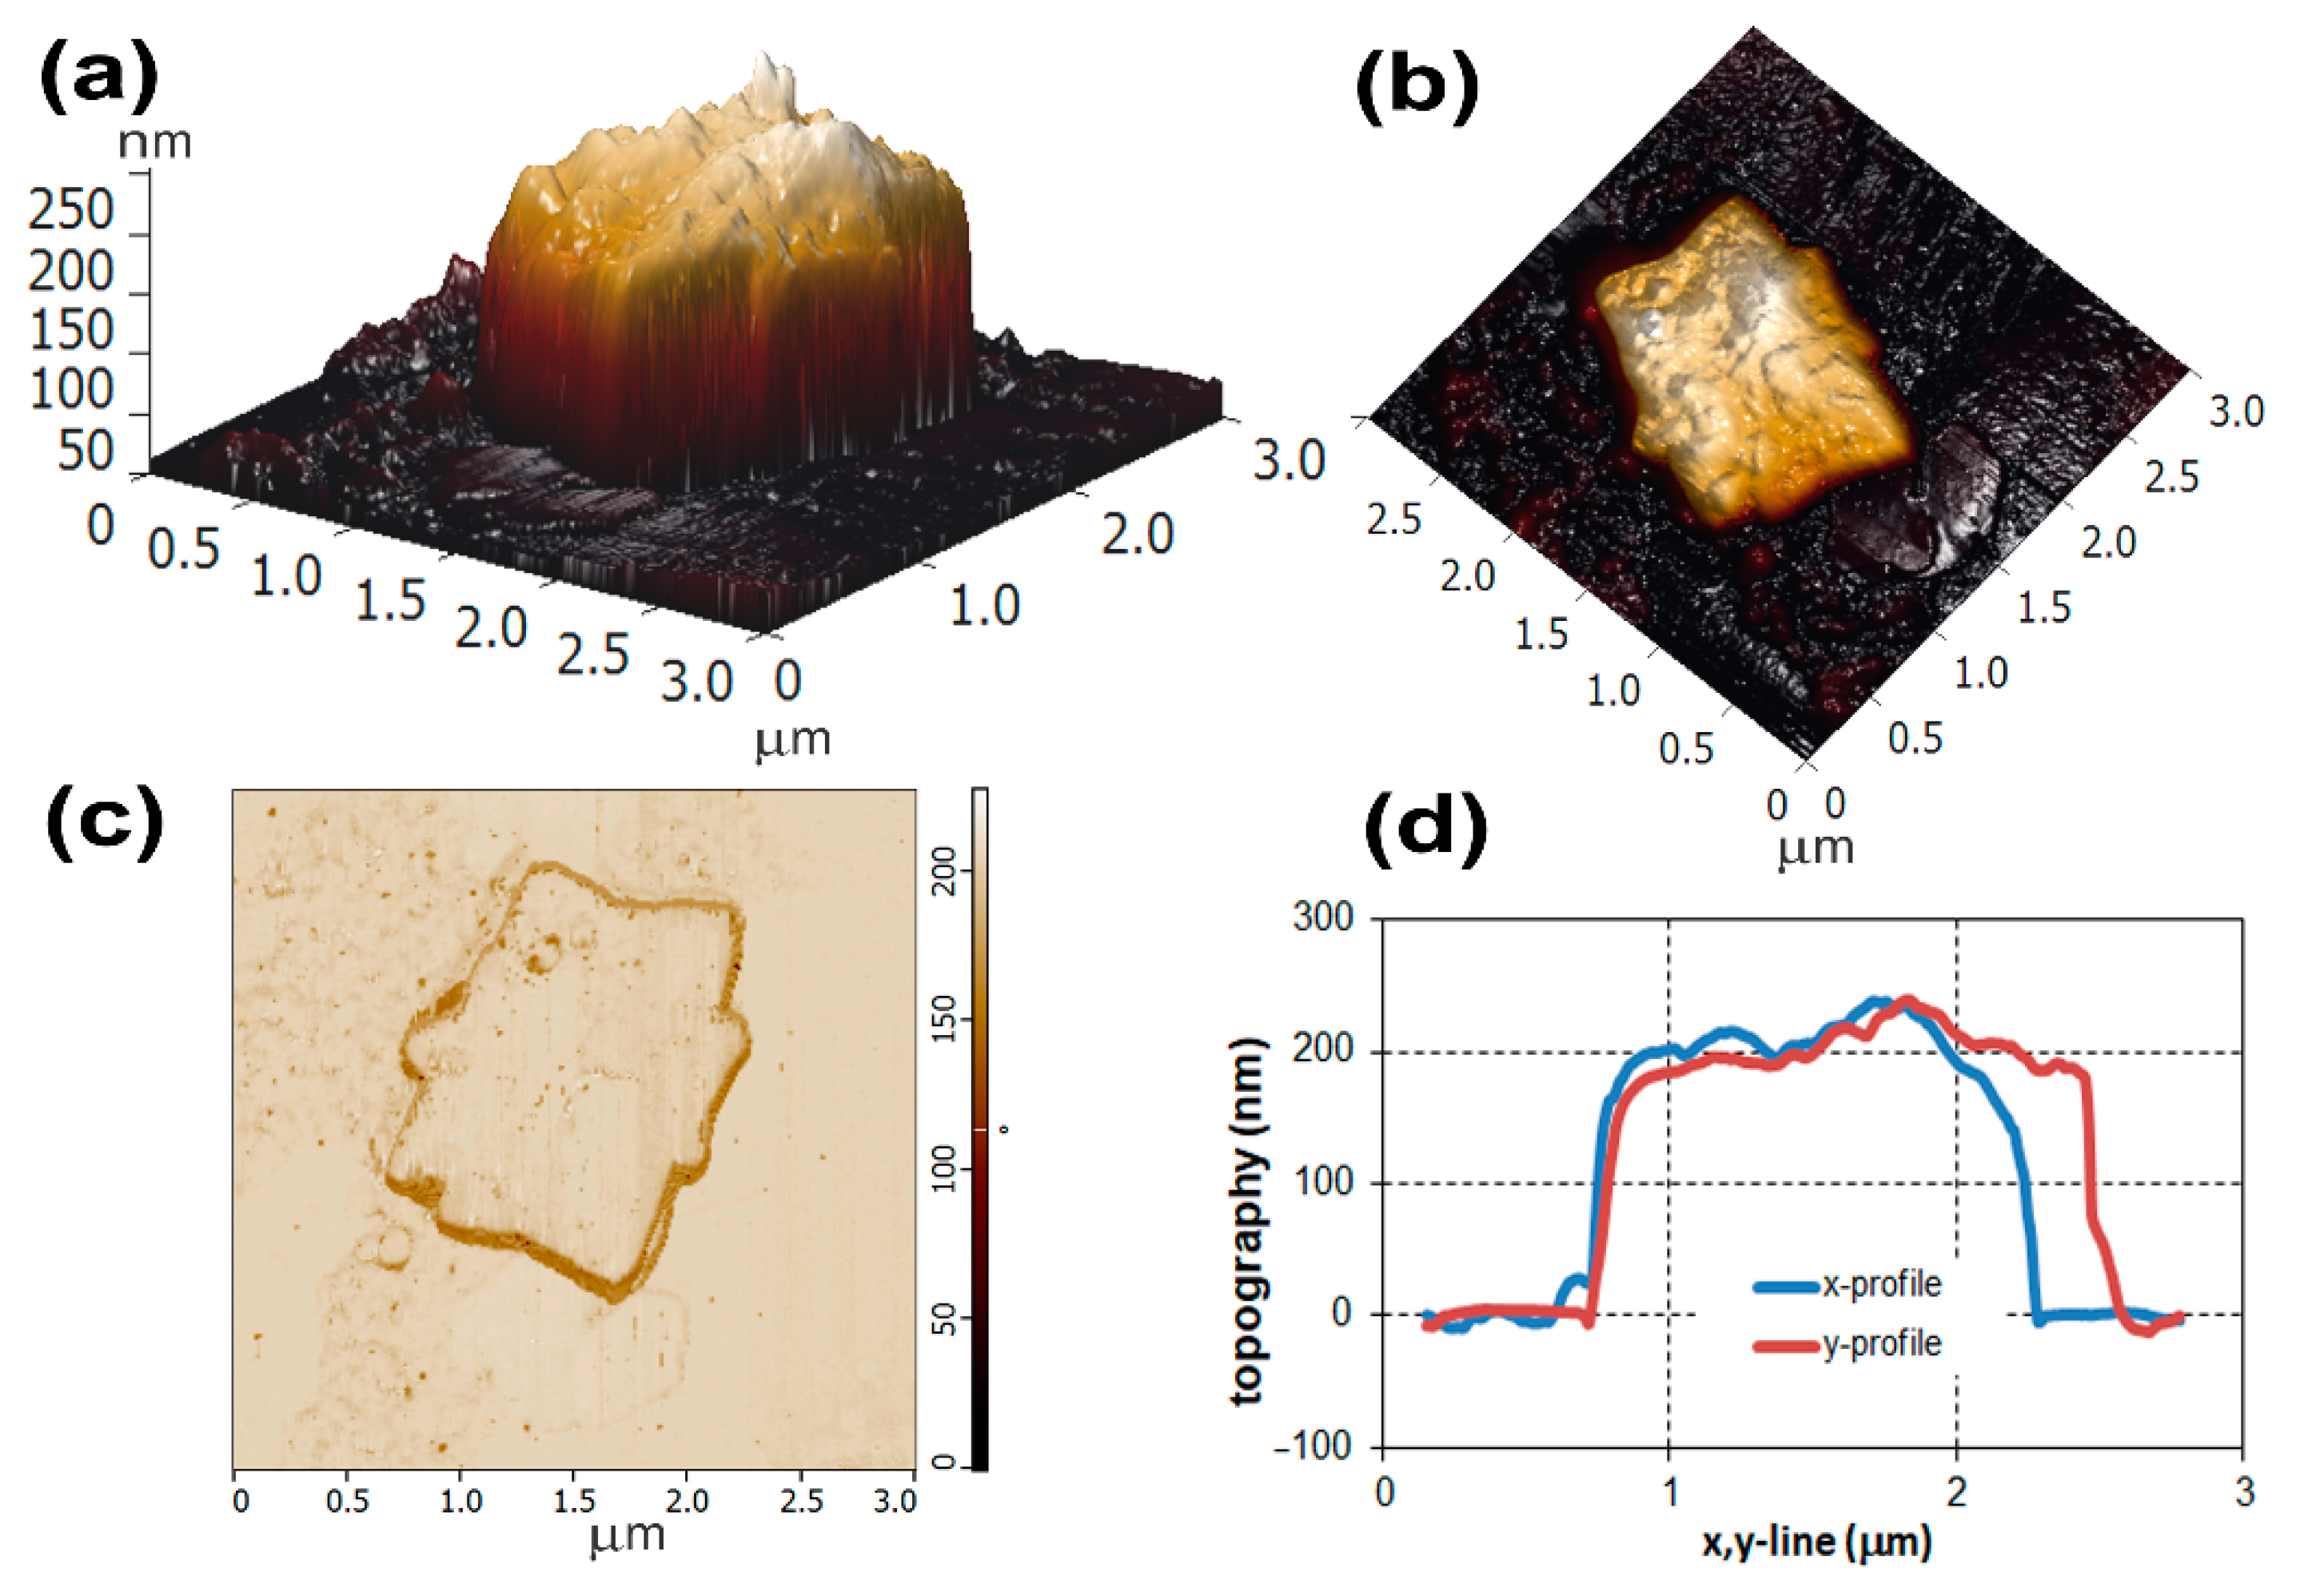
Figure 4 shows an AFM image according to the EDS observation of a selected primary Al
3(Sc,Zr)-phase particle in the 7075-ScZr material. In contrary to the primary Al
3Sc particles (References [
45,
46,
47]), where a deep hole in the center surrounded by an area of several shell-like layers characterized by variant depths was proved, the incoherent Sc,Zr-containing particles detected here have heights falling in the interval of about 200–300 nm. Thus it can be concluded that significant altitude difference of the layers of the primary Sc-containing particles (References [
45,
46,
47]), the inner central pothole, the less deep profound interlayer, the same profound of the inner convex layer around the pothole, and the marginal layer can be induced by different resistance of various layers of the primary particles to the electro-polishing before AFM observation. The surface of specimens for AFM observations was prepared only by a standard metallographic mechanical polishing and no electro-polishing was applied. It is therefore questionable whether electro-polishing connected with possible selected erosion in the sample preparation for the characterization of the Al-based materials with Sc–Zr addition by AFM should be avoided. However, this conclusion would require a more detailed examination which is not the subject of this work.
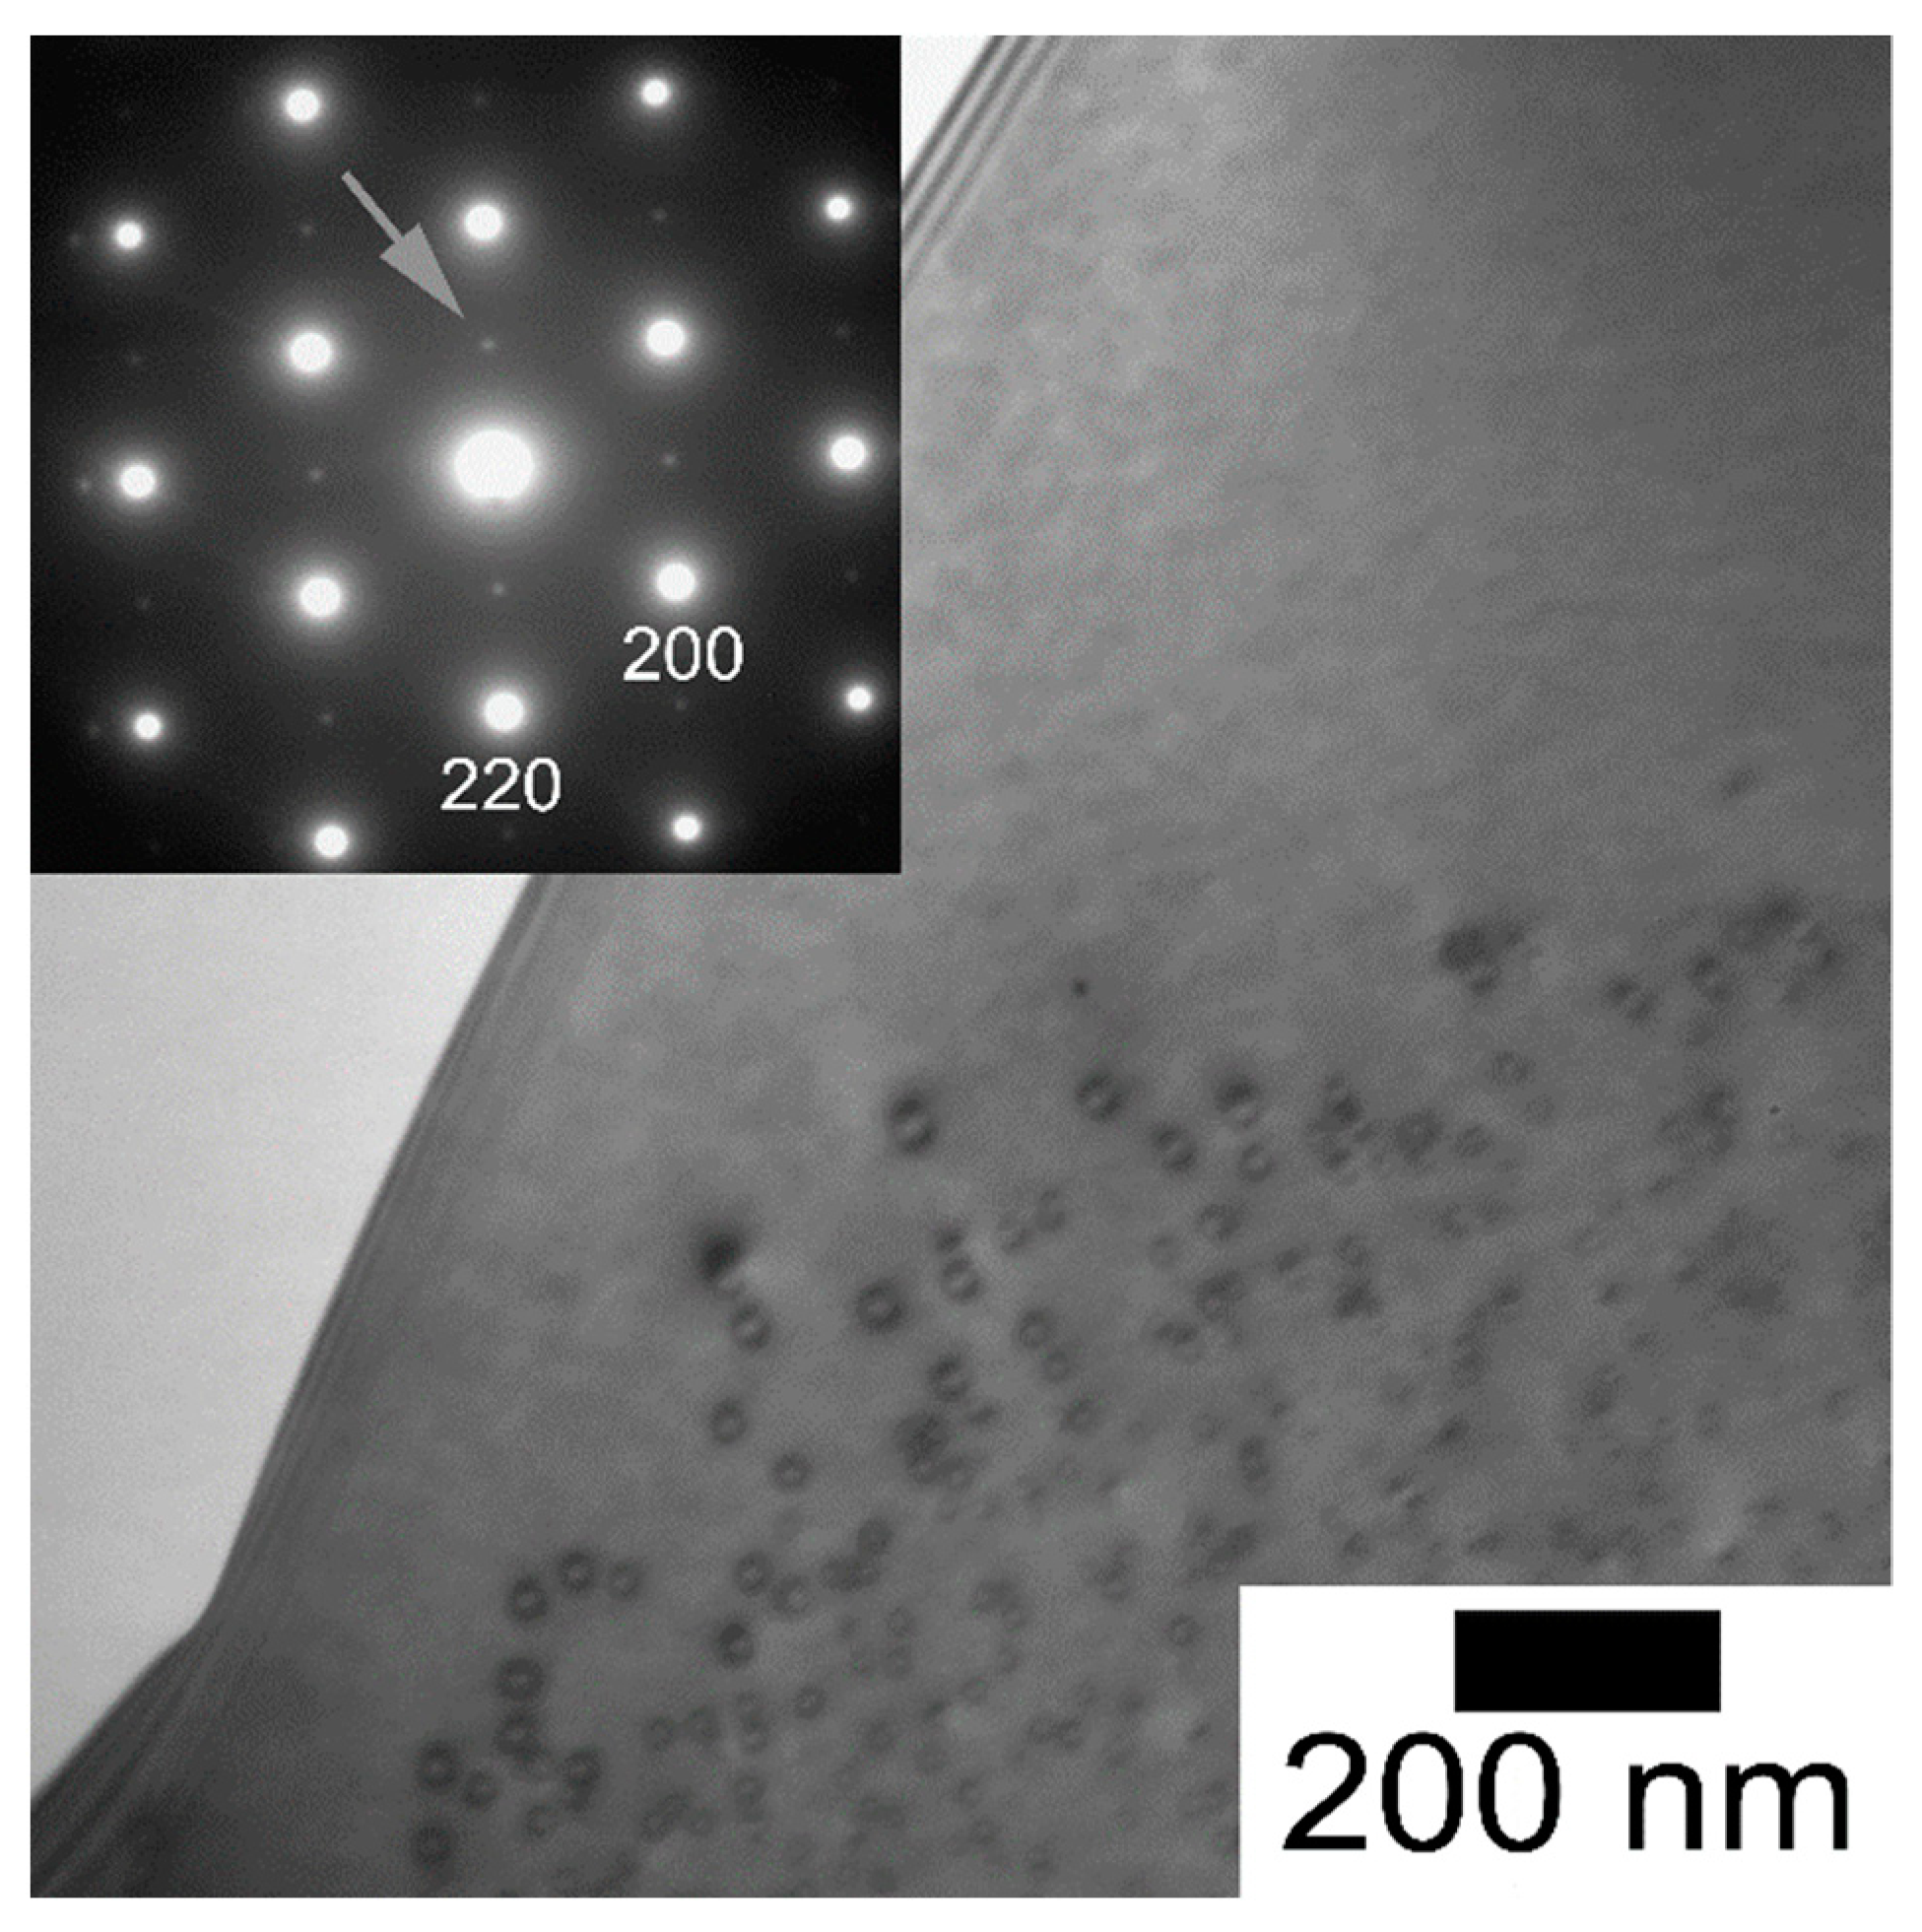
Formation of the coherent secondary Al
3(Sc,Zr) particles (L1
2/cP4 structure) with the size of 10–50 nm predominantly situated in grain interiors and denuded zones created along boundaries of the grains were also revealed in the heat-treated 7075-ScZr alloy (
Figure 5). The particle dispersion shows a typical contrast of “the coffee bean”. ED pattern of the L1
2-structured precipitates is shown as inset in
Figure 5. No precipitates other than the Al
3(Sc,Zr) were observed inside grains by TEM, which means that other phases (if any) inside grains have very low volume fraction. Compared to the as-cast state of the alloys (see Reference [
19]), it means that the high-temperature annealing (isothermal annealing at 470 °C/60 min) is sufficient to dissolve the precipitates from the Al–Zn–Mg–Cu system inside grains, but at the same time the particles from the Al–Sc–Zr system can precipitate.
3.2. Natural Ageing of the Heat-Treated Alloys
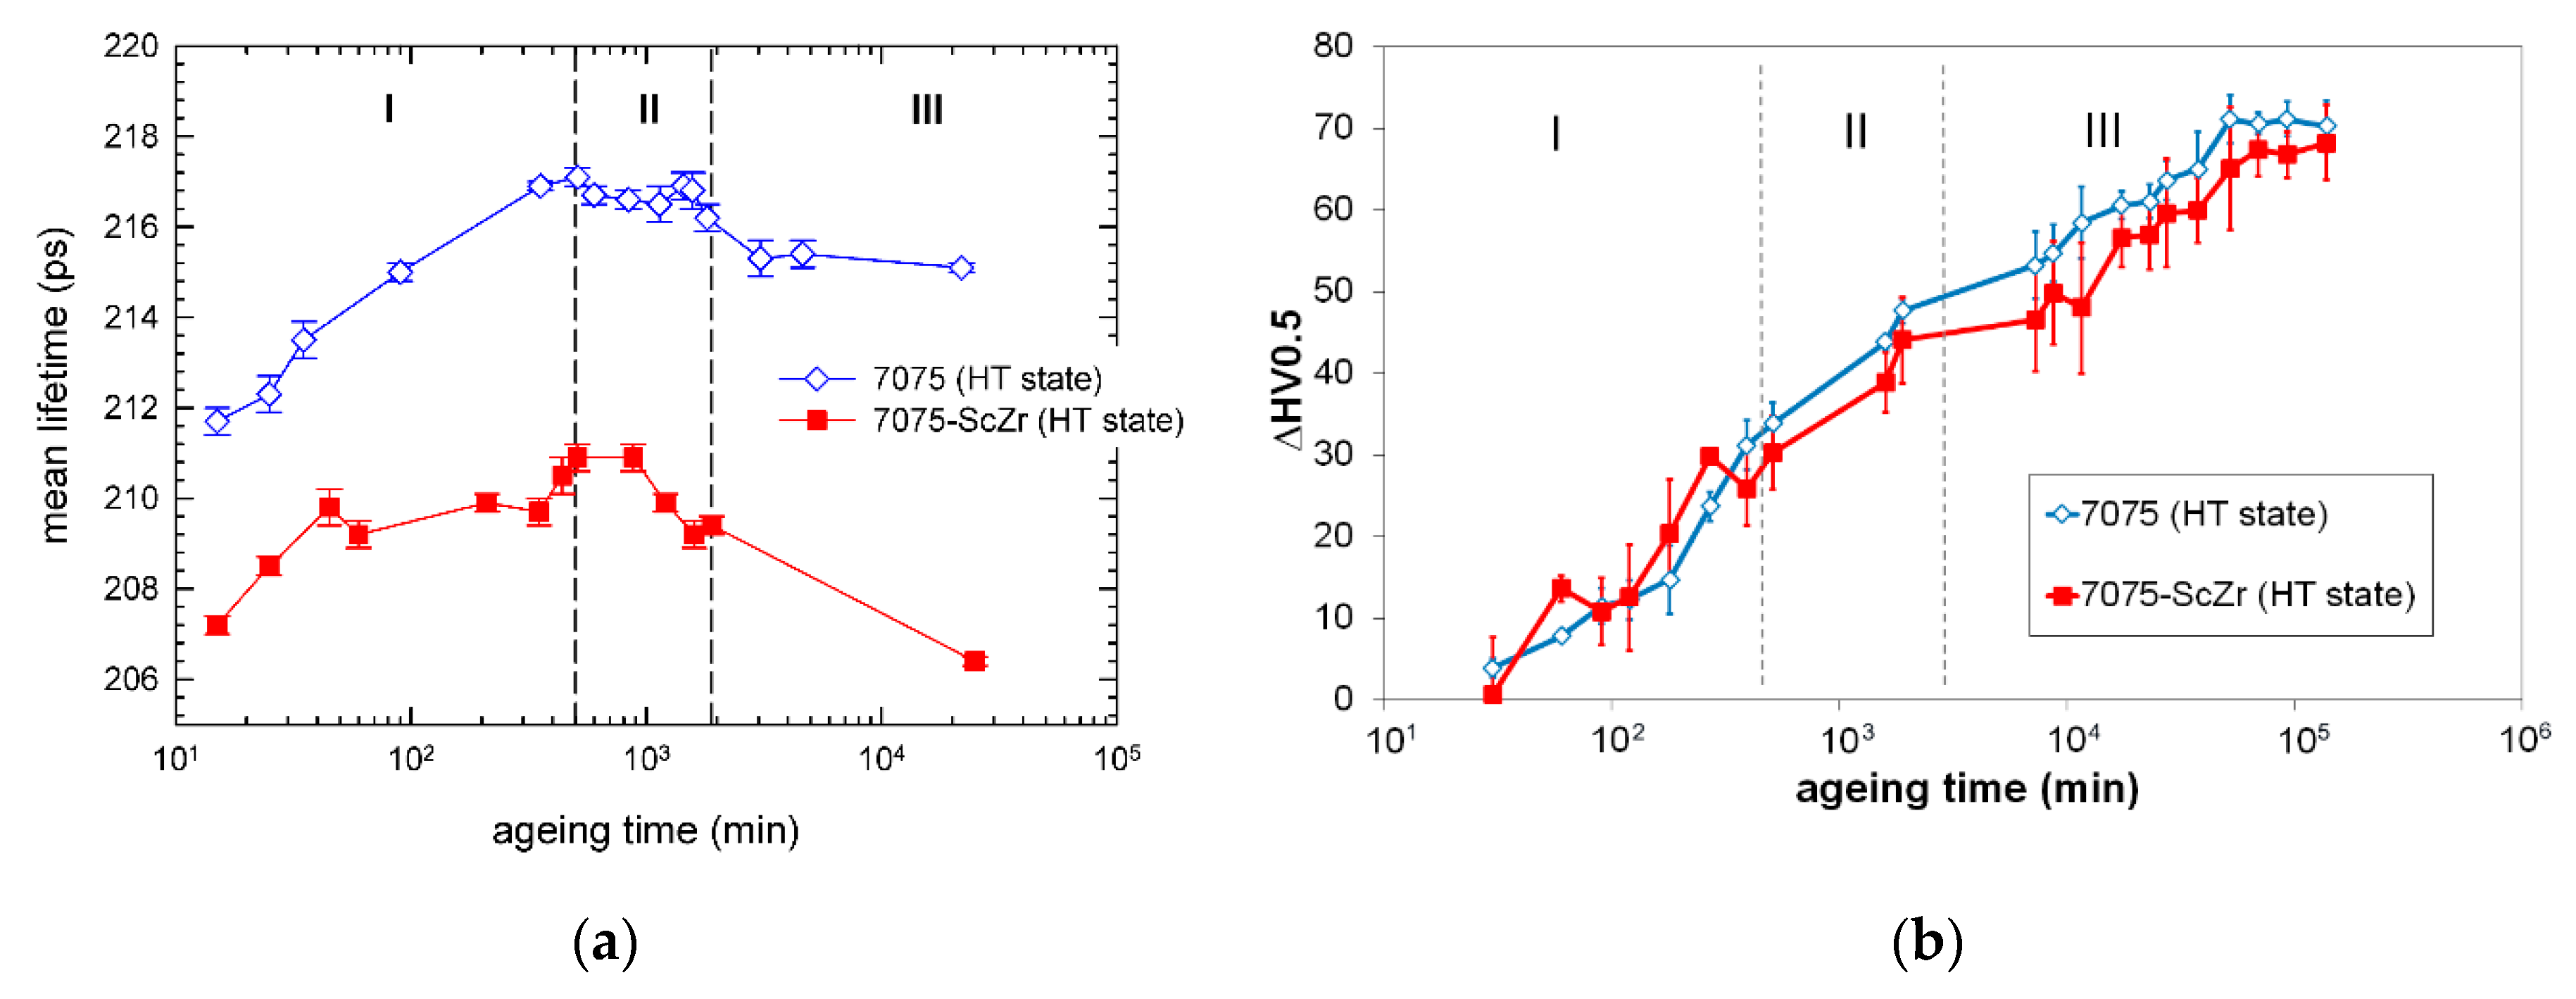
Time evolution of the mean LT of positrons and microhardness ΔHV0.5 values of the alloys during natural ageing is shown in
Figure 6. The mean LT behavior (
Figure 6a) is comparable for both alloys. It can be divided into three individual stages: Up to 500 min an LT increase (stage I), then from 500 min up to ~1980 min (33 h) a roughly constant values of the LT (stage II), and above ~33 h a decrease of the LT (stage III). It can be also seen that the LT values for the 7075-ScZr alloy are higher than those for the 7075 alloy without Sc–Zr addition. Microhardness HV0.5 values (
Figure 6b) increase immediately from the beginning of the natural ageing. The initial absolute HV0.5 value of the 7075 alloy (HV0.5 ≈ 70) is significantly lower than the 7075-ScZr alloy (HV0.5 ≈ 95). The microhardness values of the alloys reflect the Sc–Zr addition. This can be also seen from
Table 3, where the microhardness HV0.5 values and absolute electrical resistivity
ρ values (measured at temperature of liquid N
2—78 K) after different heat treatment are given: The state after heat treatment at 470 °C/240 min and the HT state (470 °C/60 min); and both states after the subsequent natural ageing (33,450 and 3500 h). Presence of the secondary phase from the Al–Sc–Zr-based alloys caused typical hardening effect as ΔHV ≈ 20–40, see References [
15,
19,
20,
25]. Comparable strengthening caused by co-presence of the primary incoherent and secondary coherent Sc,Zr-containing particles was observed in the deformed Al–Zn–Mg–Cu-based alloys with Sc–Zr addition [
15,
19,
20]. Thus the presence of these Sc,Zr-containing particles is a probable reason for higher microhardness HV0.5 of the studied 7075-ScZr alloy.
Table 3 also confirmations that no significant differences are between the values for the comparable states (cf. the state after annealing at 470 °C/240 min and the HT state). A difference in microhardness ΔHV0.5 values and resistivity Δ
ρ values between the 7075 and 7075-ScZr alloys is similar within the error through the natural ageing regardless of the annealing time at 470 °C. According to the microstructure observation of the alloys (see above), this also justifies the claim that the heat treatment at 470 °C/60 min is sufficient for the Al–Zn–Mg–Cu system.
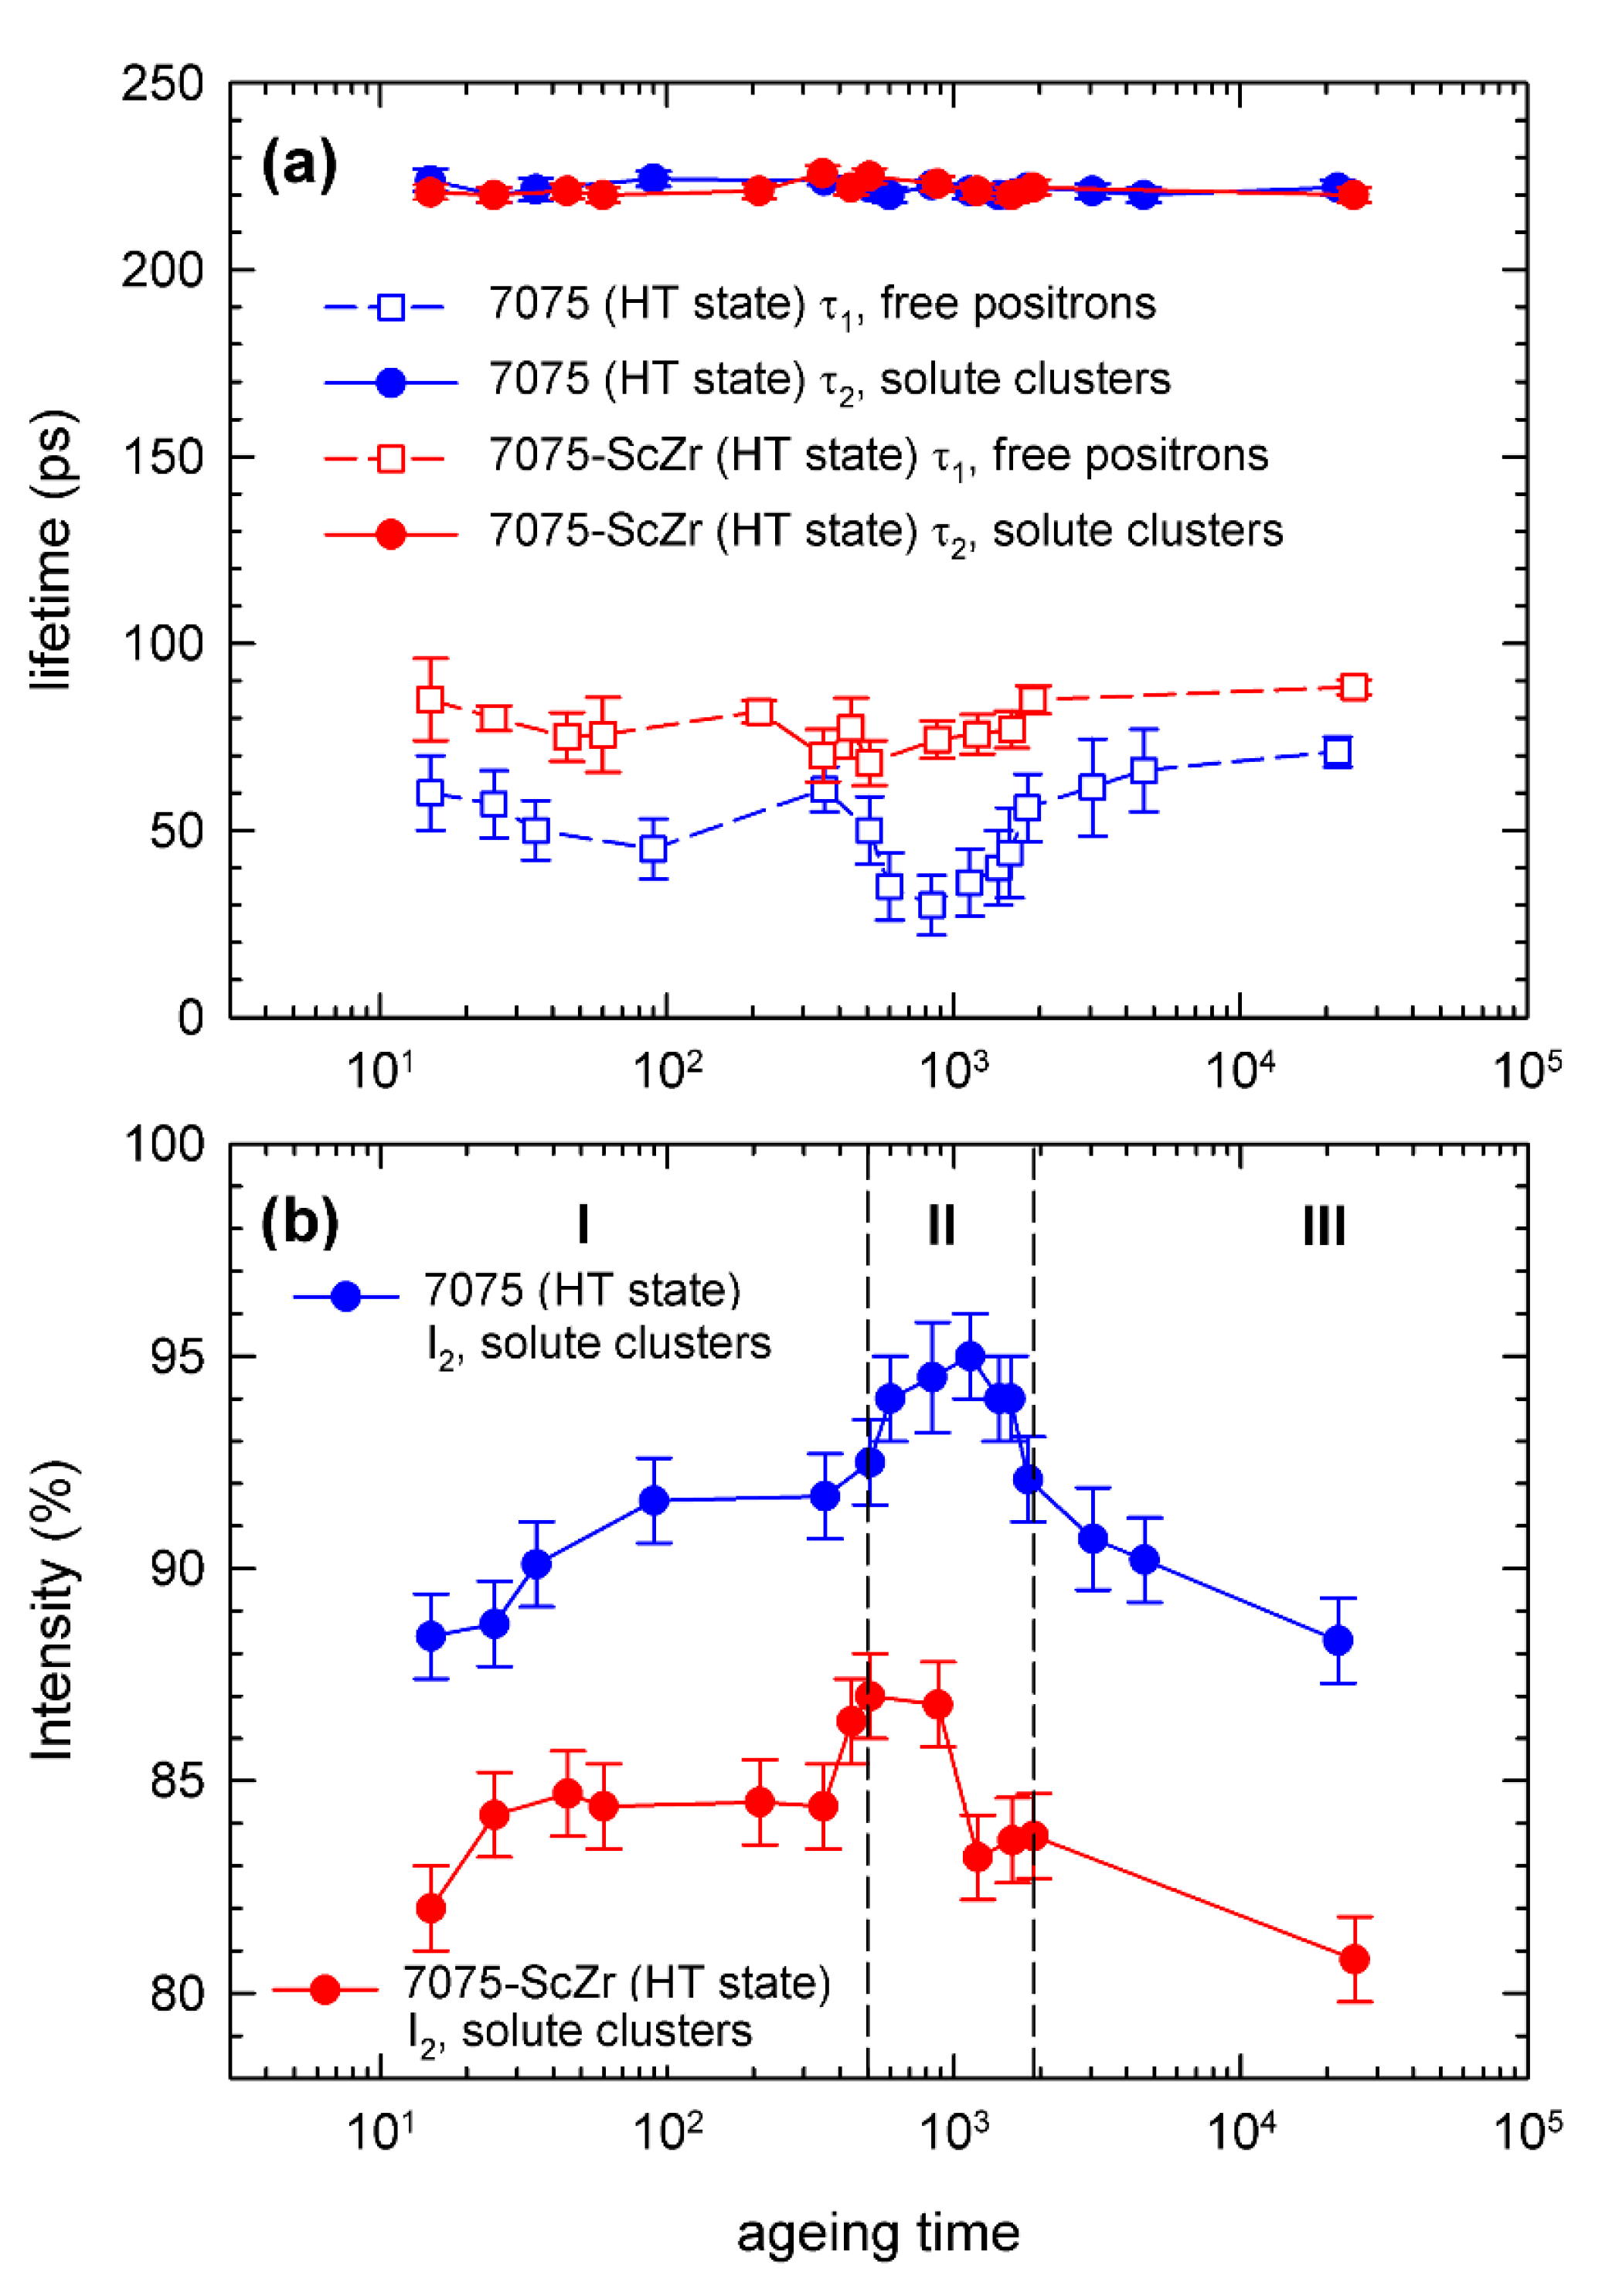
By two exponential components the LT spectra of all samples studied can be well described. Lifetimes
τ1 and
τ2 of the constituents and relative intensity
I2 of the longer constituent are plotted in
Figure 7a,b, respectively. The shorter constituent with the lifetime
τ1 comes from free positrons (not captured in defects). The longer constituent with
τ2 ≈ 220 ps can be ascribed to the positrons captured at solute (co-)clusters in the alloys [
20]. The lifetime
τ2 is comparable in both 7075 and 7075-ScZr alloys. This indicates that both alloys contain similar type of solute (co-)clusters. Note that LT component with similar lifetime
τ2 was observed also in these alloys subjected to hot deformation [
20]. Our previous CDB investigations revealed that these clusters contain mainly Mg and Zn solutes [
20]. It also has to be mentioned that coherent secondary as well as primary Al
3(Sc,Zr) particles do not trap positrons [
19,
20] but the Sc–Zr addition in the alloys can affect the development of the other phases (e.g., non-eutectic phases of the Al–Zn–Mg-based system [
20]).
Positron annihilation spectroscopy (PAS) investigations of the Al–Zn–Mg-based alloys indicated that the interaction between solute atoms and vacancies has an influence on (co-)clusters/GP zones [
19,
20,
25]. Parallel to PAS observations in the Al–Mg–Si-based [
49,
50,
51] and Al–Zn–Mg–Cu-based alloys [
19,
20] one can conclude that immediately after high temperature treatment (solution treatment) the studied alloys contain vacancies associated with single and/or multiple Zn- or Mg-solutes and/or Zn,Mg(-co)-clusters developed during quenching. These solute (co-)clusters further evolve in the course of natural ageing. Owing to the strengthening effect of the (co-)clusters, the microhardness HV0.5 of the 7075 and 7075-ScZr alloys increases continuously during ageing at RT which is probably due to growing and development of these solute (co-)clusters in analogy with Al–Zn–Mg-based alloys (e.g., References [
25,
52,
53]).
The intensity
I2 in the 7075-ScZr sample is lower than in the 7075 alloy. It indicates that the Sc–Zr addition has a slight negative influence on the concentration of solute (co-)clusters. Si, Cu or Mg solutes are most probably bound to Sc and Zr solutes and/or to the (secondary) Al
3Sc(Zr) particles. This presumed conclusion is further supported by the fact that that the 7075-ScZr sample, i.e., the alloy with lower concentration of solute (co-)clusters, also exhibits slightly lower changes in microhardness HV0.5, see
Figure 6b. However, it is also not possible to eliminate mutually different supersaturation in the solid solution.
The majority of positrons is trapped in solute (co-)clusters (I2 > 80%) already after the heat treatment at ~470 °C. It means that solute (co-)clusters were formed already during quenching of the sample. In the course of natural ageing the concentration of solute clusters increases in the stage I. This is reflected by an increase of I2 in the stage I which reaches maximum in the stage II. A long term natural ageing (stage III) leads to a decrease of I2 due to agglomeration of solute (co-)clusters into bigger objects ((precursors of the) GP zones). This results in an increase of the mean distance between clusters and thereby a decrease of their density.
Taking into account the behavior of the constituent (especially Zn, Mg, and Cu) at temperatures from RT to ~80 °C [
20] and the calculated contribution of the solute concentration to the resistivity of Al (e.g., References [
1,
54,
55]), the resistivity development during natural ageing is mainly associated with the change of Zn and Mg concentrations in the Al matrix. In the first approximation it can be assumed that the (co-)clusters/GP zones are composed of Zn and Mg atoms in a ratio of: (a) 1:1; (b) 1:2, see e.g., References [
10,
15,
17,
19,
20,
21,
22,
23,
24,
25,
26,
27,
28,
29,
30,
31,
32,
33,
56,
57,
58]. If we assume this, then the resistivity Δ
ρ changes in the HT + NA state (after natural ageing up to 3500 h), Δ
ρ ≈ 8 nΩ·m, see
Table 3, would correspond to the decrement of Zn- and Mg-concentration in the matrix: (a) ΔC
Zn,Mg ≈ 0.7 ± 0.1 at.%; (b) ΔC
Zn ≈ 0.8 ± 0.2 at.% and ΔC
Mg ≈ 0.4 ± 0.1 at.%. This decrement reasonably implicates that the changes in resistivity, microhardness and PAS characteristics can be attributed to the process of the formation/coarsening of the (co-)clusters/GP zones. These conclusions suitably complement the findings obtained through PAS.
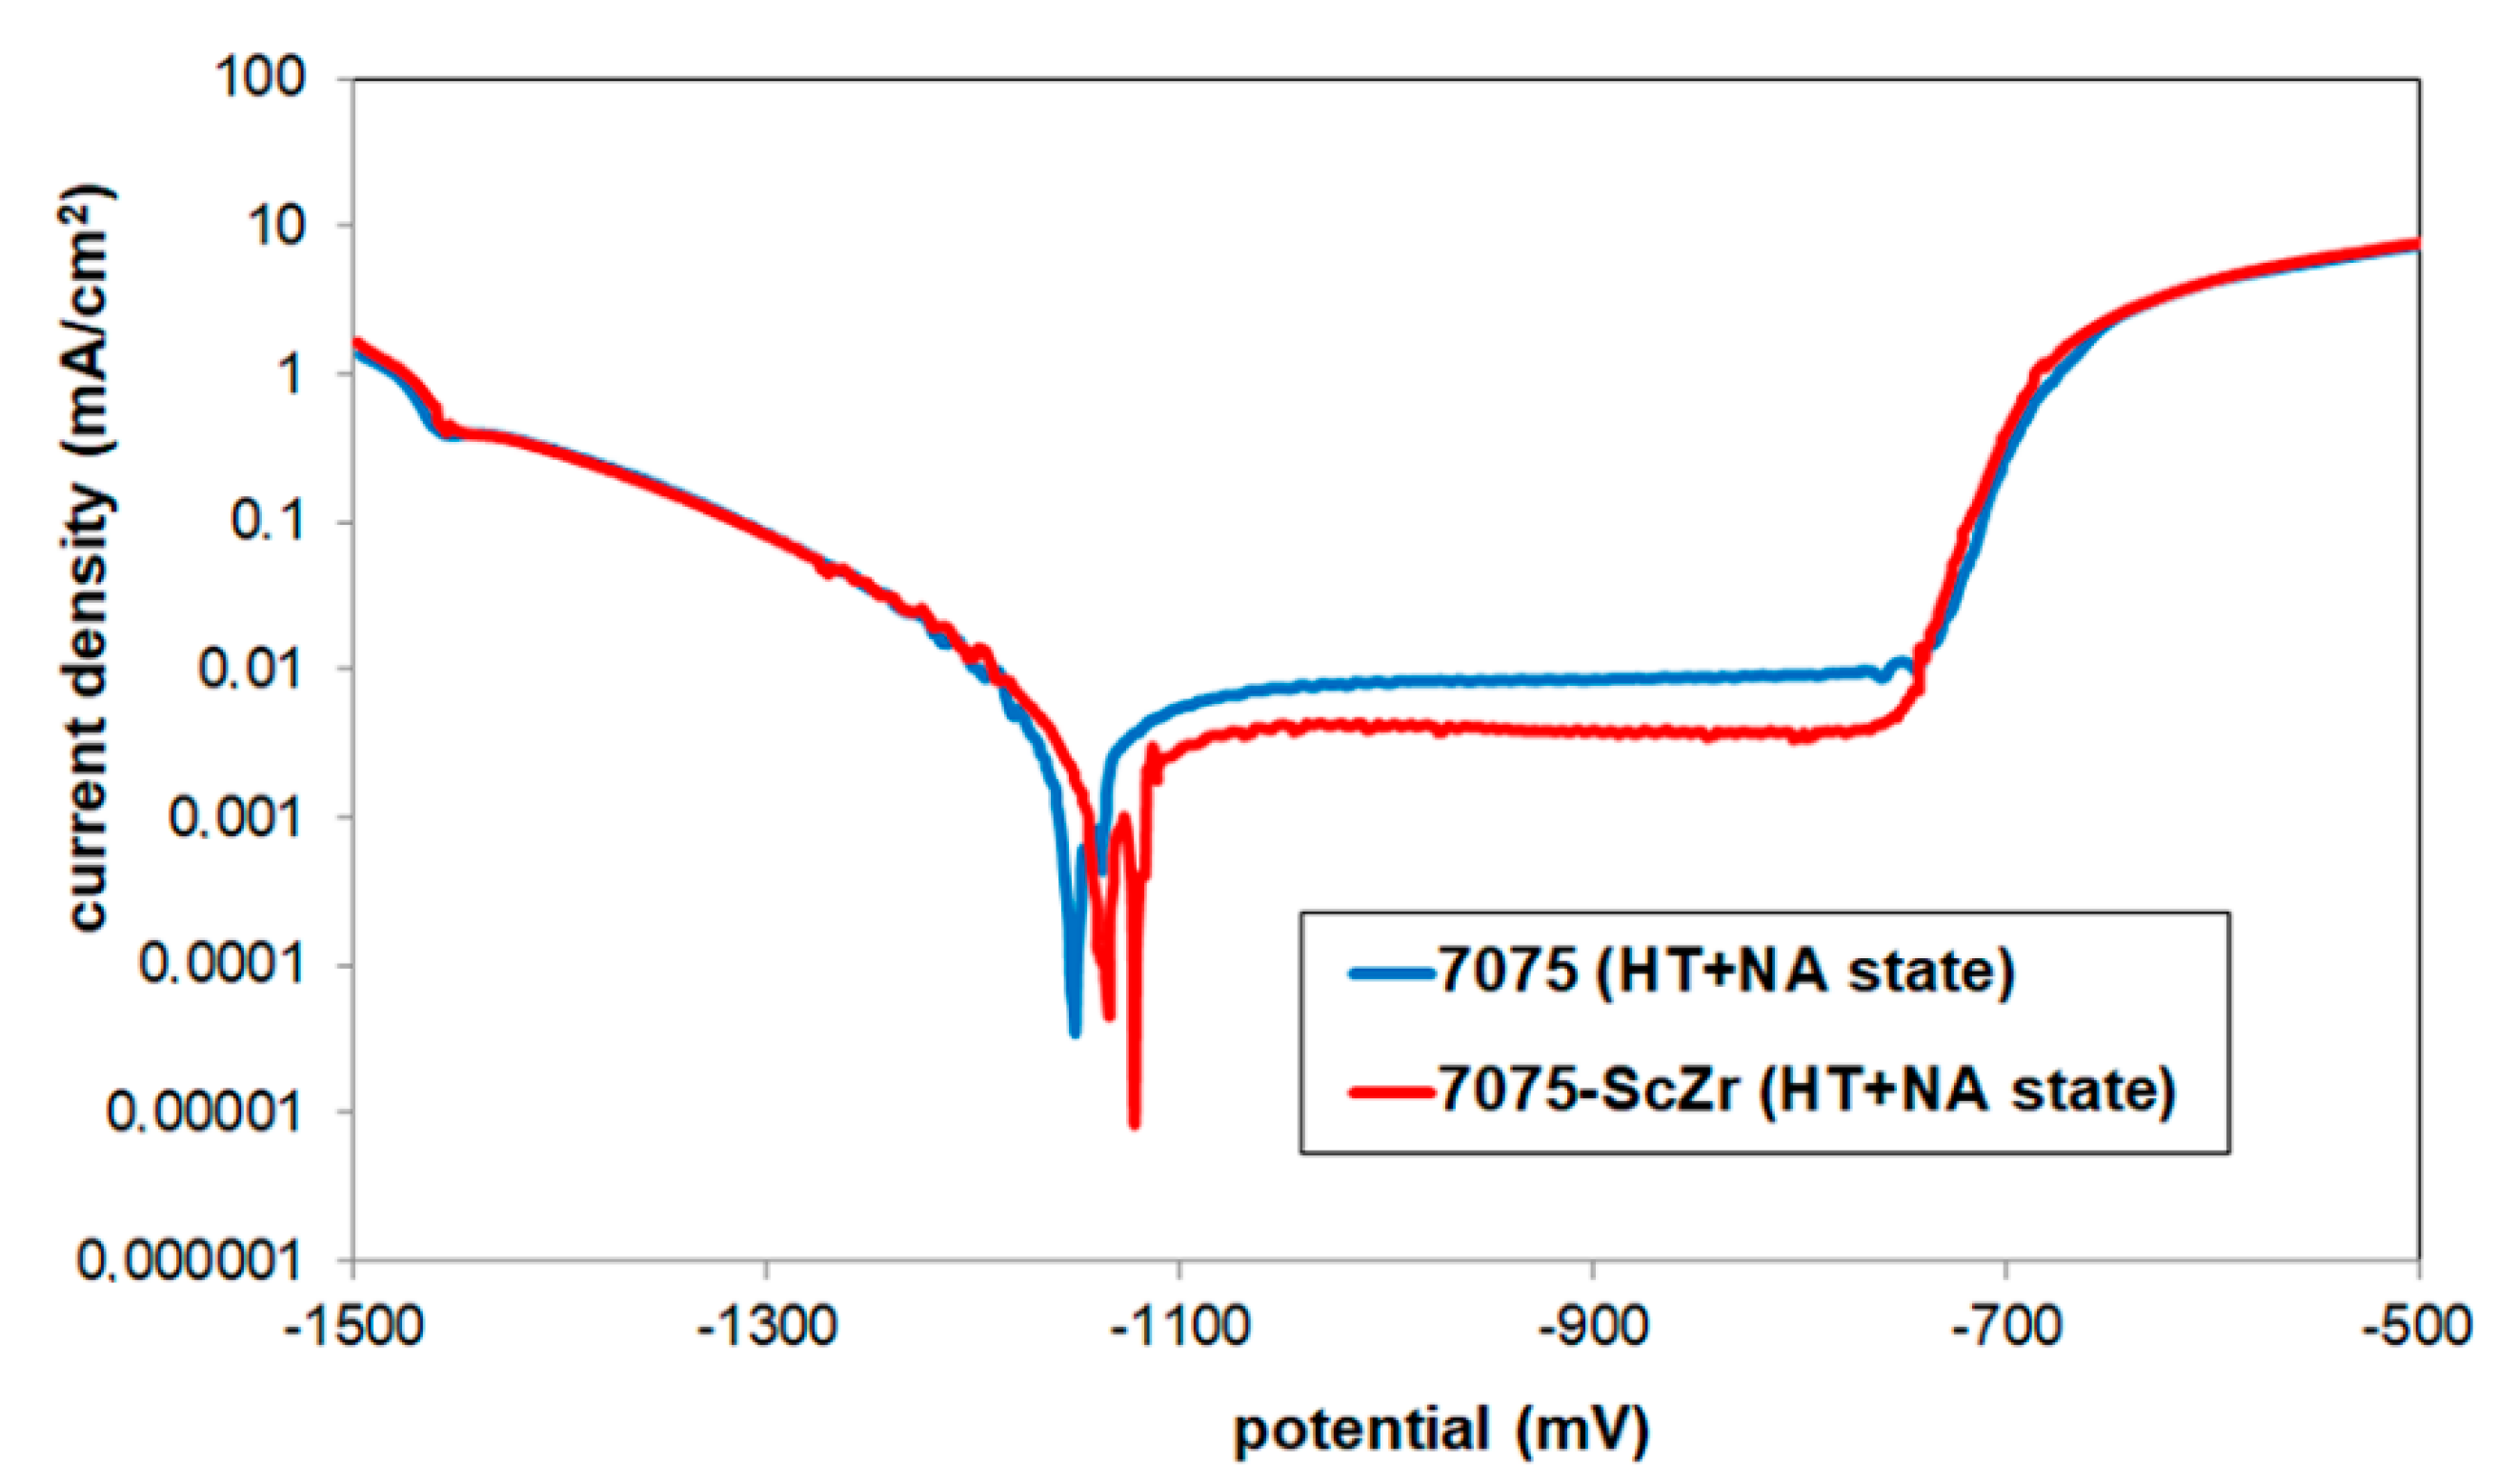
In addition to microstructural characterization during the natural ageing, the corrosion characteristics of the alloys in the HT + NA state (natural ageing after 3500 h) were studied. The results of the potentiodynamic polarization are shown in
Table 4 and
Figure 8. The 7075-ScZr alloy has a higher corrosion potential
Ecorr than the 7075 alloy without Sc–Zr addition. A comparable difference of the Δ
Ecorr ≈ 28 mV caused by the Sc–Zr addition was measured in our previous study in the hot-rolled alloys with the comparable composition, see Reference [
15]. In the studied 7075 and 7075-ScZr alloys the passivation region, where the corrosion current kept almost the same value Δ
Ecorr (see
Table 4), was observed, which means that passive films were formed on the surfaces. A lower value of corrosion current density
Icorr in the 7075-ScZr alloy (2.23 µA/cm
2) indicates a better corrosion resistance and a slower corrosion rate (~0.0243 mm/a) than for the 7075 alloy (2.96 µA/cm
2 and ~0.0322 mm/a). For the studied alloys it can be concluded that the positive influence on corrosion properties is (probably) mainly caused by the Sc–Zr addition. Although corrosion measurement results can be found on many Al-based alloys, there are really very few detailed electrochemical measurements on the Al(–Sc)–Zr-based alloys (e.g., References [
41,
42,
59,
60,
61,
62]) and even less on the alloys of this type (7xxx series) with Sc and Zr elements in the available literature. In addition to our previous study in the hot-rolled alloys with comparable composition [
15], the observed results are in agreement with Reference [
62] where better corrosion resistance (especially slower corrosion rate and lower corrosion current density) was measured by electrochemical measurements for the AlZnMgCuScZr alloy than for the AlZnMgCu alloy in the EXCO testing solution.
3.3. Phase Development during Isochronal Annealing
The ageing processes in the Al–Zn–Mg–Cu-based alloys are complex and the decomposition of supersaturated solid solutions obtained by quenching takes place in several formation steps [
15,
19,
20,
24,
63,
64]. Typically, the precipitation of the (co-)clusters, precursors of the GP zones, and coherent GP zones precedes the formation of the semicoherent intermediate precipitates and incoherent equilibrium precipitates during isochronal annealing [
15,
19,
20,
25,
65,
66,
67]. The early precipitation stages in these alloys are abundant and can have a significant influence the resistivity and (micro)hardness development during the natural ageing and/or the beginning of the annealing [
25,
30,
49,
52,
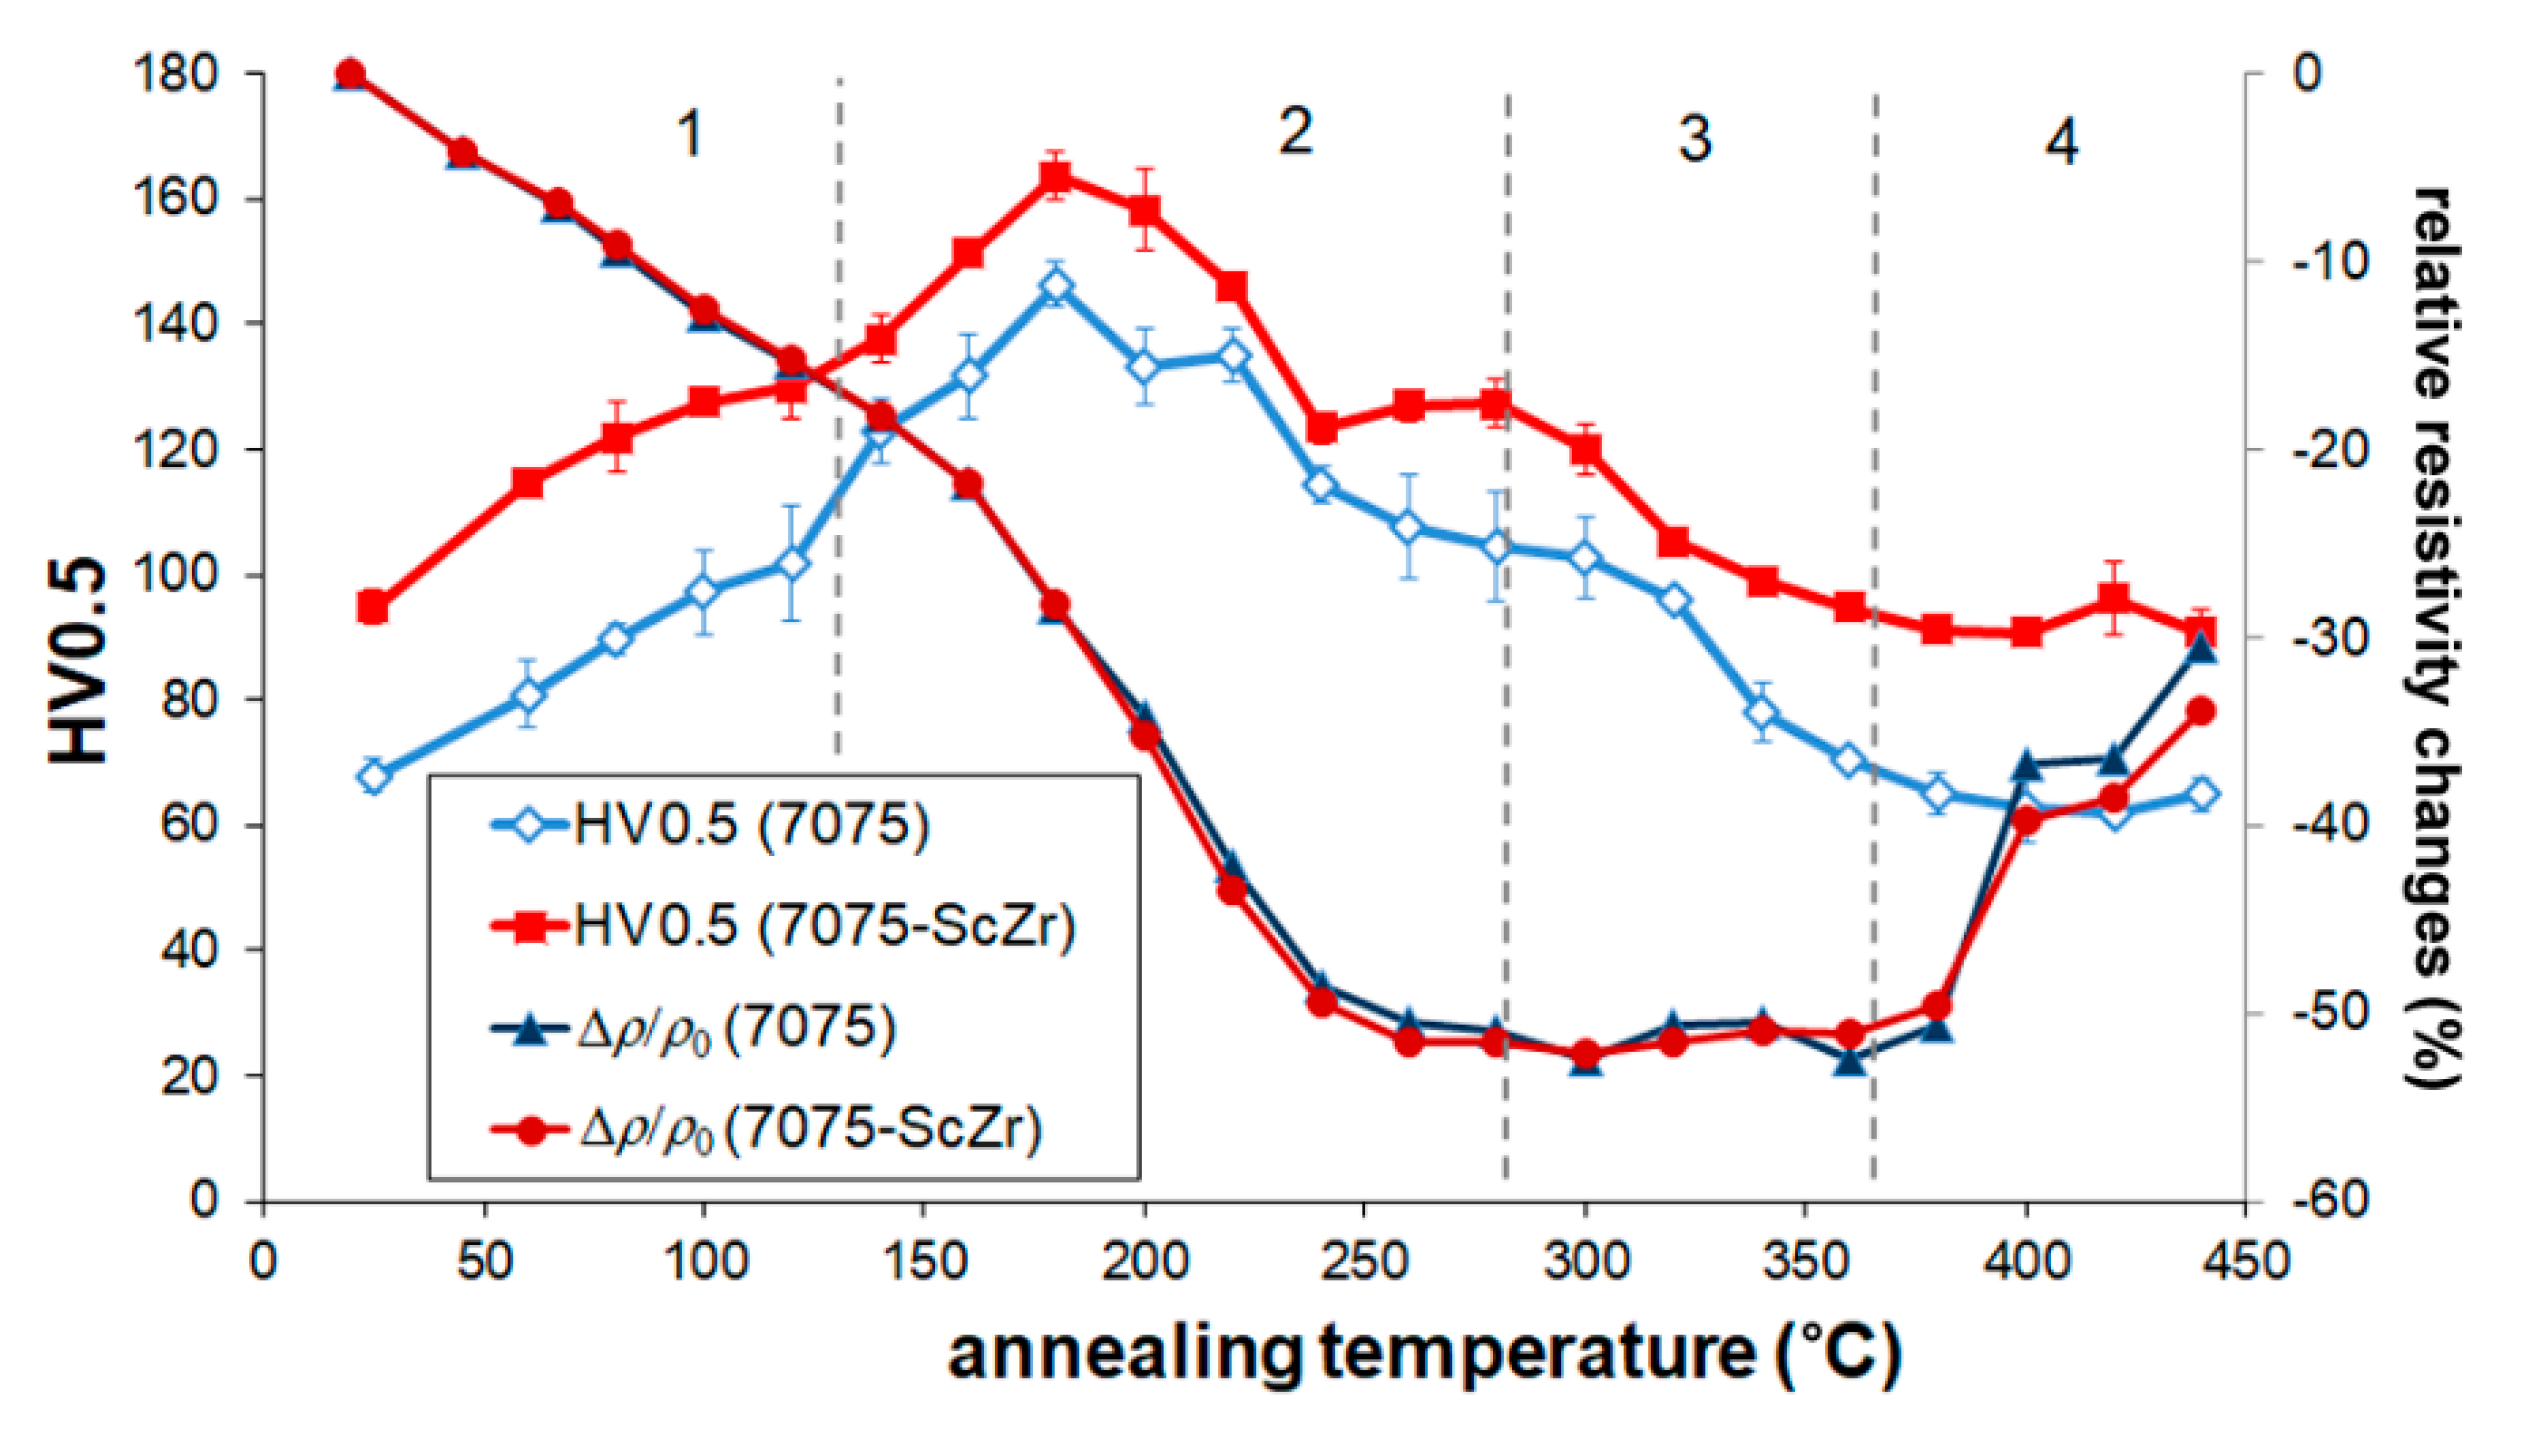
53]. Isochronal resistivity (Δ
ρ/
ρ0) and microhardness annealing curves of the HT alloys are presented in
Figure 9. Electrical resistivity decrease in two stages (1-stage up to ~140 °C and 2-stage between 140 °C and 280 °C). Then the electrical resistivity is nearly constant (3-stage) and after annealing at temperatures higher than ~360 °C (4-stage) increases insignificantly. 1- and 2-stages of the resistivity decrease are connected with a maximum hardening HV0.5 after annealing up to 180–220 °C (
Figure 9). The higher HV0.5 values of the 7075-ScZr in the HT state is probably caused by the secondary/primary Al
3(Sc,Zr)-phase particles (already existed in the HT state—see
Figure 4 and
Figure 5). The comparable effect on HV0.5 values due to the presence of these particles is observed during natural ageing of the alloys (see
Table 3).
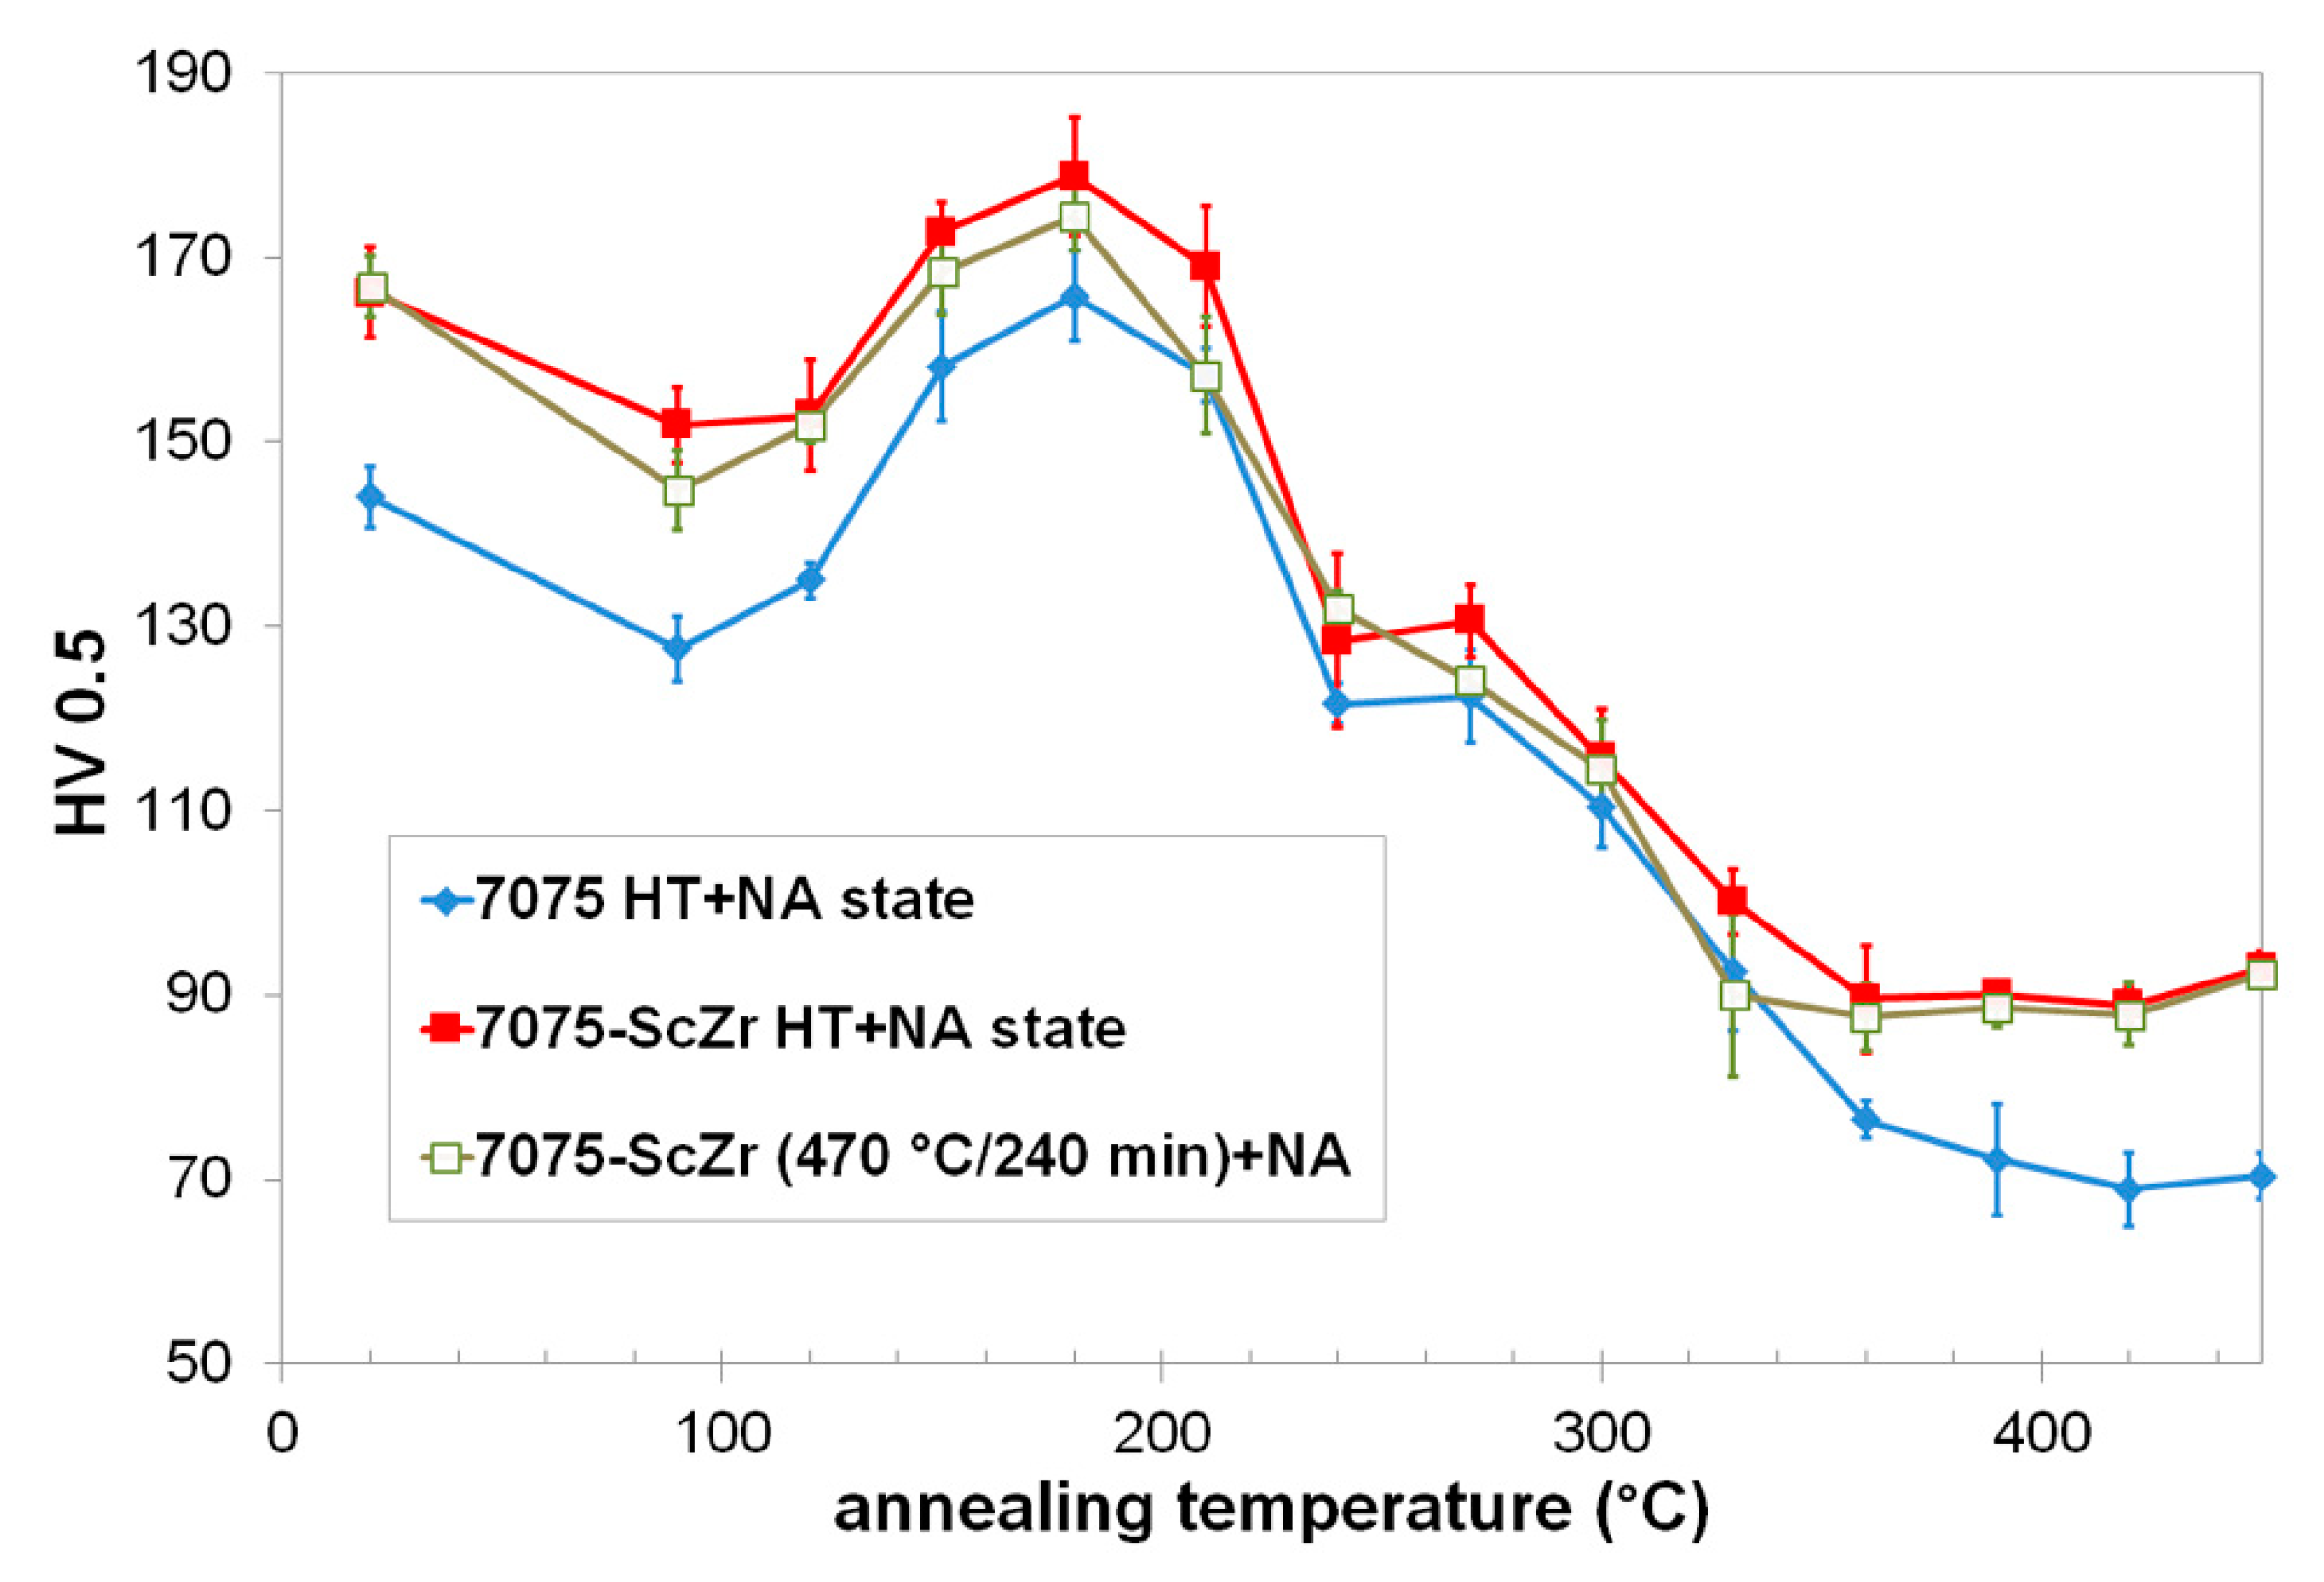
The microhardness isochronal curves for the HT + NA (natural ageing for 3500 h) alloys and the 7075-ScZr alloy heat treated at 470 °C/240 min after natural ageing (NA) for 3500 h are given in
Figure 10. The microhardness values of the 7075-ScZr alloys are comparable for both alloys (heat treatment at 470 °C/60 min and 470 °C/240 min) after natural ageing. This indicates that the annealing at 470 °C/60 min is sufficient for the Al–Zn–Mg–Cu system, as stated above. The initial microhardness HV0.5 values of the HT + NA alloys in comparison with the HT alloys without NA (compare
Figure 9 and
Figure 10) reflects the presence of the (co-)clusters/precursors of the GP zones developed during natural ageing. The HV0.5 values decrease to a local minimum at ~90 °C. The temperature range of the hardening peak can be observed at 150–210 °C. It is seen that the Sc–Zr addition has almost no effect on microhardness changes at 210–330 °C. But after that the HV values of the alloy with the Sc–Zr addition after only a slight decrease reach constant course in contrast to the continual decrease of the 7075 alloy. The ΔHV0.5 difference between 7075 and 7075-ScZr alloys at the end of annealing is nearly HV0.5 ≈ 20 microhardness development of the alloys studied reflects the Sc–Zr addition, again.
Out of the comparison of the microhardness and electrical resistivity changes annealing curves of the studied materials up to ~140 °C (
Figure 9 and
Figure 10) it could be assumed that the precursors of the GP zones and/or GP zones are formed in the HT alloys during the isochronal annealing. This process is connected with microhardness and electrical resistivity increase at the 1-stage. Despite this fact, the precursors of the GP zones and/or GP zones are dissolved first in the HT + NA alloys. This dissolution leads to the microhardness decrease (up to ~100 °C). The results are in an agreement with the measurements of the Al–Zn–Mg(–Sc–Zr) alloys in our previous study (see Reference [
25]).
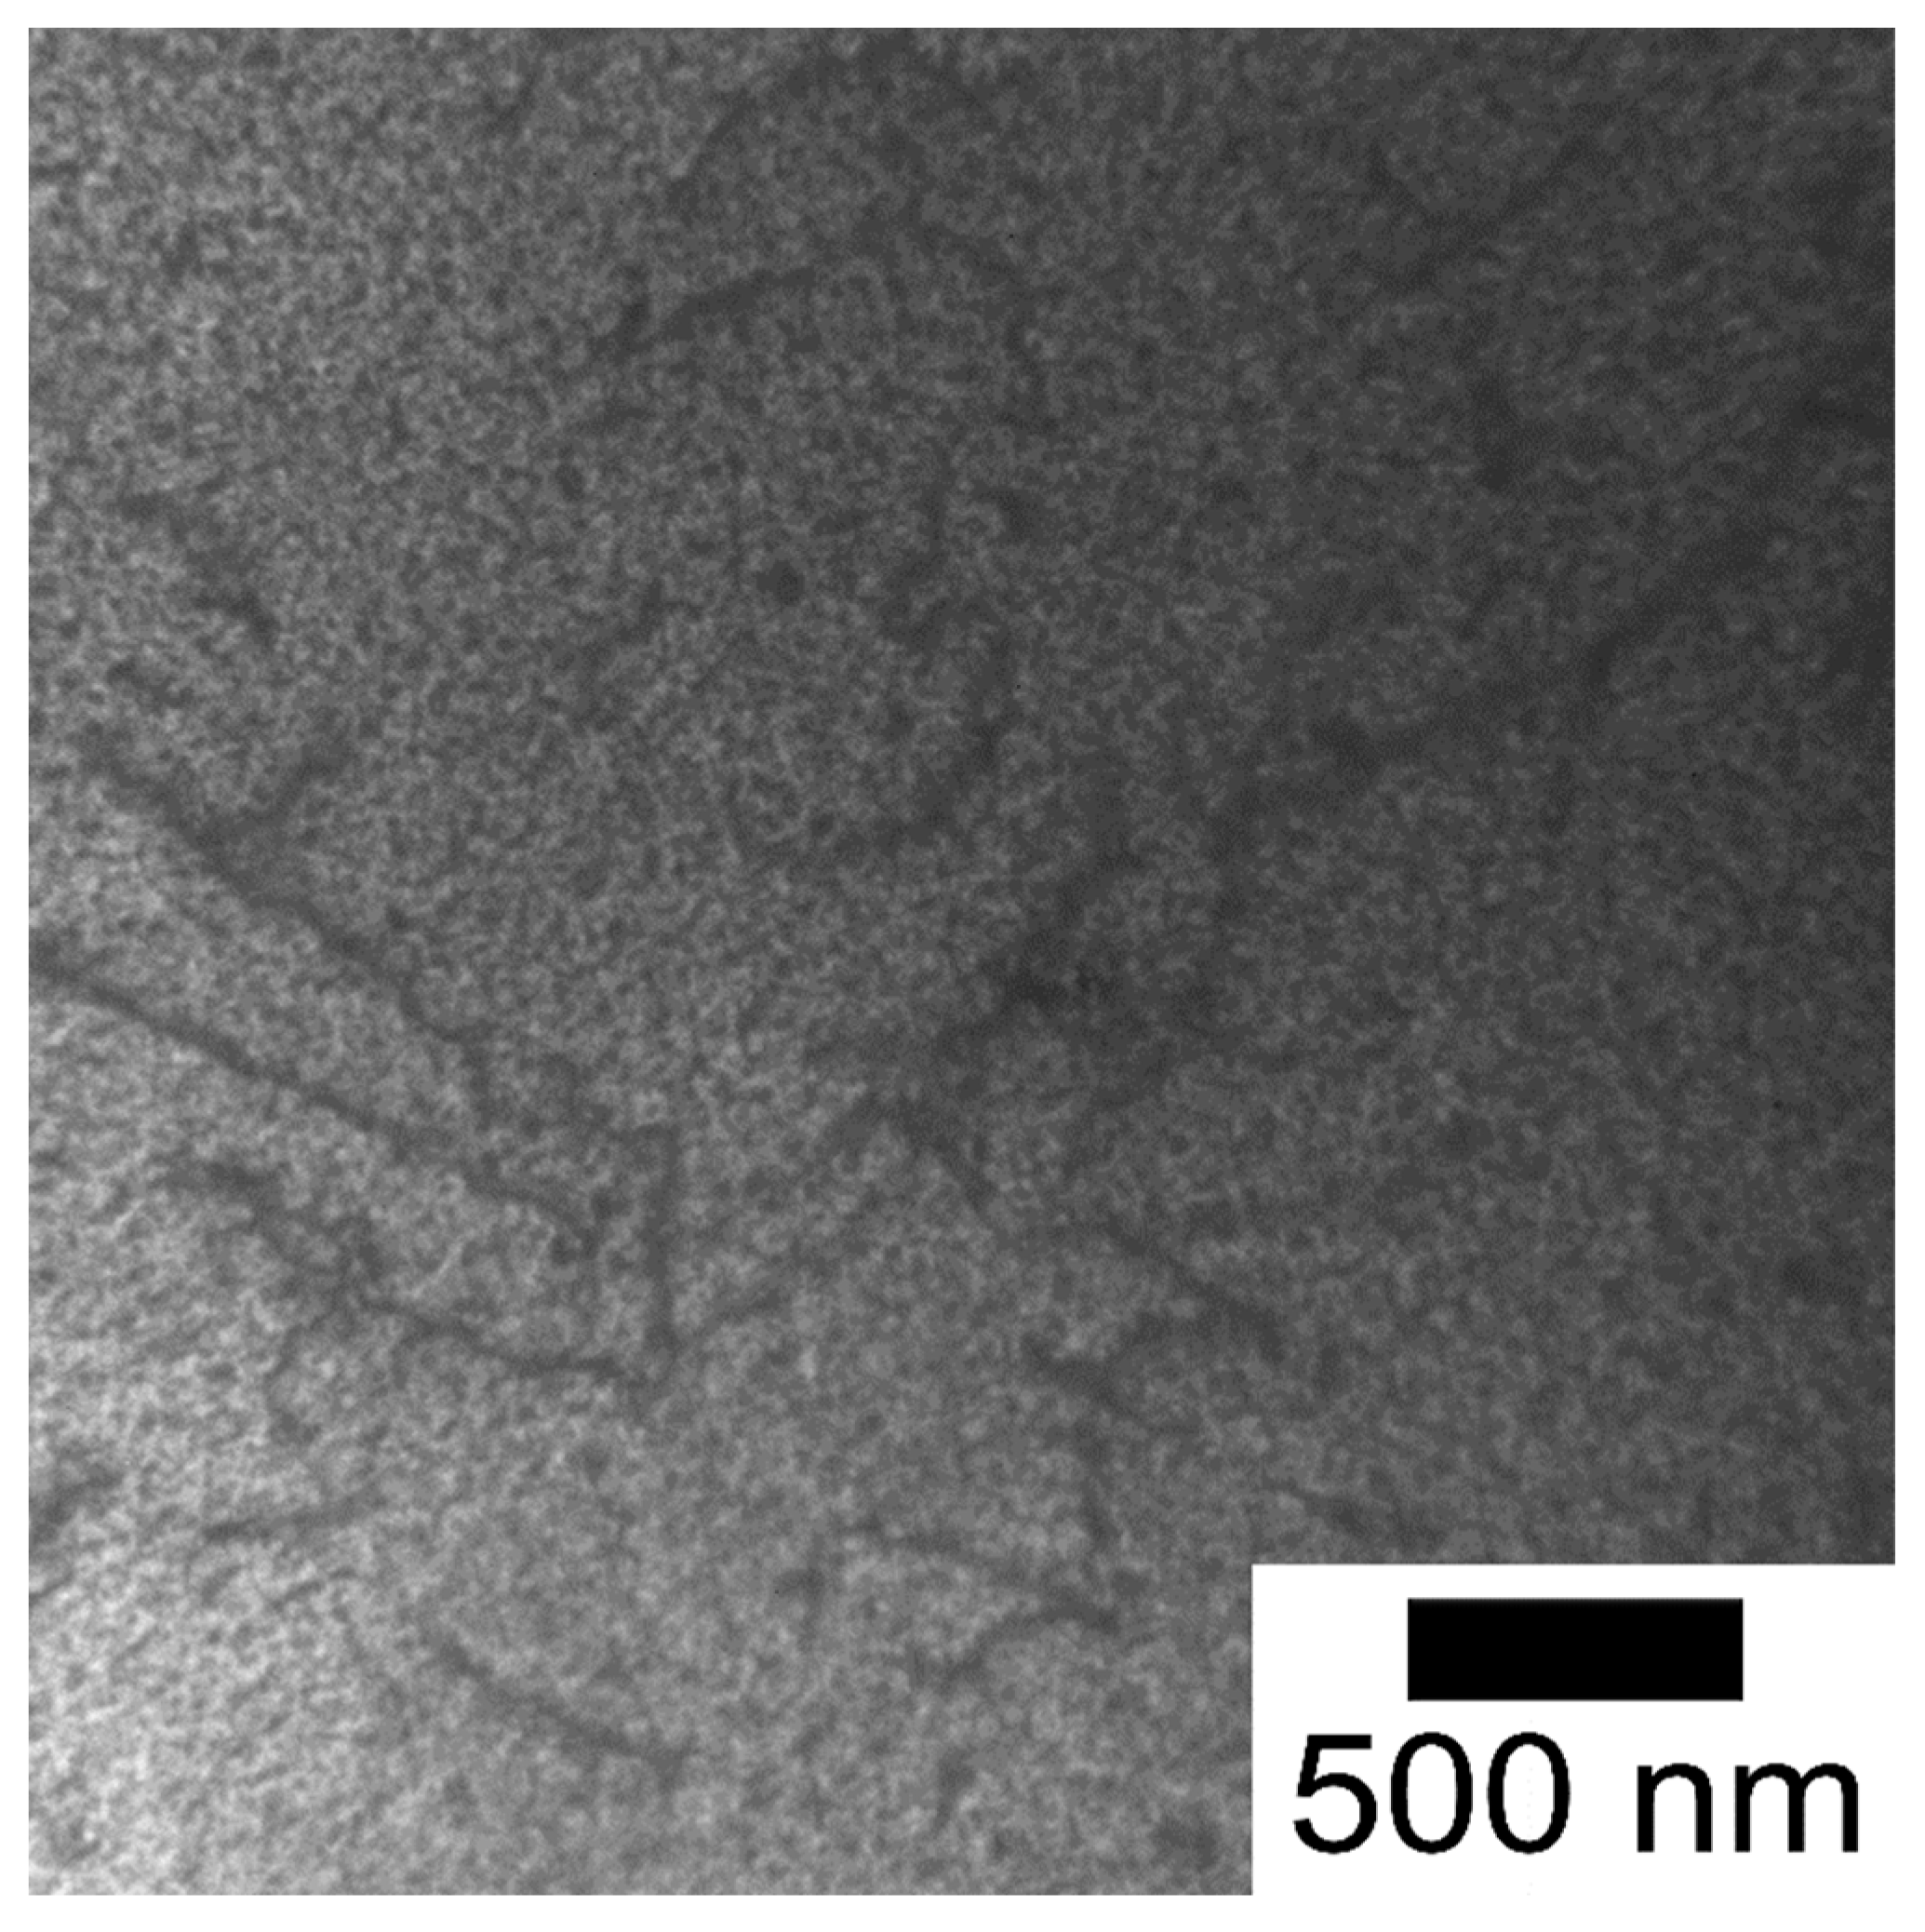
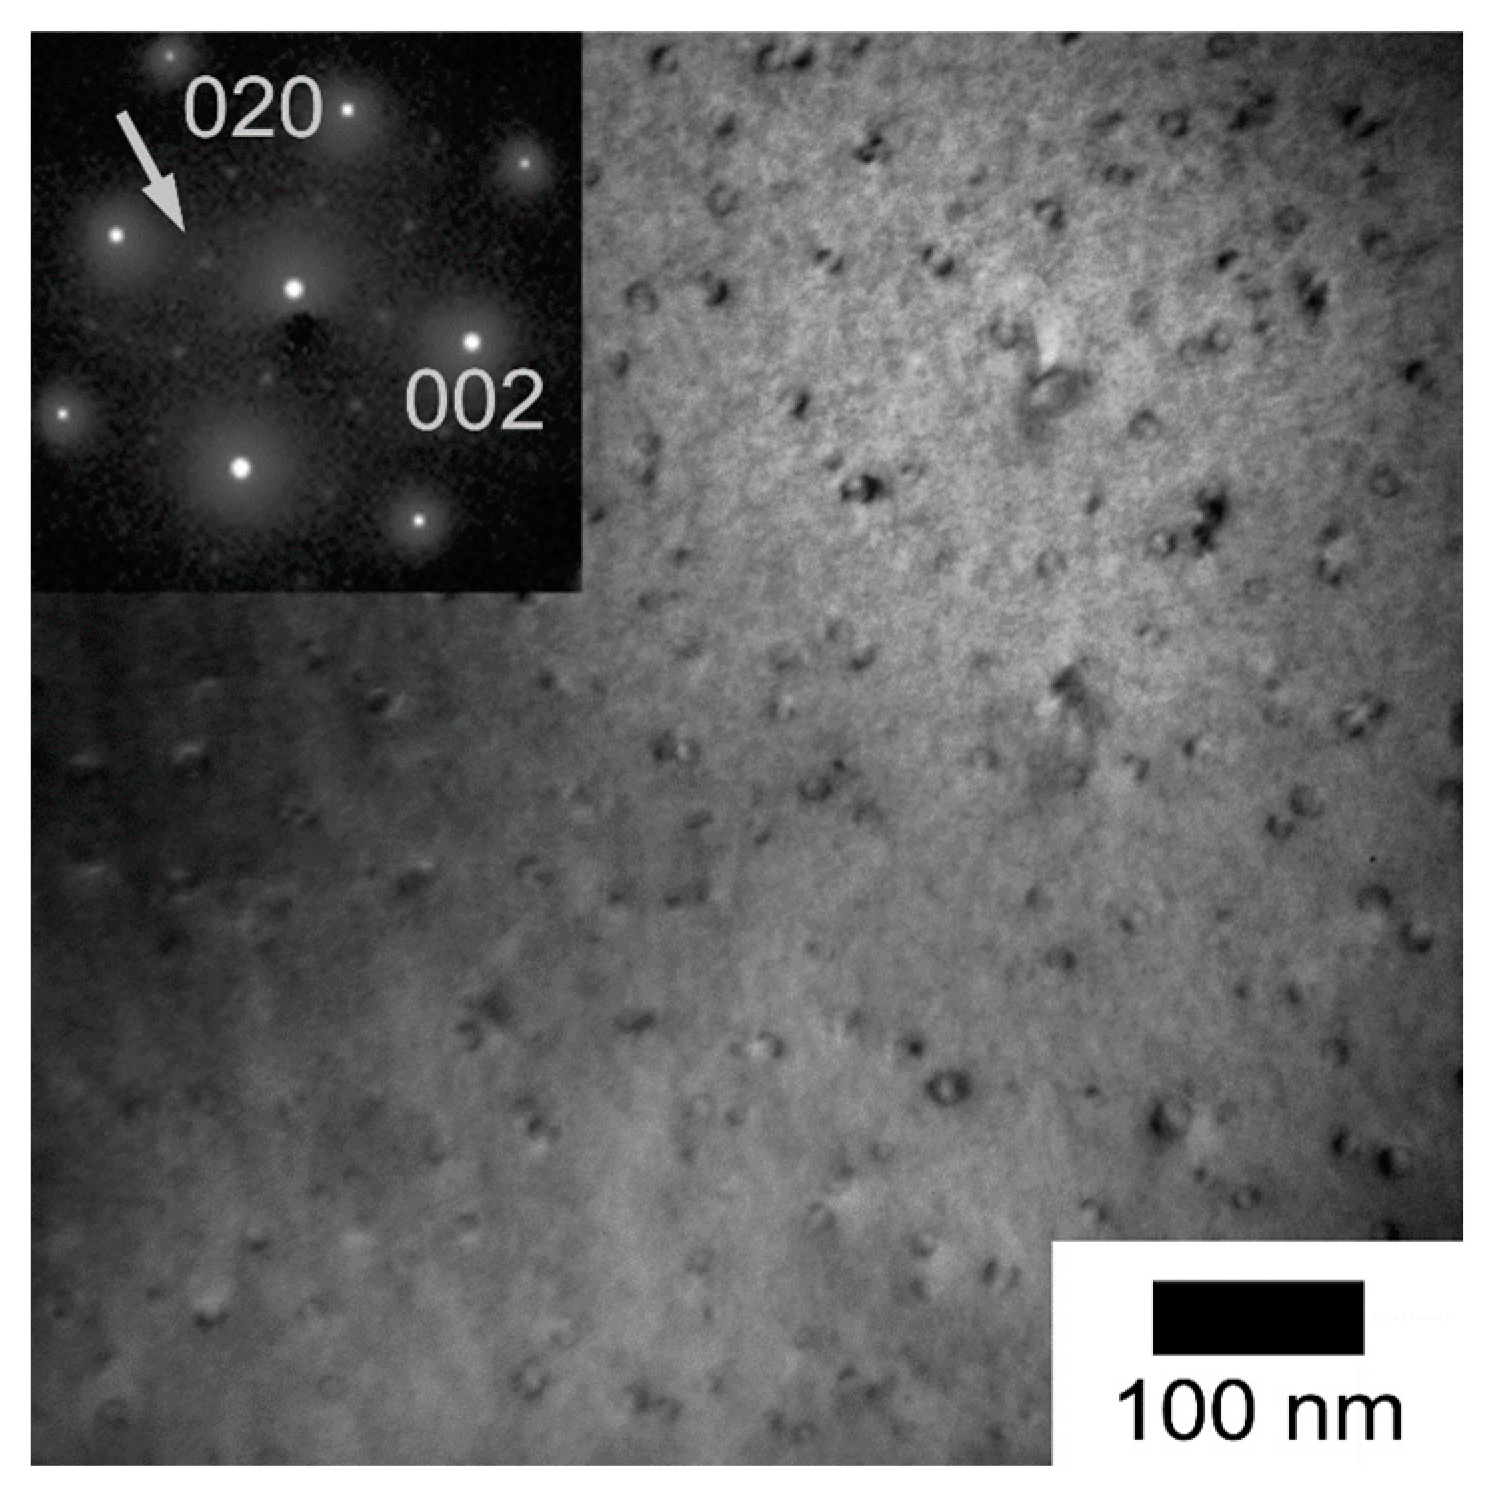
Figure 11 shows microstructure of the 7075-ScZr alloy in the HT state (without NA) after isochronal heat treatment up to 220 °C, where the dense particle dispersion can be seen. Thus the main resistivity decrease (2-stage) and microhardness increase (140–220 °C) in the alloys studied are due to the precipitation of these particles. According to the literature (e.g., References [
15,
19,
20,
31,
32,
33]), the following phases in this temperature range come into consideration: (a) Metastable
η’-phase (hexagonal,
a = 0.496 nm,
c = 0.935 nm or bcc,
a = 1.422 nm, MgZn
2) [
19,
20,
25,
32,
33]), (b) non-eutectic stable
T-phase (bcc,
a = 1.435 nm, Al
2Zn
3Mg
3 and/or Mg
32(Al
1−xZn
x)
49) [
20,
25,
31], (c) GP zones (hexagonal,
a = 0.496 nm,
c = 0.935 nm or bcc,
a = 1.422 nm) [
19,
20,
25,
31,
32].
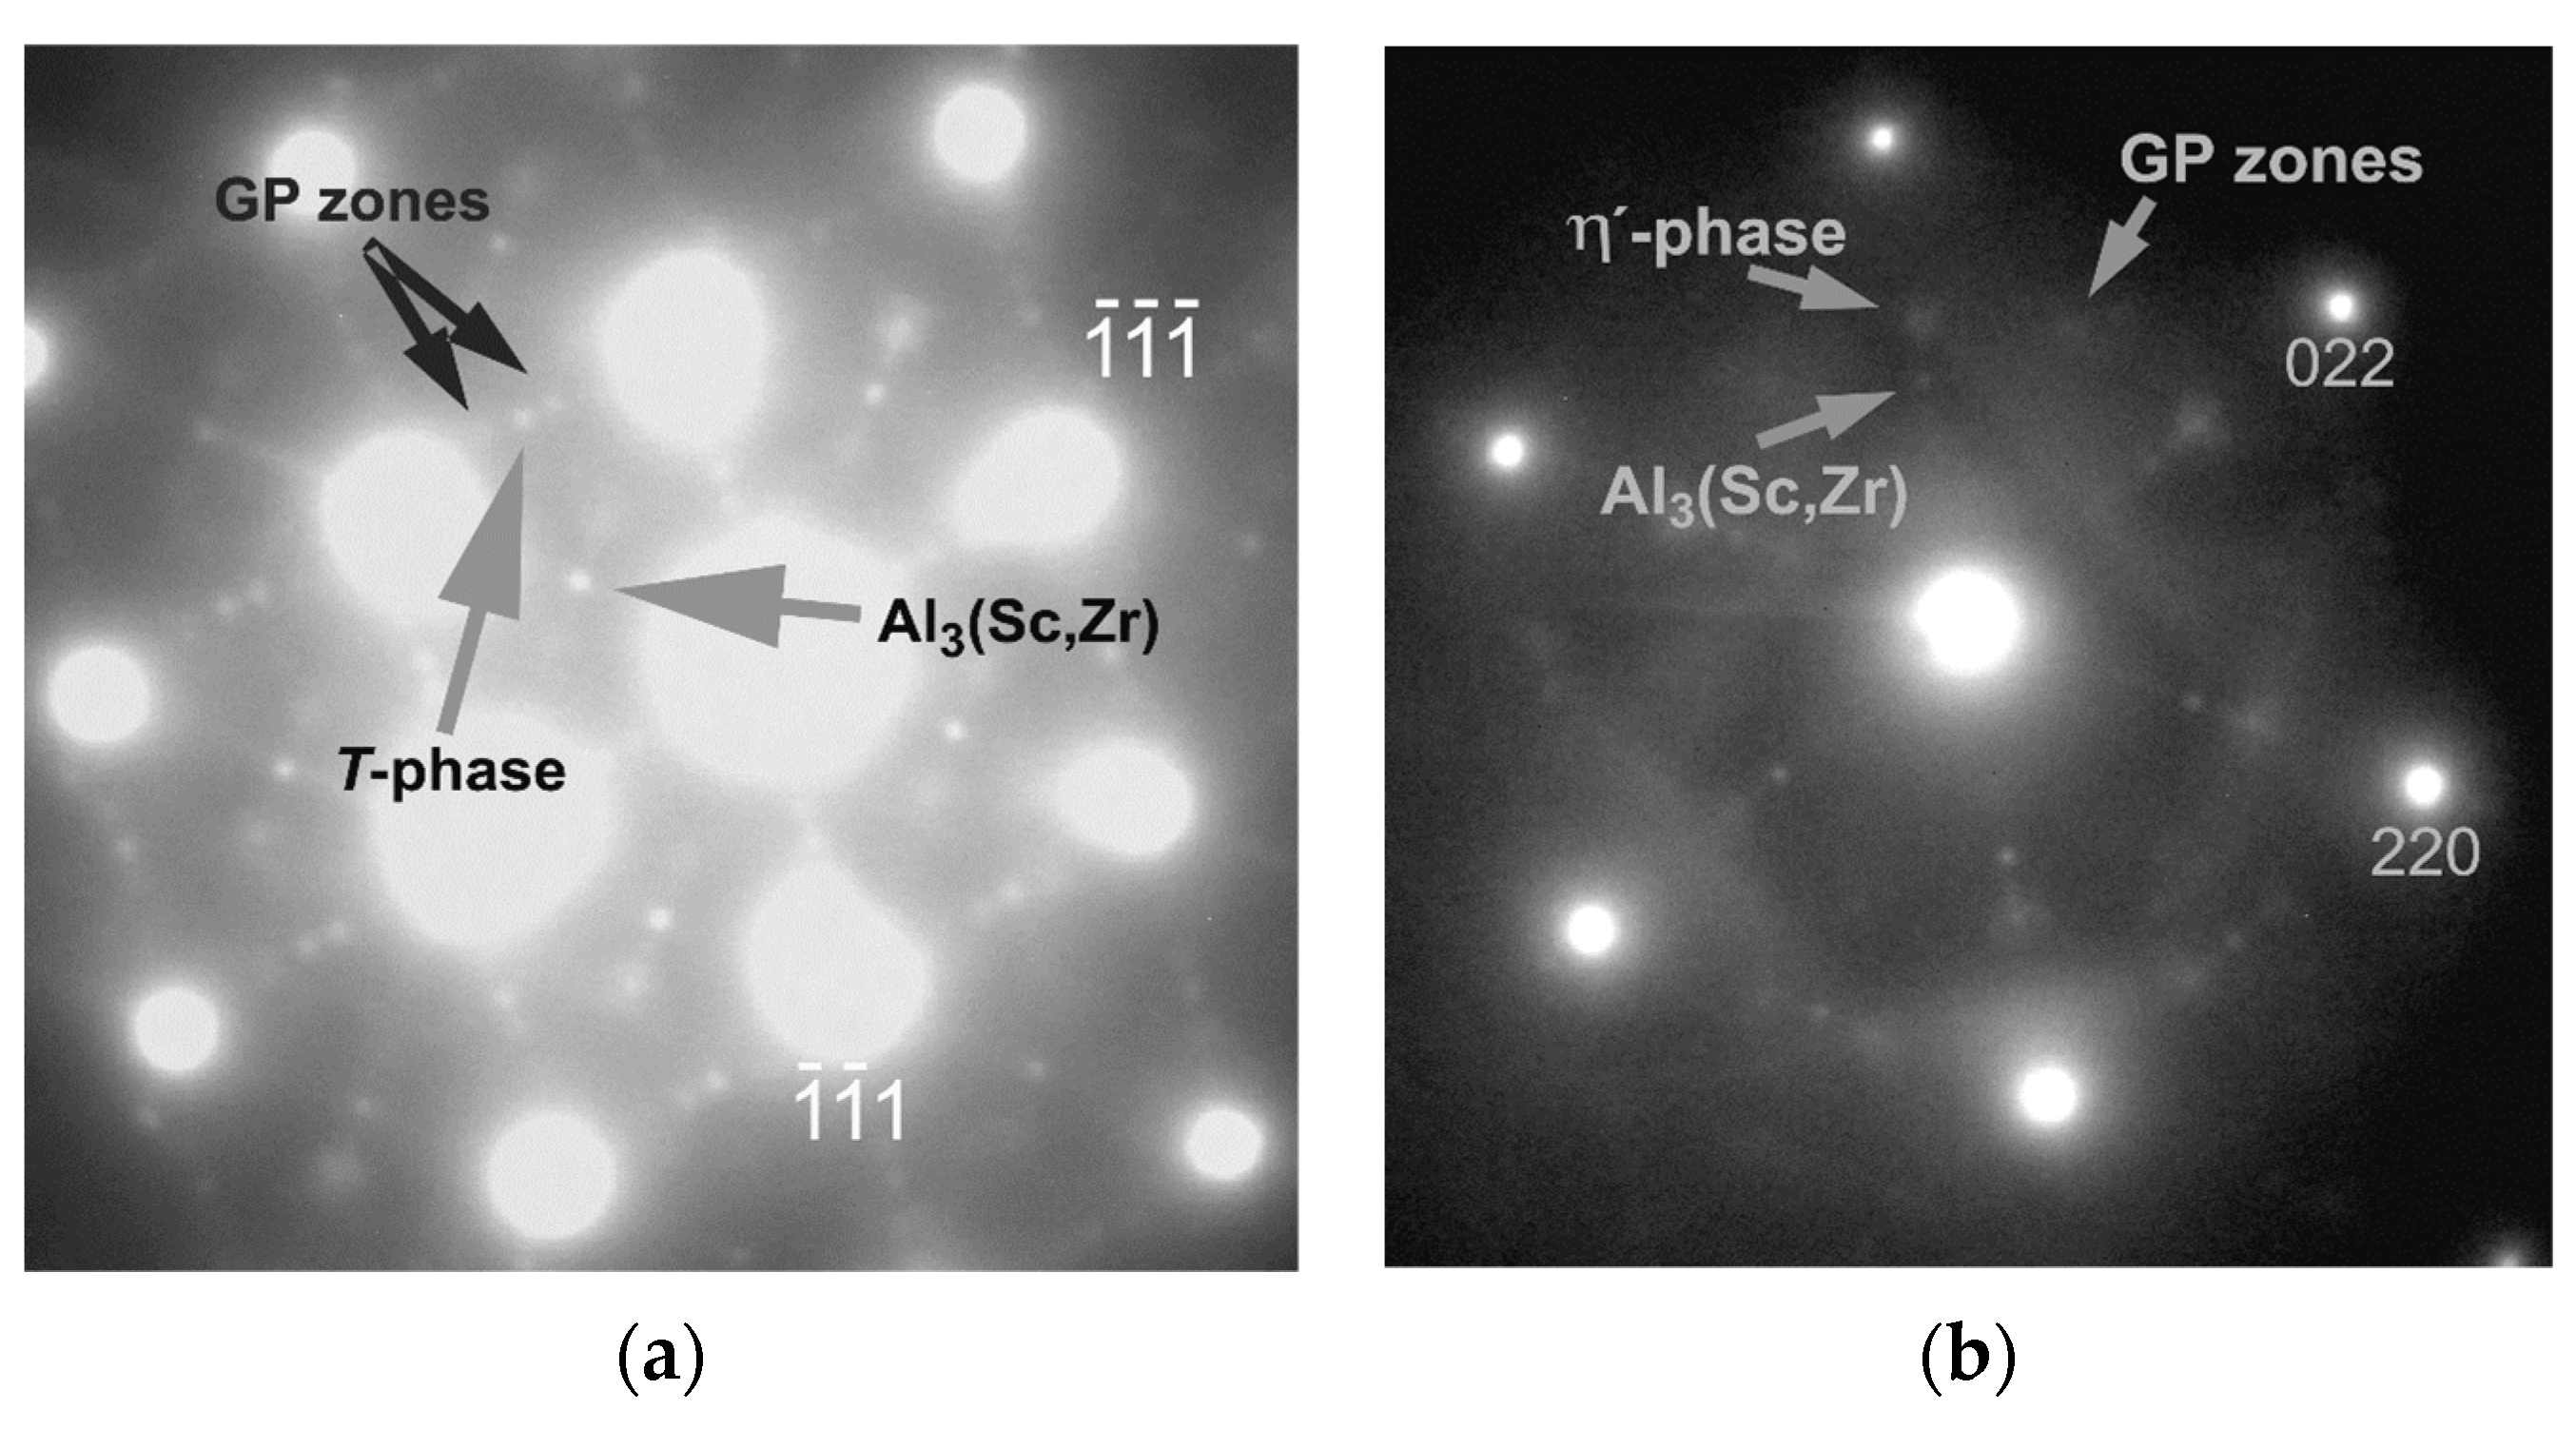
Figure 12 shows the diffraction patterns from different grains of the 7075-ScZr alloy after isochronal heat treatment up to 220 °C taken near: (a) [110]
Al and (b) [111]
Al orientations.
Figure 12a contains weak spots assigned to the secondary Al
3(Sc,Zr)-phase particles, GP zones and non-eutectic
T-phase particles. This is in conformity with recently published results, see References [
19,
20,
31,
32,
58]. On the contrary,
Figure 12b also shows weak spots which can be assigned to metastable
η′-phase particles (see References [
25,
32,
33]) and to the GP zones and secondary Al
3(Sc,Zr)-phase particles [
19,
25,
57,
67]. Although the presence of the GP zones,
T-,
η′- and Al
3(Sc,Zr)-phase particles has been demonstrated in electron diffraction (
Figure 12), the individual types of the particles could not be easily recognized in conventional TEM image thanks to the high density of the particles (
Figure 11). One can therefore mention that the phase composition is different in different places of the samples even after heat treatment.
SEM and TEM observation of the 7075-ScZr alloy in the HT state after isochronal heat treatment up to 440 °C proved a coarsened secondary Sc,Zr-containing phase particles—see
Figure 13. A volume fraction and composition of the eutectic grain boundary phase stay unmodified and the grain size does not vary in comparison to the initial HT state of the alloys (see above Chapter 3.1.). Furthermore, the Zn,Mg-containing (co-)clusters/GP zones and other phases (
T-phase,
η’/
η-phase) disappeared during the isochronal annealing up to this temperature. The dissolution of these phases is mainly connected with the resistivity increase above ~360 °C (see
Figure 9). At temperatures above ~240 °C, particle precipitation of the
η-phase and
S-phase was proved in the Al–Zn–Mg–Cu-based systems, e.g., see References [
20,
25]. This precipitation is a probable explanation of the undulating of the electrical resistivity curves in the 3-stage (
Figure 9) and microhardness HV0.5 curves (
Figure 9 and
Figure 10) at a temperature range of 250–350 °C. One can also conclude that the annealing is sufficient for homogenization of the Al–Zn–Mg–Cu-based system, but it is insufficient for the Al–Sc–Zr-based system, again. Microhardness development of the all alloys studied (
Figure 9 and
Figure 10) reflects the Sc–Zr addition at temperatures above ~300 °C. Assuming the presence of the primary and secondary Al
3(Sc,Zr)-phase particles it can be also concluded that the yield strength cannot be captured as a linear superposition of several strength contributions. This conclusion is in an agreement with other observations in commercial 2xxx, 6xxx and 7xxx alloys, see References [
20,
25,
65,
67,
68,
69].
3.4. Thermal Properties of the Alloys
Due to the acquired additional characteristics about the kinetics of phase development in the 7075(-ScZr) alloys in the different states, the apparent activation energy of the thermal processes by using DSC were calculated. The following states of the 7075 and 7075-ScZr alloys were used for the thermal study: HT, HT + NA (3500 h at RT) and HT + NA15000 (15,000 h at RT).
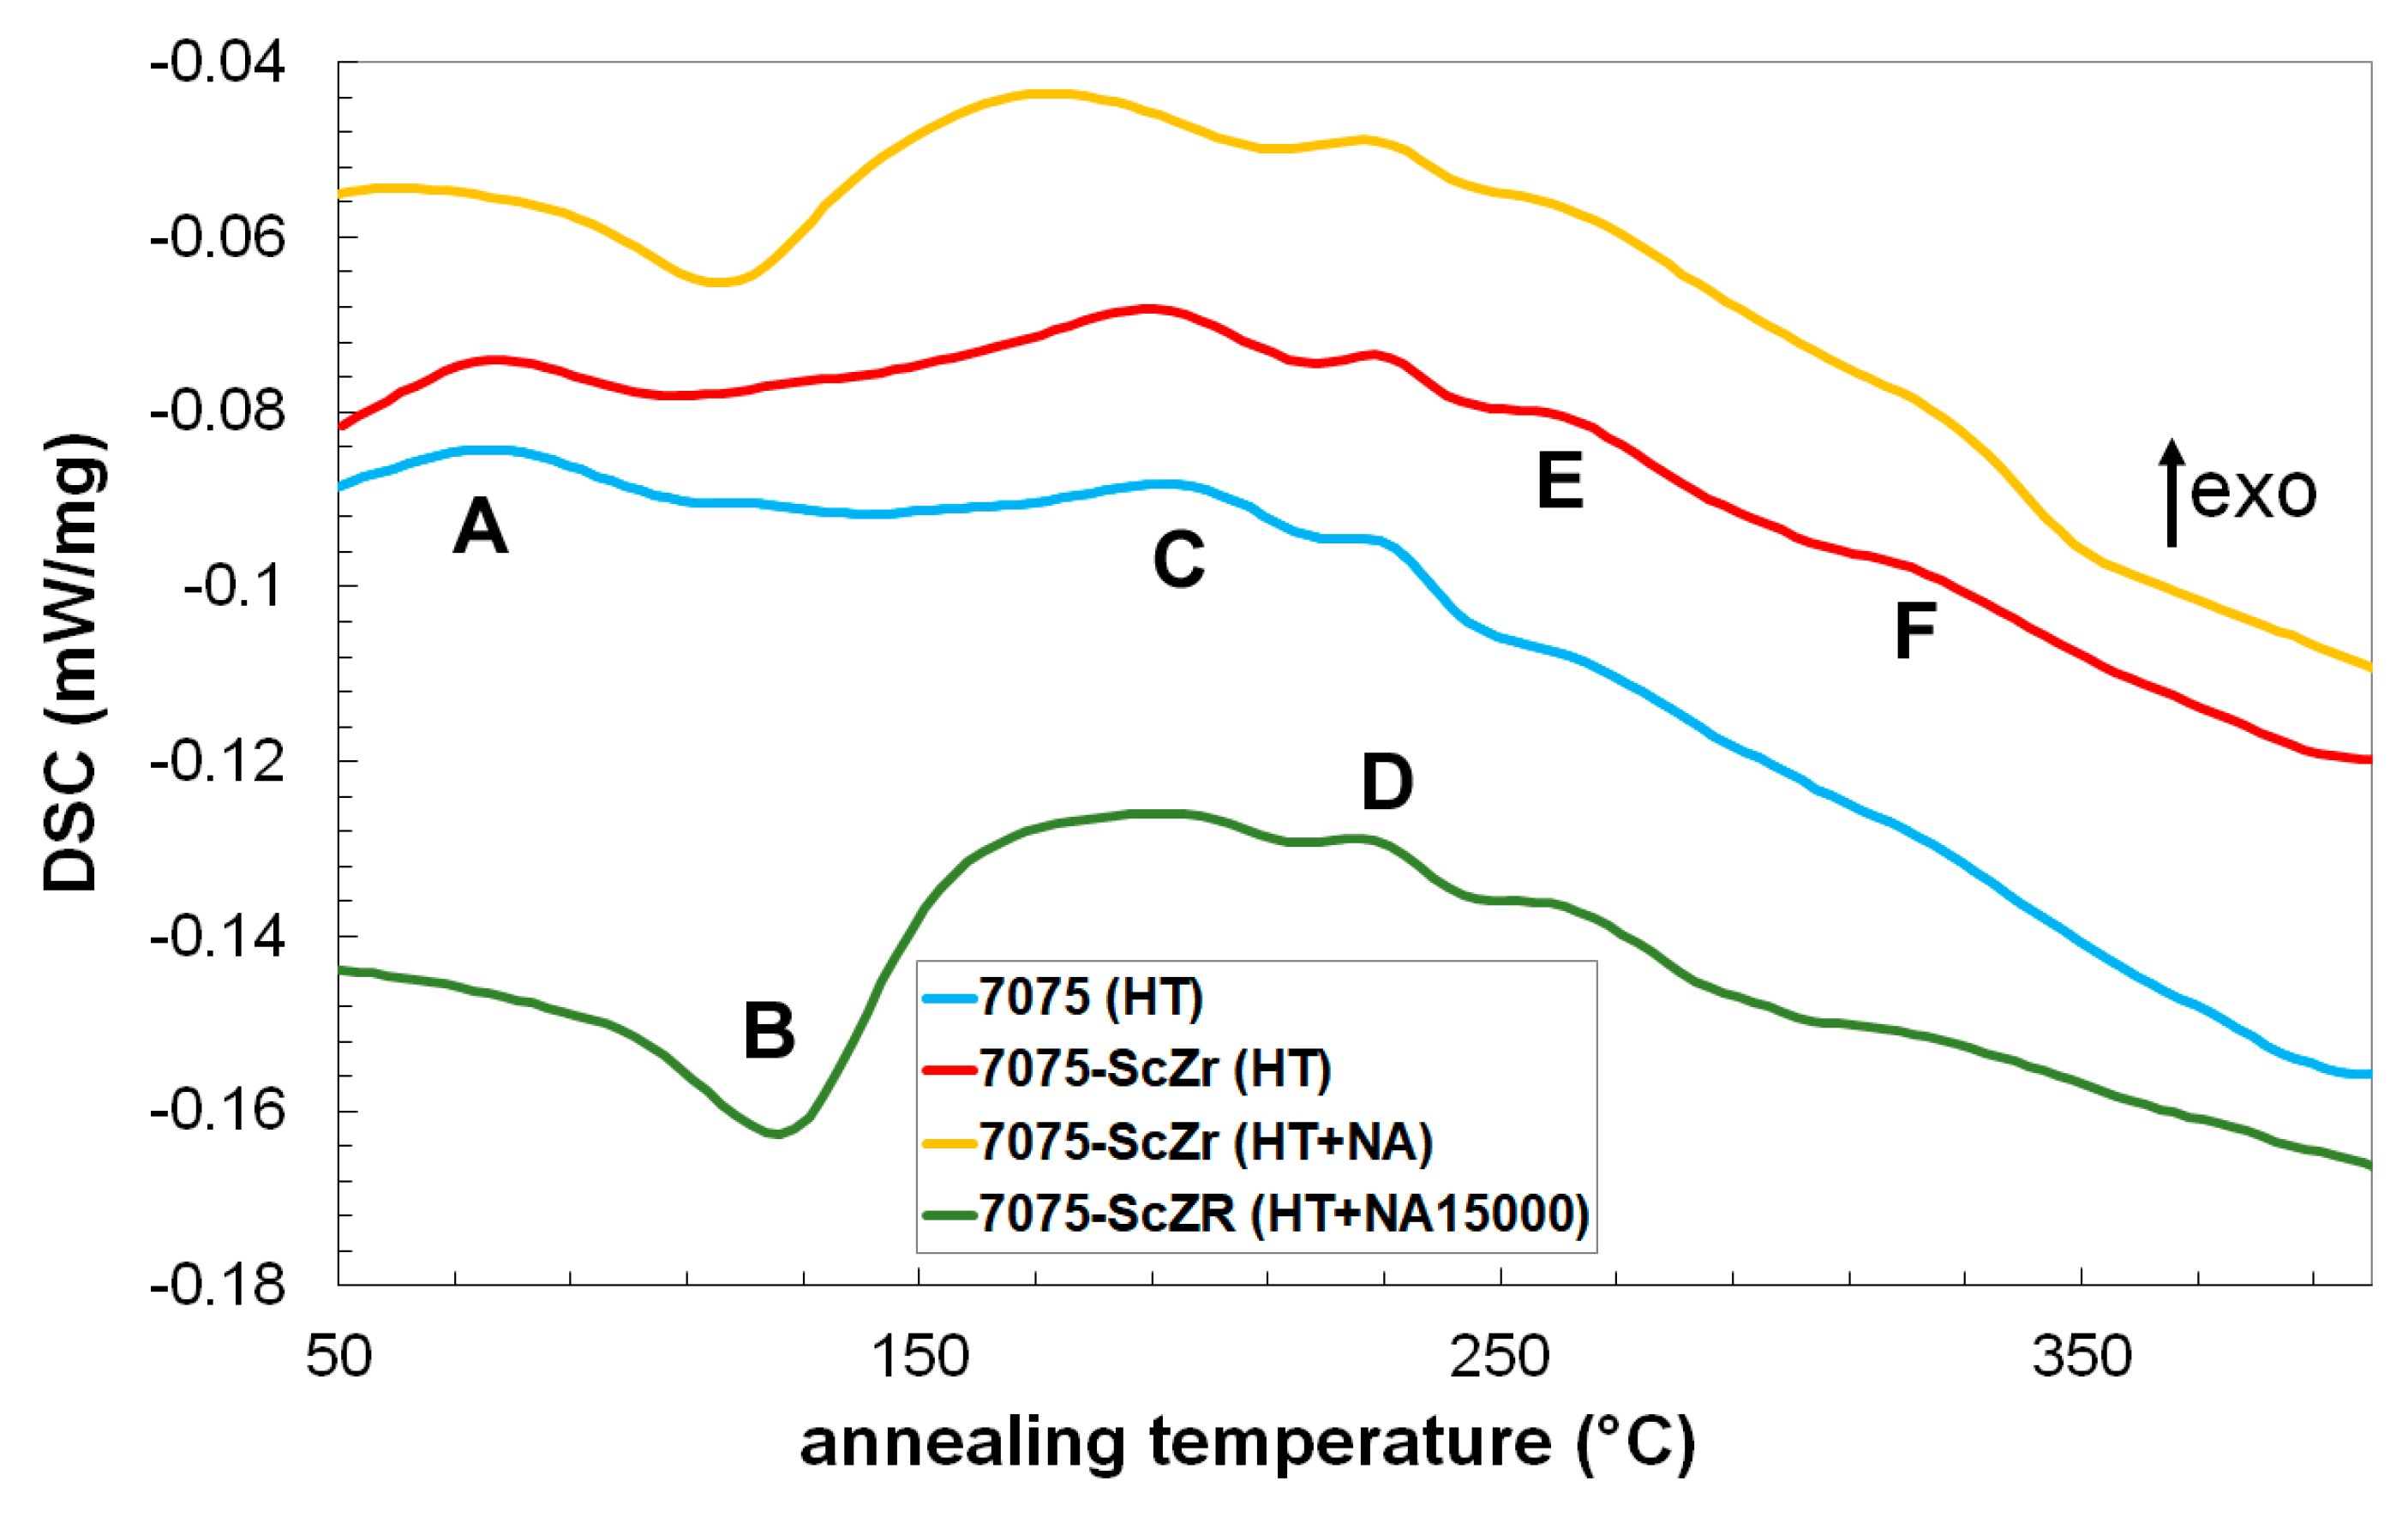
Figure 14 shows, for clarity only, selected DSC thermographs up to 400 °C for one heating rate (5 °C/min). The curves mainly differ due to natural ageing (the HT state vs. HT + NA state and HT + NA15000 state). One endothermic effect marked B and five exothermic effects marked A, C–F (see
Figure 14) are shown in the DSC curves of the samples.
Table 5 shows characteristic temperatures
Tm of a DSC peak of maxima/minima of the thermal effects A–E in the alloys studied in the HT and HT + NA state. The exothermic effect C in the HT + NA state and the effect F in all the alloys studied were very often too weak to be analyzed through the materials studied, so they are not listed in
Table 5.
The apparent activation energies Q of the observed effects A–E (see
Table 6) were determined by the Kissinger method [
24,
70] based on the data obtained from the DSC curves (
Table 5) and the knowledge that the characteristic temperatures
Tm correspond to the maxima (minima) of the observed process and maximum process speed of the observed effect, respectively. Then the activation energies Q for the individual thermal effects are determined by a linear regression, i.e., ln(
δ/
Tm2) plotted vs. 1/
Tm, where
δ is the heating rate. Some activation energies were not calculated as a consequence of a low markedness of the maximum heat flow (e.g., effect C for the HT + NA alloys).
The exothermic effect A corresponds well to the hardening and resistivity decrease (1-stage) up to ~140 °C of the HT alloys, see
Figure 9. The endothermic effect B corresponds well to the softening up to ~120 °C of the HT + NA alloys (
Figure 10). The effect A obviously corresponds to the production of (the precursors of) the GP zones, effect B to their dissolution, respectively. Given the available experimental options, it is not possible to distinguish between coarsening of the precursors of the GP zones ((co-)clusters) and the GP zones. The activation apparent energy values of the effect B (~102 kJ/mol) are in a good agreement for the dissolution of the GP zones, those reported in References [
25,
71,
72,
73]. The temperature range of the dissolution is logically higher and activation energy values are logically also higher than the values for the effect A (~82 kJ/mol)—the formation of the (co-)clusters/GP zones [
25,
52,
63]. The temperature range of the effect B (i.e., (co-)clusters/GP zones dissolution) is slightly influenced by the natural ageing time, cf. HT + NA state and HT + NA15000 state in
Figure 14. However, measurements on the HT + NA15000 sample were made only once (at one heating rate only).
The exothermic processes C and D correspond well to the hardening with a maximum at ~180 °C of the alloys in the HT and HT + NA state as well as the resistivity decrease in the 2-stage (cf.
Figure 9,
Figure 10, and
Figure 14). As the microscopy observation by TEM at 220 °C is shown in
Figure 11 and
Figure 12, these effects C and D can be assumed to be associated with metastable
η’-phase and non-eutectic stable
T-phase particle precipitation. The activation energy of the effects C and D were calculated as ~112 kJ/mol and ~133 kJ/mol, respectively. The calculated value for the precipitation of the
η’-phase particles in the studied alloys excellently agrees with the values for the precipitation of the
η’-phase determined in the Al–Zn–Mg-based alloys [
25,
72]. Although the data in literature for the
T-phase precipitation are usually not available, in our previous study [
25] we calculated the activation energy in the alloys with comparable composition without Cu for this precipitation in the range of 128–168 kJ/mol. But the result was based only on a few experimental points. Given the direct evidence using TEM (
Figure 12) in this study, it can be concluded that the effect D is very probably connected with the
T-phase precipitation. From the obtained results it can also be deduced that the formation of the
η’-phase particles is affected by natural ageing at RT similarly to the formation/dissolution of the (co-)clusters/GP zones, while the
T-phase precipitation is not affected by natural ageing.
The activation energy for the effect E is calculated as ~125 kJ/mol. The energy value could not be determined for the effect F because a weak thermal process was detected only for some heating rates. The calculated value of the effect E is in an agreement with literature for the precipitation of the stable
η-phase: 118–142 kJ/mol, see References [
25,
71,
72,
73]. Although there is no direct microscopic evidence, the temperature region of the effect F corresponds very well to the temperature range (240–300 °C) of the precipitation of irregular shape
S-phase particles [
20,
25,
58,
74,
75]. Conversely, formation of the
η-phase particles can occur below ~240 °C in the Al-based alloys [
19,
20]. Although the data in the literature for this precipitation are insufficient, the calculated values indicate that precipitation of the
T-phase takes place by a different mechanism than the precipitation of the stable
η-phase. One can also conclude that Sc–Zr addition has a little effect on the ongoing transformation processes, probably due to the fact that these elements are not in solid solution, but in the Al
3(Sc,Zr)-phase particles.

 ,
, 


