Thermal Activation and Ductile vs. Brittle Behavior of Microcracks in 3D BCC Iron Crystals under Biaxial Loading by Atomistic Simulations


Institute of Thermomechanics of the Czech Academy of Sciences (CAS), Dolejskova 5, 18200 Prague 8, Czech Republic
*
Author to whom correspondence should be addressed.
Metals 2020, 10(11), 1525; https://doi.org/10.3390/met10111525
Submission received: 27 October 2020
/
Revised: 12 November 2020
/
Accepted: 15 November 2020
/
Published: 17 November 2020
Abstract
:We present the results of free 3D molecular dynamics (MD) simulations, focused on the influence of temperature on the ductile-brittle behavior of a pre-existing central Griffith through microcrack (crack plane/crack front) under biaxial loading σA and σB in tension mode I. At temperatures of 300 K and 600 K, the MD results provide new information on the threshold values of the stress intensity factor K and the energy release rate G, needed for the emission of <111>{112} blunting dislocations that support crack stability. A simple procedure for the evaluation of thermal activation from MD results is proposed in the paper. 3D atomistic results are compared with continuum predictions on thermal activation of the crack induced dislocation generation. At elevated temperature T and biaxiality ratios σB/σA ≤ 0.8 dislocation emission in MD is observed, supported by thermal activation energy of about ~30 kBT. With increasing temperature, the ductile-brittle transition moves to a higher biaxiality ratios in comparison with the situation at temperature of ~0 K. Near the transition, dislocation emission occurs at lower loadings than expected by continuum predictions. For the ratios σB/σA ≥ 1, the elevated temperature facilitates (surprisingly) the microcrack growth below Griffith level.
1. Introduction
It is known that temperature significantly influences the brittle or ductile behavior of metallic materials since the dislocation motion and consequently the plastic deformation are thermally- activated processes [1]. Temperature also affects the ability of cracks to emit blunting dislocations. It determines ductile vs. brittle behavior at the crack front, i.e., crack stability vs. fracture. In other words, temperature in metals can cause the ductile-brittle transition. The ductile vs. brittle behavior of cracks is extremely important for engineering applications and thus, beside the experiments, it is studied also via continuum analysis and atomistic models.
Rice [2] was the first one who proposed an analysis and a crack stability criterion based on the Peirls-Nabarro model for dislocations and on the self-similar concept of linear fracture mechanics (LFM), utilizing the stress intensity factor K or the energy release rate G = C·K2, where C is an effective elastic coefficient for a given crack orientation.
The influence of temperature on the emission of dislocations from a crack tip is treated in [3] using Rice’s analysis [2]. For many metals, the model [3] predicts an easier dislocation emission at elevated temperatures due to thermal activation, specifically by means of the ratio G/G0 where G is related to a given temperature and G0 is related to the temperature of zero Kelvin (0 K). The model presented in [3] included the stress intensity factor K in its analysis, but it did not include the influence of the so-called T-stress on dislocation emission.
Another study [4] indicates that besides temperature and the K-factor, the brittle-ductile transition at cracks can also be influenced by the T-stress, namely in the case of short cracks.
The T-stress is a constant (non-singular) term occurring in the crack near stress field, acting parallel to the crack plane. The models in [1,2,3,4] consider an isotropic medium.
Unlike continuum models, atomistic simulations avoid the stress singularity at the crack tip and at dislocation cores, describe well anisotropy of crystals, and they can verify continuum predictions on the ductile vs. brittle behavior since they use an independent failure criterion given by the range of cohesive forces. Thermal simulations by MD technique can bring new information on the kinetics, micromechanics and mechanisms of the crack growth that are not directly accessible via experiments.
The studies [5,6] are devoted to the influence of the T-stress in anisotropic bcc iron crystals with an initial temperature of 0 K, both on the continuum and atomistic levels. 3D atomistic results from [6] confirmed the basic predictions following from the anisotropic continuum model [5], relevant for 0 K.
The topic of the present study is the influence of elevated temperature on the stability of a microcrack embedded in a 3D anisotropic bcc iron crystal under biaxial loading, where the T-stress plays a significant role. To the best of the authors’ knowledge, no such a study has been published yet. As in [6], the level of the T-stress is given by the biaxiality ratio σB/σA, as depicted in Figure 1a.
The same N-body potential [7] is used here for MD simulations as in [5,6]. Note that the used N-body potential is of short range and it describes well many of the physical properties mentioned in [6,7], including phonon frequency spectra, which is important for thermal simulations. Also the ductile vs. brittle behavior of cracks in MD simulations with the used potential [7] is in a qualitative agreement with fracture experiments, reviewed e.g., in [8].
No periodic or symmetry boundary conditions are applied in our new 3D thermal simulations by the MD technique. At elevated temperature we are focused just to the initial stage of defect development, where is no need to use a thermostat. The free 3D boundary conditions are adequate for thermal simulations since they enable the unrestricted atomic motion in the all three directions and describe well thermal expansion of the atomistic 3D samples, in agreement with experimental data for bcc iron [9].
Evaluation of thermal activation in MD requires the knowledge of the energy release rate G0 related to the temperature of 0 K that can be derived from the data presented in [6]. For that reason, the geometry of the sample and type of loading in our new thermal simulations must be the same as those for 0 K in [6].
The 3D sample is sufficiently large to describe well the stress field at the crack, including the T-stress, which was confirmed in [6] via comparison of the atomic stress at the microcrack with Savin’s analytical static solution in an extended anisotropic medium under uniaxial tension—see Figure 2a,c in [6]. It means that in LFM the boundary correction factors FI and fI staying at the K-factor and the T-stress are ~1. The used loading rate is also sufficiently slow for comparison with continuum predictions, which is explained in [6] at temperature of ~0 K (see Figure 1b in [6]). Here, the kinetic energy caused by the loading (the lowest green curve near zero) is very low until dislocation emission occurs. The loading rate is sufficiently slow also in the light of the elasto-dynamic crack problems in LFM, reviewed in [10]. This is discussed in Section 3.4 of this paper.
Unlike the other crack orientations in bcc iron, our crack orientation is considered to be intrinsically (inherently) ductile, because the threshold value of the stress intensity Kdisl = 0.892 MPa m1/2 needed for dislocation emission at zero temperature (~0 K) is smaller than the threshold value KG = 0.906 MPa m1/2 for cleavage—see [5,6]. This means that the ductile behavior of the crack is expected also at the elevated temperature due to thermal activation. For that reasons we studied the thermal effects just at two different temperatures important for engineering applications.
In this study, the 3D bcc iron crystal with the embedded central Griffith crack is heated to temperatures of approximately 300 K and 600 K and after that the crystal is gradually loaded. Our first question is how the elevated temperature affects the ductile vs. brittle behavior of the microcrack and how it affects the corresponding threshold values K and G in comparison with the continuum and atomistic predictions for 0 K. The second question is about the degree (amount) of thermal activation in our 3D atomistic simulations in comparison with continuum predictions from [3].
The curved dislocations of a mixed character with the edge and screw components are generally emitted in 3D due to the lower strain energy around the dislocations. The edge character of the emitted dislocations prevails in the middle of the crystal along the crack front, while the screw character is observed at the free unloaded surfaces. Since the relevant continuum predictions consider plane strain along the crack front and the edge dislocations, the threshold values for dislocation emission or the crack initiation in [6] and in this study are evaluated in the middle of the crystal along the crack front, where the plane strain conditions prevail in the 3D atomistic sample (see the positive stress Sz in Figure 2c in [6]) and where the dislocation segments in MD are of edge character.
The results of this study bring new information on the threshold values of the K-factor and the energy release rate G, in relation to temperature and to ratio of the biaxial loading. The topic is important for understanding the defect development in the engineering applications with biaxial loading, e.g., in pressure vessels made of ferritic steels.
2. Simulation Method
To prevent the influence of the sample’s geometry on MD results, we utilized the same 3D atomistic sample (after surface relaxation) for heating as in [6], i.e., the sample dimensions and the loading are the same as presented in [6]. (Atomistic sample consists of 324 atomic planes in the Y direction perpendicular to crack plane, 440 planes (001) in the X direction of potential crack extension and 30 planes (110) in the Z direction along the crack front (crack line)). The total number of atoms in the atomistic sample is N = 2,138,400.
A scheme of the 3D atomistic sample is depicted in Figure 1a, where heating of the sample is indicated by yellow color. The same pre-existing Griffith through crack as in [6] is considered under the external biaxial loading σA and σB. The initial half crack length a = 11 ao, where ao = 2.8665 Å is the lattice parameter corresponding to the Fe-Fe potential from Table 2 in [7], used in our MD simulations.
After some heating period (free of external forces), the 3D atomistic sample is gradually loaded as in [6]. (The atomistic sample is loaded with prescribed external forces at the top and the bottom of the sample in directions (by σA) and also in <001> directions (by σB = α σA, where α is a chosen biaxiality ratio). The applied stress σA and the external force per one atom are related via simple relations: FextA = A110 × σA where A110 = (ao)2/√2 is the area per 1 atom in <110> direction and FextB = A001* σB where A001 = (ao)2 is the area per 1 atom in <001> directions. The external forces are distributed to six surface layers to avoid a failure at the loaded borders. When Fext is distributed into 6 layers then the force per one atom in the loaded borders corresponds to F1 = Fext/6). The work Wext (t) done by the external forces during the continuous loading at a time t is denoted in Figure 1 by Wext.
We use our in-house MD code for the free 3D thermal simulations. As mentioned in Introduction, no thermostat and no periodic boundary or symmetry conditions were applied. Before loading, all surfaces are free and there are no constraints in any directions during further simulations, i.e., all the atoms are free to move in all 3 directions.
The initial stage of the 3D atomistic sample corresponds to the situation after the surface relaxation with the total potential energy E0 and the volume V0, like in [6]. At this stage, free of external forces, the sample is suddenly heated (unlike [6]) at time step 0 by picking the values of atomic velocities as prescribed by the Maxwell-Boltzmann distribution corresponding to an initial temperature T0 and an initial kinetic energy 3/2 NkBT0. Starting from this moment, Newtonian equations of motion for individual atoms are solved in all three directions X, Y and Z by a central difference method using the basic stable time integration step h = 1 × 10⁻¹⁴ s, as in [6]. The period of heating corresponded to 1000 h and the atomistic sample was heated without any loading. The immediate values of the potential and kinetic energy fluctuate during time integration. The total kinetic energy Ekin ≡ Ekin(t) in the system decreases gradually with time t. After some relaxation time t = n h, the system (free of external forces) reaches a steady state (see Figure 1b,c), where the average value <Ekin(t)> in the system corresponds to an average temperature T = T0/2. Here T is given by the Boltzmann relation for three degrees of freedom 3/2 N kB T = <Ekin(t)>. Atomic velocities remain randomly distributed by the Maxwell-Boltzmann distribution during the time integration. Heating also causes the increase of potential energy in the system, since the atoms deviate from their equilibrium positions and the lattice is subject to thermal expansion, which increases the total potential energy. In a steady state at temperature T, the average change of potential energy Epot ≡ Epot(t,0) = Epot(t) − Epot(0) is <Epot(t,0)> = <Ekin(t)> = 3/2 N kB T according to the equipartition theorem. In our standard simulations with the time integration step h = 1 × 10⁻¹⁴ s, the steady state is reached in the time interval t = (100–1000 h), where the final temperature corresponds either to T ≈ 300 K (Figure 1b) or to T ≈ 600 K (Figure 1c). In the time interval t = (100–1000 h), a steady state exists with approximately constant values of the total energy E (T) = E0 +3 N kBT, volume V (T) = V0 (1 + 3β T), and temperature T = <Ekin(t)>/(3/2 N kB). In this steady state (without any loading), we may describe the system as a canonical ensemble (T, V, N). Here, β = 11.30–12.25 × 10⁻⁶ K−1 is the linear thermal expansion coefficient at 300 K and 600 K evaluated in [9] for bcc iron with the potential in use.
After time step 1000, the external forces are gradually (linearly with ∆t = t – 1000 h) applied at the sample borders (Figure 1a) and the system is driven out from its thermodynamic equilibrium at steady state. The total potential energy E and the volume V increase due to gradual deformation of the atomistic sample. Nevertheless, Figure 1b,c show that our system preserves the constant level of the average kinetic energy <Ekin(t)> (which means constant T) even in the loading phase of the simulations, until a dislocation emission (or other crack tip process) occurs. The gradual deformation of the sample is isothermal and thus, our simulations can be described as a non-equilibrium molecular dynamics (NEMD) with constant temperature. This is discussed more in detail below and in Section 3.4.
As shown in Figure 1b,c, at the elevated temperature the work Wext done by external forces is consumed by the potential energy Epot via increasing the strain energy in the atomistic sample and not by the kinetic energy in the system. It is the same as in [6]. The part of the kinetic energy coming from the loading (see Figure 1b in [6]) is more than two orders of magnitude smaller than the potential energy or the work done by external forces during the gradual loading. This explains why in the present study Ekin(t) is maintained at constant average level without any thermostat (see Figure 1b,c). In other words, our system is sufficiently large and the loading is sufficiently slow to keep a constant temperature T in the system for many steps in time even in the loading phase. In this region, the global energy balance Wext(t, 1000 h) = Epot(t, 1000 h) + Ekin(t, 1000 h) is expected in the system. This balance and MD results may be influenced by the magnitude of the time step, as mentioned below.
At temperature of 300 K we performed tests with a finer time step h1 = 0.5 × 10⁻¹⁴ s during the heating. The random thermal atomic motion causes the physical quantities to fluctuate even after a steady stage corresponding to a given temperature is reached in the system. Since we detected no significant differences in the behavior of the important monitored quantities using the smaller time integration step h1 during the heating at 300 K (i.e., in potential and kinetic energy, number of interactions, crack length, etc.), we decided to use the stable time step h = 1 × 10⁻¹⁴ s for further standard simulations with loaded crystals, as in [6].
At the temperature of 600 K, we tested a very short (small) time step h2 = 1 × 10⁻¹⁵ s also during the loading with biaxiality ratios α = σB/σA = 0.0 and α = 1.1. The results are presented and discussed in Section 3.2.
At each time step, we monitored the same global and local quantities as in [6], including the crack length and the relative shear displacement U10 in the slip systems <111>{112} at the crack tip in one middle plane (110) of the 3D crystal at B/2, as mentioned in the Introduction. As well the crack length is monitored in the middle of the crystal to determine the different threshold values of the K-factor at elevated temperatures. At selected time steps intended for graphical output, we printed the coordinates, the local coordination numbers KNT(li) and the local kinetic energies Ekin(li) of the all atoms li in the 3D atomistic sample.
We created the graphical 3D and 2D visualizations of our MD results using the commercial computing environment Matlab (R2018a, The Math Works, Inc., MI, USA). For 2D visualization, we use a (110) crystallographic plane (usually from the middle of the crystal) as the observation plane. Crystallographic orientation at 3D visualization is marked in the individual figures.
Unlike in MD simulations with the initial temperature of 0 K in [6], in the present study all the monitored quantities fluctuate after heating, due to random thermal atomic motion. For that reason, at an elevated temperature the energy balance (verified at each time step) is obeyed with a worse accuracy than in the simulations beginning at the initial temperature of 0 K. For example, under uniaxial tension (biaxiality ratio α = 0) at the time t = 5000 h, the energy balance ∆Wext(t, 0 h) = ∆Epot(t, 0 h) + ∆Ekin(t, 0 h) is obeyed with an accuracy of 0.055% for the temperature of ~ 0 K. At the temperature of 300 K, the energy balance ∆Wext(t, 1000 h) = ∆Epot(t, 1000 h) + ∆Ekin(t, 1000 h) is obeyed with an accuracy of about 4.32% and at 600 K with an accuracy of 9.44%. Using the time step h2 for 600 K and equivalent loading at the time t = 50 000 h2, the corresponding energy balance ∆Wext(t, 10,000 h2) = ∆Epot(t, 10,000 h2) + ∆Ekin(t, 10,000 h2) is obeyed with an accuracy of 7.18%.
3. Results and Discussion
As follows from the stress analysis presented in [5,6], the stress state at microcrack can be described well by LFM including both the stress intensity factor K and the T-stress.
In our standard thermal simulations, we use the same loading rate (dσA/dt = 13.64 GPa/12,000 h) and the same time integration step h as in [6]. This means that for a chosen biaxiality ratio α = σB/σA, the level of applied stress at time t and temperatures of 300 K or 600 K is given by the relations σA (t) = ∆(t) × 13.64 GPa/12 000 h, where ∆(t) = t − 1000 h and σB (t) = α × σA (t), since 1000 h represent just free heating without any loading. The corresponding values of applied stress intensity KA (t) and T (t) at temperatures of 300 K or 600 K can be calculated as:
where the boundary correction factor for our sample geometry is FI = 1.014 by [11] and the anisotropic factor for our crack orientation is Re(μ1μ2) = −0.8857, as derived in [5] and verified in [6] for the potential [7]. In terms of the K-factor, the loading rate corresponds to dKA/dt = (dσA/dt)(π a)1/2 = 0.0055 KG/ps, where KG is the Griffith stress intensity factor mentioned in the Introduction.
KA(t) = FI·σA(t) (π·a)1/2 and T (t) = σA (t) [Re(μ1μ2) + α]
As in [2,3,4,5,6], we define the complete dislocation emission as the situation when the relative shear displacements at the crack tip on the inclined <111>{112} slip systems reaches the level U10 = b, where b = ao√3/2 is the Burgers in the bcc lattice. This is monitored in a middle layer 15 along the crack front (at B/2). At this moment, the dislocation core is already at further distance from the crack tip and the dislocation segment is of a straight edge character (see Figure 2 and Figure 3), as considered in the referenced model [5].
The threshold values KA(t) and T(t) presented in Table 1 are related either to the time t = te or t = tc, denoting the moment when the emission of dislocations or crack initiation were monitored by MD at the temperature of 300 K or 600 K. More precisely, ∆t(e) = (te – 1000 h) denotes the loading time when U10/b = 1 in the middle of the crystal. The time ∆t(c) = (tc – 1000 h) denotes the loading time when crack advance is first detected in (110) middle plane (layer 15 at B/2) of the 3D crystal by the MD code via KNT-numbers.
Note that none of the results presented are impeded by the back-wave reflections from the loaded borders coming from acoustic emission caused by dislocation emission or by a crack extension, as discussed in [6] and [12]. We are focused on the initial stage of defect development, which enables a comparison with continuum predictions.
3.1. MD Results for 300 K
This case is interesting for fracture experiments, which are usually performed at room temperatures close to 300 K. The results obtained from the free 3D simulations with an initial temperature of 300 K are summarized in Table 1, together with the results for 600 K.
The results in Table 1 for 300 K show that the emission of blunting dislocations <111>{112} occurs at a lower applied stress intensity KA (t) than in the results in [6] for 0 K and the ductile-brittle transition is shifted to a higher value of α = 0.7. Below the critical value of α = 0.7, the microcrack emits blunting dislocations <111>{112}. The lower threshold values KA at 300 K meet the expectation that elevated temperature makes dislocation emission easier. (We provide a comparison with continuum predictions from [3] in Section 3.3).
Due to the random thermal atomic motion, dislocation emission has a more random character at elevated temperatures than at 0 K. This means that the first emission at elevated temperature occurs randomly at the left or at the right crack tip of the upper or the lower crack face. Therefore it is necessary to monitor the relative shear displacements U10 in the slip systems <111>{112} both at the left and right crack tips simultaneously at each time step, in order to reliably evaluate the threshold values of the applied stress and K-factor needed for dislocation emission.
Dislocation emission at 300 K under uniaxial tension (α = 0.0) is illustrated in Figure 2. Time development of the relative shear displacement U10/b at the lower right crack tip is shown in Figure 2a. The short horizontal line indicates the first emission, when U10/b = 1 at the left crack tip (for the precise time step, see Table 1). The second emission occurred at U10/b = 2, etc. 2D visualization of the first emission in a middle observation plane (110) is in Figure 2b, where the four emitted dislocations with corresponding slip systems <111>{112} are shown. This figure also illustrates that when U10/b = 1 at the crack tip, the dislocation core is located at larger distance, of about 14–15b from the crack front. Figure 2c illustrates the crack blunting at later time step 8000, caused by the multiple emissions from the left and right crack tips. The emission from the upper and lower crack tips may not be symmetric at elevated temperature.
Figure 2d shows fluctuation of the local kinetic energy at the crack tip before and during the first dislocation emission. The horizontal line corresponds to the average kinetic energy per one atom of 3/2 kB·300 K. The last peak value shows the time te = 7068 h of the dislocation emission from Figure 2a.
3D visualization of the four emitted dislocations at 300 K is shown for the biaxiality ratio α = 0.1 in Figure 3. Like in [6], the dislocation cores consist of the red interstitial atoms with coordination numbers KNT = 16–17 and the green atoms with KNT = 13. The surface atoms with KNT = 10 are shown in blue. As mentioned in [6], the regular number of the neighbors of a single atom in a perfect bcc iron crystal for the potential in use is KNT = 14.
This means that the isolated clusters of green atoms in Figure 3 represent vacancies produced by the elevated temperature of 300 K, as expected. This is not observed at temperature of ~0 K—see [6].
With increasing biaxiality ratio α, the magnitude of the negative T-stress decreases according to Equation (1) and the dislocation emission becomes more difficult. The last emission <111>{112} at the temperature of 300 K occurred at the biaxiality ratio α = 0.7. This is documented in Figure 4 where 4(a) shows the shear displacements U10/b during the emission from the left crack tip and 4(b) shows the dislocation configuration at the later time step 8000. One may see that only two dislocations are emitted initially at the biaxiality ratio α = 0.7, unlike the four dislocations in Figure 2b or Figure 3 for α = 0.0 and α = 0.1. Nevertheless, the threshold value α = 0.7 is higher at 300 K in comparison with the results for 0 K in [6] (where the last emission <111{112} was monitored at α = 0.5), since thermal activation facilitates the process of dislocation generation at the temperature of 300 K. The emission of the blunting dislocation <111>{112} at ~300 K was observed experimentally e.g., in [8].
Under the higher biaxiality ratio α = 0.8, only the generation of dislocations <111>{112} was detected in the MD simulations, but not emission. Instead, the emission of the other dislocations <111>{011} occurred earlier than in [6], as indicated in Table 1. A scheme for the oblique slip system <111>{011} is given in Figure 7 in [6], where also a visualization of the oblique emission <111>{011} is shown. As explained in [6], this oblique emission <111>{011} causes a separation of the planes {112} which may lead to decohesion [13] along the slip planes {112} and consequently to crack deflections. This was observed experimentally at edge cracks —see Figure 15 in [8].
At the temperature of 300 K, we observed twin formation already at α = 0.9, while at 0 K in [6] it was at α = 1.1. Furthermore, a new slip process was observed in MD at 300 K, namely the formation of twins on {112} oblique planes (Figure 5b) intersecting our (110) observation plane in an oblique direction. The oblique twins are not produced by the crack itself. They arise at the intersections of the inclined easy twins above and below the crack. It is illustrated by Figure 5 and Figure 6 in this study (note that the inclined slip plane contains the crack front, while the oblique slip plane intersects the crack front in an oblique direction).
Generation of oblique twins can be explained by the fact that a new (increased) stress concentration arises at the twin intersections, supporting the oblique twinning. The stress barrier for easy twinning with the used potential is τtwin = 9.3 GPa, as follows from the block like shear (BLS) simulations at 0 K [14]. Continuum models show us that terminated twin tips may lead (e.g., [15]) even to decohesion and microcrack nucleation, which is observed also in MD simulations, e.g., [16]. Figure 6 for α = 1.0 shows the slip patterns arising from the inclined and oblique twins in our standard (110) observation plane and in a perpendicular plane above the crack. The slip patterns are verified using BLS simulations in perfect bcc crystals.
As mentioned in Section 2, the relative displacements are monitored at the crack tip and at its nearest neighboring atom lying on the free crack face in the [001] direction in the (110) observation plane. The distance between two atoms in the [001] direction is the lattice parameter ao, which corresponds to the second neighboring plane {112} in the <112> direction (perpendicular to the active slip plane). It is well known [17] that an elementary stable twin is created at least by 3 layers {112} that are mutually displaced by b/3. This means that the second neighboring {112} plane (where the free monitored atom lies) must be shifted by 2 b/3 with respect to the fixed plane {112} where the crack tip atom lies, i.e., the relative shear displacement of the two atoms in the <111> {112} slip system after twin formation must be U10/b = 2/3. This illustrates Figure 7. Twin formation with the potential used is treated in detail in [14].
Figure 7 for 300 K shows the shear displacements at the crack tip (Figure 7a) and the corresponding change of crack length ∆(ao) in units of the lattice parameter ao (Figure 7b) for biaxiality ratio α = 1.2. Figure 7 illustrates that crack initiation always slightly precedes the inclined easy twinning generated by the microcrack, as is also indicated in Table 1. The critical time for easy twinning corresponds to the point where the short horizontal line at the level U10/b = 2/3 intersects the oscillating curve U10 in Figure 7a. In Figure 7b we show an interesting new fact—at elevated temperature the crack length fluctuates already during free heating in the interval <0, 1000 h> without any loading. This is caused by the thermal exchange of interactions in the region of crack tips.
3.2. MD Results for 600 K
In MD at an elevated temperature of 600 K (close to the operating temperatures [18] of water cooled reactor pressure vessels [19]), a further decrease of the threshold values KA for the emission of blunting dislocations <111>{112} is detected in comparison with 300 K. In other words, the tested microcrack at 600 K is more ductile and stable up to a higher biaxiality ratio α = σB/σA in contrast to the situation at 300 K. It is illustrated by the following figures and summarized in Table 1.
With biaxiality ratio α = 0.0 at 600 K, the first emission of blunting dislocations <111>{112} was already monitored from the right crack tip at the time te = 5291 h, which corresponds to loading time duration ∆t(e)/h = 4291 and to applied stress intensity KA = 0.494 MPa·m1/2, as indicated in Table 1. Visualization of the four dislocations is shown at time step 5500 in Figure 8. Here, meaning of the red (KNT = 16), green (KNT = 13) and blue (KNT = 10) atoms is the same as in Figure 3. One can see a larger number of the isolated red interstitial atoms at 600 K in Figure 8, in comparison with Figure 3 for 300 K or Figure 4 in [6] for 0 K. This indicates an easier generation of point defects at the higher temperature, as expected by statistical thermodynamics—see e.g., [1]. Generation of point defects on the atomistic level is treated more in detail in [7].
Figure 9 is devoted to the comparison of the results obtained by MD with the standard time step h = 1 × 10⁻¹⁴ s (Figure 9a,b) and the results obtained with the smaller (and very time consuming) step h2 = 1 × 10⁻¹⁵ s (Figure 9c,d). Figure 9c shows that the first dislocation emission under the uniaxial tension (α = 0.0) is detected earlier with the finer step h2, i.e., under lower applied stress σA(t) than with the standard time step h (Figure 9a). Specifically, when using h2 the first emission from the right crack tip is observed at time te = 51,092 h2, which corresponds to ∆t(e)/h2 = 41,092 and σA(t) = 4.670 GPa, while with the standard time step h the threshold values correspond to te = 5291 h, ∆t(e)/h = 4291 and σA(t) = 4.877 GPa (see Table 1). This represents a relative deviation of about 4.24% in the threshold values for σA(t) and the K-factor, which lies within the error bounds resulting from the global energy balance. Disadvantages of the long time consuming simulations with h2 are a possibly larger influence of round-off errors and more intensive crack length fluctuations, even during the free heating in the time interval <0, 10,000 h2>, in comparison with the standard step size h—see Figure 7b.
Similar to 300 K, the number of the emitted dislocations decreases with increasing biaxiality ratio α also at 600 K. The last emission of only two blunting dislocations <111>{112} at the temperature of 600 K occurred in MD with biaxiality ratio α = 0.8, which is illustrated by the 2D visualization in Figure 10a and the 3D visualization in Figure 10b. The isolated red atoms in Figure 10b are the interstitial atoms generated at 600 K. At 600 K, the threshold value of the stress intensity KA needed for the emission is displaced to higher value of the biaxility ratio α = σB/σA than at 0 K and 300 K due to the thermal activation of the emission <111>{112}. This means higher crack stability at 600 K. The dislocation configuration U10/b ~ 1 at the right crack tip later disappears at t ≥ 6200 h. This was confirmed by the 2D visualization at time step 7000, when the situation can already be affected by the back-wave reflections discussed above. Hence, we do not present the results.
Unlike at 300 K, no oblique emission <111>{011} was observed at 600 K in MD with α = 0.8. Some attempts to generate the oblique dislocation <111>{011} were detected in surface layer 3 at time step 7000.
Like at 300 K, with biaxiality ratios α = 0.9 and α = 1.0, crack extension and the generation of inclined and oblique twins were observed in MD at 600 K, which is presented in Table 1. For α = 1.1 at 600 K in MD, we observed a plastic deformation at loaded borders soon after crack initiation and a subsequent crack healing. The plastic deformation was realized via twinning on oblique planes {112} presented schematically in Figure 5b. This can be explained by the low stress barrier τtwin = 9.3 GPa [14], [6] for twinning with the potential in use and by the elevated temperature of 600 K. At the temperatures of 300 K and 0 K, the deformation of borders did not violate the initial stage of crack development accompanied by generation of the inclined twins above and below the crack faces. We repeated the run at 600 K with the finer time step h2. It was not helpful; the same sequence of processes was observed in these MD simulations: crack initiation and healing, deformation of borders and, with a delay, crack induced generation of the inclined easy twins (possibly impeded by the deformation of borders). The threshold values σA and KA for crack initiation from these two runs differ by about 4.7%.
Generation of oblique twins mentioned at 300 K was observed also at 600 K—see Figure 11. Crack initiation and crack-induced twinning at 600 K with biaxiality ratio α = 1.2 were observed as unimpeded by the deformation of borders, since they occurred before the plastic deformation of the loaded borders (observed in MD at time step 6500). Figure 11 and Figure 6a illustrate that the easy twinning accompanies crack growth. Correlation of the twinning and fracture is also often observed experimentally: for bcc iron-based materials, see e.g., [20,21].
Stress analysis of all the observed slip processes generated by the crack is given in [6], both on the continuum and atomistic levels. It is treated in detail in [22] in the framework of anisotropic LFM.
LFM stress analysis of a possible effect of the T-stress on crack deflections or directional stability of the extending crack in isotropic continuum is presented in [23]. Our MD results concerning crack deflections are not in contradiction with the conclusions from [23], since the deflections are caused indirectly via dislocation emission on the oblique slip systems {011}<111> as discussed above.
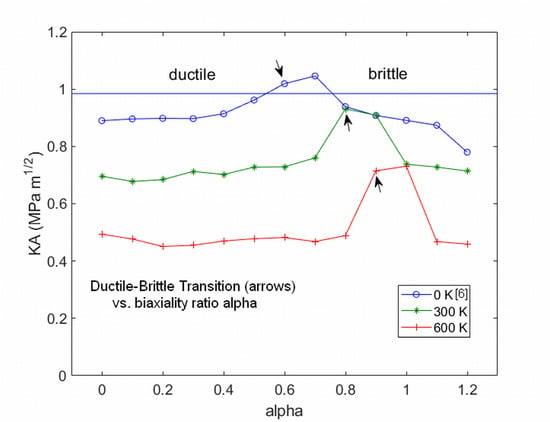
Final comparison of our new MD results for 300 K and 600 K with the previous results in [6] for 0 K is presented in Figure 12. In its left part Figure 12 illustrates how the elevated temperature can facilitate the emission of blunting dislocations and decrease the threshold value of the applied stress intensity KA needed for the emission, in dependence on the biaxiality ratio α = σB/σA, i.e., on the T-stress via relations (1). The arrows in Figure 12 indicate how the ductile-brittle transition is shifted toward higher values of α with increasing temperature.
In the framework of LFM, the presented threshold values KA in Figure 12 and Table 1 could be considered as a material parameter Kdisl = KA and, according to relations (1), serve as a rough assessment of crack stability even in the case of longer cracks of our orientation embedded in larger grain in ferritic steels. However, in the case of a macroscopic crack length a, the T-effect will be less significant than at our crack of the nano-scale dimensions. This is obvious from the relation:
that follows from Equation (1) for an extended medium with FI = 1. We should note here that the T-stress and the K-factor in finite samples also depend on the relative sample dimensions a/W and H/W—see e.g., [24] and [11].
T = KI [Re(μ1μ2) + α]/(π a)1/2
Table 1 shows that the emission of blunting dislocations <111>{112} hinders the crack growth in the ductile part of Figure 12 at all the tested temperatures. It is clear that blunting dislocations <111>{112} play a key role for the stability of our crack . Note that the blunting dislocations <111>{112} were observed experimentally at an edge crack also in [25]—see e.g., Figure 4 in [25]. Thermal activation of dislocation emission in the ductile region is discussed in the next Section 3.3.
In the brittle part of Figure 12, there is a difference between the crack growth rate at an elevated temperature and at zero temperature. Crack growth is significantly slower at 300 K and 600 K than at 0 K. If the initial crack growth rate Vcr presented in Table 1 is related to the velocity of the transversal (shear) waves Cs = 3832 m/s in [001] direction (see Figure 1a), then the ratio Vcr/Cs is approximately between 0.03 and 0.06 at the elevated temperatures of 300 K and 600 K, while at temperature of 0 K it is Vcr/Cs ≈ (0.12–0.35) according to [6]. The maximum value 0.35 at 0 K corresponds to the cleavage at the biaxiality ratio alpha = σB/σA = 1, as expected. The slower crack growth of about ~0.12 Cs at 0 K is accompanied by twinning above and below the crack faces, which is similar to the MD results for 300 K and 600 K in the present study. The significantly slower crack growth (0.03–0.06 Cs) at elevated temperatures is probably caused by the additional generation of oblique twins that were not observed in the MD simulations in [6] with initial temperature of 0 K.
3.3. Thermal Activation of Dislocation Emission and Twinning at the Crack Front
It has long been known that random thermal atomic motion (thermal fluctuations) can contribute to overcoming the energy- or stress-barrier for a given process. The amount of energy that can be supplied from thermal fluctuations is called activation energy [1,3].
At first we focus on thermal activation of the emission of the blunting dislocations <111>{112} that play a key role for the stability of our microcrack .
In [3], it was established that at a temperature T, the activation energy per atom contributing to a dislocation emission from a crack in a metal is about ~30 kBT, where kB is the Boltzmann constant. By [3], this thermal activation in bcc Fe can cause a dislocation emission at loadings of G ≈ (0.8–0.9) Gcrit at room temperature (~300 K) and (0.7–0.8) Gcrit at ~600 K. Here, Gcrit means the energy needed for the dislocation emission without any help from the thermal activation (i.e., at temperature ~0 K). We denote this energy as Gcrit = G0.
To evaluate the degree of thermal activation from our MD data we will assume that the activation energy is generally m kBT per atom. Then, at a temperature T, the corresponding energy release rate G (unit J/m2) used in LFM and treated in [3] can be written as:
where ahkl = a112 = ao2 (3/2)1/2 is the area per atom in a slip plane {112}, G = C K2 by LFM and C is an elastic coefficient given by the elastic constants. In our anisotropic case, treated in [5,6], C = 3.863 × 10⁻¹² m2/N for the used potential from [7]. The value G0 corresponds to the temperature of 0 K and hence we used the threshold values KA(t) from [6] for the K-factor. At temperatures of 300 K and 600 K, the corresponding threshold values KA(t) from Table 1 are considered. The results from our MD simulations for the different biaxiality ratios α = σB/σA are given in Table 2, where also the relative ratios G/G0 from MD and those predicted by ref. [5] and Equation (3) are given to describe the degree of thermal activation. In the last case, G0 is determined from the last row of Table 1 in [5] using γus = 1.14 J/m2 for the potential we use.
G = G0 − m kBT/ahkl
It may be seen in Table 2 that the individual values of m fluctuate but the average values m = 31.70 for 300 K and m = 29.20 for 600 K agree well with the laboratory scale estimate (prediction) for the activation energy ~30 kBT per atom presented in [3]. Note that according to the comparative analysis presented in Figure 10 in [3], the thickness B of our atomistic sample is sufficiently large, since the ratio B/b = 24.5 lies in the asymptotic region H/b ≥ 20 where an agreement between continuum and MD predictions can be expected according to [3]. (Here, b is the Burgers vector and B = 30 d110 = H in our case.)
Table 2 also shows that, in the case of our microcrack, the degree of thermal activation G/G0 in MD differs significantly from G/Gcrit predicted for the cracks in bcc Fe in [3]. This is discussed below.
As mentioned in the Introduction and presented in [4,5,6] and [26], the continuum models including only K-factor are not capable of describing well the ductile vs. brittle behavior of the short cracks (e.g., model [2] predicts a cleavage at α = 0 in our case). For that reason, our referenced model is the continuum model [5].
The improved continuum Beltz/Rice model for mode I in [5] includes the K-factor, the T-stress, the effect of anisotropy and the tension-shear coupling (normal relaxation) in the slip system <111>{112}. The individual effects are presented in Table 1 in [5]. Using γus = 1.14 J/m2 as in [5], we obtain the needed theoretical values G0 for the individual α = σB/σA. Then from relation (3) we get the theoretical values G/G0 presented in the last column of the Table 2. The continuum model [5], combined with relation (3) proposed in this paper, describes our MD results for G/G0 in Table 2 much better than the models [2] and [3] including only the K-factor. The theoretical prediction in the ductile region σB/σA = <0, 0.5> has a continuous, slightly increasing trend: G = (0.60–0.68) G0 for 300 K and G = (0.22–0.38) G0 for 600 K. The MD values G/G0 in Table 2 rather fluctuate (similar to m) within the corresponding theoretical interval around a constant average value G300 = 0.59 for 300 K and G600 = 0.32 for 600 K. These (somewhat different) MD results are explained below.
Figure 13 compares the predicted G-energies with MD results up to the ductile-brittle transition. Here the predicted G-values are shown by the lines (─) and MD results via circles (o). The G-prediction is based on G0 from ref. [5] and the activation energy of 30 kBT in Equation (3), as mentioned above. At the elevated temperature (Figure 13b,c) one may see that while for α ≤ 0.4 the agreement is good, for α > 0.4 the lower G energies (i.e., loads) are need for the emission of blunting dislocations by MD than expected by the referenced continuum models [5] and [3]. The deviation increases with the increasing temperature. This could be explained via the larger normal separation of the slip planes at elevated temperature in MD than considered in [5] via the tension/shear coupling. The larger normal separation in MD is caused by the free 3D thermal expansion of the bcc iron lattice at elevated temperature, as in [9], and also affected by the free 3D thermal fluctuations. Namely, Table 1 in [5] also shows that with increasing biaxiality ratio α, the influence of normal separation between slip planes increases and the dependence G/γus vs. α becomes more flat (see the 2nd and 3rd rows in the Table 1 in [5]). Note that no thermal effects were considered in [5].
The kinetics of dislocation motion away from the crack tip can also be studied in the initial phase. In this study, it was done in the time interval of about ~ 500 h after the dislocation emission occurred (i.e., before the faster emitted longitudinal L-waves arrive to the loaded borders). Table 3 presents the initial dislocation speed after the emission in terms Vdisl/CT = const, where CT = 3007 m/s is the velocity of the transversal (shear) waves in <111> direction by the potential [7] in use.
One may see that the dislocation speed decreases with the increasing α. This is due to the decreasing nominal shear stress given by the T-stress. For one biaxiality ratio α = σB/σA the dislocation speed decreases with increasing temperature due to the larger thermal random atomic vibrations.
The rate of dislocation generation is much smaller in comparison with the velocity of the emitted dislocations. This follows from the presented dependencies U10/b vs. time. In the case of the named Figure 4a it corresponds to about 0.02 CT. Inserting the T-stress and the tension/shear [13] coupling into Peierls-Nabarro equations in [5] complies with findings from the recent MD study [27] in fcc nickel that the G-energy for dislocation formation depends on the stress state at the crack front.
As to twinning, Figure 12 shows that microcrack growth in the brittle part of the diagram KA vs. alpha is subcritical (occurring below KG = 0.906 MPa·m1/2 for the used potential), which is facilitated by the temperature. A small drop in KG may exist due to the weak temperature dependence of the surface formation energy γ, discussed in [8]. For our crack orientation, at 300 K this is a decrease ∆γ = 0.07125 J/m2, which means a drop in G by ∆ G = 2∆γ = 0.14 J/m2. Much larger decrease in G is monitored by MD simulations. This indicates that the twinning accompanying crack growth is a thermally activated process. It is documented in Table 4, where almost linear temperature dependencies (as in Equation (3)) of the energy releases rate G are presented, together with the evaluation of m in the few individual cases, where the same process occurred at 0 K in [6] and at 300 K and 600 K in this study. The values of m are determined from Equation (3) for T = 300 K and T = 600 K, using G0 = CKA2 with KA from Table 1 in [6]. The last value 28.08 for α = 1.2 is determined from the relation G600 = G300 − m kB(300 K)/a112, following from Equation (3). The average value m = 19.43 for twinning is lower in comparison with m = 30 for dislocation emission. (Note that the value denoted by the asterisk* has been excluded from the final evaluation of m, because in this case, twinning at the crack tip may be influenced by the plastic deformation at the loaded borders, mentioned in Section 3.2.) The standard deviation of m is large (±8.32), since only four cases can be treated. Nevertheless, the lower activation energy ~ 19 kBT for the inclined easy twinning complies well with the lower energy barrier γtwin = 0.62 J/m2 for formation of an elementary 3-layer stacking fault (3 SF) twin [14] in comparison with γus = 1.14 J/m2 for dislocation generation with the used potential. If one assumes that the activation energies for complete dislocation emission and easy twinning should be proportional to the needed relative shear displacements U10 = b (for dislocation) and U10 = 2/3 b (for twin), then the activation energy for the crack induced twinning is of about ~20 kBT. This follows just from the geometry of the bcc lattice and thus, it should be valid also for the other bcc metals. It is known from the experiments that twinning can be thermally activated, e.g., annealing twins. However, no continuum model on the thermally activated formation of twins at the crack front has been published till now according to the author’s knowledge.
It is known that formation of the easy inclined twins at the crack front creates a sharp crack profile (see e.g., Figure 6a) which increases stress concentration in front of the crack and enables the crack initiation below Griffith level (see e.g., [6,14,16]). A new finding from this study is that the process can be thermally activated. The subcritical, thermally activated, plastic crack growth below Griffith level, facilitated by the easy twinning at the crack front, can represent one of the mechanisms of the microcrack growth also for other crack orientations in bcc iron, if the inclined <111>{112} slip systems at the crack front are activated by a sufficiently large shear stress acting in the easy twinning direction. One example is the crack orientation (001)[110] under uniaxial tension, treated in [14] and [16] (here, the inclined twins were generated in front of the crack). Generally, this mechanism can also occur in other bcc, fcc and hcp metals, where twinning is a common deformation process.
3.4. Limitation and Advantages of the 3D Model
Possible errors in MD: While Table 1 and Table 2 show the expected temperature T = T0/2, the detailed analysis of MD results show that the actual temperature in MD is slightly different. The different global and local temperatures in MD represent a possible relative error of about 2.3% - 4.9% in the prediction of GT/G0, as follows from Equation (3). This is comparable with the errors in the global energy balance presented in Section 2. Despite the possible errors, the abovementioned agreement (in Section 3.3) between the prediction of 30 kBT activation energy from [3] and the completely independent MD results for the average m = 31.7 at 300 K and m = 29.2 for 600 K is encouraging. The good match of the G energy from MD and [5] in Figure 13 at the lower values of alpha also a indicates that the MD results presented in Table 1, Table 2 and Figure 12 are reliable.
As for bcc iron, beside the T-stress and temperature (e.g., [28,29]), the ductile vs. brittle behavior of cracks also depends on the crack orientation, e.g., in [25,26] and strain rate (loading rate, e.g., [25]). A review of work done in this field via atomistic MD simulations one can find in [30], including MD limitations concerning strain rate (loading rate) and the size effects. This is discussed below.
It is known from the solutions of the elasto-dynamic crack problems in finite specimens [10], that the term slow or fast loading is relative, since it depends on the sample dimensions. Under uniaxial loading σA in tension mode I, it depends on the relation between a critical loading rise time ∆t (to reach e.g., Griffith stress) and the half period T(λ)/2 of the basic vibrations λ/2 = L, were L is the sample length (in Figure 1a: L = 2H). If the rise time ∆t >> T(λ)/2, the inertial forces m d2ui/dt2 in Newtonian equations of motion do not play a significant role, the kinetic energy coming from the loading is low (see Figure 1b in [6]) and the loading is considered as relatively slow or quasi-static. In our case ∆tG = 7890 h and T(λ)/2 = 1048h with the velocity of the longitudinal waves CL<110> = 6266 m/s [31] by the used potential. The condition ∆t >> T(λ)/2 is obeyed and therefore our loading rate can be considered as relatively slow or quasi-static. This can be verified at temperature of ~0 K, where one can compare ∆Epot from MD with the strain energy Edef around an elliptical Griffith through crack loaded in mode I in the elastic region. If our gradual loading is stopped at a low level σA and kept at this level, then the ∆Epot-curve waves only slightly at the expected static level Edef = ½ σA2 V0/E − σA2 a2 π B (1−ν2)/E predicted by the Griffith-Goodier static solution in continuum (the first term is the strain energy in the perfect sample under loading σA, the second term is the missing elastic energy in the elliptical hole, E is Young modulus, ν is Poisson ratio). This illustrates that, although from the experimental point of view a loading applied to a finite specimen in MD (or in FEM) seems to be fast, it can be sufficiently slow for comparison with the static or quasistatic predictions concerning cracks, embedded in otherwise perfect samples.
If a crack tip process is activated under higher loads, there is a subsequent stress relaxation at the crack tip (see e.g., [12]) which recalls stress wave radiation (acoustic emission—AE) from this point source, generally into all three directions X, Y, Z. The emitted elastic stress waves travel to the sample borders and reflect back toward the crack tip region. These back wave reflections can influence the situation at the crack front, which is not considered in the static or quasi-static continuum predictions. For that reasons, our free 3D atomistic simulations are limited only to the initial stage of the defect development to avoid the backwave reflections, namely from the loaded borders in X and Y directions, as already mentioned above. Theoretically, some weak influence of the back waves reflections from the free (110) surfaces in the [110] Z direction is possible in our case. This is discussed below, together with the thermal effects caused by dislocation emission.
Figure 14 presents the maps of the local kinetic energies Ekin(li) of the individual atoms li after the dislocation emission at temperature of 300 K (Figure 14a) and temperature of 0 K (Figure 14b) in the referenced double layer 9 lying near the middle of the crystal in the [110] direction (near B/2). The double layer 9 corresponds to the coupled complete single (110) layers 17 and 18 along the crack front. The darker is the color, the higher is the kinetic energy in Figure 14. The kinetic energy at 300 K is scaled according to the local kinetic energy at the crack tip in Figure 2d during the emission. The red line denotes the crack. Note that Ekin (li) in Figure 14a is relevant for the atomic configuration shown in Figure 2b. Figure 14c shows a distribution Ekin(li) at 300 K in the unloaded, referenced configuration at time step 1000. Figure 14b for ~0 K is scaled by 10−21 J, (i.e., by one order of magnitude lower than for 300 K) in order to see the elastic longitudinal L and shear S (transversal) stress waves produced by dislocation emission. The L-waves are faster and they arrive to the loaded sample border at the time step 524 in our case. So that, the accepted restriction of about ~1050 h after the emission follows from the backwave reflections of these L-waves. However, Figure 14b shows that the strongest AE signal comes from the emitted S-waves. These S-waves are polarized [12,31] in the (110) planes, similar to the Burgers vector of the emitted blunting dislocations <111>{112}, i.e., they have zero displacement in the Z direction. For that reason, the influence of the wave reflections in Z direction on MD results is weak. This is documented in Figure 13a by a good agreement between the continuum prediction [5] and the 3D atomistic results at ~0 K. The discussion above is valid also for the inclined easy twins, because their Burgers vectors also lie in the (110) planes.
It is impossible to see the elastic stress waves in Figure 14b at elevated temperature because of the vibrating atoms with a large average kinetic energy per one atom (0.62 × 10⁻²⁰ J at 300 K—see the horizontal line in Figure 2d). At elevated temperature one can see just the dark moving “hot” dislocation cores, since the elastic stress waves generated by the dislocation emission transfer only a small energy (~10−21 J) in comparison with the kinetic energy of thermal atomic vibrations at 300 K. Hence, the influence of the wave processes on MD results at elevated temperature is probably less significant in comparison with temperature of ~0 K.
We are focused just to the initial stage of the defect development. Here, comparison of Figure 14a with 14c indicates that the first dislocation emission is affected by the temperature only transiently and locally at dislocation cores, and not at further distances from the crack. The ambient temperature remains unchanged. This supports the plausibility of the MD results presented.
Note that the higher local kinetic energy at the dislocation cores in Figure 14a and at the crack tip in Figure 2d is a natural phenomenon accompanying the dislocation emission and this should not be affected by a thermostat, reviewed e.g., in [32]. (During this process, the strain energy at the crack tip is converted to formation of the dislocation and to the kinetic energy of the emitted dislocation, moving away from the crack front.)
The abovementioned problems with the wave reflections are suppressed or eliminated using the translational (e.g., in [5]) or periodic boundary conditions (e.g., in [28]). However, such MD simulations have also certain limitations. As discussed in the atomistic study [26], periodic boundary conditions adequately model the plane strain conditions along the crack front and along the edge dislocations, but generally they may restrict the dislocation emission from the crack, e.g., on the oblique slip systems. This was confirmed in the pioneering large 3D molecular dynamic simulations [33,34] from Los Alamos focused to copper. We verified these restrictions in 3D bcc iron cracked crystals with the basic cubic orientation and some results are briefly published in [35]. The last paper demonstrates that introducing periodic boundary conditions can change the crack behavior from the ductile to the brittle one. It is a completely undesirable effect due to the experiments. Another example from this study is the dislocation emission in oblique {011}[110] slip systems presented in [6] and observed also in this study (see Table 1). These dislocations are generated at (110) free surface and they are not observed in the restricted plane strain (2D) simulations [5] since the Burgers vector has a non-zero component along the crack front (see Figure 7 in [6]), where the motion is not allowed in the 2D simulations. This is discussed more in detail in [6]. For the same reason, the oblique twins from this study (Figure 5) can be observed neither in the plane strain (2D) model nor in MD simulations with the periodic boundary conditions along the crack front. The models with periodic boundary conditions may fail also due to the self-interaction effects at the boundaries, as reported recently in [36].
To summarize, an advantage of our free 3D crack simulations is the unrestricted generation of plastic processes at the crack (dislocation emission, twinning, etc.) and a reliable description of the thermal expansion and thermal activation of dislocation emission. A disadvantage (in relation to continuum predictions) is the restriction only to the initial phase of the defect development to avoid the reflections of the stress waves emitted during the defect generation, which is not considered in continuum models. In relation to the fracture experiments, the restrictions in MD may not be so strict, because the free surfaces and those wave reflections really exist there.
This work confirms that the ductile vs. brittle crack behavior at elevated temperature can be successfully studied via MD, since the rate of dislocation nucleation (or twin generation, etc.) and cleavage at the crack tip is a time accessible process in MD simulations, as pointed out in [30] and illustrated in this study e.g., via the time dependencies of U10/b in Figure 4a or Figure 7.
4. Summary
The results obtained via 3D atomistic simulations by MD technique at elevated temperatures in bcc iron show that temperature can facilitate the emission of blunting <111>{112} dislocations from microcrack loaded bi-axially in tension mode I. The threshold values of the applied stress intensity KA needed for the emission decrease with the increasing temperatures and they also depend on the level of the T-stress given by the biaxiality ratio α = σB/σA. Under uniaxial tension, 300 K temperature rise means a drop in KA by about 25%. The emission of blunting dislocations supports the crack stability at an elevated temperature and it occurs in the region of α-values with the negative T-stress—see Table 1. Crack growth is monitored in the region with the positive T-stress.
T-stress can cause the ductile-brittle transition at the crack also at elevated temperatures. With the increasing temperature, the ductile-brittle transition (the arrows in Figure 12) is shifted toward higher values of α. At low temperature of ~0 K, the last emission of blunting dislocations in MD occurred at α = 0.5 (see [6]), while for ~300 K it is at α = 0.7 and for ~600 K it is at α = 0.8 in this study.
A simple procedure is proposed in this paper to evaluate the activation energy for dislocation emission from 3D atomistic results at an elevated temperature (Equation (3) and Table 2). The activation energy of ~30 kBT per atom proposed in [3] for the crack induced dislocation emission agrees well with the evaluation of our independent MD results at temperatures of 300 K and 600 K.
However, the relative decrease of G/G0 in energy release rate at the temperature of 300 K and 600 K with respect to 0 K in this MD study differs from the continuum prediction in [3] for bcc iron including only the K-factor. This is explained via an improved Beltz-Rice continuum model [5] including the T-stress, tension/shear coupling and also the effect of anisotropy. MD results for G/G0 from this study comply well with the theoretical predictions based on the referenced model [5] and activation energy of 30 kBT.
However, at higher biaxiality ratios α > 0.4, the G-energy needed for the emission in MD is lower in comparison with the theoretical predictions. This could be explained via larger normal separation of the slip planes at the elevated temperature in MD than the one considered in [5] via the tension/shear coupling. The ductile-brittle transition in MD at the elevated temperature is more “sharp” in comparison with the referenced continuum predictions.
This study at elevated temperatures also confirms that not all the plastic processes generated by the crack itself prevent the crack’s growth. While the dislocation emission on the inclined <111>{112} slip systems from crack causes a crack blunting and crack stability, the dislocation emission on the oblique <111>{011} slip systems leads to the crack deflections. Inclined twinning above and below the crack faces facilitates the crack initiation below the Griffith level in the region of the positive T-stress. New finding from this MD study is that the subcritical crack growth is thermally activated via the easy inclined twinning at the crack front. Activation energy at the crack induced twinning is lower in comparison with the one for dislocation emission (it is of ~19 kBT).
Beside the defects generated by the crack itself, a free generation of vacancies and interstitials was observed in the bulk crystal via MD simulations at the elevated temperature of 300 K and 600 K, unlike the MD results for 0 K in [6]. A new slip process was observed in MD at the elevated temperature and higher biaxiality ratio: the oblique twins were generated at the intersections of the inclined twins above and below crack faces.
The crack growth rate in MD at the elevated temperature is slower than the crack growth rate at ~0 K. This can be explained by the oblique twinning activated only at the elevated temperature. The microscopic processes observed via MD agree well with the experimental observations in bcc iron-based materials.
5. Conclusions
A simple procedure is proposed in this paper to evaluate the thermal activation energy for the observed crack tip process. 3D thermal MD simulations confirm that the activation energy for dislocation emission from microcrack under biaxial loading in mode I corresponds well to Rice-Beltz prediction of about ~30 kBT for metals. The level and the sign of the T-stress in MD are controlled by the external biaxial loading σA and σB. New findings from this study are as follows. In the negative T-stress region, thermal activation increases the crack stability via the emission of blunting dislocations on <111>{112} slip systems oriented in the hard anti-twinning direction and the ductile-brittle transition at higher temperature is shifted to higher biaxiality ratio σB/σA. In the positive T-stress region, the elevated temperature facilitates the microcrack growth below Griffith level. This is because the thermal activation contributes to twin formation in the inclined <111>{112} slip systems oriented in the easy twinning direction, and consequently to the subcritical plastic crack growth, facilitated by the thermally activated easy twins. It can be one of the mechanisms of the microcrack growth at the elevated temperature also for other crack orientations in bcc iron. No continuum prediction on thermal activation of the crack induced twinning has been published so far. According to this MD study, thermal activation energy of the easy twinning at the crack front is smaller than the one needed for dislocation emission, roughly of about ~19 kBT. Unlike the simulations at ~0 K, thermally activated formation of vacancies, interstitials and oblique twins was newly observed in these MD simulations in bcc iron at elevated temperature. Generally, the subcritical crack growth in mode I caused by the inclined twins can occur also in other materials, where twinning is a common deformation process.
Author Contributions
Conceptualization, A.U. and A.M.; methodology, A.M., A.U. and P.H.; software, A.M. and P.H.; data curation A.M. and P.H.; visualization, A.U., A.M. and P.H.; writing-original draft preparation A.M.; writing-review and editing A.U. and P.H. All authors have read and agreed to the published version of the manuscript.
Funding
The work was supported by the Institute Research Program RVO: 61388998 and by the project of the Czech Science Foundation under grant GACR 17−12925S. The work of P. Hora was supported by the European Regional Development Fund under Grant No.CZ.02.1.01/0.0/0.0/15_003/0000493 (Centre of Excellence for Nonlinear Dynamic Behavior of Advanced Materials in Engineering). In 2020 the work is partially supported by the project of the Technology Agency of the Czech Republic under grant TK01030108.
Acknowledgments
The authors thank their colleagues Andrej Spielmann for a careful proof-reading of the manuscript, Jan Červ for discussions and Dušan Gabriel for technical assistance with finalization of the publication.
Conflicts of Interest
The authors declare no conflict of interest.
References
- Schock, G. Thermodynamics and thermal activation of dislocations. In Dislocations in Solids: Moving Dislocations; Nabarro, F.R.N., Ed.; North-Holland Publishing Co.: Amsterdam, The Netherlands, 1980; Volume 3, ISBN 0444852697. [Google Scholar]
- Rice, J.R. Dislocation nucleation from a crack tip: An analysis based on the Peierls concept. J. Mech. Phys. Solids 1992, 40, 239–271. [Google Scholar] [CrossRef]
- Rice, J.R.; Beltz, G.E. The activation energy for dislocation nucleation at a crack. J. Mech. Phys. Solids 1994, 42, 333–360. [Google Scholar] [CrossRef] [Green Version]
- Beltz, G.E.; Fischer, L.L. Effect of T-stress on edge dislocation formation at a crack tip under mode I loading. In Multiscale Deformation and Fracture in Materials and Structures; Chuang, T.J., Rudnicki, J.W., Eds.; Kluwer Academic Publishers: Boston, MA, USA, 2001; pp. 237–242. ISBN 0-7923-6718-9. [Google Scholar] [CrossRef]
- Beltz, G.E.; Machová, A. Reconciliation of continuum and atomistic models for the ductile versus brittle response of iron. Modelling Simul. Mater. Sci. Eng. 2007, 15, 65–83. [Google Scholar] [CrossRef]
- Uhnáková, A.; Machová, A.; Hora, P. Dislocation emission and crack growth in 3D bcc iron crystals under biaxial loading by atomistic simulations. J. Appl. Phys. 2019, 126, 075115. [Google Scholar] [CrossRef]
- Ackland, G.J.; Bacon, D.J.; Calder, A.F.; Harry, T. Computer simulation of point defect properties in dilute Fe-Cu alloy using a many-body interatomic potential. Phil. Mag. A 1997, 75, 713–732. [Google Scholar] [CrossRef]
- Ševčík, M.; Zídek, J.; Nejezchlebová, J.; Štefan, J.; Machová, A.; Seiner, H.; Uhnáková, A.; Čapek, J.; Lejček, P. Crack growth in Fe-Si (2 wt%) single crystals on macroscopic and atomistic level. Results Phys. 2019, 14, 102450. [Google Scholar] [CrossRef]
- Machová, A. Residual stress in Fe-Cu alloys at 0 and 600 K. Comput. Mater. Sci. 2002, 24, 535–543. [Google Scholar] [CrossRef]
- Sih, G.C. (Ed.) Elastodynamic Crack Problems; Springer: Leyden, IL, USA, 1977; ISBN 978-90-286-0156-7. [Google Scholar]
- Murakami, Y. Stress Intensity Factors Handbook; Pergamon Press: Oxford, UK, 1987; Volume 1, p. 68. ISBN 0-0803-4809-2. [Google Scholar]
- Spielmannová, A.; Machová, A.; Hora, P. Crack induced stress, dislocations and acoustic emission by 3-D atomistic simulations in bcc iron. Acta Mater. 2009, 57, 4065–4073. [Google Scholar] [CrossRef]
- da Silva, K.D.; Beltz, G.E.; Machová, A. Tension–shear coupling in slip and decohesion of iron crystals. Scr. Mater. 2003, 49, 1163–1167. [Google Scholar] [CrossRef]
- Machová, A.; Beltz, G.E.; Chang, M. Atomistic simulation of stacking fault formation in bcc iron. Model. Simul. Mater. Sci. Eng. 1999, 7, 949–974. [Google Scholar] [CrossRef]
- Kumosa, M. Crack and slip phenomena at the tip of a terminated twin. Mater. Sci. Eng. 1986, 77, 37–44. [Google Scholar] [CrossRef]
- Machová, A.; Beltz, G.E. Ductile-brittle behavior of (001)[110] nano-cracks in bcc iron. Mater. Sci. Eng. A 2004, 387, 414–418. [Google Scholar] [CrossRef]
- Paidar, V. Multilayer stacking faults in bcc metals. Phil. Mag. A 1983, 48, 231–238. [Google Scholar] [CrossRef]
- Odette, G.R. On the dominant mechanism of irradiation embrittlement of reactor pressure vessel steels. Scr. Metall. 1983, 17, 1183–1188. [Google Scholar] [CrossRef]
- Davies, L.M. A comparison of Western and Eastern nuclear reactorpressure vessel steels. Int. J. Press. Vessel. Pip. 1999, 76, 163–208. [Google Scholar] [CrossRef]
- Bošanský, J.; Šmida, T. Deformation twins-probable inherent nuclei of cleavage fracture in ferritic steels. Mater. Sci. Eng. A 2002, 323, 198–205. [Google Scholar] [CrossRef]
- Gao, F.; Yu, F.-X.; Misra, R.D.K.; Liu, H.-T.; Liu, Z.-Y. Correlation between ductile to brittle transition behaviour and twinning in ferritic steels. Mater. Sci. Technol 2015, 31, 1462–1472. [Google Scholar] [CrossRef]
- Spielmannová, A.; Machová, A. Crack induced stress and generation of twins and dislocations in BCC iron. In Proceedings of the 17th European Conference on Fracture 2008: Multilevel Approach to Fracture of Materials, Components and Structures; Pokluda, J., Lukáš, P., Šandera, P., Dlouhý, I., Eds.; VUTIUM: Brno, Czech Republic, 2008; Volume 1. [Google Scholar]
- Melin, S. The influence of the T-stress on the directional stability of cracks. Int. J. Fract. 2002, 114, 259–265. [Google Scholar] [CrossRef]
- Sherry, A.H.; France, C.C.; Goldthorpe, M.R. Compendium of T-Stress solutions for two and three dimensional cracked geometries. Fatique Fract. Engn. Mater. Sruct. 1993, 18, 141. [Google Scholar] [CrossRef]
- Spielmannová, A.; Landa, M.; Machová, A.; Haušild, P.; Lejček, P. Influence of crack orientation on the ductile-brittle behavior in Fe-3 wt.% Si single crystals. Mater. Charact. 2007, 58, 892–900. [Google Scholar] [CrossRef]
- Shastry, V.; Farkas, D. Molecular statics simulation of fracture in α-iron. Model. Simul. Mater. Sci. Eng. 1996, 4, 473–492. [Google Scholar] [CrossRef]
- Singh, R.; Mahajan, D.K. Role of stress triaxiality on ductile versus brittle fracture in pre-cracked FCC single crystals: An atomistic study. Model. Simul. Mater. Sci. Eng. 2019, 27, 055007. [Google Scholar] [CrossRef]
- Borodin, V.A.; Vladimirov, P.V.; Möslang, A. The effects of temperature on crack propagation in bcc iron. J. Nucl. Mater. 2013, 442, S612–S617. [Google Scholar] [CrossRef]
- Tanaka, M.; Tarleton, E.; Roberts, S.G. The brittle–ductile transition in single-crystal iron. Acta Mater. 2008, 56, 5123–5129. [Google Scholar] [CrossRef]
- Bitzek, E.; Kermode, J.R.; Gumbsch, P. Atomistic aspects of fracture. Int. Jour. Fract. 2015, 191, 13–30. [Google Scholar] [CrossRef]
- Hora, P.; Machová, A.; Červ, J.; Uhnáková, A. Kinetics of dislocation emission: From the crack toward the free surface. Met. Mater. 2019, 57, 1–19. [Google Scholar] [CrossRef] [Green Version]
- Meyer, M.; Pontikis, V. (Eds.) Computer Simulations in Materials Science; Kluwer Academic Publishers: Boston, MA, USA, 1991; p. 21. [Google Scholar] [CrossRef]
- Zhou, S.J.; Beazley, D.M.; Lomdahl, P.S.; Voter, A.F.; Holian, B.L. Dislocation emission from a three-dimensional crack—A large-scale molecular dynamics study. In Advances in Fracture Research; Karihaloo, B.L., Mai, Y.-W., Ripley, M.I., Ritchie, R.O., Eds.; Pergamon: New York, NY, USA, 1997; ISBN 978-0-08-042820-8. [Google Scholar] [CrossRef]
- Zhou, S.J.; Lomdahl, P.S.; Voter, A.F.; Holian, B.L. Three dimensional fracture via large-scale molecular dynamics. Eng. Fract. Mech. 1998, 61, 173–187. [Google Scholar] [CrossRef]
- Pelikán, V.; Hora, P.; Machová, A.; Kolman, R.; Uhnáková, A. Sample geometry and the brittle-ductile behavior of edge cracks in 3D atomistic simulations by molecular dynamics. Solid State Phenom. 2017, 258, 45–48. [Google Scholar] [CrossRef]
- Ladinek, M.; Hoffer, T. On the influence of loading order in nanostructural fatigue crack propagation in bcc iron—A Molecular Dynamics Study. Metals 2019, 9, 684. [Google Scholar] [CrossRef] [Green Version]
Figure 1.
(a) Scheme of the heated (yellow) atomistic sample from [6], B denotes the sample thickness; (b) global energy balance in MD during the heating (time step < 1000) and gradual loading (time step > 1000) with biaxiality ratio α = σB/σA = 0.0 at the temperature of 300 K; (c) at 600 K.
Figure 1.
(a) Scheme of the heated (yellow) atomistic sample from [6], B denotes the sample thickness; (b) global energy balance in MD during the heating (time step < 1000) and gradual loading (time step > 1000) with biaxiality ratio α = σB/σA = 0.0 at the temperature of 300 K; (c) at 600 K.


Figure 2.
Temperature of 300 K, uniaxial tension (biaxiality ratio α = 0.0): (a) oscillating character of the relative shear displacements U10/b in <111>{112} slip system at the crack tip; the short horizontal line indicates the threshold time te at the first emission; (b) 2D visualization of the first dislocation emission at time step 7000 (KA(t) = 0.688 MPa·m1/2, layer 19); (c) crack blunting after multiple emissions, time step 8000, layer 15; (d) local kinetic energy at the crack tip before and during the first dislocation emission; the last peak value shows the time te = 7068 h of the dislocation emission from Figure 2a.


Figure 3.
Temperature 300 K, biaxiality ratio α = 0.1; generation of vacancies and a 3D visualization of the emitted dislocations. Four dislocations are emitted. The red-green dislocation cores are visualized like in [6], the blue color represents the surface atoms, including the crack plane. The isolated clusters of green atoms indicate the vacancies.

Figure 4.
Temperature 300 K, biaxiality ratio α = 0.7, the last emission of <111>{112} dislocation: (a) the shear displacement U10/b during the emission (left crack tip, layer 15); (b) 2D visualization of the dislocation emission at time step 8000 (KA(t) = 0.803 MPa·m1/2) on a middle (110) plane (layer 15). On the right-hand side—generation of the dislocation, on the left-hand side—a complete dislocation with an edge character with U10/b = 1.

Figure 5.
Temperature 300 K, biaxiality ratio α = 0.9: (a) generation of the inclined i-twins and oblique o-twins in 3D, time step 9700, KA(t) = 0.998 MPa m1/2; (b) schematic orientation of {112} oblique twinning plane (yellow) with Burgers vector b (blue).
Figure 5.
Temperature 300 K, biaxiality ratio α = 0.9: (a) generation of the inclined i-twins and oblique o-twins in 3D, time step 9700, KA(t) = 0.998 MPa m1/2; (b) schematic orientation of {112} oblique twinning plane (yellow) with Burgers vector b (blue).

Figure 6.
Temperature 300 K, biaxiality ratio α = 1.0: (a) slip patterns from the inclined and oblique twins and the crack extension in our (110) observation plane in layer 15. The primary crack tip atoms are dark; (b) oblique twins in plane parallel to the crack plane; (time step 8000, KA(t) = 0.803 MPa·m1/2).


Figure 7.
Temperature 300 K, biaxiality ratio α = 1.2: (a) the shear displacements U10/b at the crack tip (layer 15). The short horizontal line to the right denotes the critical value 2/3 needed for easy inclined twinning; (b) change of the crack length ∆(ao) (in units of the lattice parameter ao) in layer 15. Crack initiation at time step 7223 precedes twinning.

Figure 8.
Temperature 600 K, uniaxial tension α = 0.0: 3D visualization of the four <111>{112} dislocations (red and green) and of the isolated (red) interstitials at time step 5500 (∆t = 4500 h, KA(t) = 0.518 MPa·m1/2).
Figure 8.
Temperature 600 K, uniaxial tension α = 0.0: 3D visualization of the four <111>{112} dislocations (red and green) and of the isolated (red) interstitials at time step 5500 (∆t = 4500 h, KA(t) = 0.518 MPa·m1/2).

Figure 9.
Temperature 600 K—comparison of MD results obtained with the stable time step h = 1 × 10⁻¹⁴ s and the smaller time step h2 = 1 × 10⁻¹⁵ s for α = 0.0: (a) the shear displacements U10/b in the slip systems <111>{112} in dependence on σA(t) = SA, using time step h; (b) 2D visualization of the emitted dislocations in middle layer 14 of the crystal at time step h = 5200 (∆t = 4200 h, KA(t) = 0.484 MPa·m1/2); (c) development of shear displacements U10/b with increasing σA(t), using the smaller time step h2; (d) 2D visualization of the emitted dislocations under equivalent loading at time step h2 = 52,000 (∆t = 42,000 h2, KA(t) = 0.484 MPa·m1/2).


Figure 10.
Temperature 600 K—the final <111>{112} dislocation emission at α = 0.8: (a) 2D visualization of two dislocations in (110) middle layer at time step 6000 (KA(t) = 0.573 MPa·m1/2); (b) the corresponding 3D visualization at the same time step 6000.
Figure 10.
Temperature 600 K—the final <111>{112} dislocation emission at α = 0.8: (a) 2D visualization of two dislocations in (110) middle layer at time step 6000 (KA(t) = 0.573 MPa·m1/2); (b) the corresponding 3D visualization at the same time step 6000.

Figure 11.
Temperature 600 K, α = 1.2: easy and oblique twinning above and below the crack faces, time step 5500 (∆t = 4500 h, KA(t) = 0.517 MPa·m1/2). The primary crack tip atoms are denoted by black.
Figure 11.
Temperature 600 K, α = 1.2: easy and oblique twinning above and below the crack faces, time step 5500 (∆t = 4500 h, KA(t) = 0.517 MPa·m1/2). The primary crack tip atoms are denoted by black.

Figure 12.
Comparison of the threshold values of the applied stress intensity KA at temperatures of 0 K, 300 K and 600 K. The arrows denote the ductile-brittle transition. The data for 0 K are taken from [6].
Figure 12.
Comparison of the threshold values of the applied stress intensity KA at temperatures of 0 K, 300 K and 600 K. The arrows denote the ductile-brittle transition. The data for 0 K are taken from [6].

Figure 13.
Comparison of the predicted G-values shown by the lines (─) with MD results denoted via circles (o) in dependence on biaxiality ratio α = σB/σA: (a) at temperature of ~0 K (G0); (b) at temperature of ~300 K (G300); (c) at temperature of ~ 600 K; the line is the prediction from [5] with γus = 1.14 J/m2 for the used potential.


Figure 14.
Map of the local kinetic energies Ekin(li) of the individual atoms li in (110) double layer near B/2: (a) temperature of ~300 K, α = 0.0, time step 7070; (b) temperature of ~0 K, α = 0.0, time step 8000; (c) temperature of ~300 K, time step 1000, free heating without any loading. The red line denotes the crack. The scale bar is on the right side: for (a) and (c) in units of (10-20 J); for (b) in units of (10-21 J).


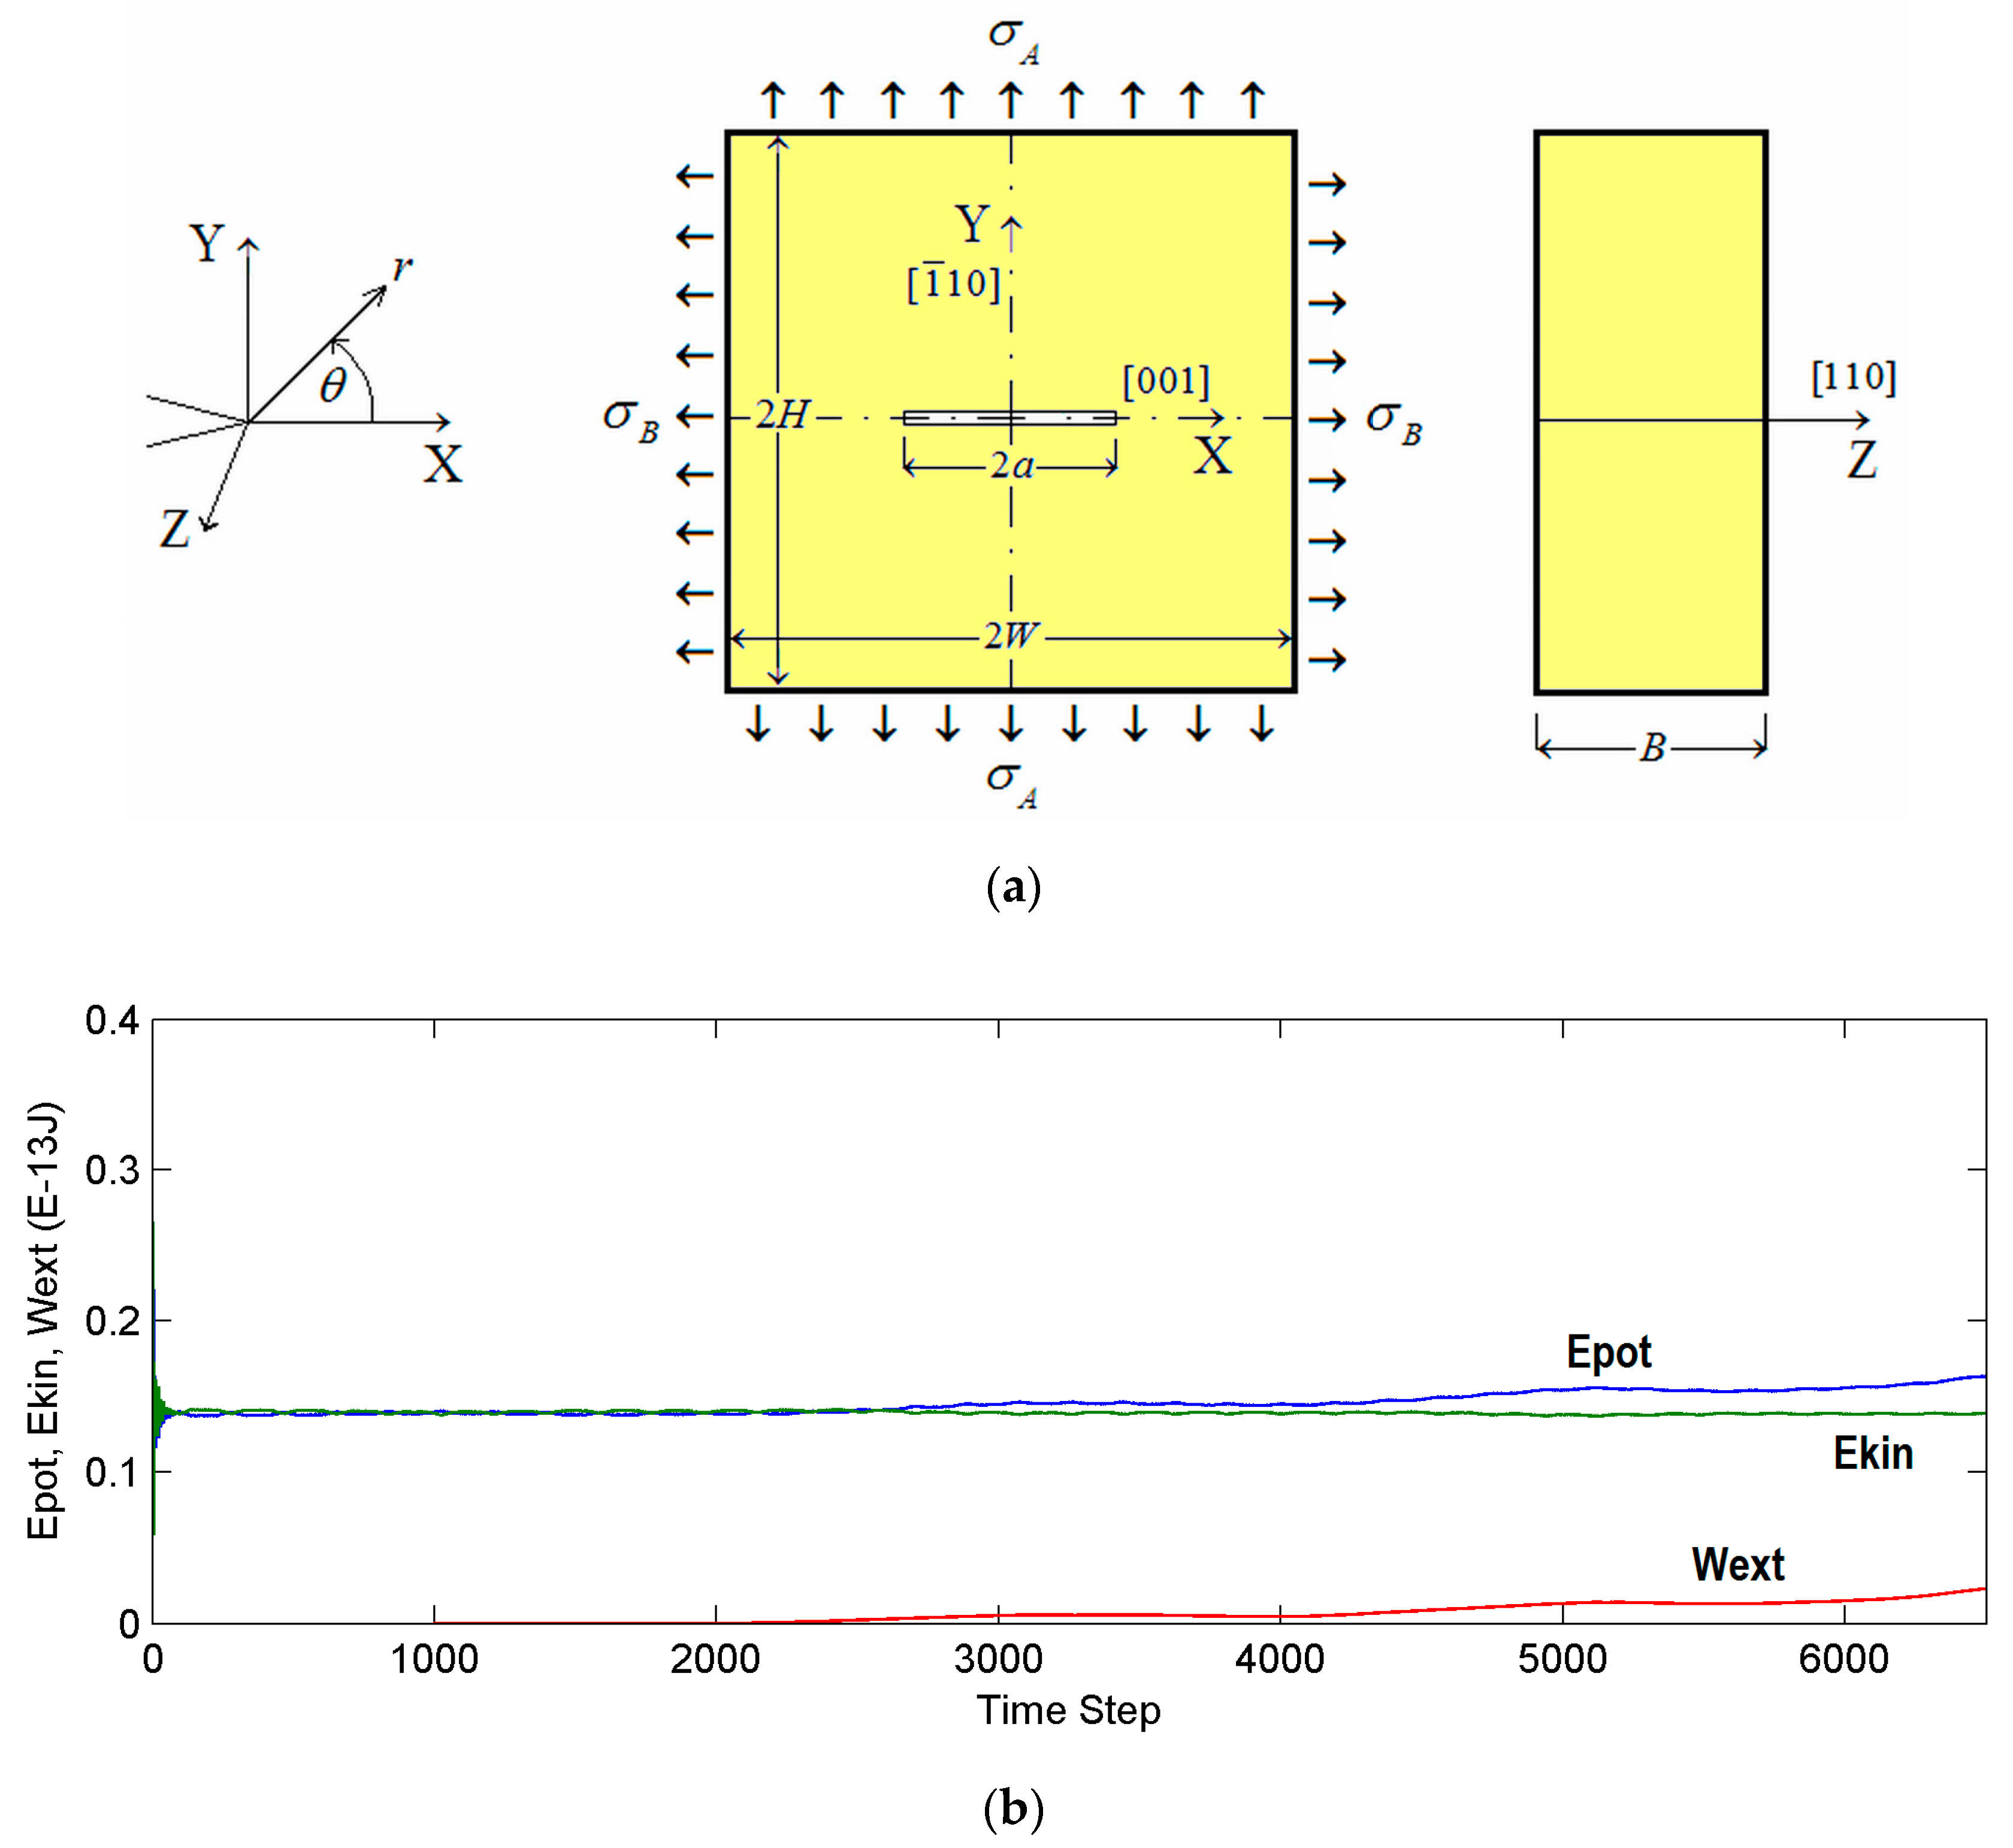
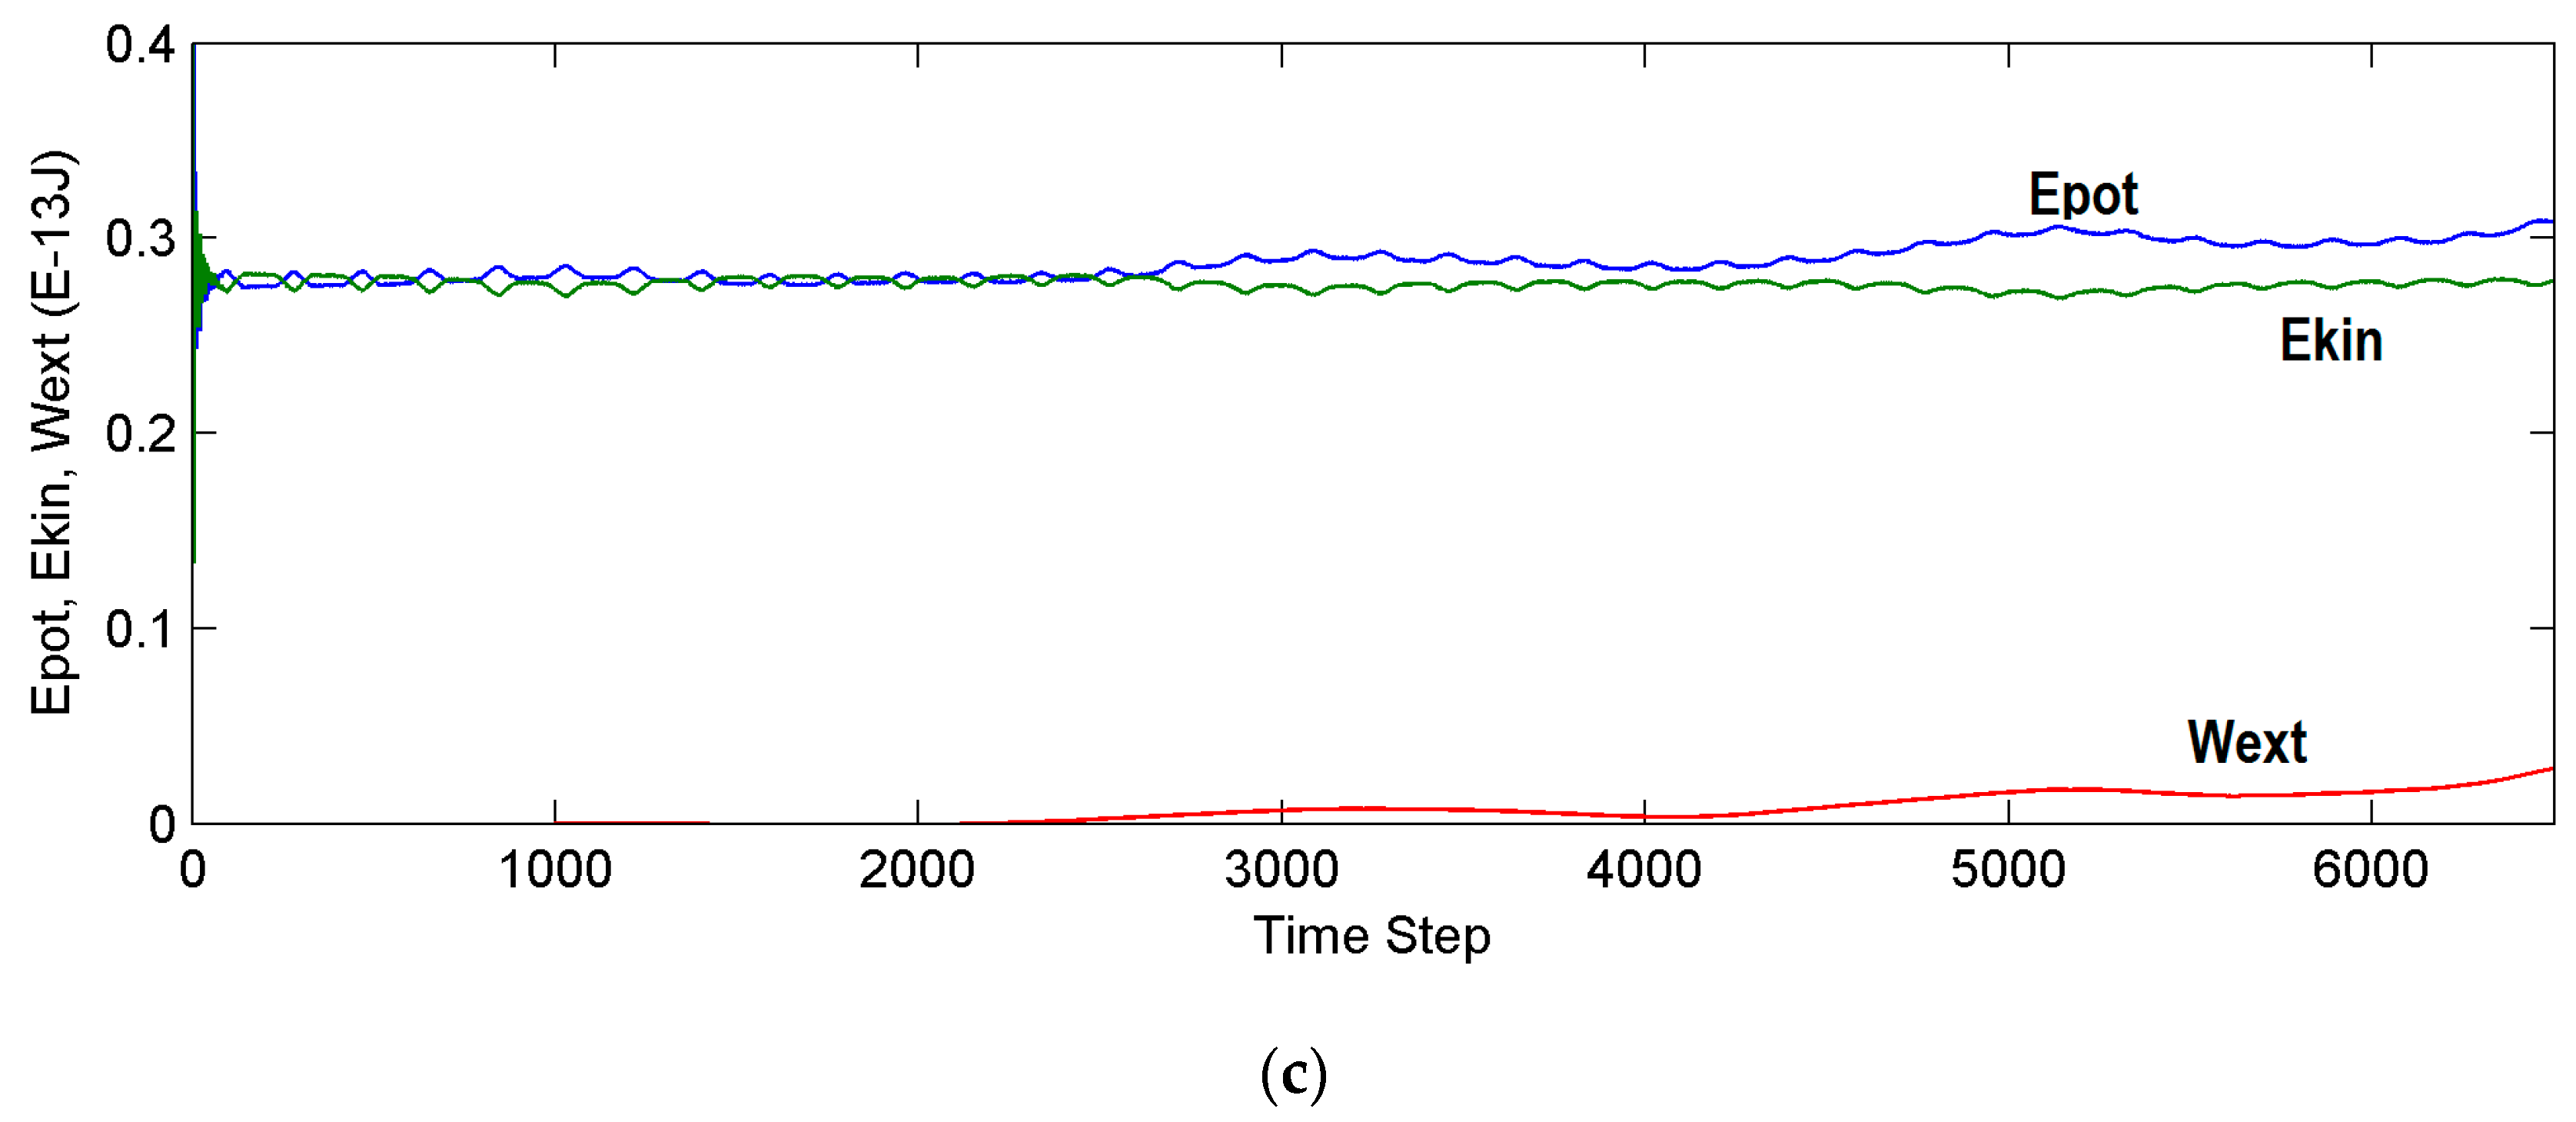
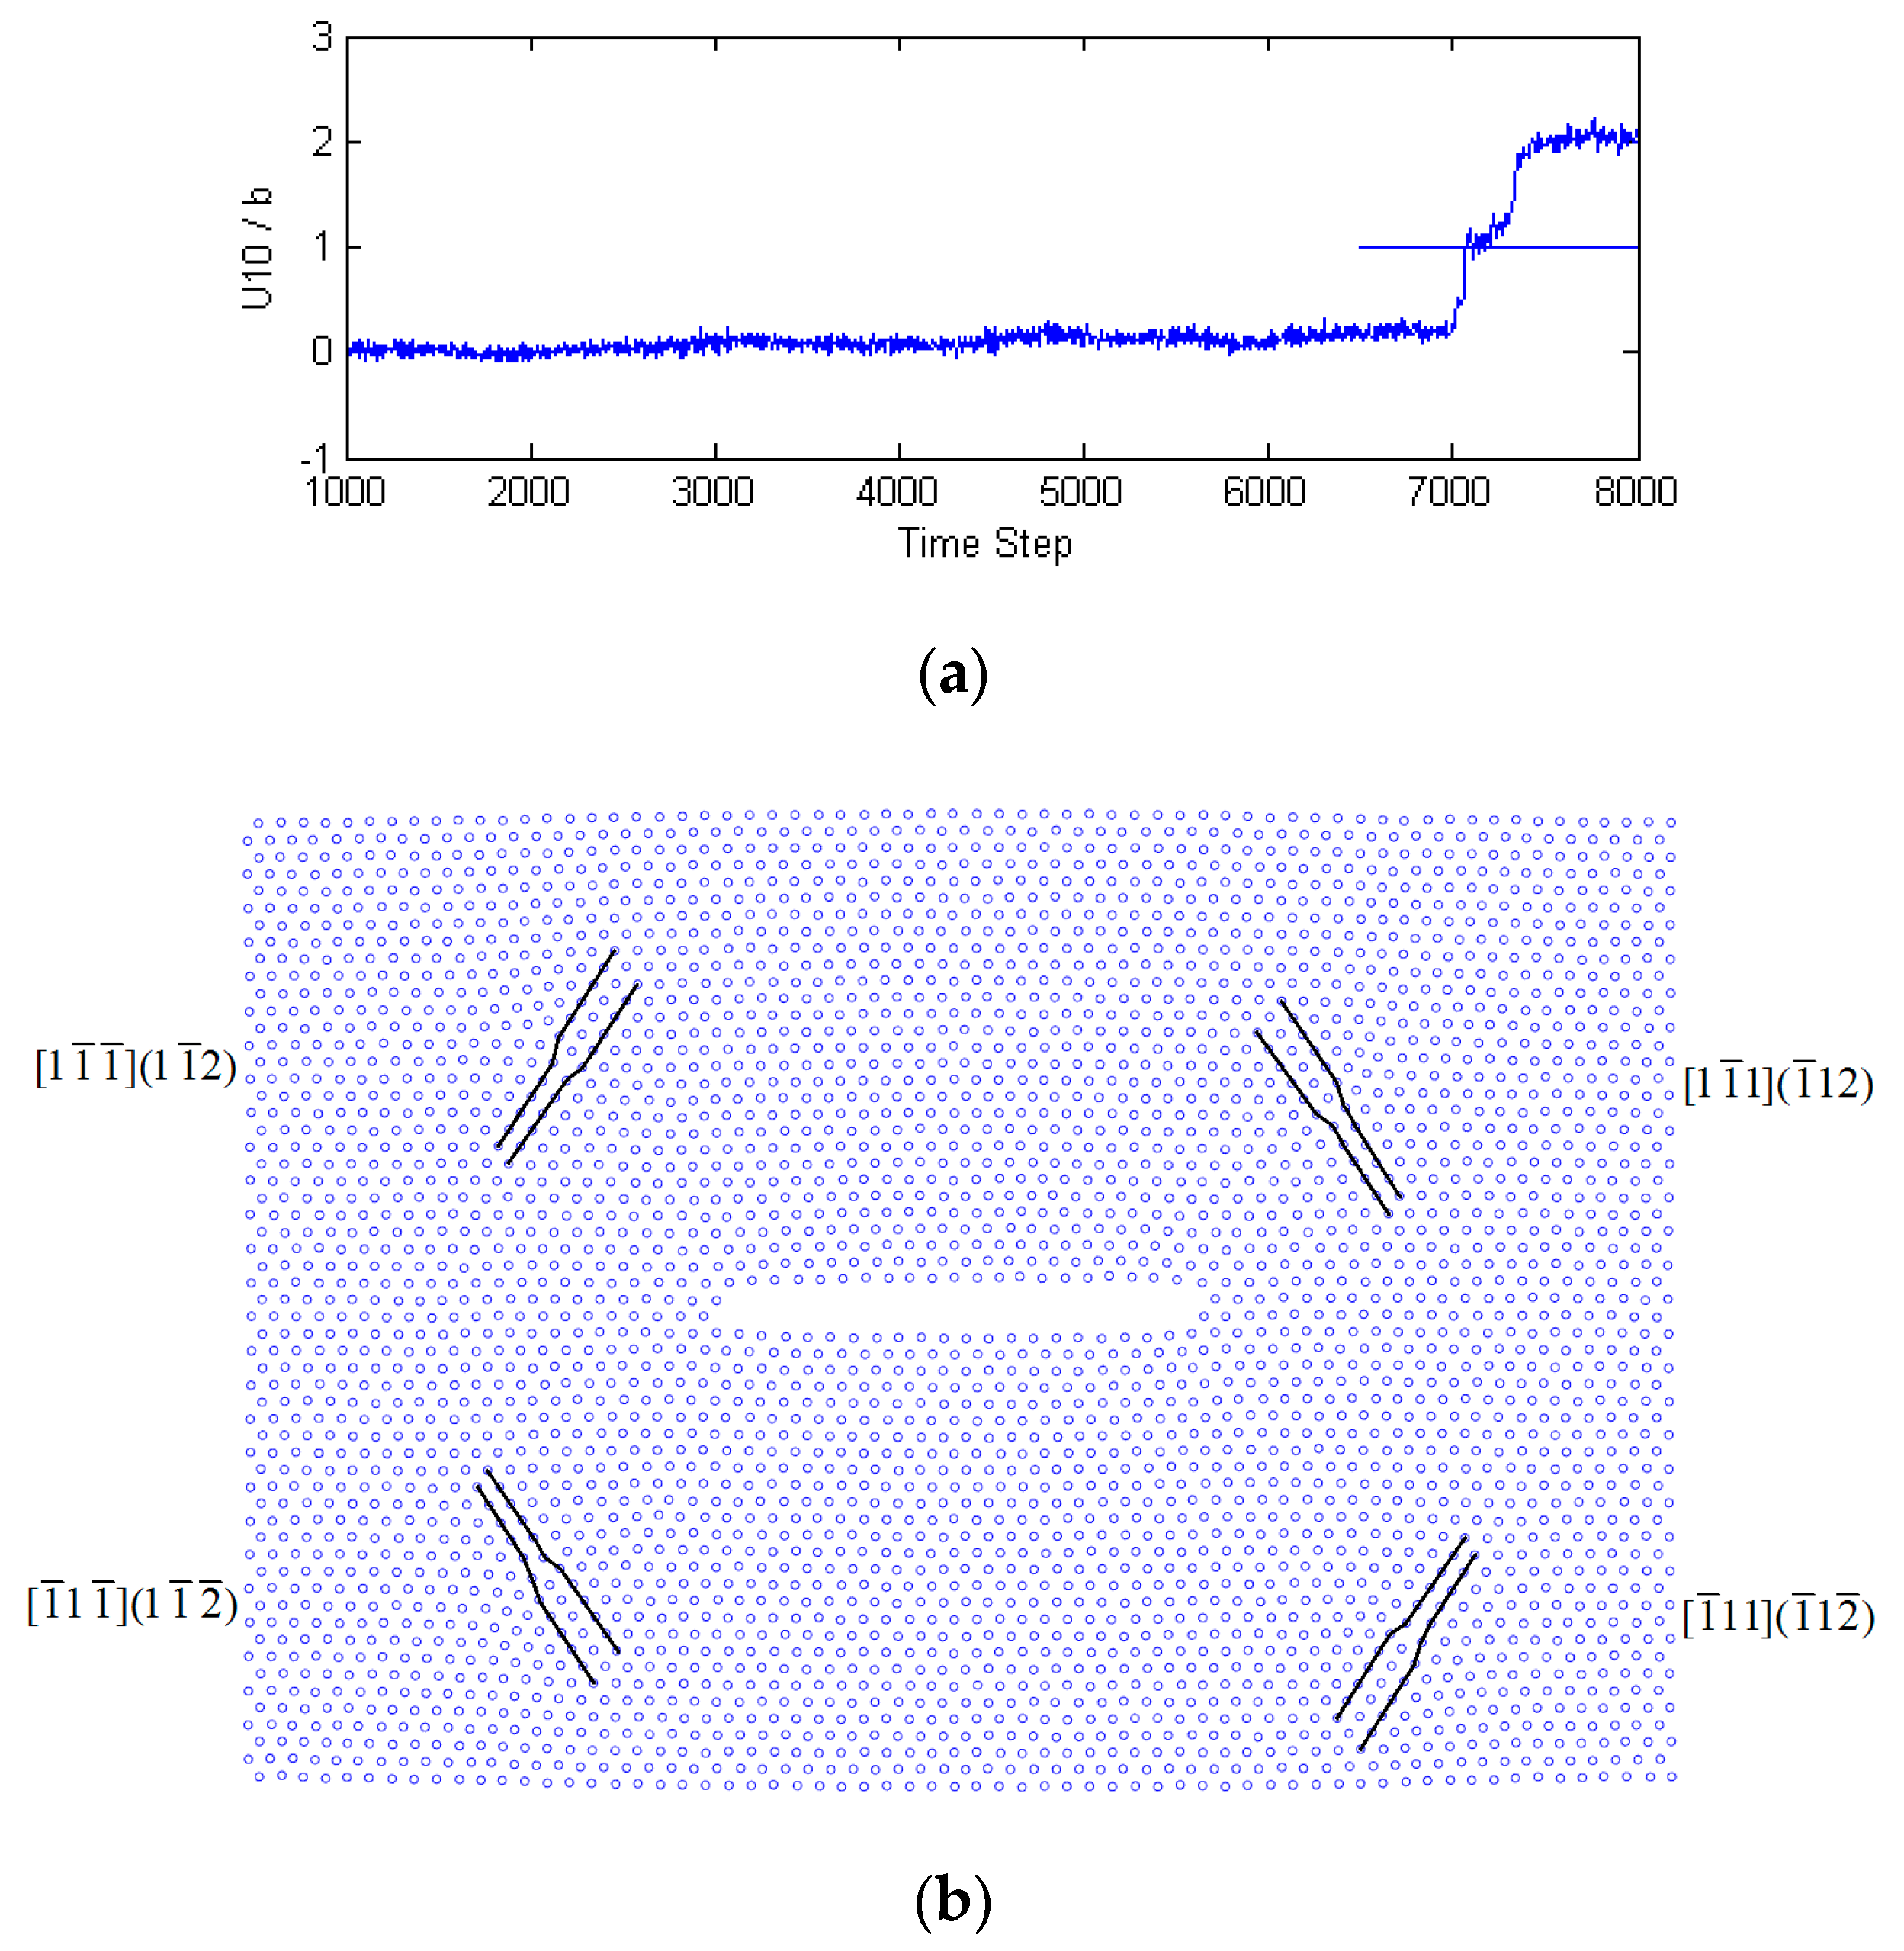
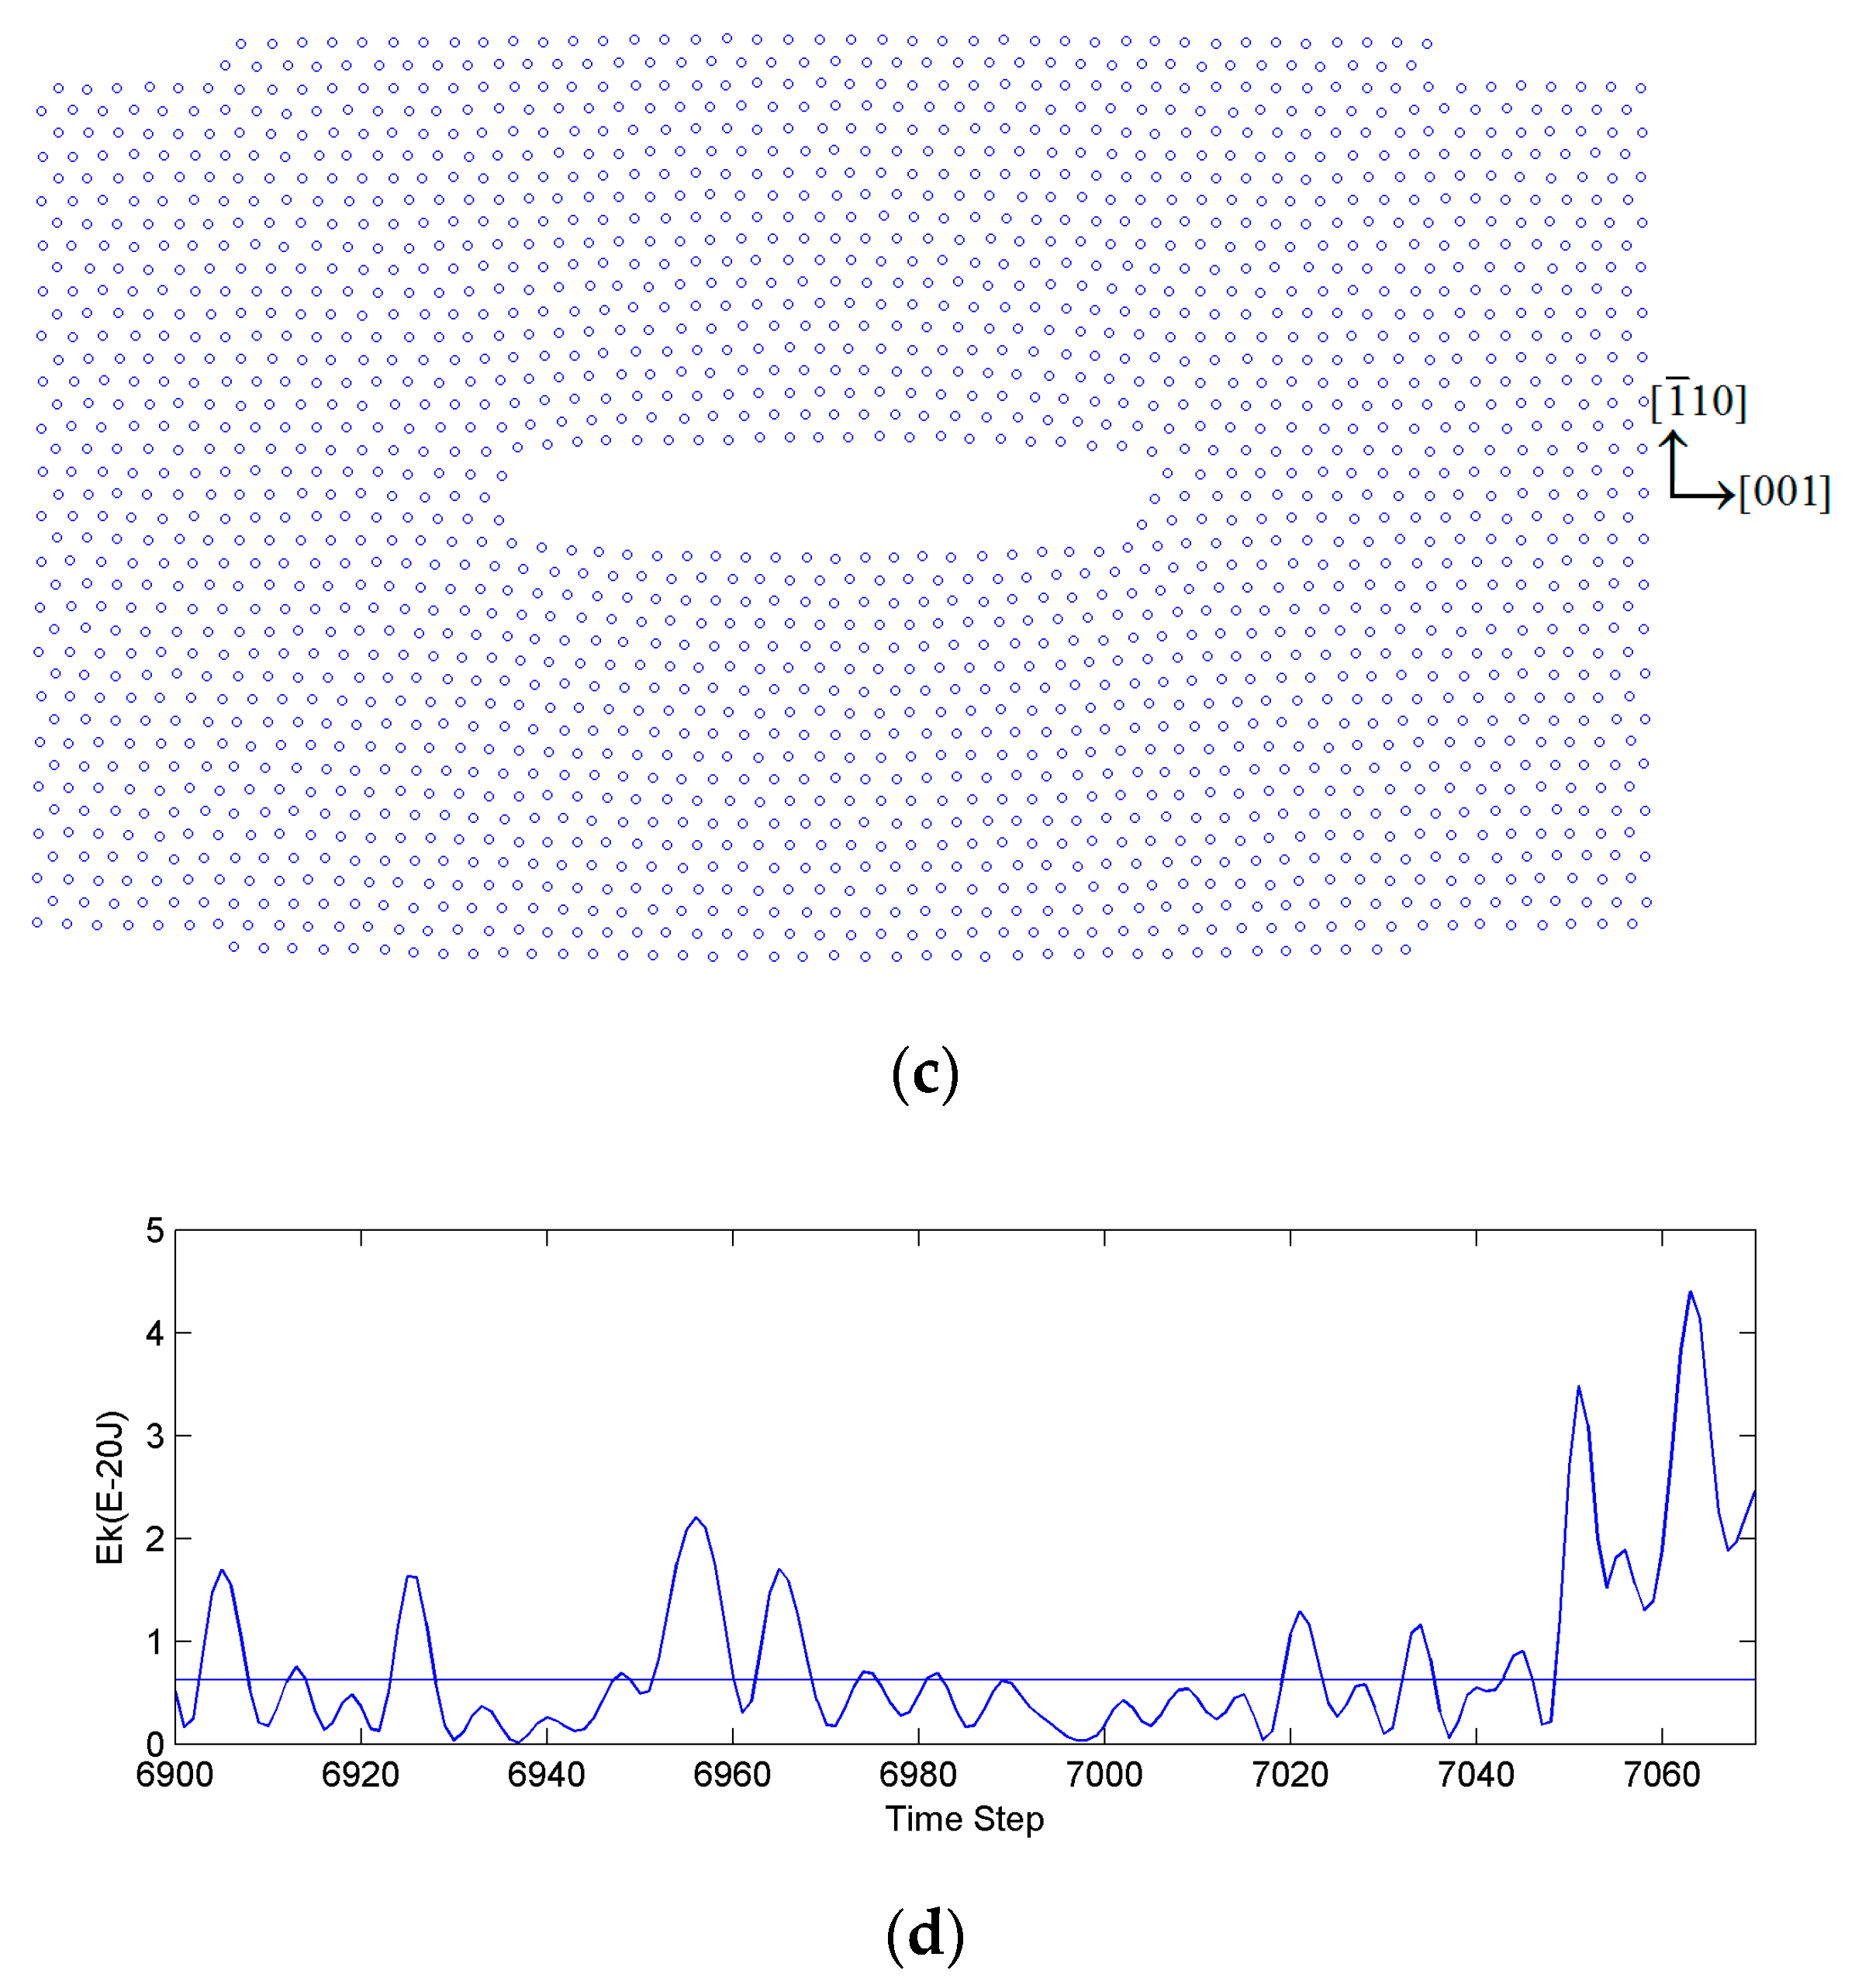
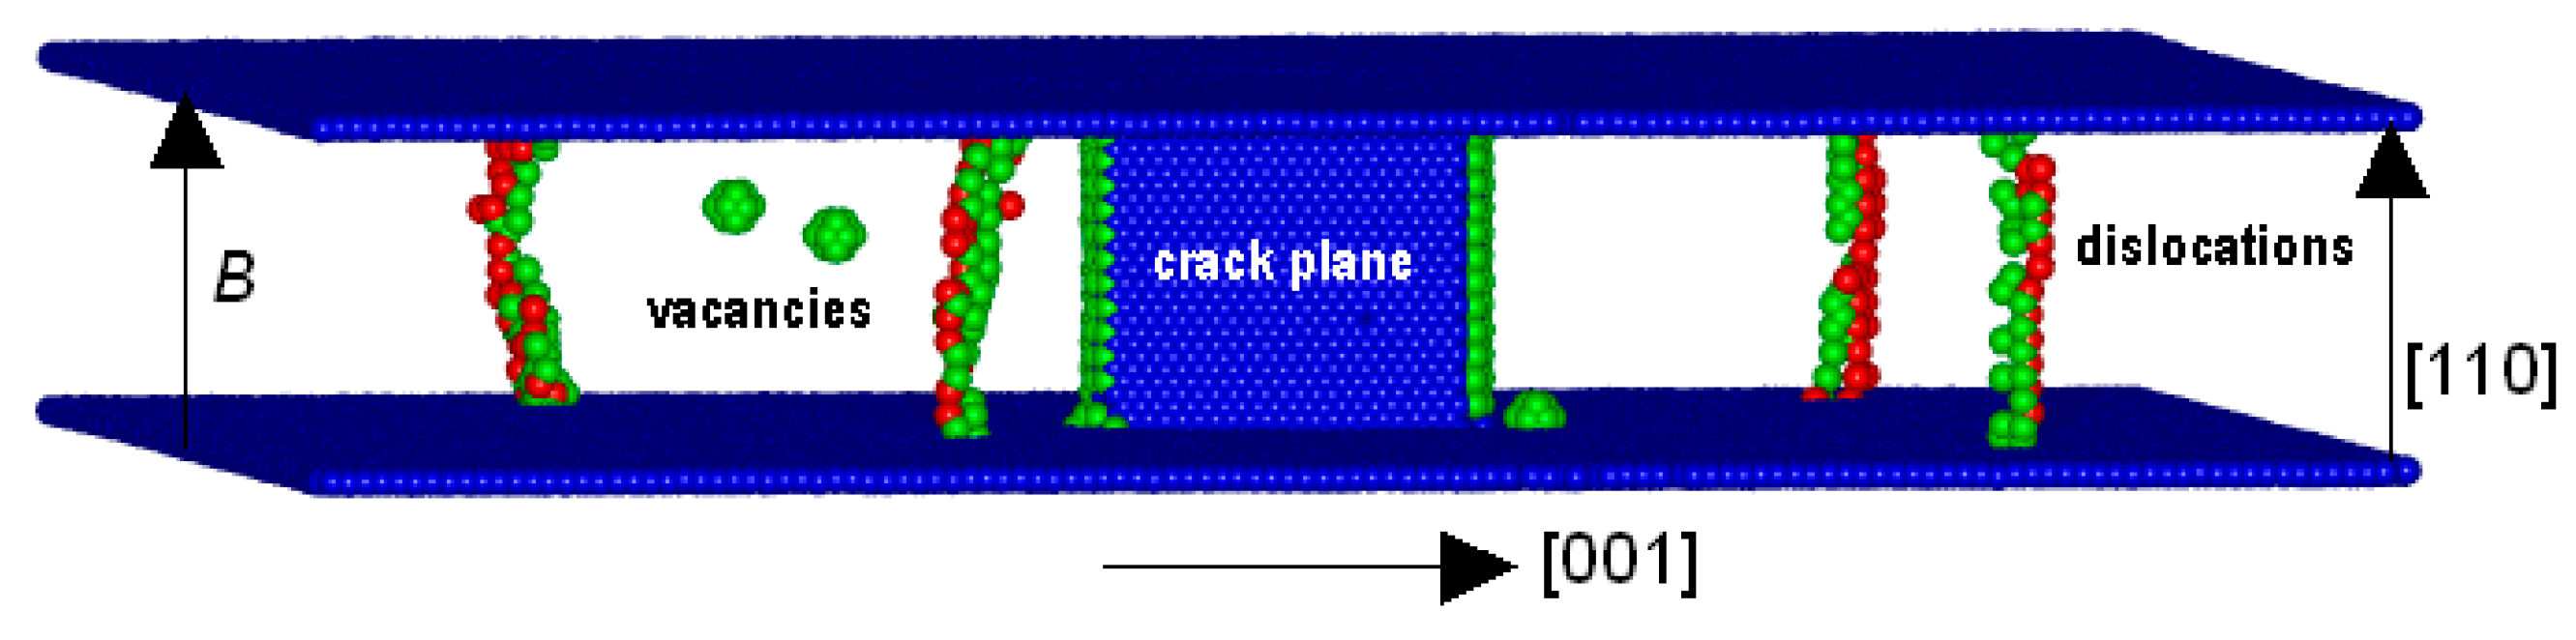
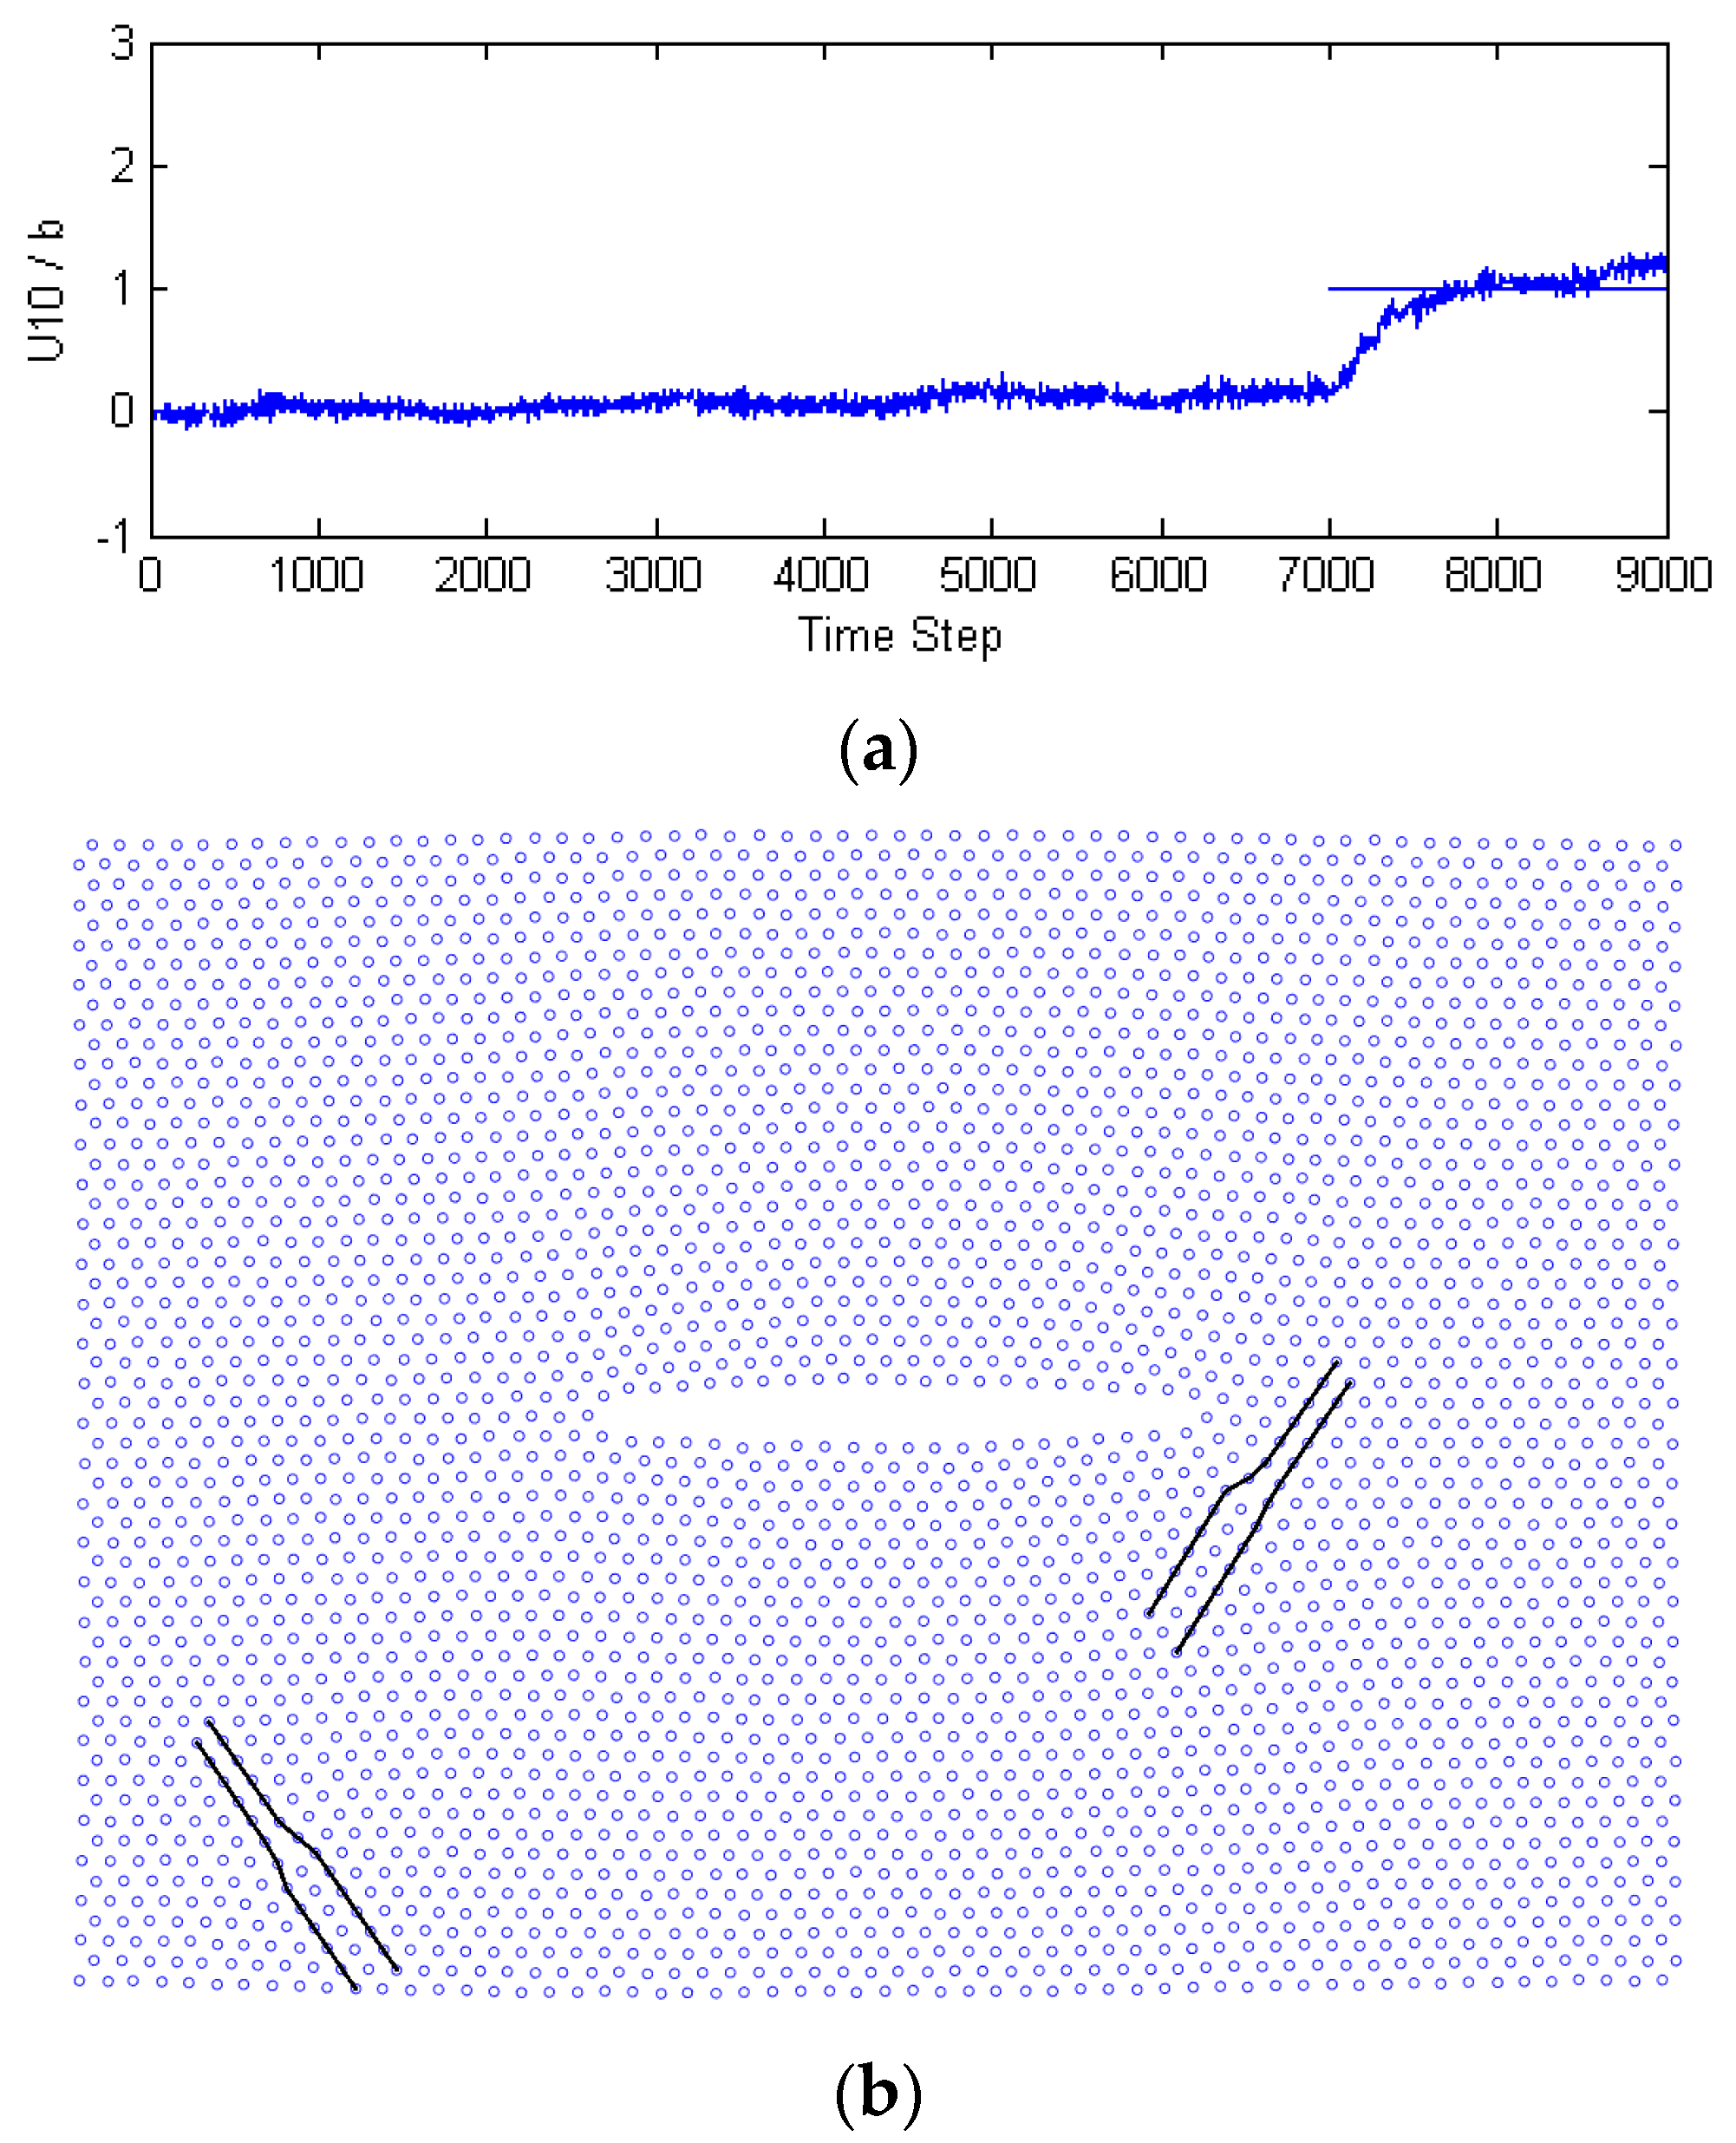
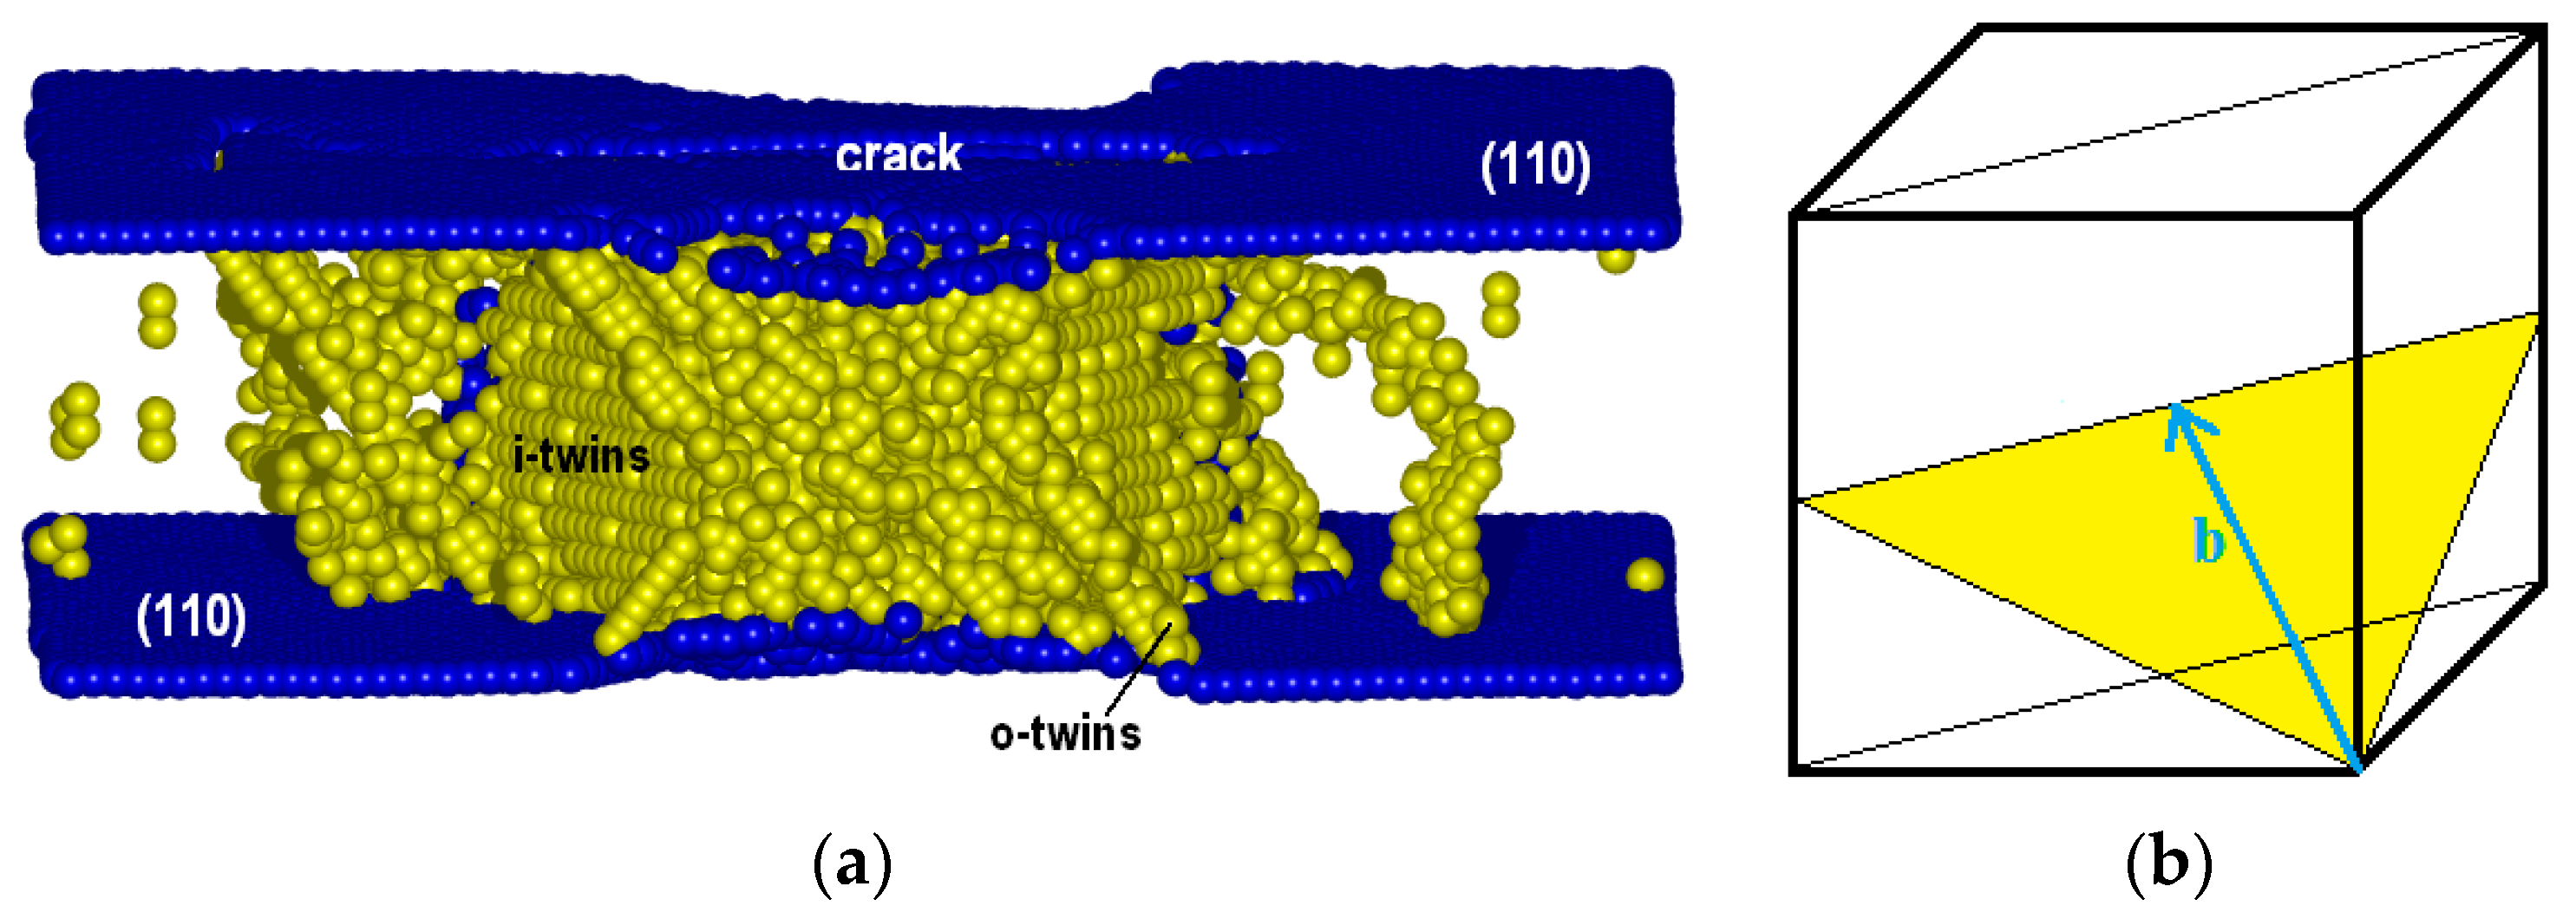
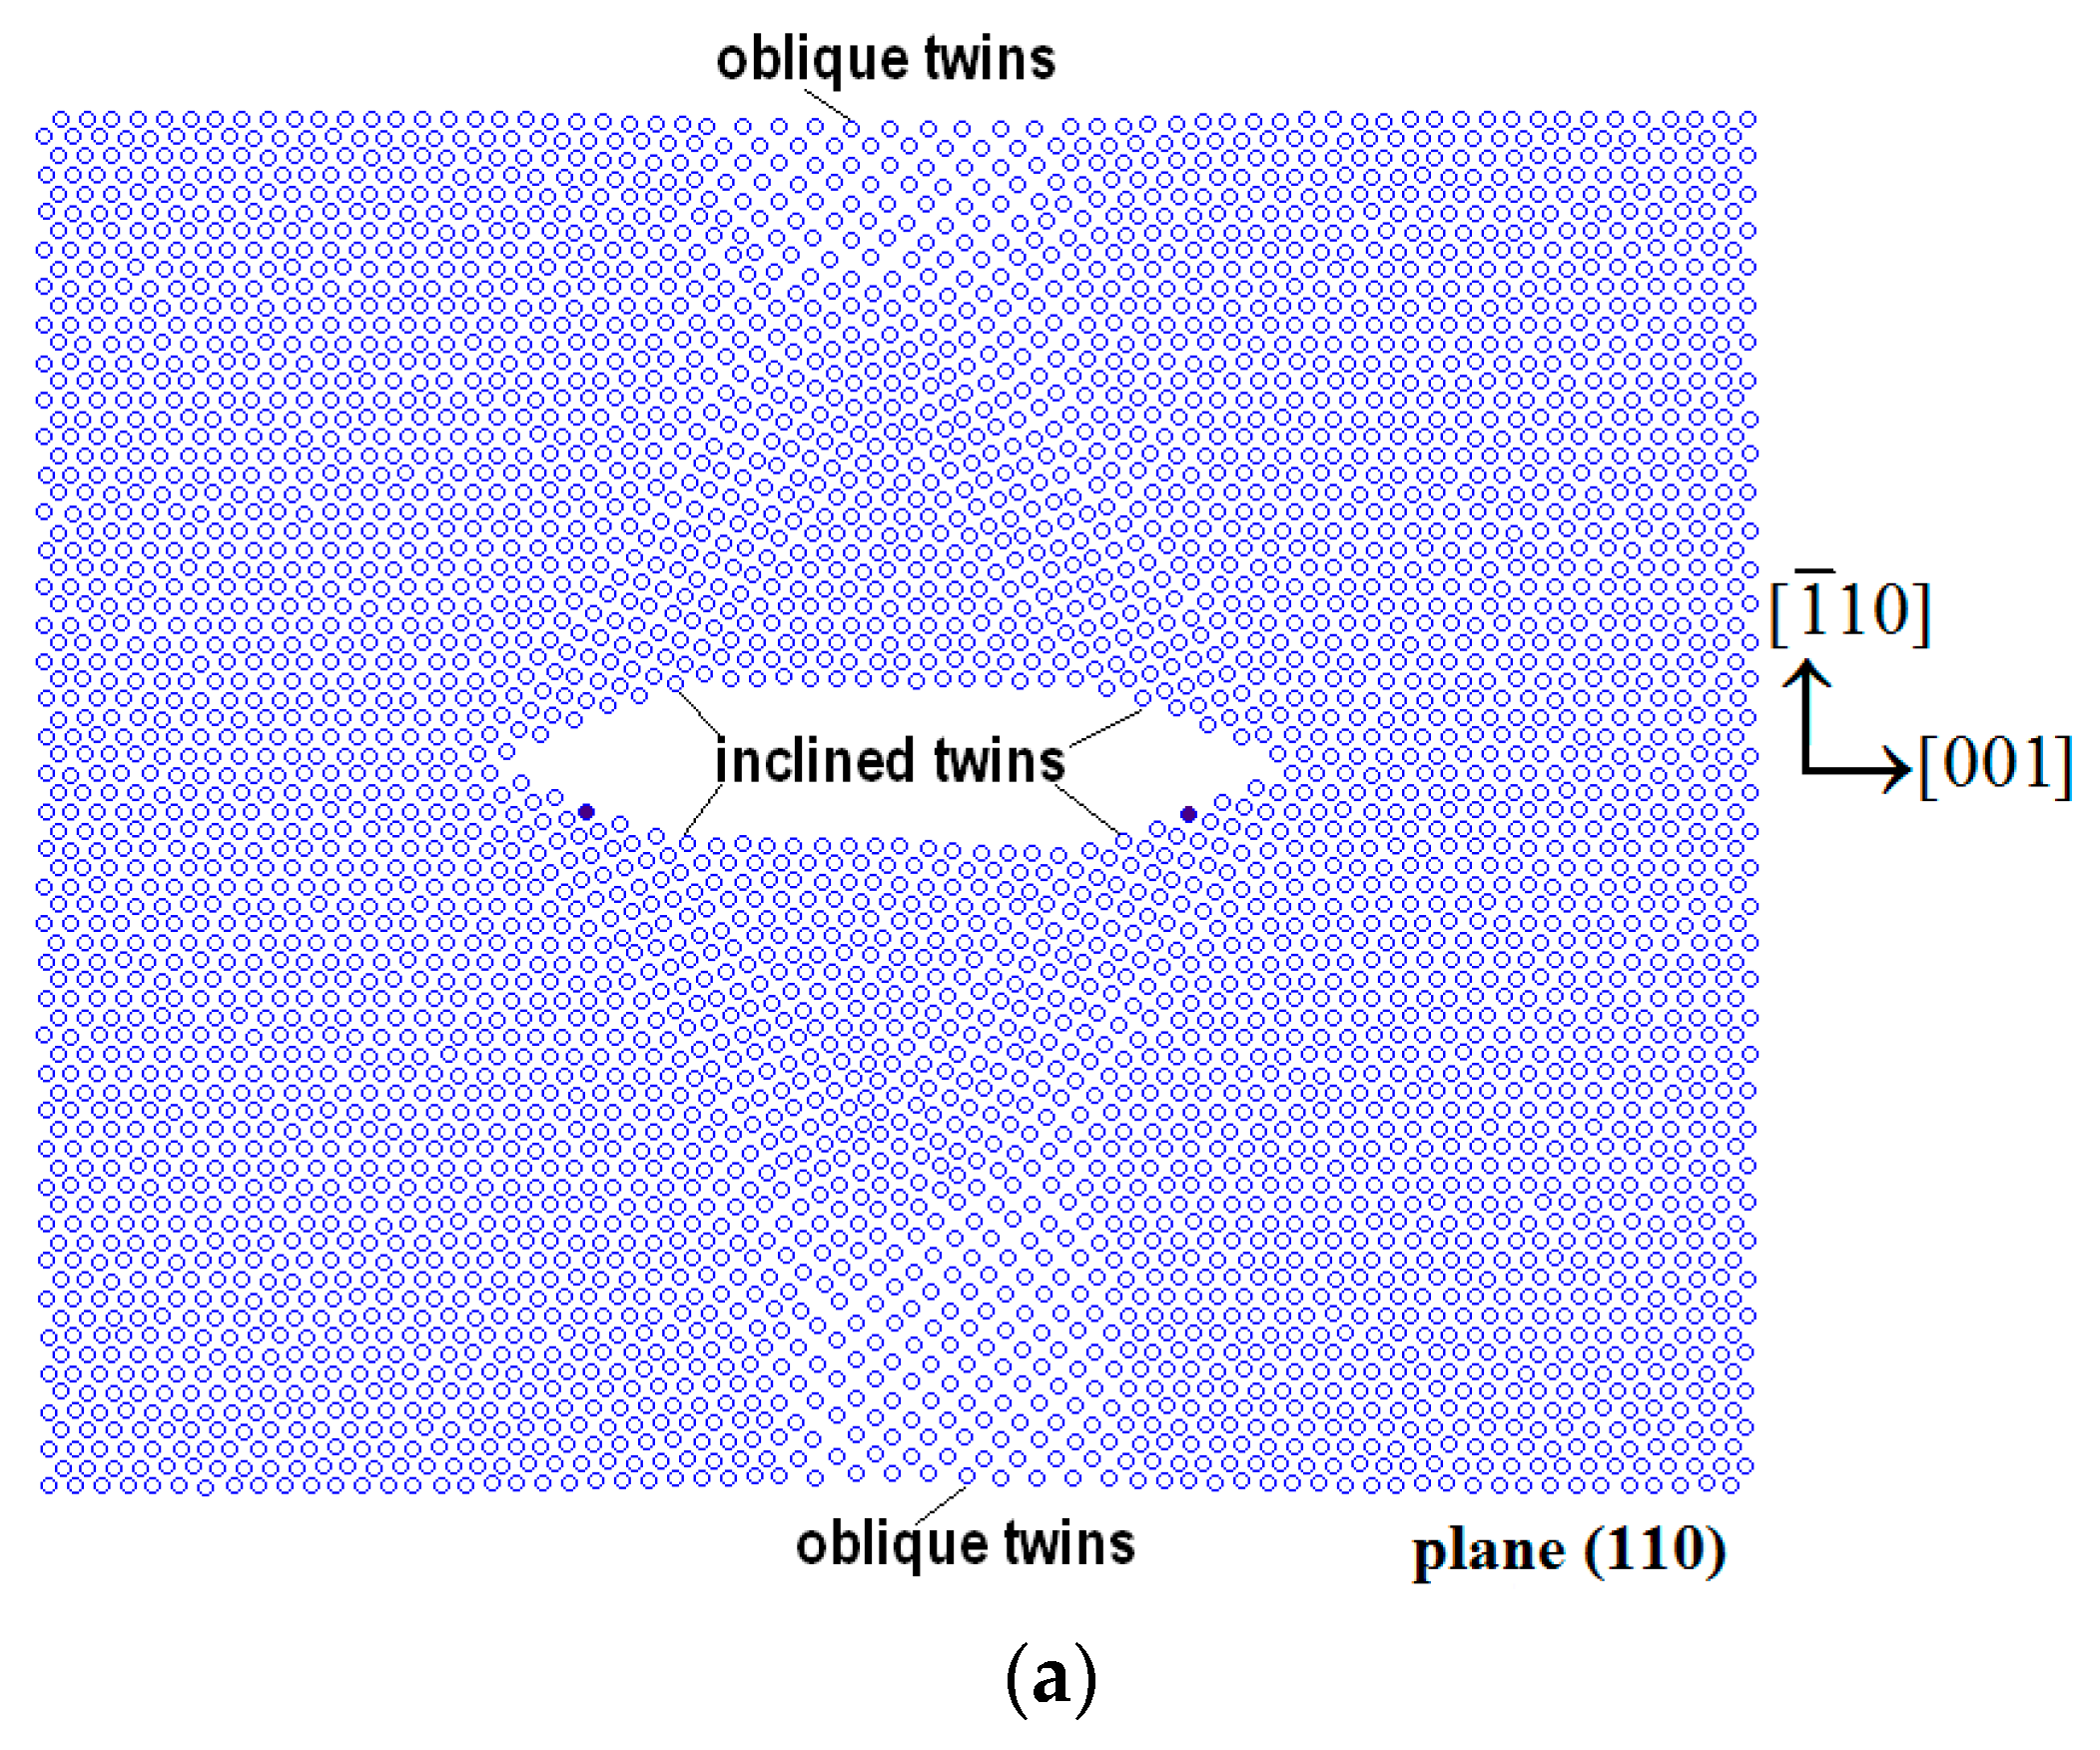
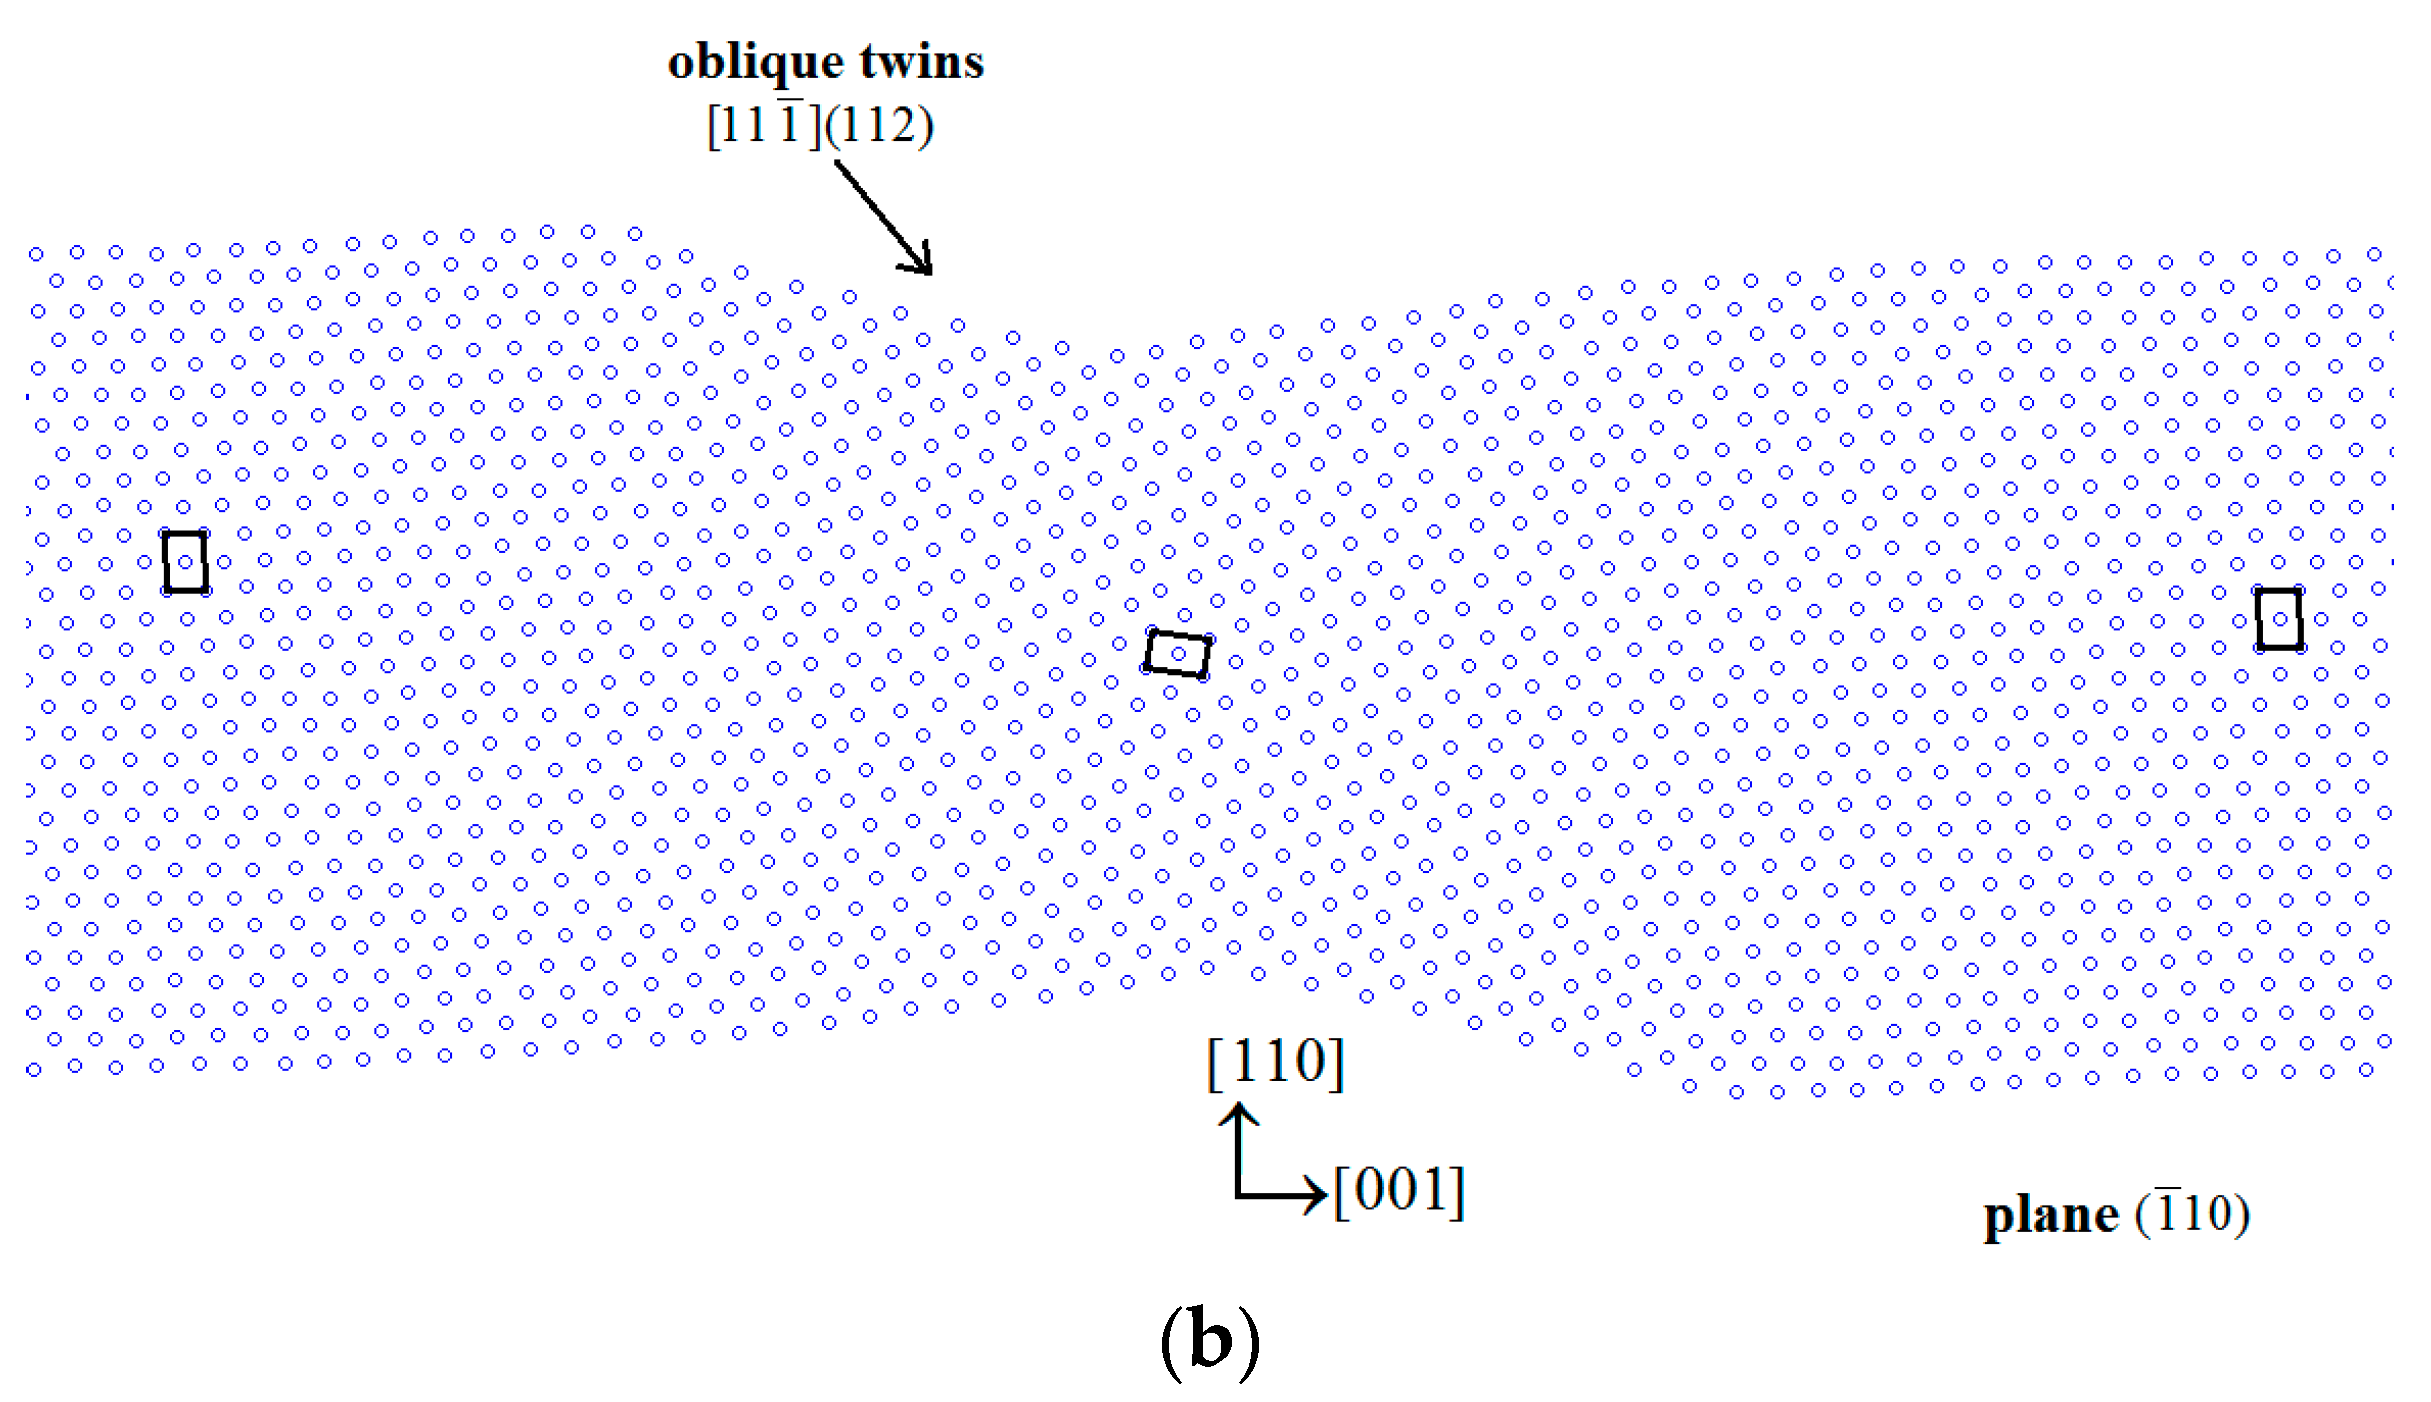
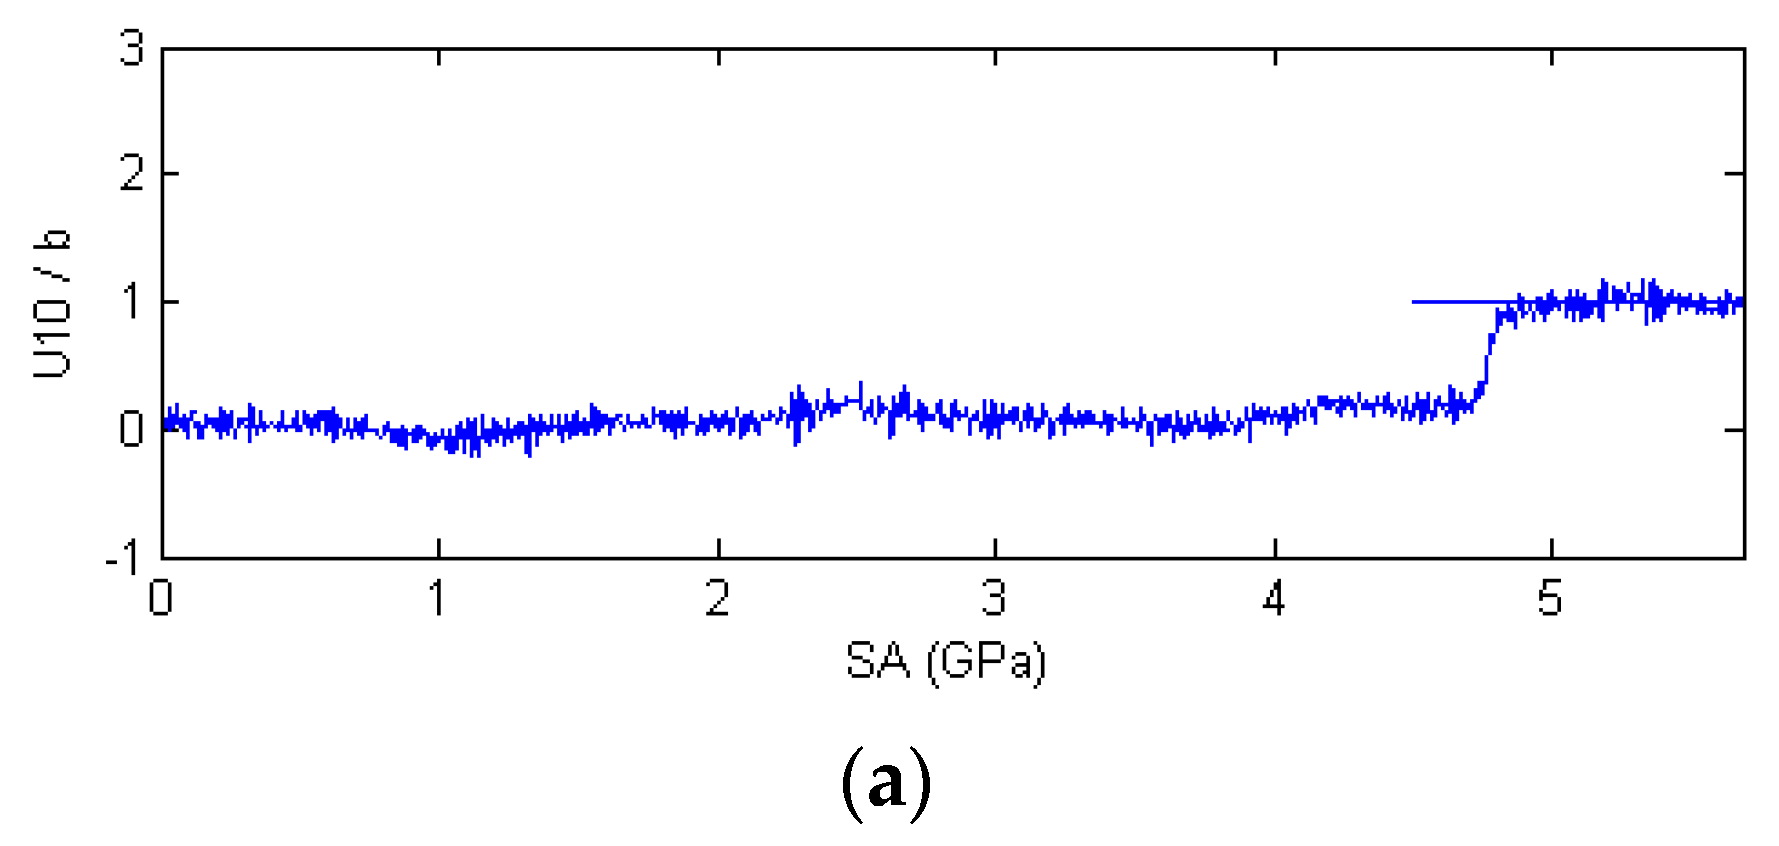
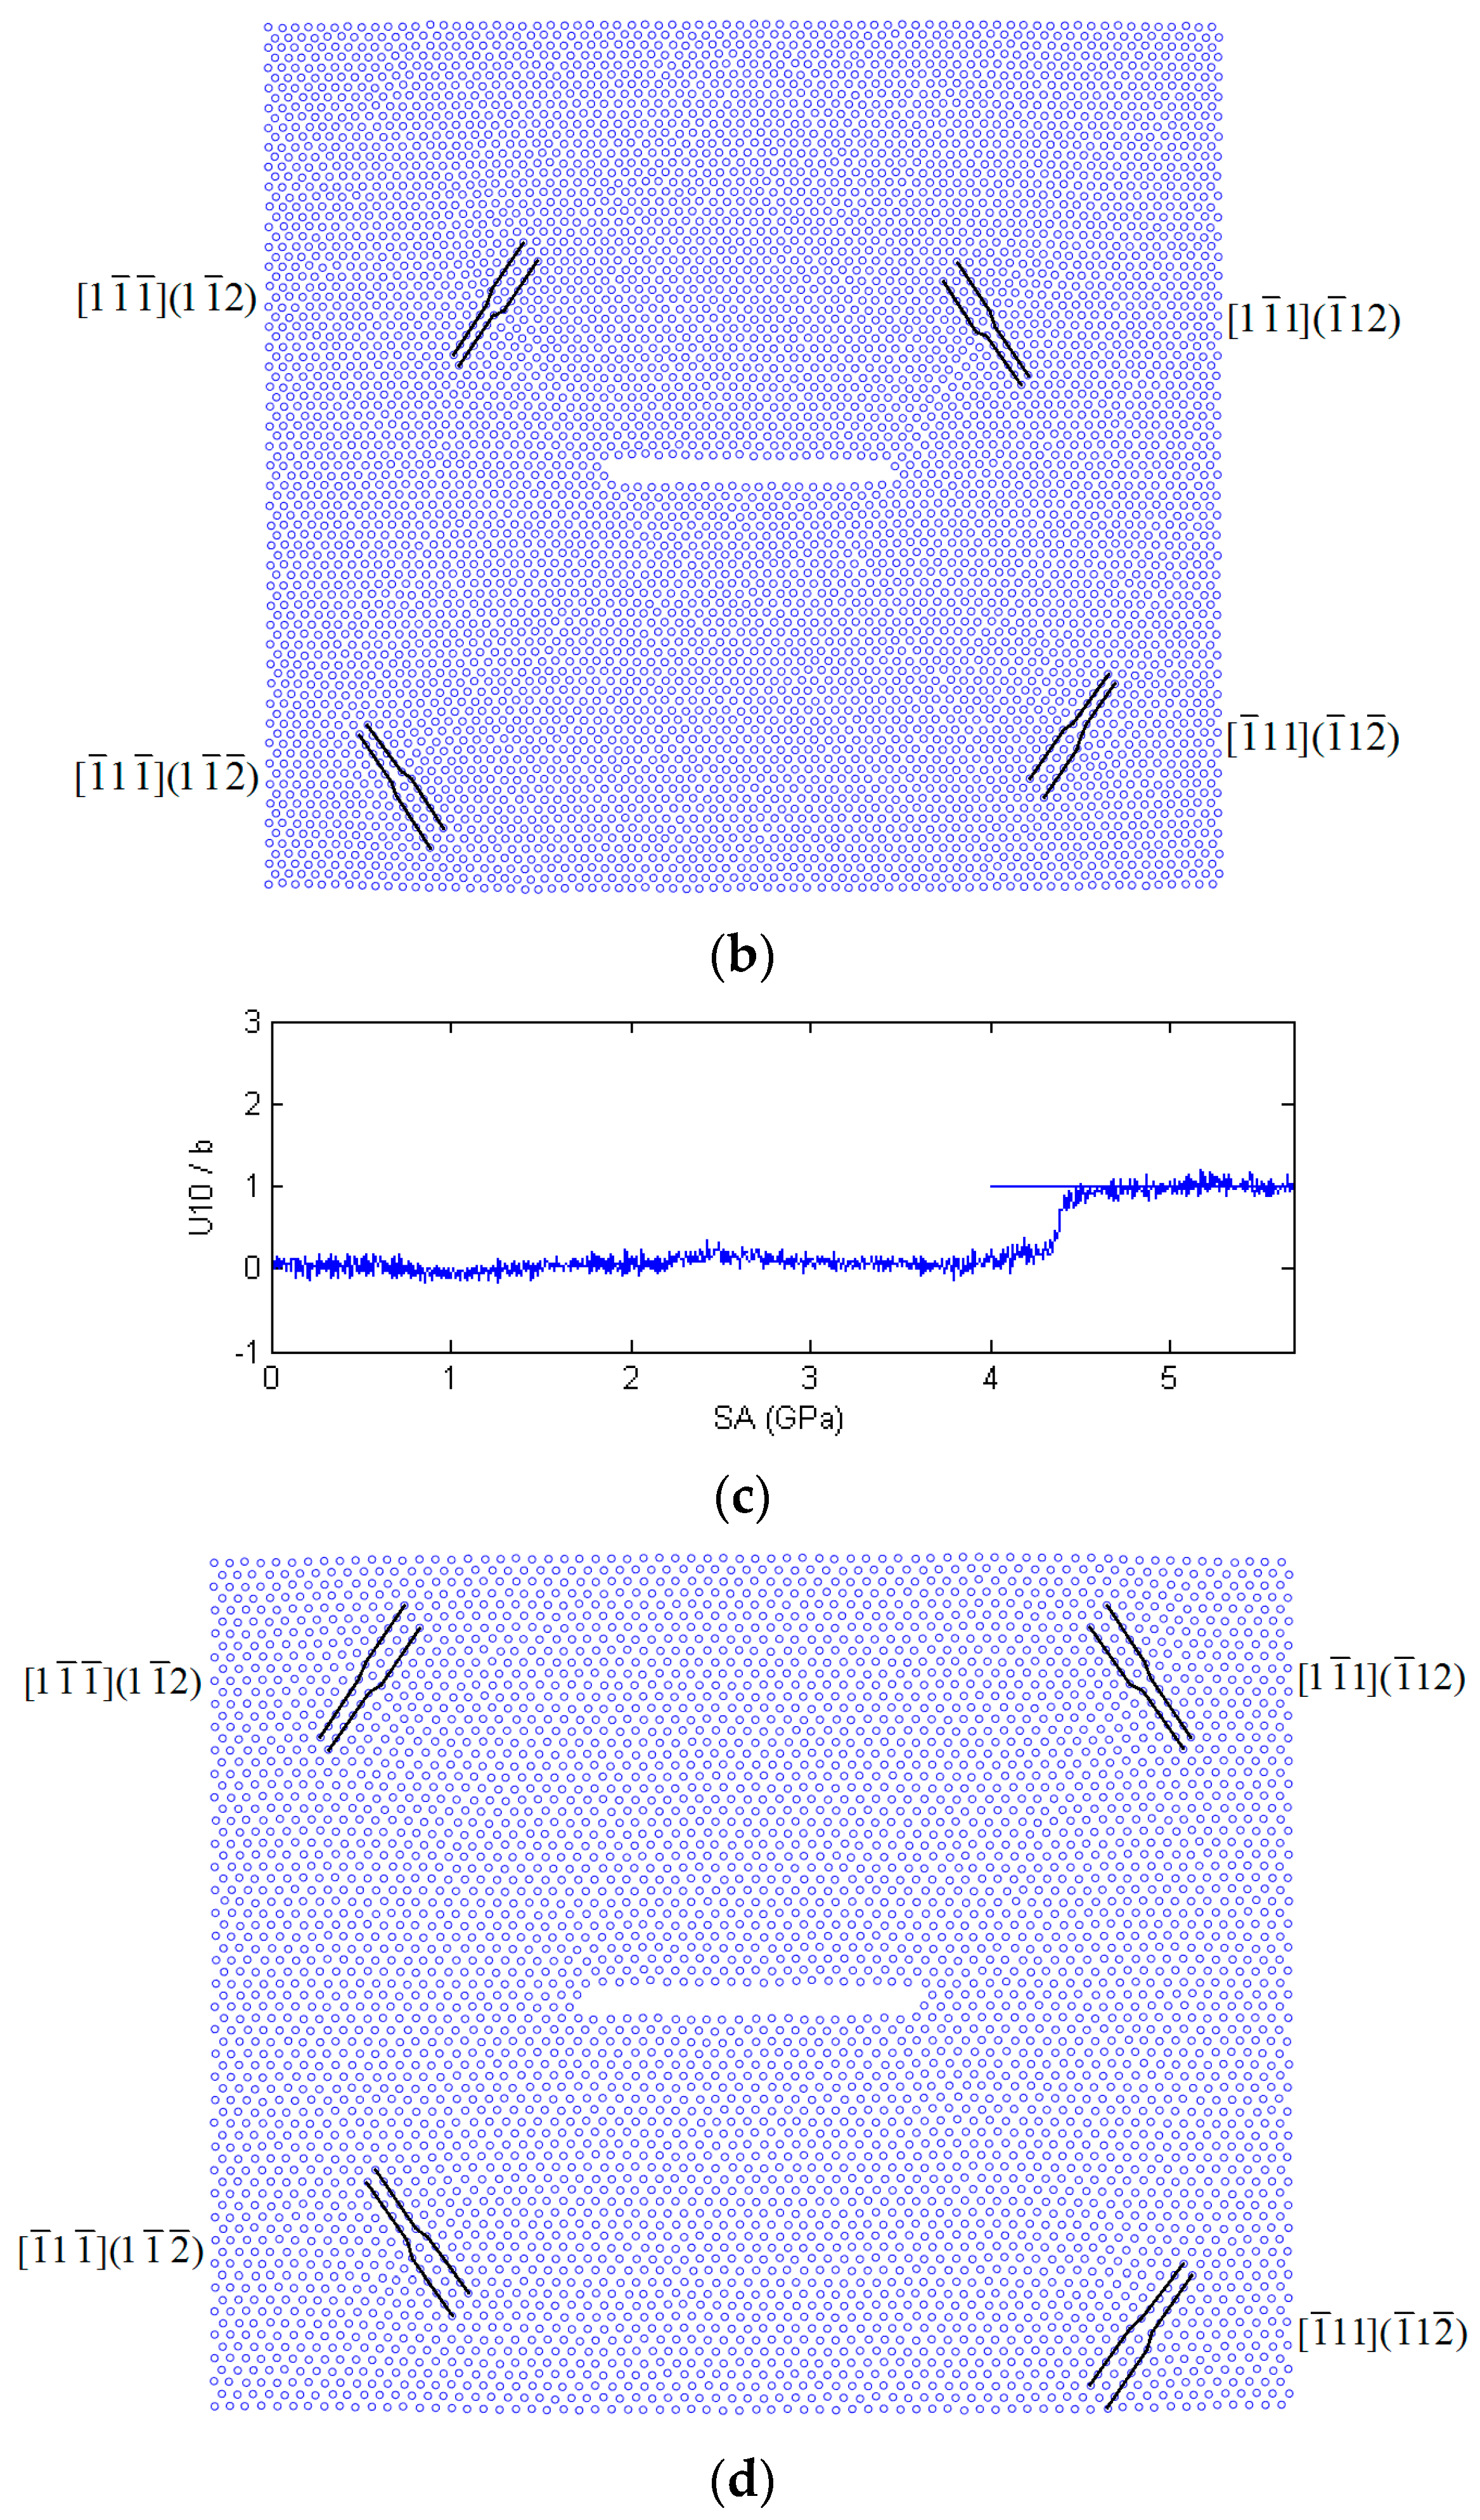
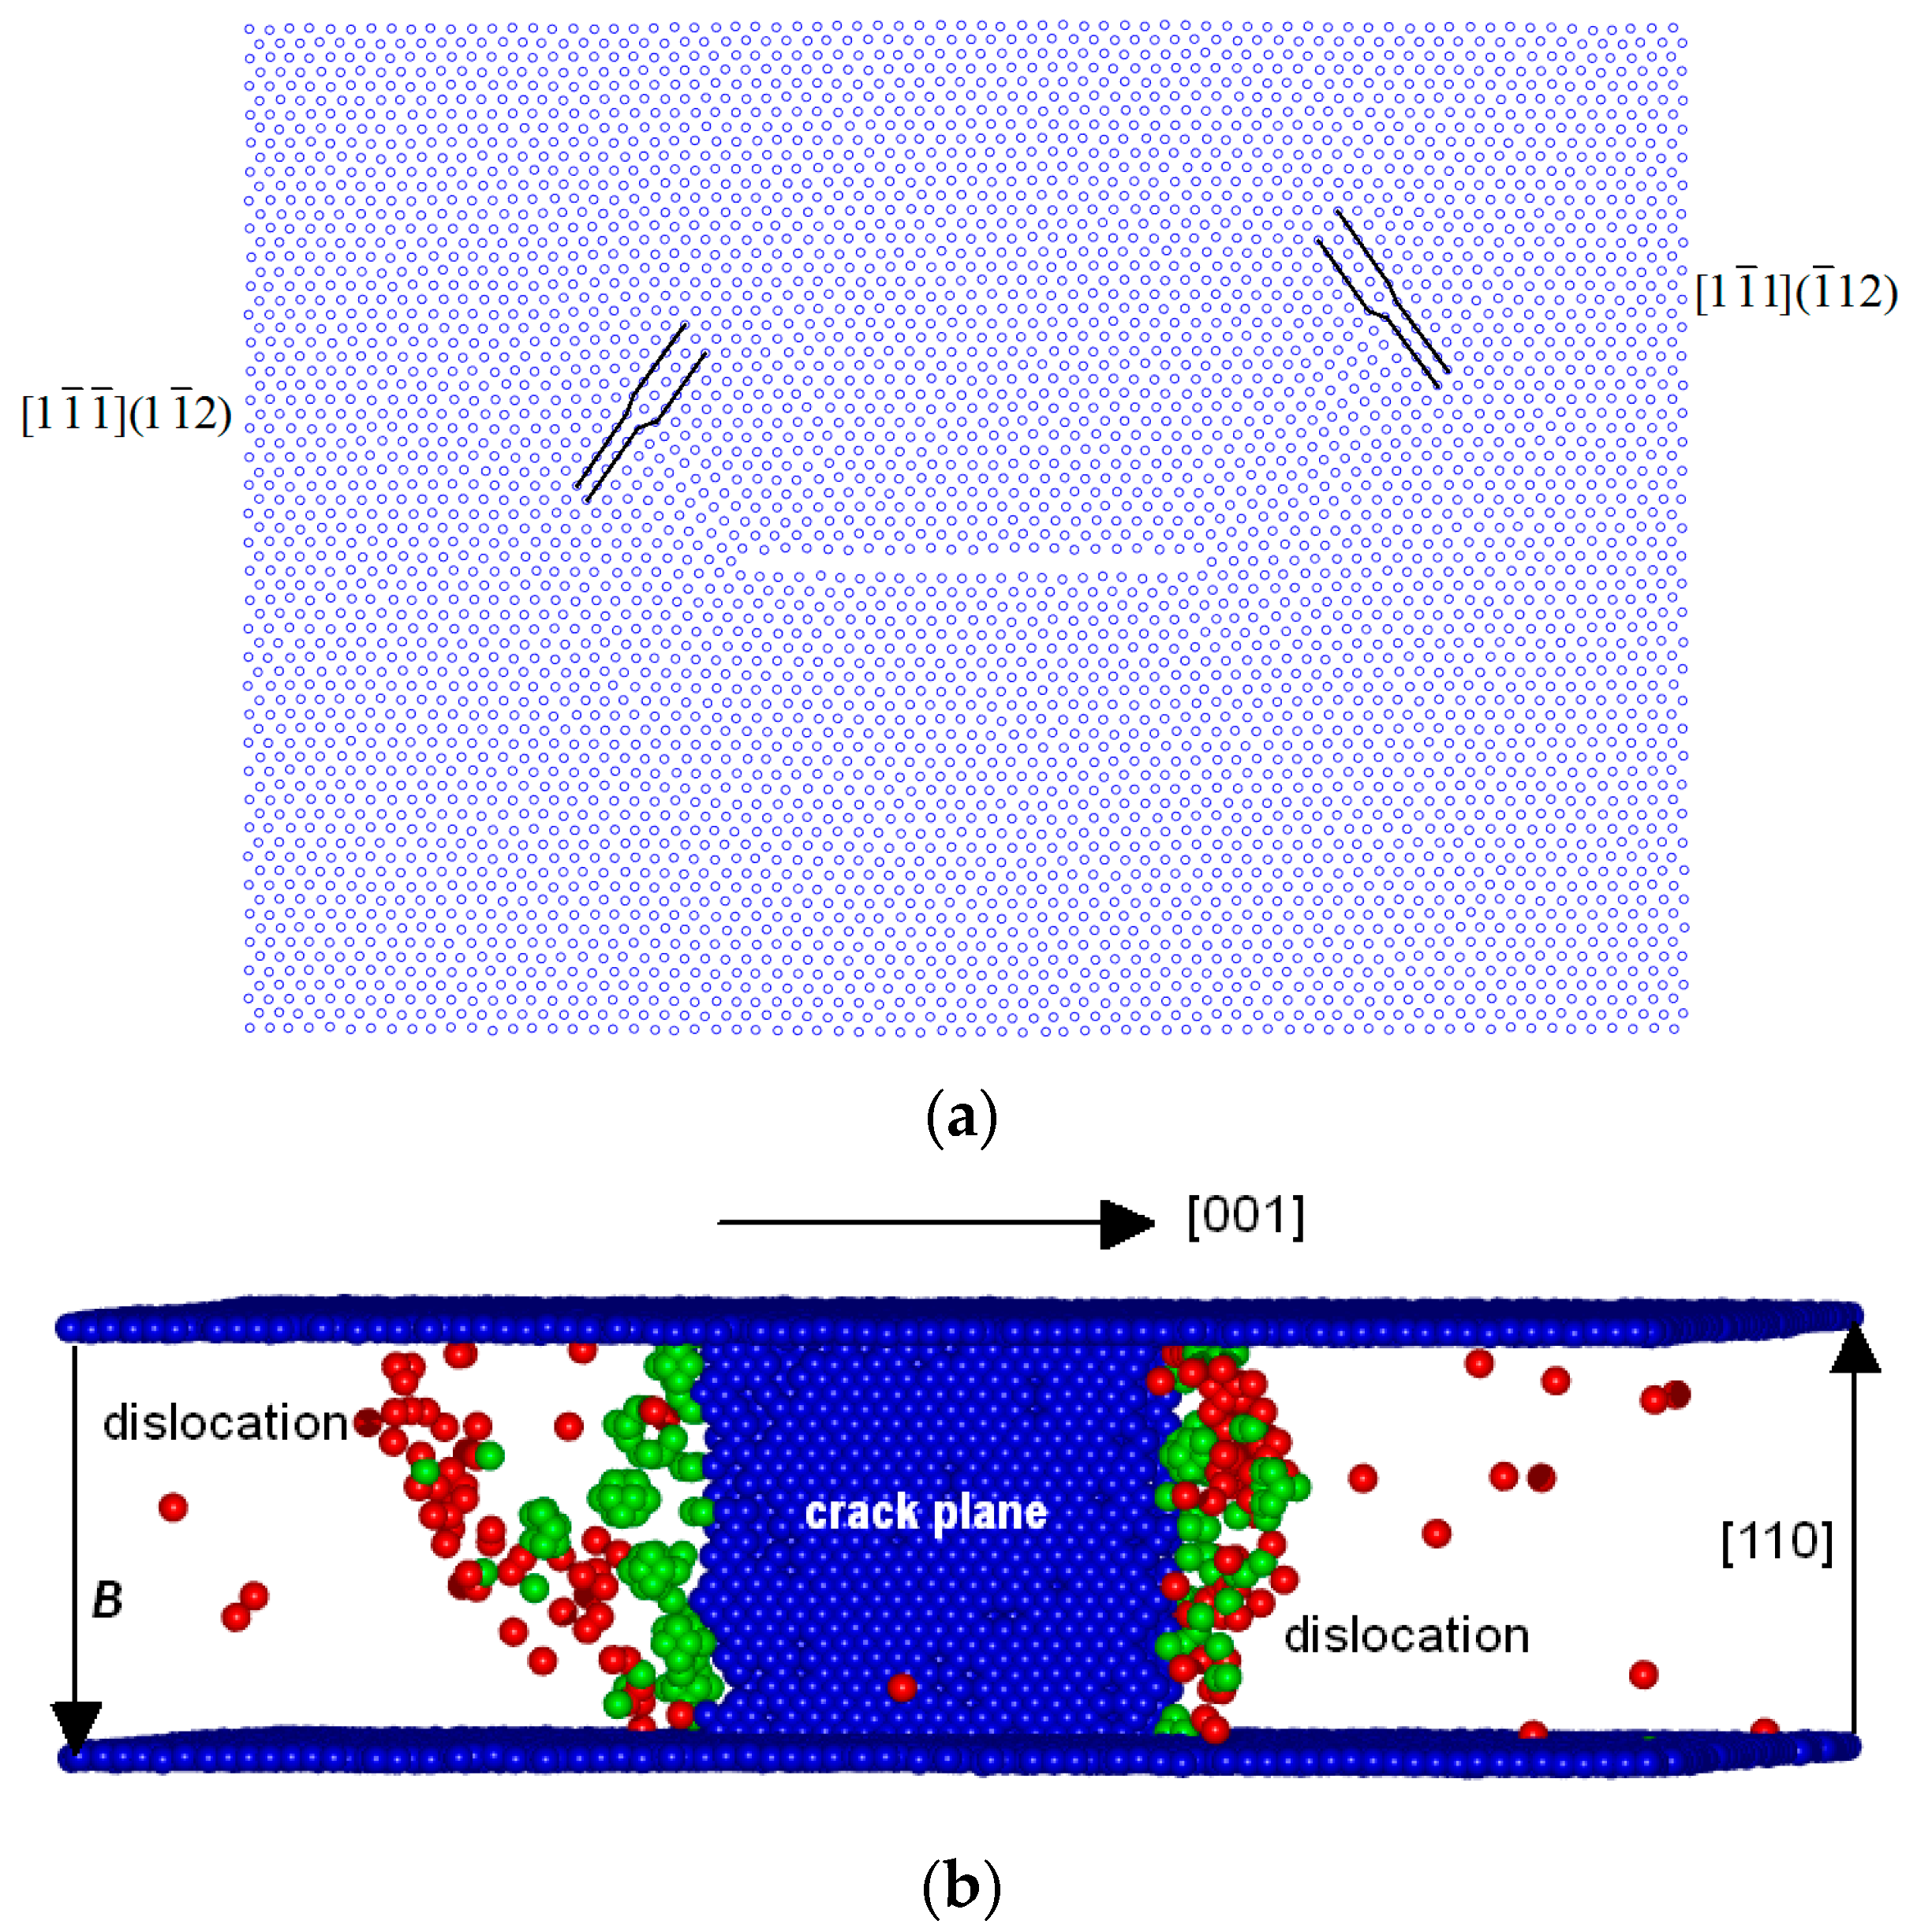
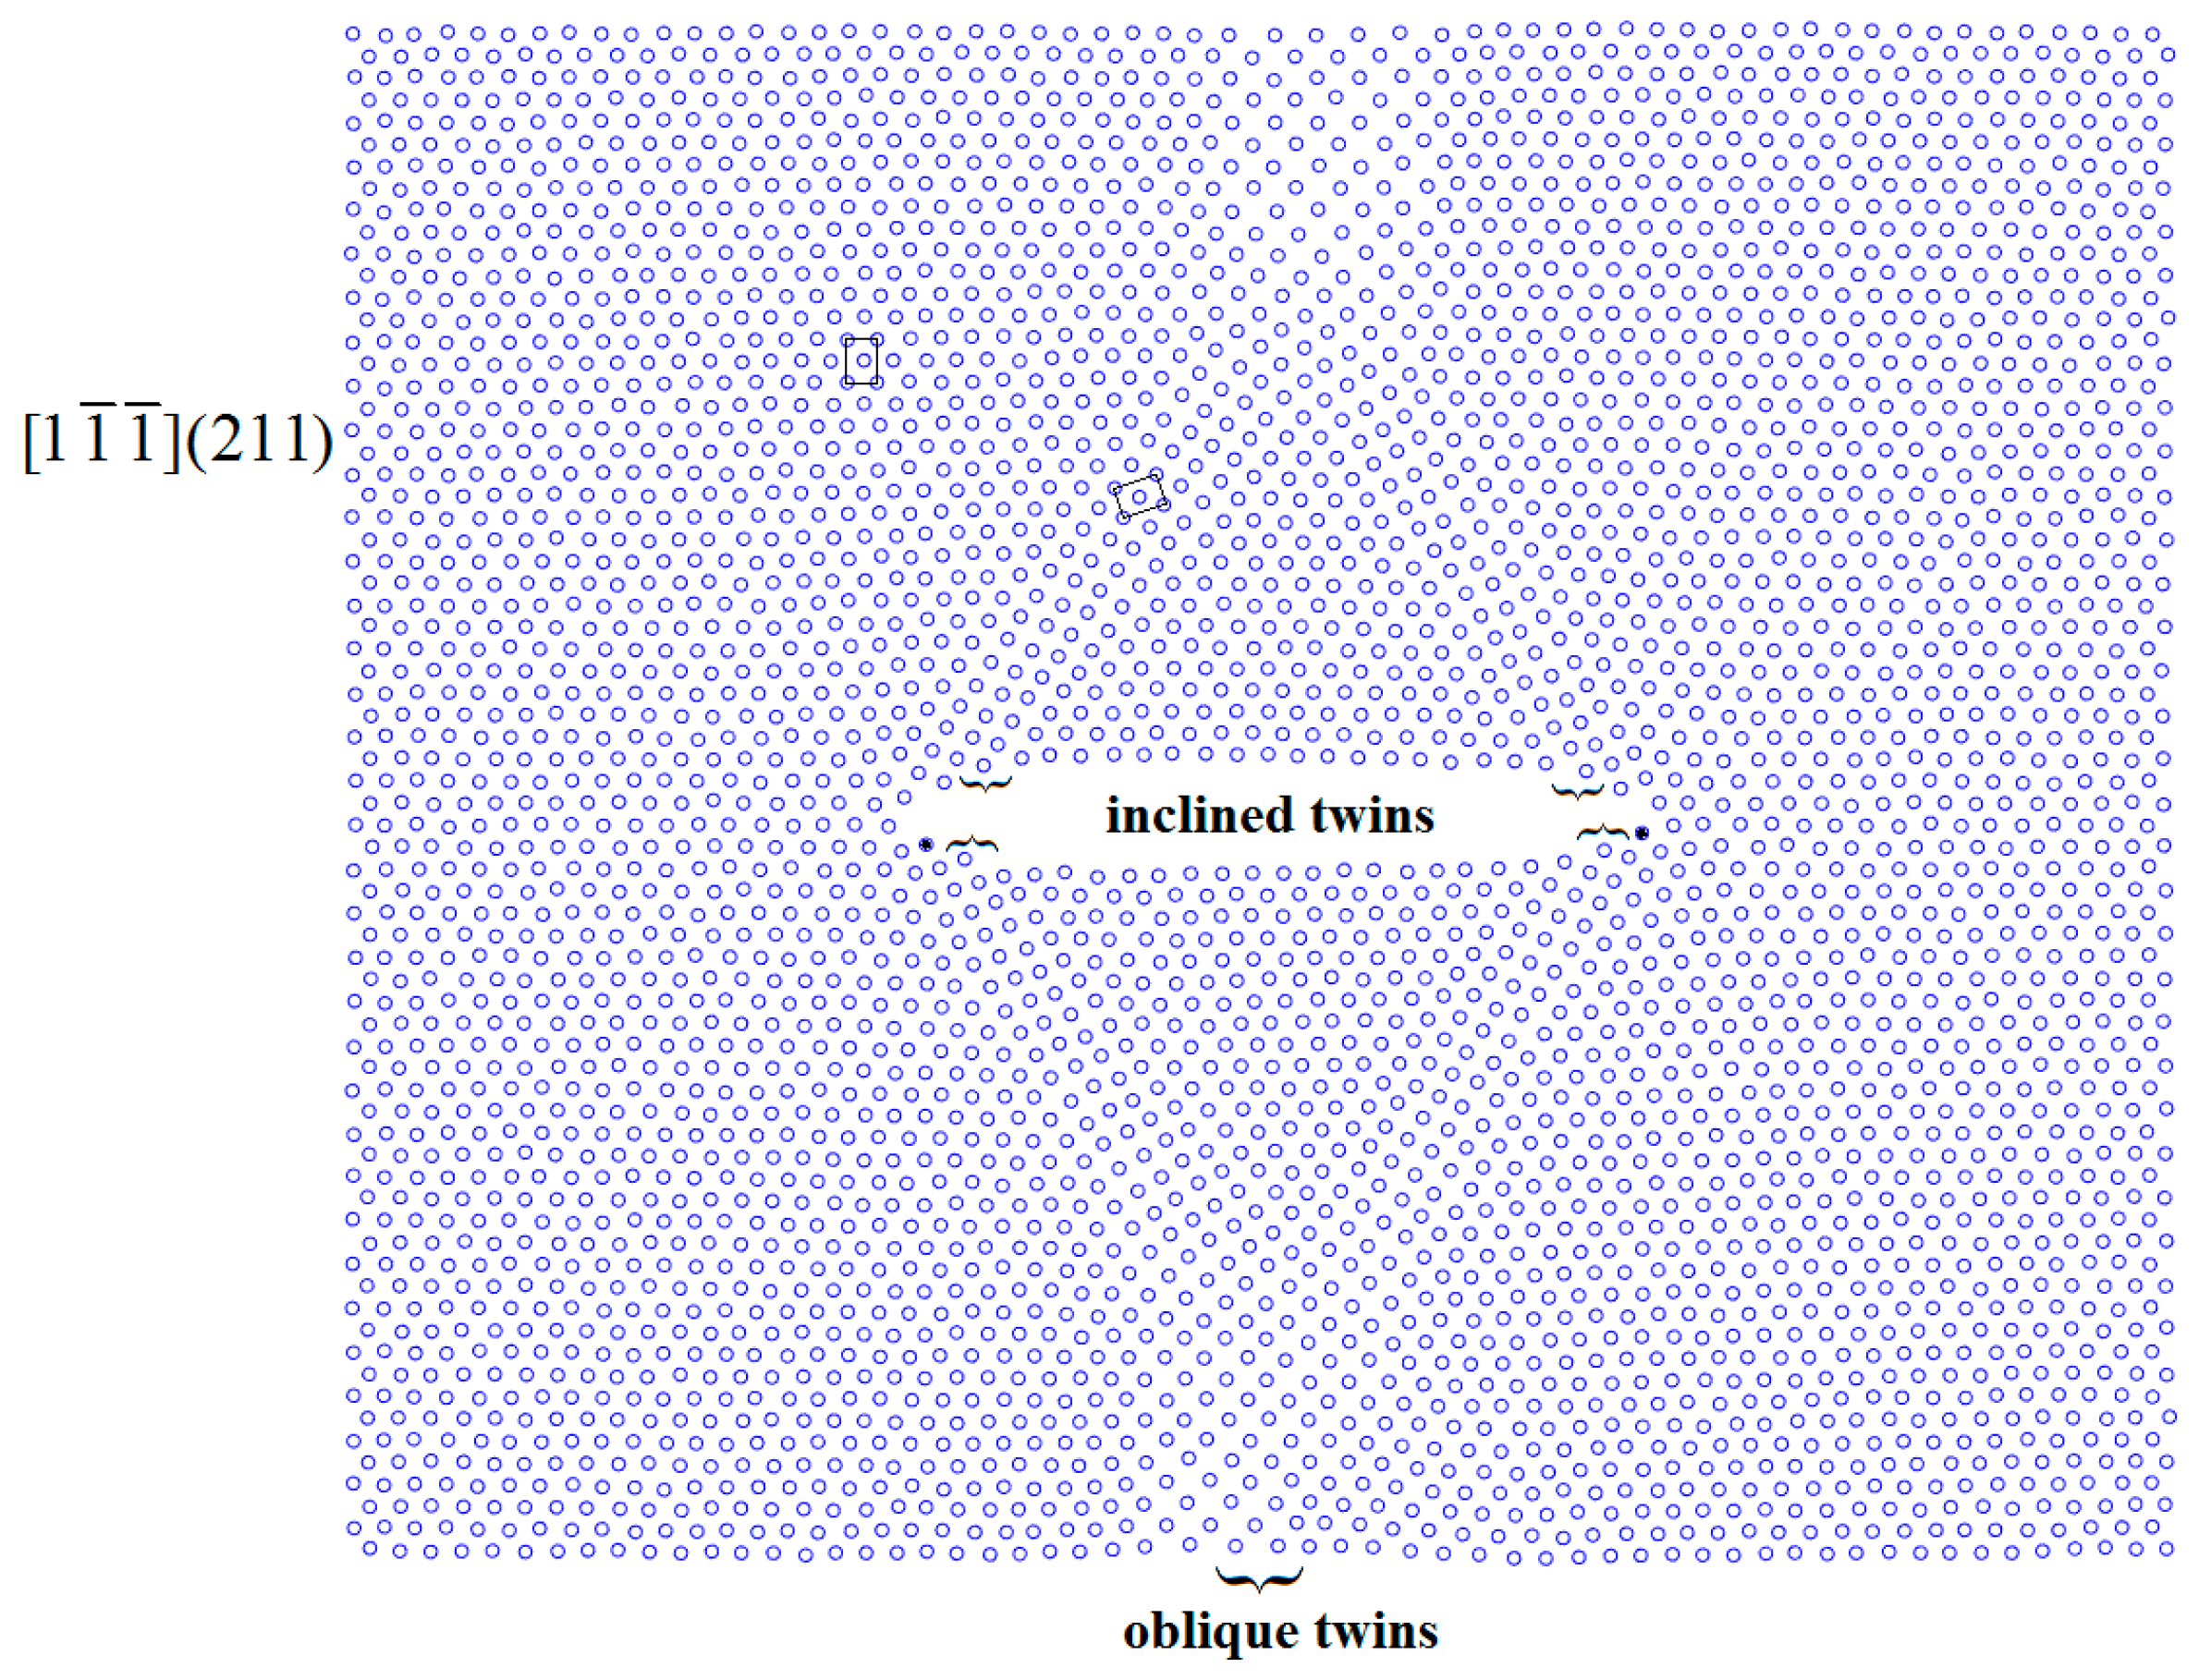
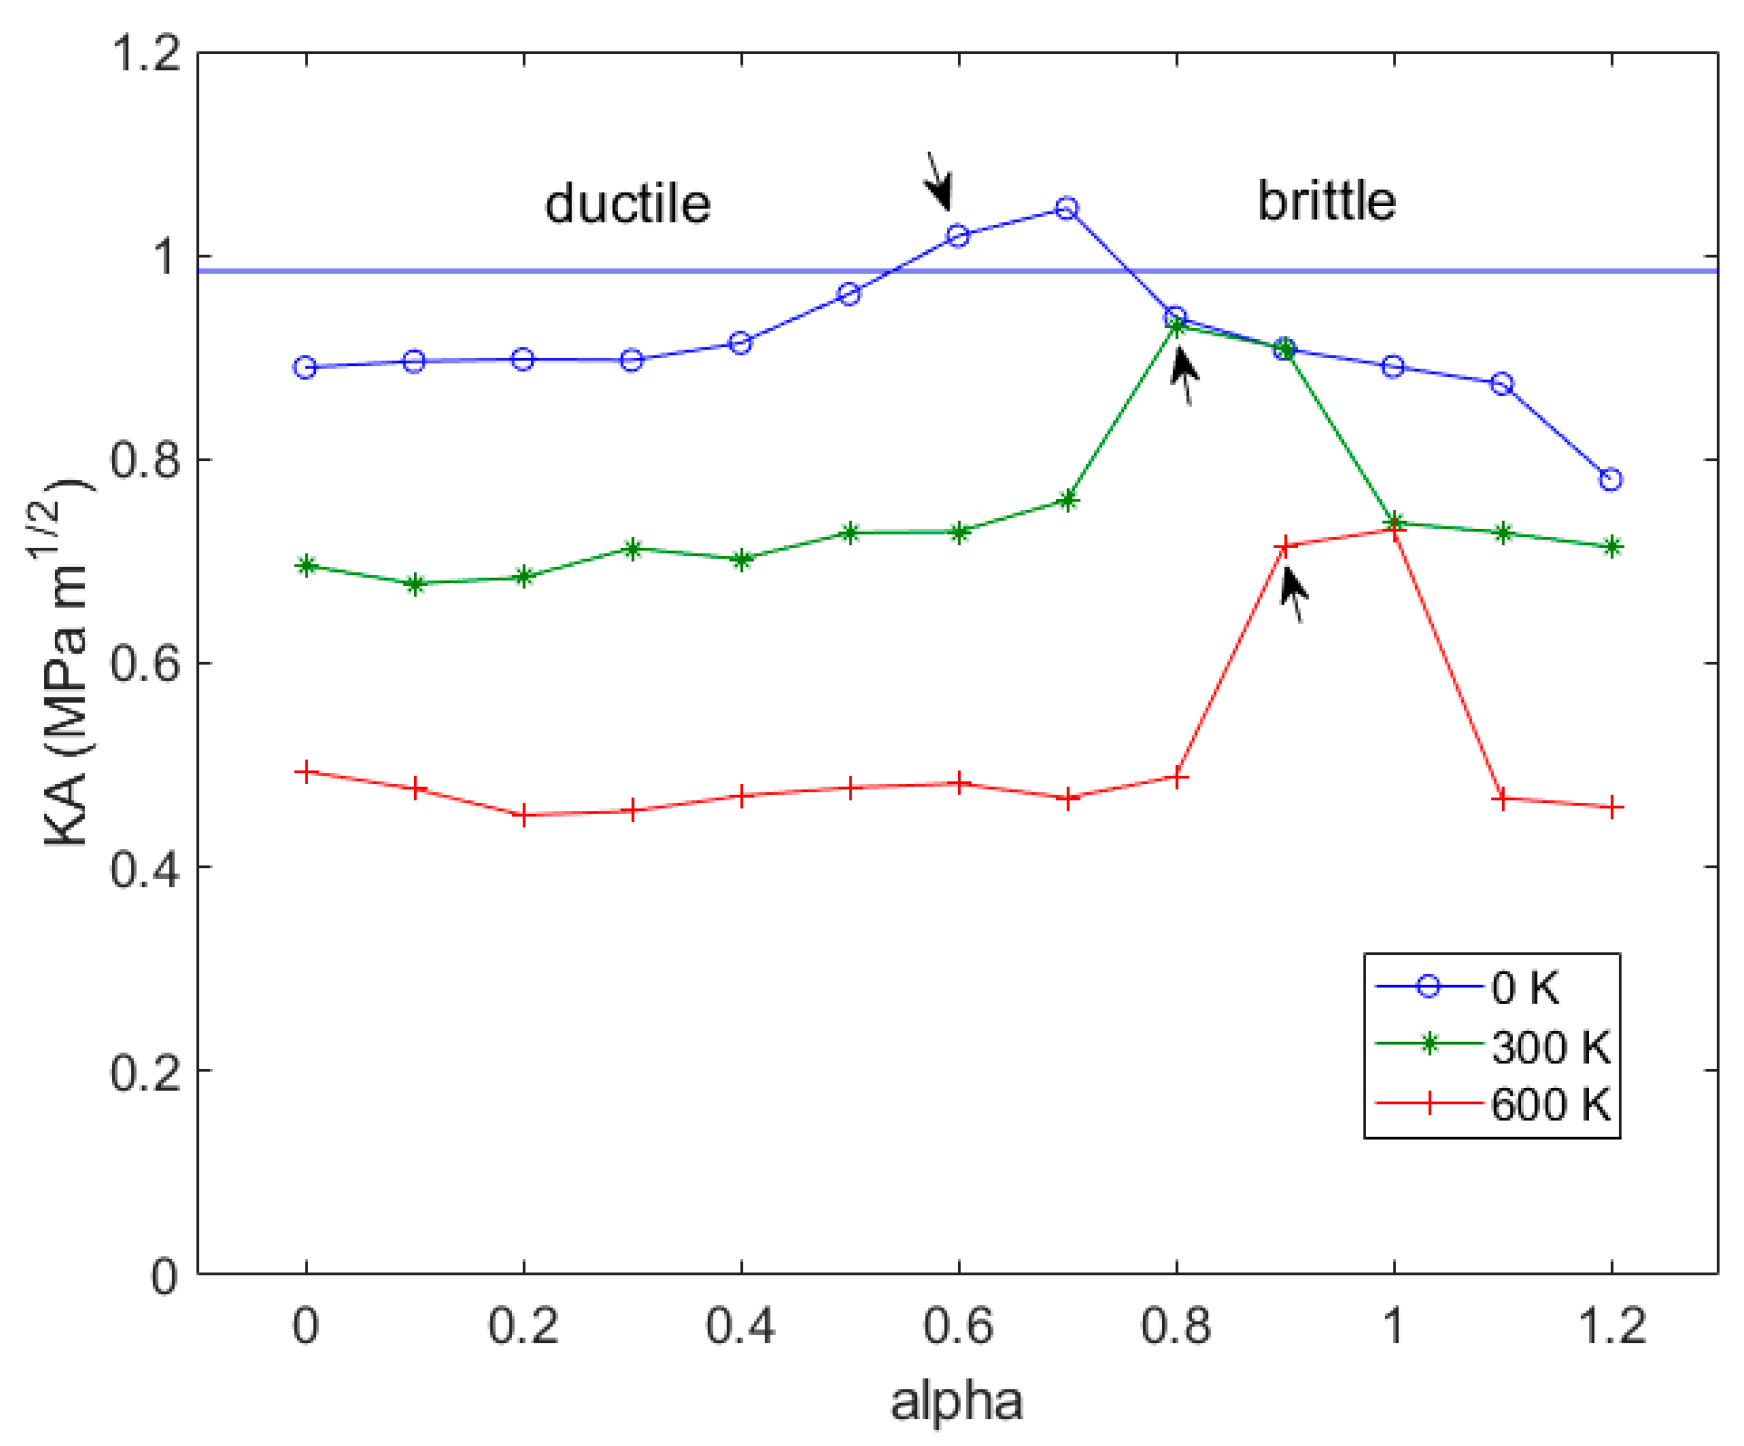
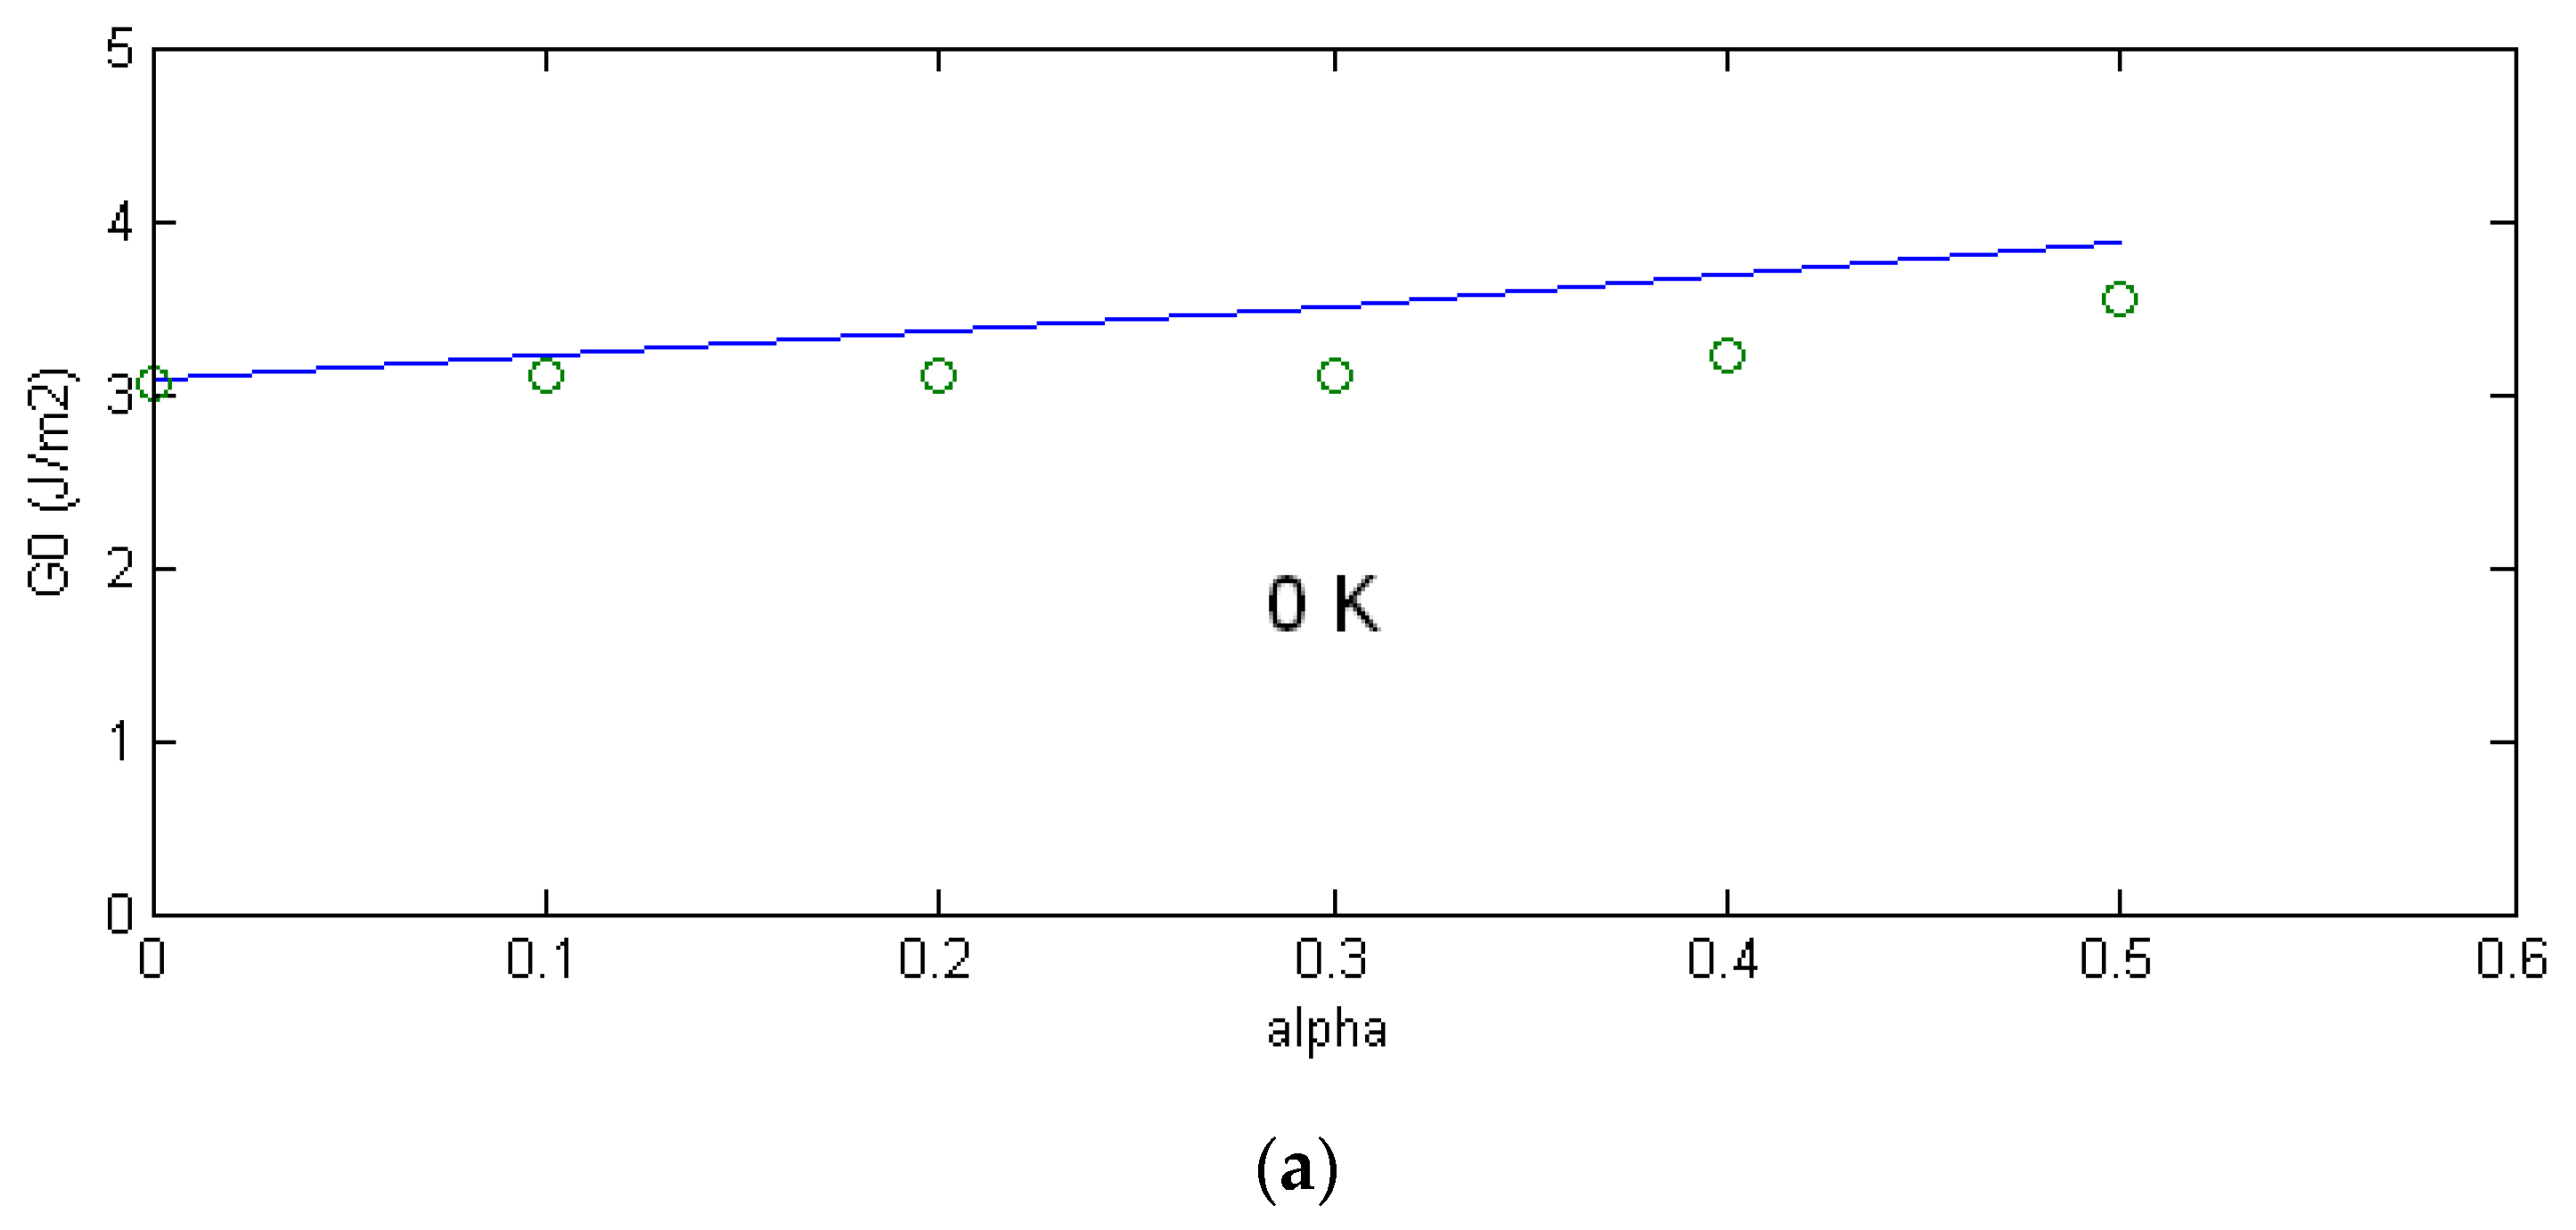
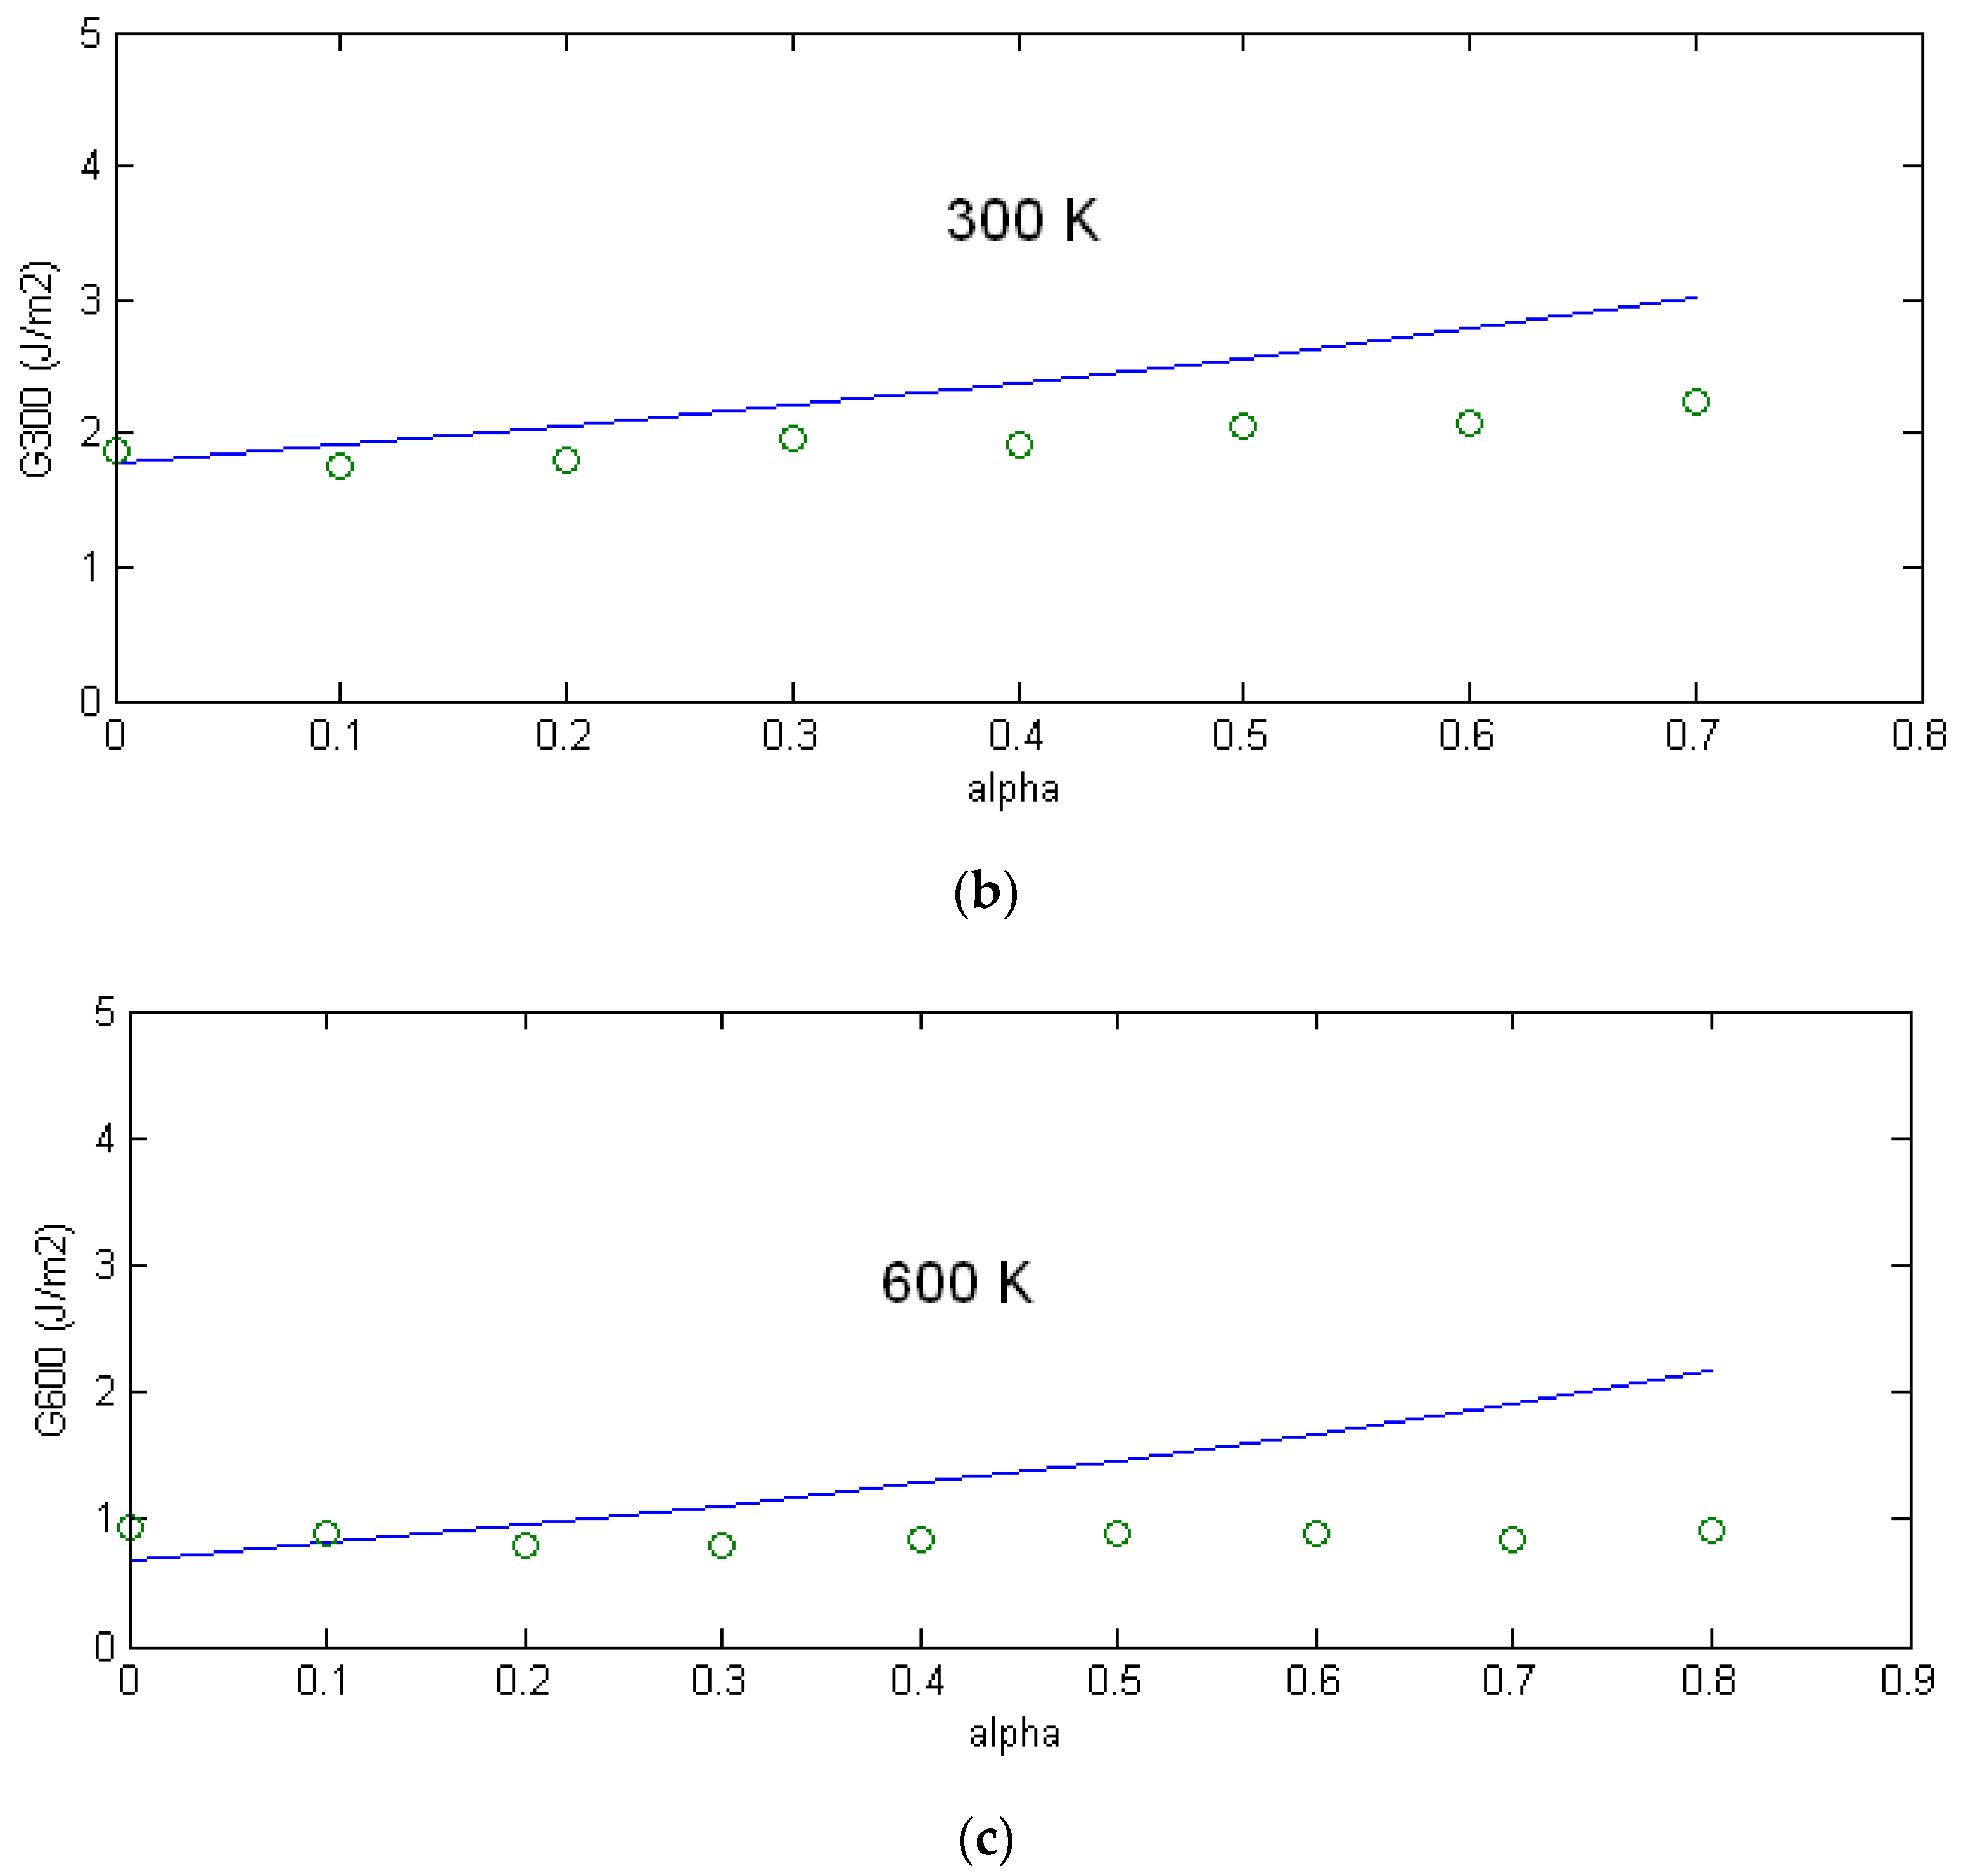
Table 1.
The ductile vs. brittle behavior at temperatures of 300 K and 600 K (bold) and different biaxiality ratios α = σB/σA; ∆t ≡ ∆t(e) is the loading time when the first complete dislocation emission <111>{112} is monitored (i.e., when U10/b = 1); ∆t ≡ ∆t(c) denotes the situation when crack initiation or extension is detected; Vcr is the crack velocity; T-stress is calculated from Equation (1).
| α | T [K] | Crack Behavior | Vcr [m/s] | ∆t(e)/h | ∆t(c)/h | σA(t) [GPa] | KA(t) [MPa m1/2] | T-Stress [GPa] |
|---|---|---|---|---|---|---|---|---|
| 0.0 | 300 | ductile, e{112} | / | 6068 | / | 6.897 | 0.696 | −6.109 |
| 600 | ductile, e{112} | / | 4291 | / | 4.877 | 0.494 | −4.320 | |
| 0.1 | 300 | ductile, e{112} | / | 5907 | / | 6.714 | 0.678 | −5.275 |
| 600 | ductile, e{112} | / | 4145 | / | 4.712 | 0.477 | −3.702 | |
| 0.2 | 300 | ductile, e{112} | / | 5963 | / | 6.778 | 0.684 | −4.648 |
| 600 | ductile, e{112} | / | 3921 | / | 4.457 | 0.451 | −3.056 | |
| 0.3 | 300 | ductile, e{112} | / | 6219 | / | 7.069 | 0.713 | −4.140 |
| 600 | ductile, e{112} | / | 3957 | / | 4.498 | 0.455 | −2.635 | |
| 0.4 | 300 | ductile, e{112} | / | 6119 | / | 6.955 | 0.702 | −3.378 |
| 600 | ductile, e{112} | / | 4081 | / | 4.639 | 0.470 | −2.253 | |
| 0.5 | 300 | ductile, e{112} | / | 6364 | / | 7.234 | 0.728 | −2.790 |
| 600 | ductile, e{112} | / | 4170 | / | 4.740 | 0.478 | −1.828 | |
| 0.6 | 300 | ductile, e{112} | / | 6385 | / | 7.258 | 0.729 | −2.079 |
| 600 | ductile, e{112} | / | 4200 | / | 4.774 | 0.482 | −1.364 | |
| 0.7 | 300 | ductile, e{112} | / | 6651 | / | 7.560 | 0.760 | −1.404 |
| 600 | ductile, e{112} | / | 4078 | / | 4.635 | 0.468 | −0.861 | |
| 0.8 | 300 | g{112) + e{011} + crack initiation | / | / | 8122 | 9.232 | 0.931 | −0.791 |
| 600 | e{112} + vanish. | / | / | 4264 | 4.847 | 0.489 | −0.415 | |
| 0.9 | 300 | crack extension + inclin.&obl.twins | 246 | / | 7921 | 9.004 | 0.909 | +0.129 |
| 600 | crack extension + inclin.&obl.twins | 109 | / | 6231 | 7.083 | 0.715 | +0.101 | |
| 1.0 | 300 | crack extension + inclin.&obl.twins | 136 | / | 6435 | 7.315 | 0.738 | +0.836 |
| 600 | crack extension + inclin.&obl.twins | 220 | / | 6371 | 7.242 | 0.731 | +0.828 | |
| 1.1 | 300 | crack extension + inclin.&obl.twins | 176 | / | 6349 | 7.214 | 0.728 | +1.546 |
| 600 | Crack init.&heal.; borders deform. | / | / | 4082 | 4.641 | 0.468 | +0.995 | |
| 1.2 | 300 | crack extension + inclin.&obl.twins | 184 | / | 6223 | 7.074 | 0.714 | +2.223 |
| 600 | crack extension + inclin.&obl.twins | 114 | / | 3997 | 4.543 | 0.459 | +1.428 |
Table 2.
Energy release rate and thermal activation of dislocation emission <111>{112}. The degree of thermal activation m in MD at temperature T is evaluated using Equation (3), where G is determined using the threshold values KA(t) from Table 1 and the evaluation of G0 uses the threshold values KA(t) for 0 K from [6]. The last two columns present the relative ratios G/G0 at 300 K and 600 K (bold) from MD and as predicted by continuum model (CM) respectively, using G0 according to [5], m = 31.7 for 300 K and m = 29.2 for 600 K in Equation (3). The letters “e” and “i” in the fourth column denote the crack extension and crack initiation, respectively.
| α | G0 [J/m2] | T [K] | G [J/m2] | m | G/G0 MD | G/G0 CM | |
|---|---|---|---|---|---|---|---|
| 0.0 | 3.060 | 300 | 1.871 | 28.90 | 0.61 | 0.60 | |
| 600 | 0.943 | 25.73 | 0.31 | 0.22 | |||
| 0.1 | 3.101 | 300 | 1.756 | 32.69 | 0.57 | 0.62 | |
| 600 | 0.879 | 27.00 | 0.28 | 0.25 | |||
| 0.2 | 3.115 | 300 | 1.807 | 31.79 | 0.58 | 0.63 | |
| 600 | 0.786 | 28.31 | 0.25 | 0.28 | |||
| 0.3 | 3.108 | 300 | 1.964 | 27.81 | 0.63 | 0.65 | |
| 600 | 0.801 | 28.04 | 0.26 | 0.32 | |||
| 0.4 | 3.227 | 300 | 1.904 | 32.16 | 0.59 | 0.66 | |
| 600 | 0.852 | 28.86 | 0.26 | 0.35 | |||
| 0.5 | 3.557 | 300 | 2.059 | 36.85 | 0.58 | 0.68 | |
| 600 | 0.883 | 32.50 | 0.25 | 0.38 | |||
| 0.6 | / | 300 | 2.073 | / | / | ||
| 600 | 0.898 | 28.56 | / | ||||
| 0.7 | / | 300 | e | 2.231 | / | / | |
| 600 | e | 0.846 | 33.66 | ||||
| 0.8 | 3.406 | 300 | i | 3.348 | / | / | |
| 600 | e | 0.924 | 30.16 |
Table 3.
Dislocation speed Vdisl/CT at different temperature and biaxiality ratio α = σB/σA.
| α | T [K] | Vdisl/CT |
|---|---|---|
| 0.0 | 0 | 0.85 |
| 300 | 0.76 | |
| 600 | 0.69 | |
| 0.5 | 0 | 0.65 |
| 300 | 0.54 | |
| 600 | 0.47 |
Table 4.
Energy release rate G and degree of thermal activation m from MD at the crack initiation facilitated with twinning. The critical Griffith level Gcrit = 2γs for the used potential is 2γ110 = 3.17 J/m2. The value marked by the asterisk * was excluded from the evaluation (see the text above).
Table 4.
Energy release rate G and degree of thermal activation m from MD at the crack initiation facilitated with twinning. The critical Griffith level Gcrit = 2γs for the used potential is 2γ110 = 3.17 J/m2. The value marked by the asterisk * was excluded from the evaluation (see the text above).
| α | T [K] | G [J/m2] | m |
|---|---|---|---|
| 1.1 | 0 | 2.951 | |
| 300 | 2.047 | 21.29 | |
| 600 | 0.846 | 25.58 * | |
| 1.2 | 0 | 2.308 | |
| 300 | 1.969 | 8.25 | |
| 600 | 0.814 | 18.16/28.08 |
Publisher’s Note: MDPI stays neutral with regard to jurisdictional claims in published maps and institutional affiliations. |
© 2020 by the authors. Licensee MDPI, Basel, Switzerland. This article is an open access article distributed under the terms and conditions of the Creative Commons Attribution (CC BY) license (http://creativecommons.org/licenses/by/4.0/).
Share and Cite
MDPI and ACS Style
Uhnáková, A.; Machová, A.; Hora, P. Thermal Activation and Ductile vs. Brittle Behavior of Microcracks in 3D BCC Iron Crystals under Biaxial Loading by Atomistic Simulations. Metals 2020, 10, 1525. https://doi.org/10.3390/met10111525
AMA Style
Uhnáková A, Machová A, Hora P. Thermal Activation and Ductile vs. Brittle Behavior of Microcracks in 3D BCC Iron Crystals under Biaxial Loading by Atomistic Simulations. Metals. 2020; 10(11):1525. https://doi.org/10.3390/met10111525
Chicago/Turabian StyleUhnáková, Alena, Anna Machová, and Petr Hora. 2020. "Thermal Activation and Ductile vs. Brittle Behavior of Microcracks in 3D BCC Iron Crystals under Biaxial Loading by Atomistic Simulations" Metals 10, no. 11: 1525. https://doi.org/10.3390/met10111525
Note that from the first issue of 2016, this journal uses article numbers instead of page numbers. See further details here.