Article

Softening of Shear Elastic Coefficients in Shape Memory Alloys Near the Martensitic Transition: A Study by Laser-Based Resonant Ultrasound Spectroscopy

1
Institute of Thermomechanics, Czech Academy of Sciences, Dolejškova 5, 182 00 Prague, Czech Republic
2
Institute of Physics, Czech Academy of Sciences, Na Slovance 1999/2, 182 21 Prague, Czech Republic
3
Faculty of Mathematics and Physics, Charles University, Ke Karlovu 5, 121 16 Prague, Czech Republic
*
Author to whom correspondence should be addressed.
Metals 2020, 10(10), 1383; https://doi.org/10.3390/met10101383
Submission received: 15 September 2020 / Revised: 6 October 2020 / Accepted: 7 October 2020 / Published: 16 October 2020
(This article belongs to the Special Issue Shape Memory Alloys 2020)

Abstract

:
We discuss the suitability of laser-based resonant ultrasound spectroscopy (RUS) for the characterization of soft shearing modes in single crystals of shape memory alloys that are close to the transition temperatures. We show, using a numerical simulation, that the RUS method enables the accurate determination of the c shear elastic coefficient, even for very strong anisotropy, and without being sensitive to misorientations of the used single crystal. Subsequently, we apply the RUS method to single crystals of three typical examples of shape memory alloys (Cu-Al-Ni, Ni-Mn-Ga, and NiTi), and discuss the advantages of using the laser-based contactless RUS arrangement for temperature-resolved measurements of elastic constants.

1. Introduction

Athermal martensitic transitions are known to be mediated by soft acoustic phonons [1,2,3]. In the shape memory alloys (SMAs), the relation between the structural change and acoustic phonons can be most apparently observed for the forward transition, i.e., the transition from the high temperature phase (austenite) to either the low temperature phase (martensite) or some intermediate phases (R-phase in NiTi [4], premartensite in stoichiometric Ni 2 MnGa [5], and similar). Prior to this transition itself, the austenite crystal lattice anomalously softens with respect to specific shearing modes when approaching the transition temperature [6,7,8], which indicates acoustic phonon condensation. Most typically, for materials for which the spontaneous lattice strain due to the transition is equivalent to tetragonal distortion along the the Bain path, the softening is observed for the 1 1 0 { 1 1 ¯ 0 } shears in the cubic lattice (i.e., the TA 2 phonon).
In terms of elastic constants of cubic austenite, this shear softening can be observed as a decrease of the elastic constant c , which corresponds to the slope of the TA 2 phonon branch in the low-frequency limit. Cubic materials have three independent elastic constants: c 11 , c 12 , and c 44 (in the Voigt notation), and the shear elastic constant c can be expressed as
c = c 11 c 12 2 .
As the instability of the lattice increases when approaching the martensitic transition temperature, this constant becomes much softer than the constant c 44 representing the stiffness against basal ( 1 0 0 { 0 1 0 } ) shears. Hence, the Zener anisotropy ratio (e.g., [9])
A = c 44 c = 2 c 44 c 11 c 12
can be used as an appropriate scalar parameter for quantifying the instability. While for single crystals of pure metals this ratio is typically between 1 and 3 (3.21 for copper is already considered to be a strong anisotropy [10]), for SMAs the values of A reach often above 10, or even higher ( A 25 was reported for Co-Ni-Al single crystals in [11], and up to A 35 can be reached for Ni-Fe-Ga-based ferromagnetic SMAs [12]). This extremely strong anisotropy puts some specific requirements on the experimental methods that are used for the determination of the elastic coefficients. Traditionally, two concurrent ultrasonic methods are used for this purpose: the time-of-flight method (TOF, using either through-transmission or pulse-echo arrangements, e.g., [13]) and the resonant ultrasound spectroscopy (RUS [14,15]). In the TOF-based measurements, the elastic constant is determined from a velocity of bulk acoustic waves propagating in a given direction of the material; in particular, the elastic constant c can be calculated from the velocity v of the [ 1 1 ¯ 0 ] polarized (i.e., the slowest) shear wave propagating in the [ 1 1 0 ] direction, as
c = ρ ( v ) 2 ,
where ρ is the mass density. The TOF-based measurements are typically performed while using an ultrasonic transducer directly contacted to one face of the sample. The transducer emits planar waves propagating in direction perpendicular to the face, which are then recorded at either the opposite face (the through-transmission arrangement) while using another transducer, or by the same transducer after reflecting from the opposite face (the pulse-echo arrangement). However, the TOF-based measurements can be also performed while using contact-less methods, such as electromagnetic-acoustic transducers (EMAT, [16]), as utilized e.g., for the TOF-based characterization of the elastic softening of the Ni-Mn-Ga SMA by Vasil’ev et al. [17].
In the RUS method, the elastic constants are determined from the resonant frequencies of free elastic vibrations of a small (typically parallelepiped-shaped) sample. Because the relation between the resonant frequency and the elastic constants cannot be explicitly expressed by any formula similar to (3), a numerical simulation of the vibrations is needed, and the elastic constants are, using this simulation, obtained as a result of an inverse problem solution, i.e., by minimizing the misfit between the measured resonant frequencies and those calculated for iteratively improved guesses of elastic constants. The number of resonant frequencies utilized for the inverse procedure may vary from less than ten to nearly one hundred, depending on the vibration damping in the given material; hence, in principle, a more complex information on the elasticity of the material can be obtained by a single measurement than from the TOF-based approaches.
Both of these methods have their advantages and disadvantages and they can be shown to complement each other [18,19]. Nevertheless, for determination of c for strongly anisotropic cubic materials, which is the most important task for SMA single crystals, the RUS approach appears to be the more suitable one. The main reason is that the TOF-based approaches are very sensitive to the exact knowledge of the orientation of the crystal that was used for the measurements. In Figure 1, this sensitivity is illustrated using a simple numerical simulation: we assumed a rectangular single crystal of dimensions 3 × 3.5 × 4 mm 3 suitable for TOF measurements of v , i.e., with one edge oriented along the [ 1 1 0 ] direction. For such a crystal, the error in c calculated via eqrefcprimev when the crystal was slightly misoriented by some angle ψ was calculated. The calculation was done using Christoffel’s equation for wave propagation in a general direction of an anisotropic material [9], and assuming that c 11 and c 44 were known and fixed (the values c 11 = 140 GPa and c 44 = 60 GPa were taken for the simulation). Figure 1a presents the result. For as low misorentation as ψ 2 , an up to 10% error can arise for strong anisotropy, while for ψ 5 the error goes already above 50%. Notice that the misorientation of the direction along which the measured ultrasonic waves propagate may originate not only from an imprecise crystal cutting or the experimental error of the Laue/EBSD characterization techniques. The [ 1 1 0 ] direction in cubic materials with A > 1 is energetically shaded for [ 1 1 ¯ 0 ] -polarized shear waves [20], i.e., the energy of waves propagating in the material tend to be driven away from this direction, unless a perfectly planar, spatially infinite source of waves is considered. Hence, for ultrasonic probes with a finite aperture (i.e., an aperture comparable to the propagation distance), the detected waves with the highest amplitude can correspond to slightly inclined propagation directions.
Figure 1b shows a similar simulation for RUS, assuming that the c coefficient was determined from the lowest resonant mode of the sample (it was checked that involving up to 10 resonant modes in the simulation leads to very similar results). The inverse calculation of the elastic constant from the resonant frequency was done while using the Ritz–Rayleigh method-based approach described in [21]. Here, the highest error in c is obtained for relatively small anisotropy factors ( A 3 ) and high misorientation angles, but it never exceeds 5%. However, for very strong anisotropy, the error stays below 1%, even for significant misorientations. The reason is that the lowest resonant modes used in RUS are always those that are related to the softest shears of the lattice, i.e., for A these modes are always purely 1 1 0 { 1 1 ¯ 0 } shearing modes, regardless of the exact orientation of the sample. For moderate anisotropy factors, the lowest modes are still also somehow affected by the c 44 shear coefficient, and the partitioning between the effects of c and c 44 coefficients changes with the misorientation. Hence, the RUS measurement for an incorrectly oriented single crystal with A 3 may result in obtaining a mixture of c and c 44 instead of pure c .
Besides this genuine insensitivity to the sample misorientation, the RUS method possesses several additional features that predetermine it for the characterization of SMAs. When using lasers for both generation and detection of the vibrations [21,22,23], the sample can be kept in exactly stress-free conditions (no clamping force from the ultrasonic transducers) and, thus, the observed thermally induced transitions are not biased by a presence of any mechanical loads. Furthermore, the laser-based arrangement allows for the sample to be put into a temperature chamber, which increases the accuracy of the temperature control and allows the measurements to be performed in a broader range of temperatures. The contact-less arrangement also enables an accurate assessment of the internal friction parameters from the RUS measurements [24,25], where the internal friction Q 1 can be directly determined from the widths of the resonant peaks (see Section 2). This is the parameter only hardly accessible by the TOF-based methods. Finally, the RUS measurements allow, in principle, also the harder shear elastic constant ( c 44 ) to be determined from the same measurement, assuming that a sufficient number of resonant frequencies is involved in the analysis and/or that the anisotropy factor is not extremely high.
In this paper, we show several examples of laser-based RUS measurements on SMA single crystals near the martensitic transformation, exploiting the above-listed advantages. For a Cu-Al-Ni single crystal, we utilize the ability of RUS to determine accurately the c coefficient in a narrow temperature interval close to the transition temperature and discuss the correlation between the elastic softening and the internal friction; for Ni-Mn-Ga single crystals with two different chemical compositions, we show the advantage of high-temperature RUS measurements for materials with extremely strong anisotropy, and finally for a Ni-Ti single crystal we demonstrate the ability of RUS to simultaneously monitor the evolutions of c and c 44 .

2. Materials and Methods

Four single crystals of different SMAs were used for the study. All of the samples were rectangular bars with one face mirror-polished to enable laser based detection of the vibrations; for all samples, the crystallographic orientations of the individual faces were determined by Laue method and the mass density was determined by Archimedes method. The transition temperatures were either determined by differential scanning calorimetry (samples Nos. 1, 2, and 4), or estimated directly from the changes of the elastic constants (sample No.3). Hereafter, we will use the common notation of the transition temperatures, with A S standing for the austenite start temperature, A F for the austenite finish temperature, and similarly for martensite ( M S and M F ) and the R-phase in NiTi ( R S , R F ); these temperatures for all samples are summarized in Table 1, where the chemical compositions of the individual samples are also listed. The samples were:
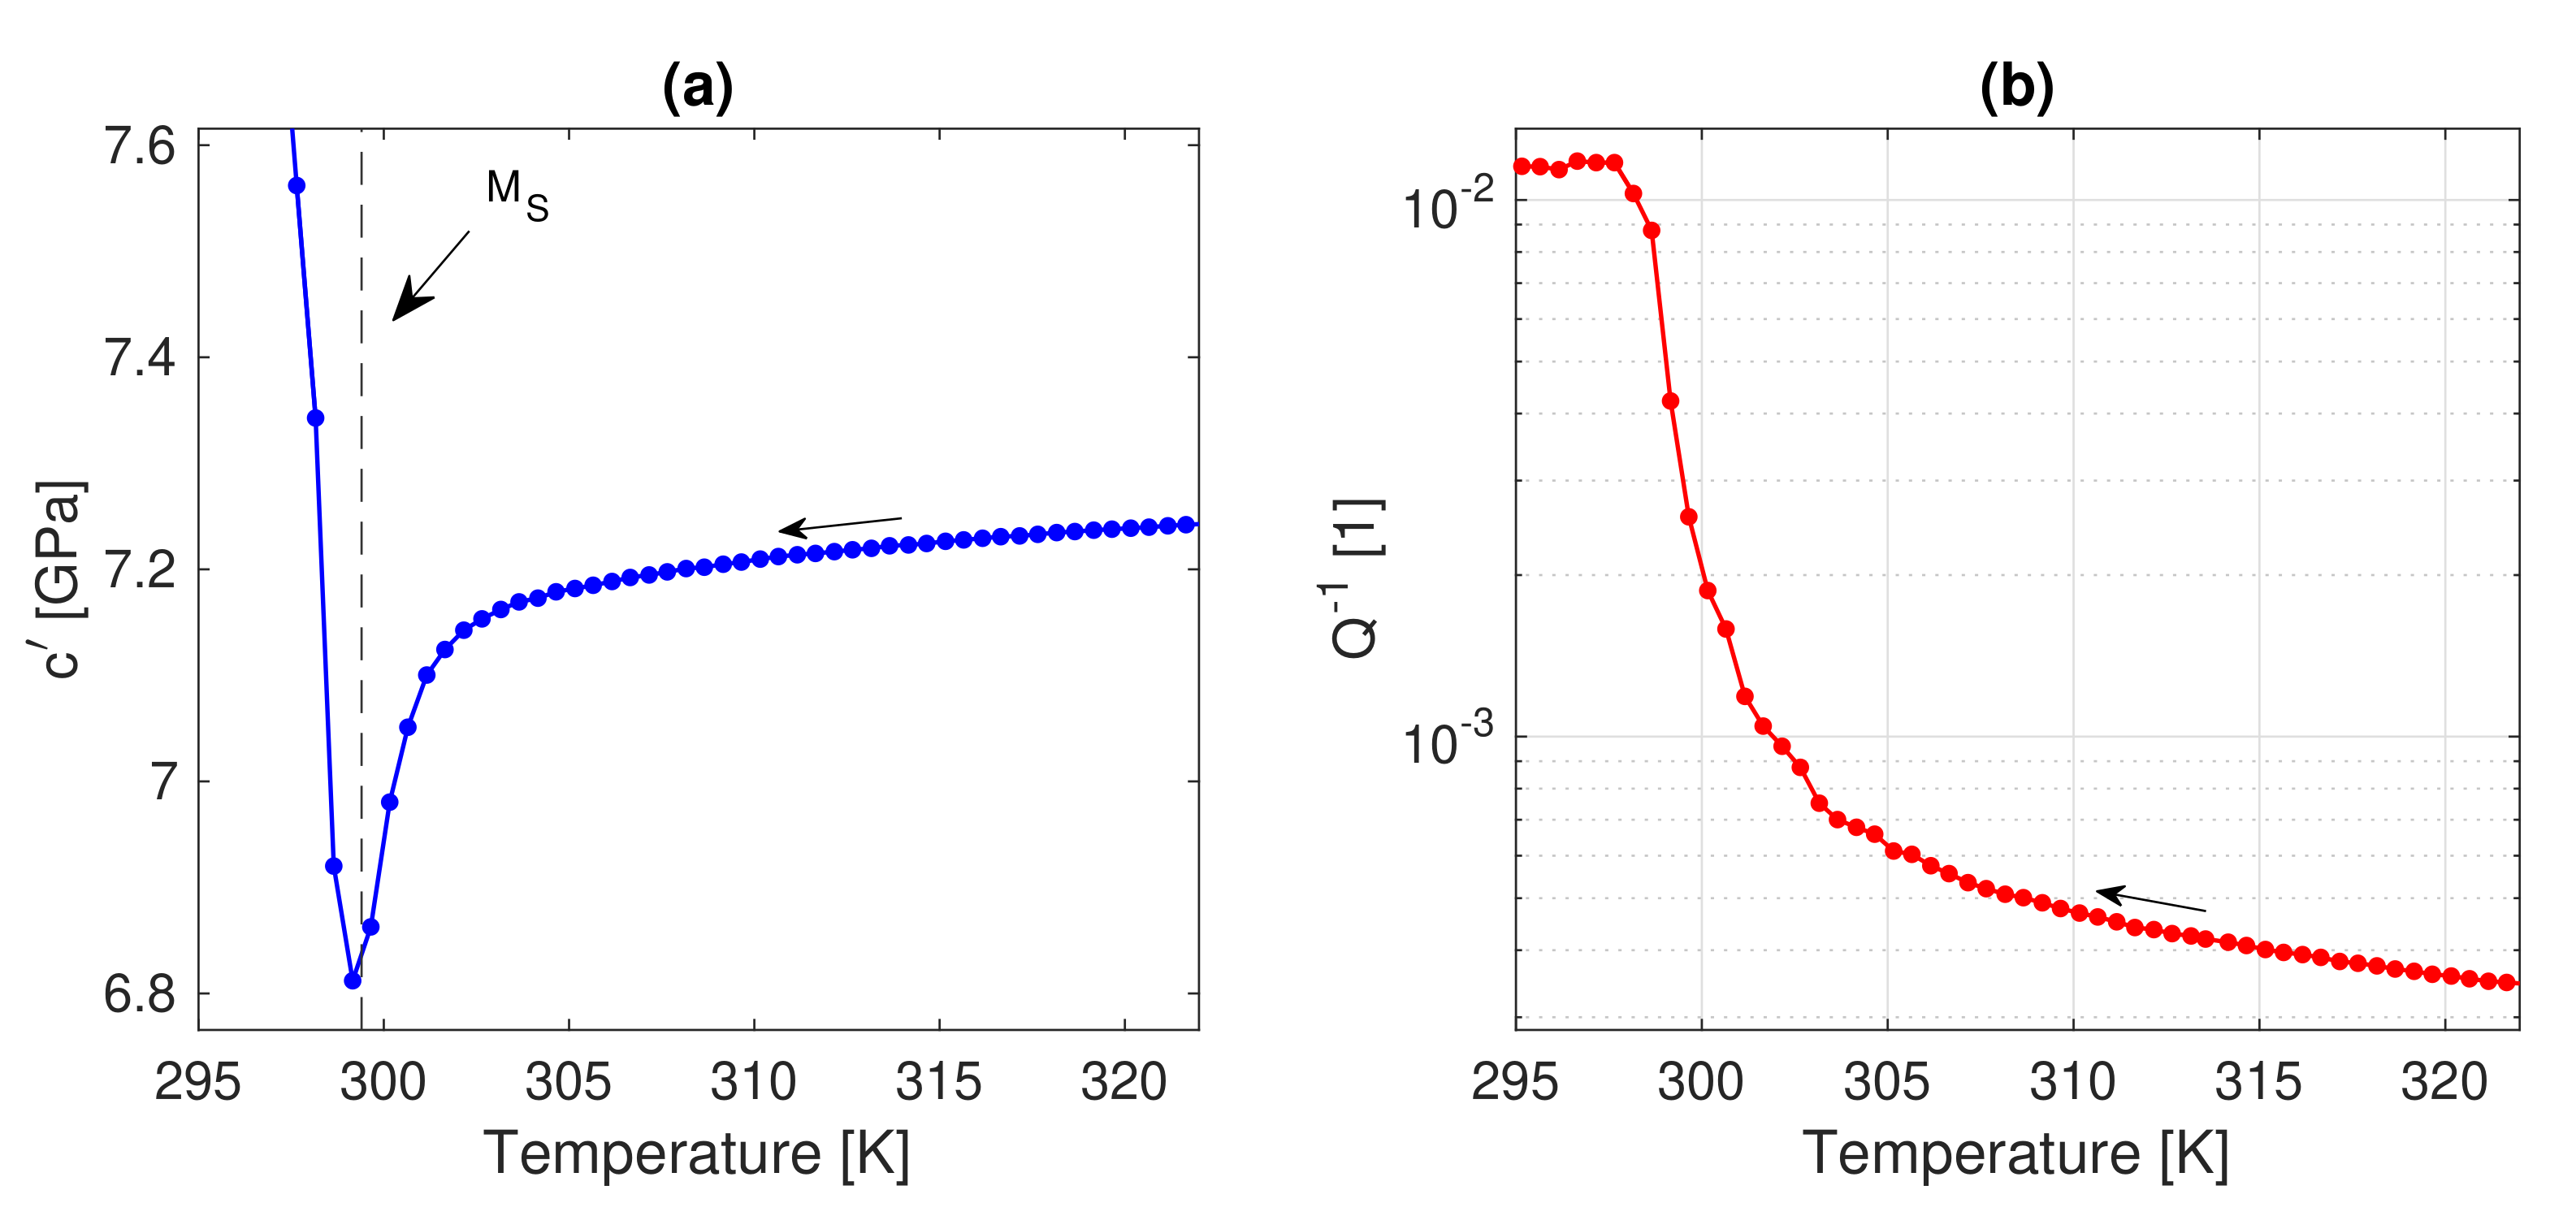
  • a Cu-Al-Ni single crystal (sample dimensions in austenite 3.05 × 2.03 × 1.29 mm 3 , sample orientation in austenite approximately [ 1 1 0 ] [ 1 1 ¯ 0 ] [ 0 0 1 ] , mass density 6.78 g·cm 3 ). This sample was characterized with cooling from 330 K towards the martensite start temperature ( M S , 299 K). To discern sufficient details of the behavior near the transition temperature, the measurement was done with a 0.5 K step (temperature control ±0.01 K) and the internal friction parameter Q 1 was evaluated at each temperature. Six lowest resonant modes were used for the determination of c and the analysis of the internal friction;
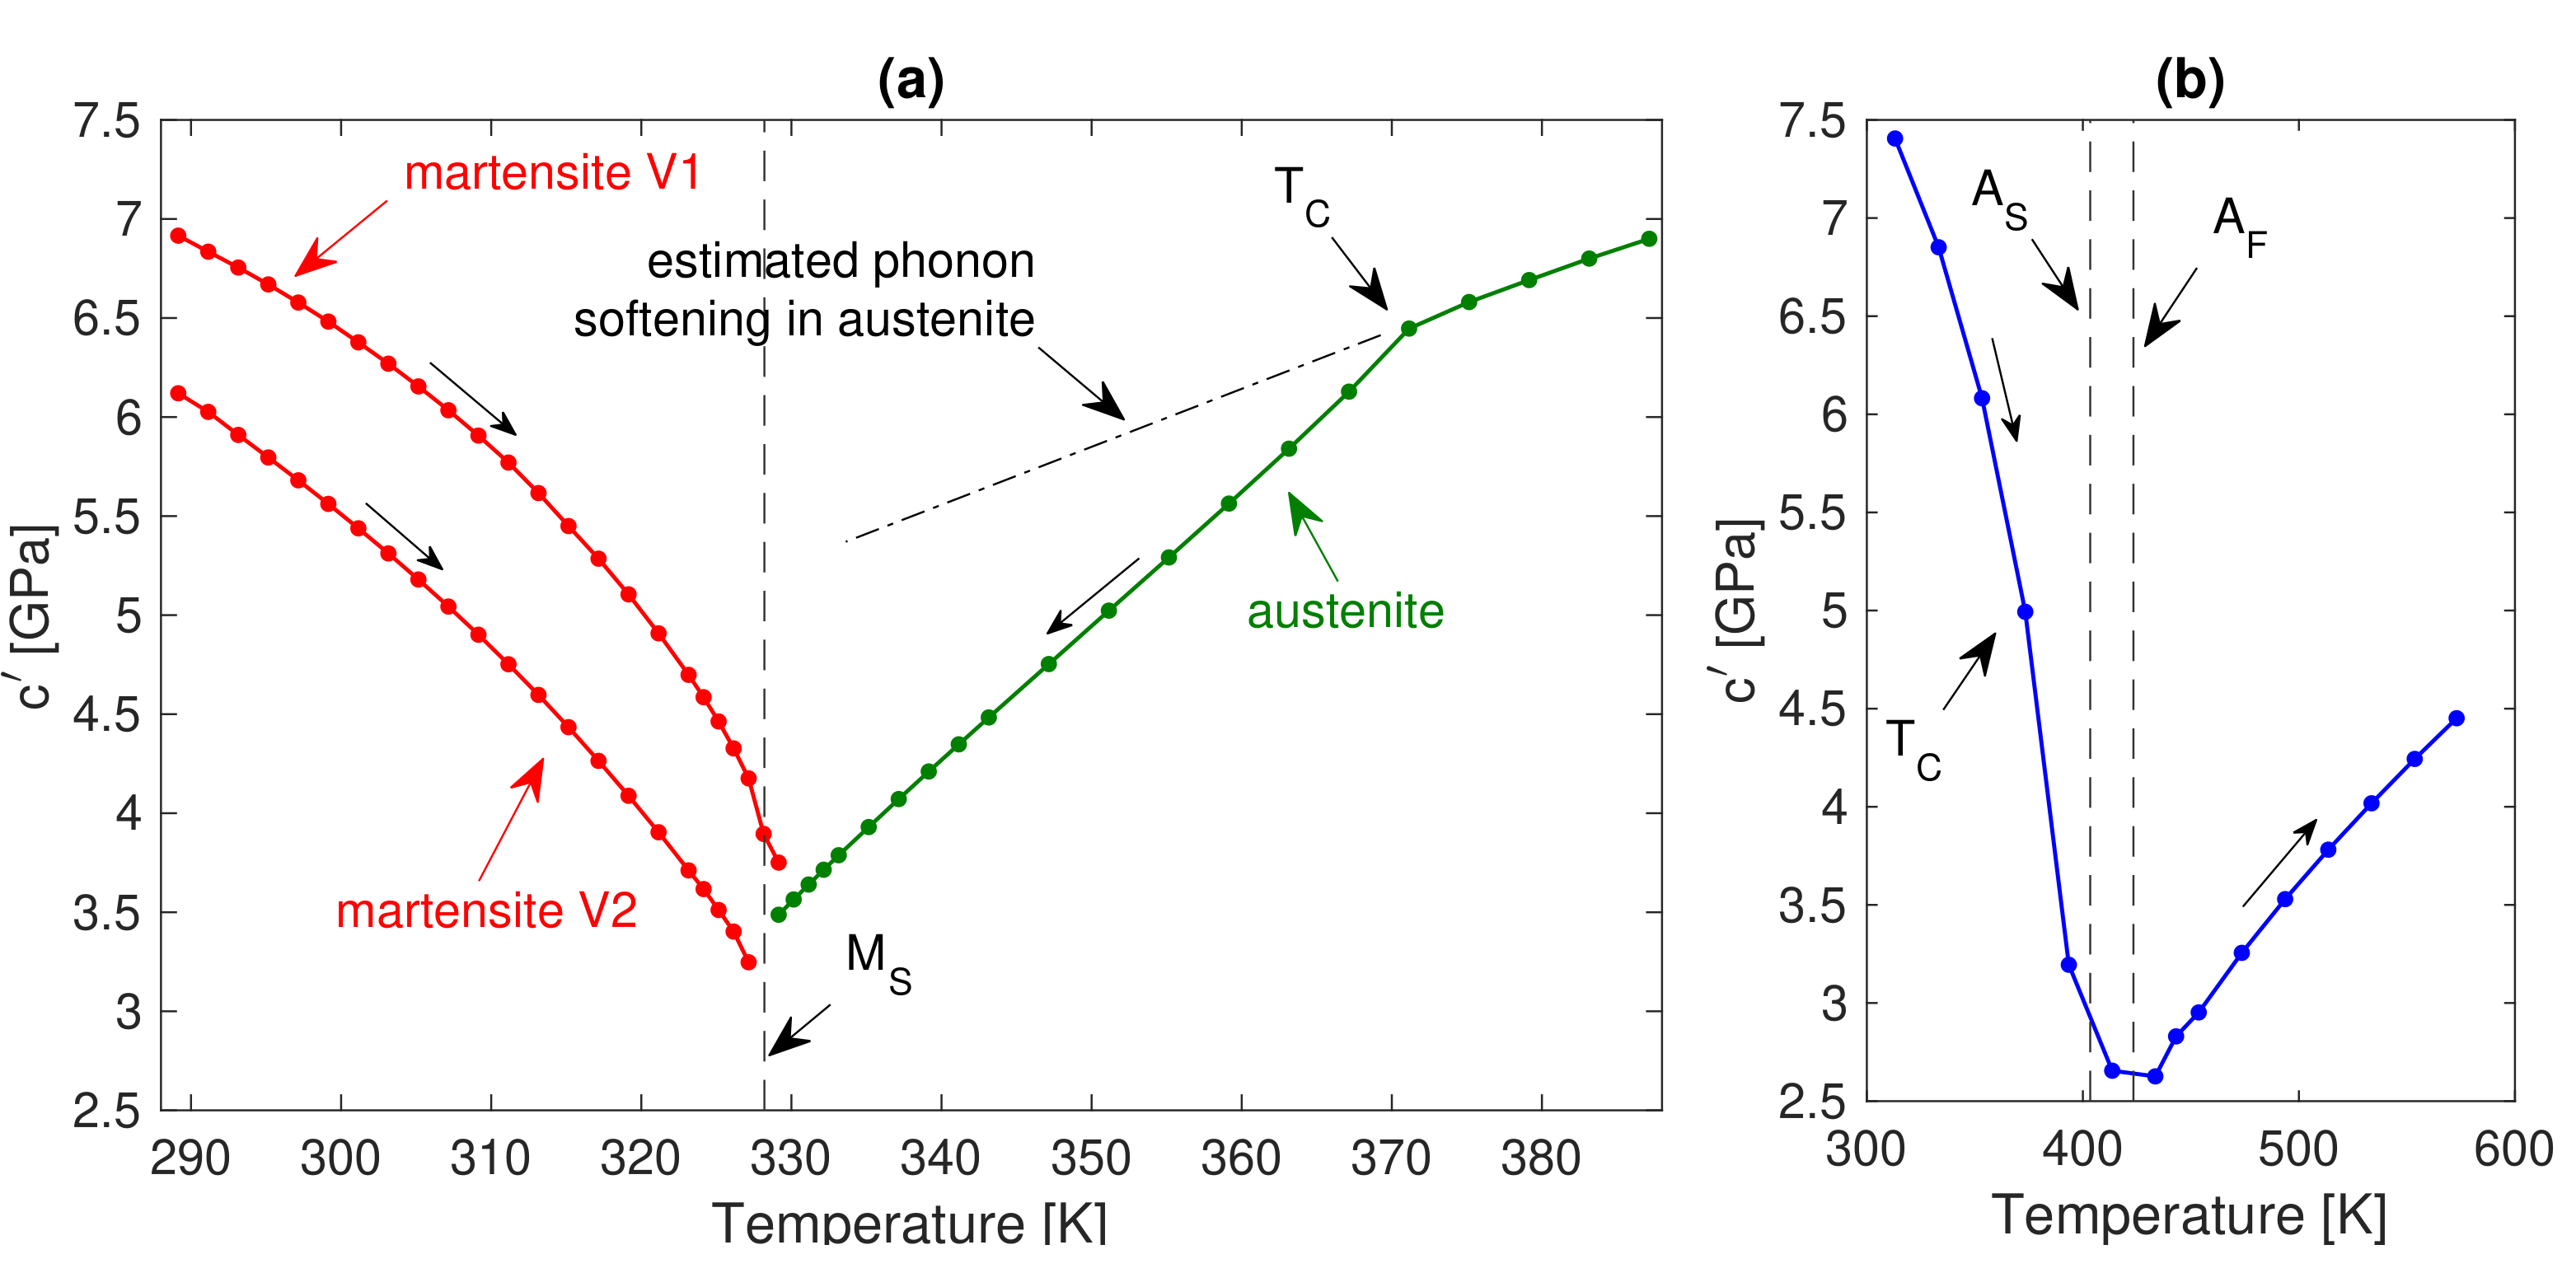
  • a Ni-Mn-Ga single crystal (sample dimensions in austenite 3.41 × 2.80 × 0.92 mm 3 at 335 K, sample orientation in austenite approximately [ 1 0 0 ] [ 0 1 0 ] [ 0 0 1 ] , mass density 8.12 g·cm 3 ). This sample was characterized with cooling from above the Curie temperature ( T C , 372 K) towards M S = 328 K, where the sample transformed into 10 M modulated martensite [26] (a thermally induced mixture of variants). Afterwards, an external magnetic field was used for martensite reorientation [27,28], and the sample was set in a single (tetragonal) variant state with the c axis that was oriented along the shortest edge. Note that the 10 M martensite is slightly monoclinic, so this state was still a mixture of monoclinic variants sharing a common c axis, but such a microstructure can be understood as a single variant in the tetragonal approximation [29]. The sample in this condition was then characterized with heating from 289 K until the sample transformed back to austenite (austenite start temperature, A S M S ). This procedure was repeated second time, with the c axis set along the longest edge of the sample. For the sample in austenite, ten lowest resonant modes were used for c determination. However, for temperatures that were below M S , the strong internal friction in 10 M martensite did not allow for reliable detection and identification of more than two or three resonant modes. This was insufficient for the reliable determination of any of the elastic coefficients of the (effectively tetragonal) mixture of monoclinic martensites. Hence, instead, we analyzed the RUS data assuming again cubic symmetry, which resulted in some effective c for the martensite. Although this effective elastic constant has no direct relation to any shearing mode of the 10 M modulated lattice, its temperature evolution provides a qualitative information on the shear instability in martensite (see e.g., [30,31] for similar approaches);
  • another Ni-Mn-Ga single crystal (dimensions in martensite 4.92 × 4.65 × 3.40 mm 3 , sample orientation approximately [ 0 0 1 ] bct [ 0 1 0 ] bct [ 1 0 0 ] bct for the dominant variant, mass density 8.12 g·cm 3 ). At the room temperature, this sample was in tetragonal non-modulated (NM) martensite phase, consisting of a mixture of all three variants with one orientation being dominant. The sample was characterized with heating from the room temperature over the reverse transition temperature A S 400 K. In this case, the A S temperature was above the Curie point (373 K), i.e., the transition occurred in the paramagnetic state. Similarly as in the case of sample No.2, an effective c coefficient was used for characterizing the shear softening in non-modulated martensite below A S ; and,
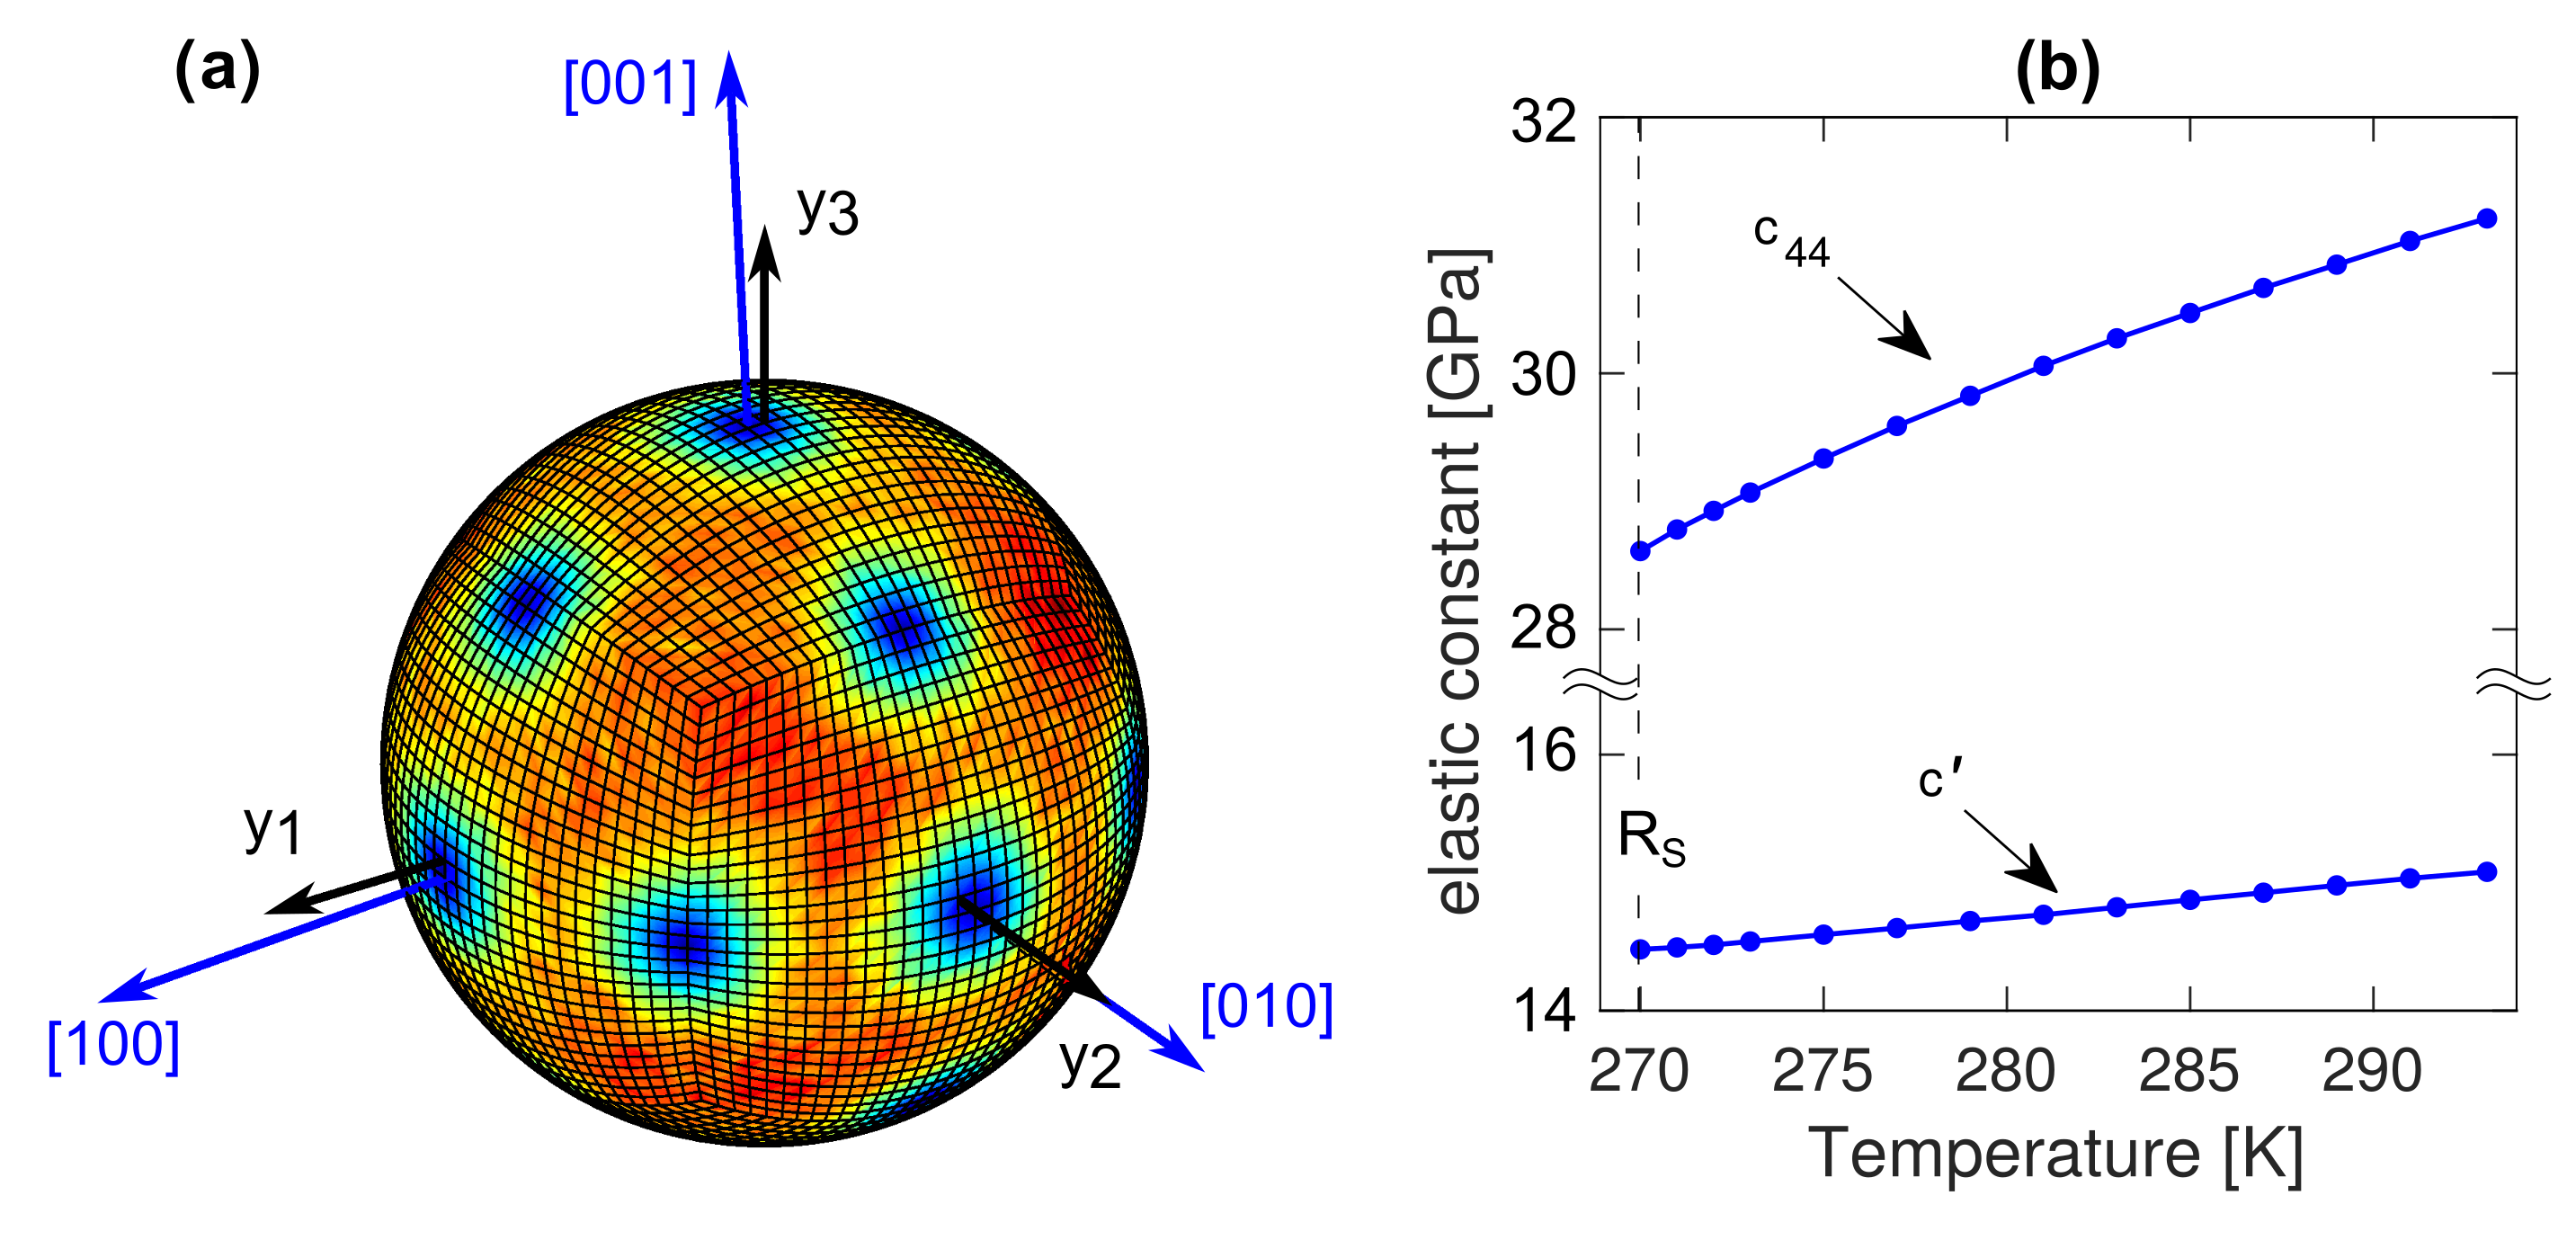
  • a Ni-Ti sample (sample dimensions in austenite 3.48 × 3.16 × 2.78 mm 3 , sample orientation in austenite approximately [ 1 0 0 ] [ 0 1 0 ] [ 0 0 1 ] , mass density 6.50 g·cm 3 ). This sample was characterized with cooling from 293 K towards the vicinity of the austenite→R-phase transition temperature R S 270 K. Twenty lowest resonant modes were traced in the measured temperature interval. Unlike samples Nos. 1, 2, and 3, the Ni-Ti sample was heterogeneous, consisting of a Ni-Ti matrix with finely dispersed precipitates. This means that the observed behavior (the elastic constants, the transformation temperatures, etc.) resulted from an interplay between the lattice (phonon mediated) instability of the matrix and the local stress fields that come from the precipitates. The discussion of such phenomena falls beyond the scope of this paper; here we will treat the measured elastic coefficients and their temperature dependencies as sufficiently representing the studied material at the macro-scale.
All of the samples were characterized using contact-less laser-based RUS arrangement described in detail in [21]. In this arrangement, the vibrations are generated by short focused laser pulses that act as broadband sources of acoustic waves; the detection is then done through a MSA-600 scanning laser vibrometer (Polytec GmbH, Waldbronn, Germany) that records the time-domain response of the sample in a pre-defined regular mesh covering the polished face of the sample. This scanning allows for the identification of modal shapes that correspond to the individual resonant peaks in the spectrum [32]. The resonant spectra were recorded in the frequency range 50 kHz–1 MHz, which typically covered up to 50 resonant modes. As only the softest shear coefficient c was to be determined for most of the materials, only 10 or less lowest modes were taken for the inverse calculation; for the calculation itself, the Ritz–Rayleigh method-based procedure described in [21] was utilized. For the Ni-Ti sample (No.4), where the RUS data were also used for verifying the crystallographic orientation of the sample (see Section 3.3 for more details), an additional measurement in a frequency range up to 3 MHz was done. This enabled more than 120 resonant modes to be reliably identified and involved in the inverse calculation.
The internal friction parameters Q 1 were determined for the Cu-Al-Ni sample (No.1) from six dominant resonant peaks in each spectrum, as
Q 1 = FWHM / f ,
where f is the resonant frequency and FWHM stands for ’full width at half-maximum’ for the given peak. For a reliable estimation of FWHM s, the peaks were fitted by a Lorenzian mask. For simplicity, we assumed that a single Q 1 parameter fully represents the viscoelastic behavior of the material. As all of the analyzed modes for the Cu-Al-Ni single crystal were the lowest modes corresponding only to the c -shearing, this assumption was fully justified; this was also verified by the fact that the Q 1 parameters at given temperature were always very similar for all six analyzed modes. However, in more general cases, different straining modes of the material may correspond to different Q 1 parameters, and the anisotropy of the internal friction must be taken into account [25].

3. Results and Discussion

3.1. Cu-Al-Ni

For Cu-Al-Ni, the main aim was to analyze the behavior in the nearest vicinity of the transition temperature. The previous studies on this alloy [33,34,35] confirmed a gradual decrease of c towards M S , but it did not reveal any acceleration of the softening closer to the transition temperature. Also, the internal friction analysis reported by Sugimoto et al. [36] did not indicate any increase of the Q 1 parameter prior to the transition, while a steep increase in this parameter was observer below M S . However, the loss of stability of the austenite lattice that triggers the martensitic transition should be visible as both an accelerated decrease of c and an increase in the internal friction, both preceding the transition itself. This suggest that the experimental methods that were used in [33,34,35,36] did not have sufficient accuracy or sufficiently precise temperature control to capture these phenomena.
The laser-based RUS measurements can fulfill such a task very well, as shown in Figure 2. For the c -softening (Figure 2a), a steep acceleration is observed below 302 K, i.e., just 3 K above the transformation temperature. This acceleration is accompanied by a rapid growth of the internal friction (Figure 2b), which increases by more than an order of magnitude.
Below M S , the material becomes a mixture of an austenitic matrix with nuclei of orthorhombic (2H) martensite. For small volume fractions of martensite, the mixture is still approximately cubic, but the effective c for this mixture steeply increases due to the growth of the elastically stiffer martensite phase (see [37] for elastic constants of both phases). Surprisingly, the internal friction remained approximately constant, as it was probably mainly affected by the presence of the nuclei, not their volume fraction. Below 295 K, the material became so heterogeneous that the spectra were impossible to process. As the transition temperature interval for the Cu-Al-Ni alloy is relatively broad, M S M F 15 K [38,39], the RUS measurement between 295 K and M S = 299 K covered only the very beginning of the formation of the thermally induced martensitic microstructure.

3.2. Ni-Mn-Ga

For the Ni-Mn-Ga alloy, the main aim was to compare the phonon-induced softening towards the transition temperature for paramagnetic and ferromagnetic austenite and martensite, and to discuss the effect of the ferromagnetic ordering on the softening. For this reason, two different alloys were measured (sample No.2 and sample No.3), one having the transition temperature below the ferromagnetic transition temperature (the Curie point) and one above it.
Figure 3a summarizes the results for sample No.2. For the austenite phase, a pronounced change of the d c / d T slope occurs at the Curie point. As discussed in [40,41], this change is caused by the magneto-elastic coupling, which effectively softens the austenite lattice. In other words, below T C the softening of the austenite phase can be decomposed into two parts: the first is ascribed to the TA 2 phonon-induced softening and retains approximately the same d c / d T slope as above the Curie point (the dash-dot line in Figure 3a), and the second to the magneto-elastic coupling. As shown in [41], when the measurements are done in an external magnetic field, only the phonon-induced softening appears, and it accelerates very close to the transitions temperature in a similar manner as for Cu-Al-Ni discussed in the previous section (but the accelerated softening in Ni-Mn-Ga austenite that is reported in [41] is significantly stronger). However, here no such acceleration can be seen, most probably because such finer effects are completely overridden by the strong magneto-elastic softening.
Below M S , the measurements were done for two different tetragonal variants of martensite (in Figure 3a we use the denotation V1 for the variant having the c axis oriented along the shortest edge of the sample and V2 for the variant having the c axis oriented along the longest edge). Each of these variants had a slightly different effective c ; however, as seen in Figure 3a, the evolution of these c -s with temperature was nearly identical. In both cases, a steep and further accelerated softening was observed towards the transition temperature. The variant V1 was slightly more stable, i.e., the reverse transition for it was started at a slightly higher temperature than for V2; nevertheless, the results confirmed that the temperature hysteresis for Ni-Mn-Ga is very small ( 2 K) and the magnetically induced orientation did not lead to any significant mechanical stabilization of martensite (cf. [39]).
The measurement was repeated for a sample No.3 in order to observe the behavior of the soft shearing modes near the transition temperature without the magneto-elastic effects. This sample has a higher manganese content, which shifts the transition temperature above the Curie point. Moreover, this sample was in the non-modulated (NM) martensite at the room temperature, not in the 10 M modulated phase, due to the manganese excess. The Ni-Mn-Ga NM martensite cannot be reoriented by external magnetic field and, owing to its tetragonal distortion with c / a > 1 , also the mechanical reorientation into a single variant would require loading the sample in tension [42]. As the tensile loading is nearly impossible for a sample of shape and dimensions suitable for RUS, the sample had to be measured in the as-received state consisting of a mixture of tetragonal variants. (Notice that the field-induced reorientation of NM martensite is not possible for pure Ni-Mn-Ga, but it can be achieved for Ni-Mn-Ga-based alloys doped by small amounts of Cu and Co [43], where the doping leads to changes in the soft shearing modes of the NM lattice [44].)
The sample was measured up to 573 K with a temperature step of 20 K (the longer step was chosen to avoid overly long exposure of the material to high temperatures, which might lead to undesired annealing processes). The result is seen in Figure 3b. Similarly as for the 10 M martensite, the NM martensite exhibits steep and accelerating softening with heating. The d c / d T slope does not exhibit any sharp change at the Curie point, which is in good agreement with the fact that magneto-elastic coupling in NM martensite is negligible [45].
With further heating, the slope changes its sign approximately between 400 K and 420 K, which corresponds to the A S and A F temperatures, respectively. The temperature hysteresis for the NM martensite is much broader than for the 10 M martensite. This is probably the consequence of a larger strain misfit between austenite and NM martensite (i.e., λ 2 is much closer to 1 for the 10 M martensite, see [46,47] for the discussion of the relation between λ 2 and the hysteresis), and also of the much higher twinning stress in NM martensite.
In the austenite phase, which means above A F , the shear softening is clearly visible, with some slight but visible acceleration towards the transition temperature. Interestingly, the c that is close to the transition temperature reaches significantly lower values than for the sample No.2., where the softening includes both the phonon contribution and the contribution from the magneto-elastic coupling. This may mean that the paramagnetic austenite is even more prone to instability than the ferromagnetic austenite. Assuming that the c 44 coefficient of Ni-Mn-Ga austenite only slightly decreases with temperature, reaching some c 44 100 GPa at 420 K (estimated from the extrapolation of its room-temperature linear trend published in [48]), the anisotropy factor for sample No.3 at A F can be estimated as A 38 , which is one of the highest values ever reported.
Finally, let us notice that the RUS analysis of the high-temperature spectra for this sample can be somehow affected by the uncertainty in the sample dimensions and the sample orientation in austenite. Both of these parameters were estimated from the dimensions and orientations of NM martensite, assuming the Bain path distortion with the tetragonal ratio c / a = 1.21 and approximate volume fractions of the minor variants. However, due to the strong anisotropy, the error in the orientation should not play any significant role (see the analysis in the Introduction), and the error due to the shape change should not exceed the level of the maximal possible error in the dimensions, which is c / a 1 = 0.21 (an error obtained if the microstructure was completely different than that assumed). Thus, the real c value at A F falls into the range ( 2.6 ± 0.5 ) GPa, which is well below c for sample No.2. and confirms the extremely strong anisotropy.

3.3. Ni-Ti

In the case of the Ni-Ti single crystal (sample No.4), a slightly different approach had to be applied. The main reason was that the transition mechanism in NiTi was not the Bain path distortion [4] and, thus, also the basal shear constant c 44 was expected to be affected by the phonon softening [4,49,50,51,52]. In order to capture the behavior of both c and c 44 , a higher number of modes in RUS spectra had to be taken for the analysis. Furthermore, the anisotropy factor for NiTi austenite is relatively low ( A 2 , [49]). As discussed in the introduction, this means that the determined value of c might be affected by a possible misorientation of the sample. For this reason, the following strategy was adopted: prior to the temperature-resolved measurement, the room temperature RUS data were thoroughly processed, assuming a general triclinic elastic anisotropy. The room-temperature RUS measurement was also complemented by TOF measurements in directions perpendicular to the individual faces of the sample. Using a combination of the RUS and TOF data, a full tensor including all 21 independent elastic coefficients was obtained, and the mirror-symmetry planes for this tensor were sought using the numerical procedure that was described in [21].
This analysis confirmed the cubic anisotropy of the sample, as nine distinct symmetry planes were found corresponding to all possible { 1 0 0 } and { 1 1 0 } planes. Additionally, a slight misorientation of the principal directions from the orientations of the edges was revealed, as shown in Figure 4a. The determined misorientaion was 3 , which is at the resolution limit of the Laue method. The spectra from the temperature measurements were then processed using this refined orientation of the sample, which resulted in the c ( T ) and c 44 ( T ) dependences plotted in Figure 4b. As expected based on the results from [49] (see also [50,51,52]), both of the constants exhibit softening towards the R-phase start ( R S ) temperature. The softening of c 44 is stronger and, unlike for c , exhibits slight acceleration towards the transition temperature. Nevertheless, no localized strong acceleration in the nearest vicinity of the transition temperature is measured (cf. Figure 2), although the temperature step above the transition temperature was relatively small (1 K). This can be due to the character of the R-phase transition, which is rather gradual and it has some second order-like features [53]. This behavior of the elastic constants is also in good agreement with the results for the aged Ni 51 Ti 49 and Ni 50.8 Ti 49 , as reported in [49].
Thanks to the exactly known orientation of the sample, the elastic constants c and c 44 were obtained with very high accuracy. For all resonant modes involved in the inverse calculation, the experimental resonant frequencies differed from those that were computed from the resulting elastic constants by less then 0.25 kHz. Based on the sensitivity analysis described in [21], we can estimate that such a perfect match between the frequencies translates to a less than ± 0.1 GPa experimental uncertainty in c and c 44 . At the same time, however, the used RUS data did not allow for an accurate determination of c 11 evolution with temperature. In other words, despite the higher number of modes and perfectly known orientation, the information that was carried by the RUS data was still dominantly on the shear elastic coefficients. Complementary temperature-resolved TOF measurements would be necessary for capturing the behavior of the whole cubic tensor.

4. Conclusions

Using three typical examples of SMAs (Cu-Al-Ni, Ni-Mn-Ga and Ni-Ti), we demonstrated that the laser-based RUS is a very suitable tool for the characterization of elastic precursors of martensitic transitions. The high accuracy and good temperature control allowed for a detailed examination of the behavior very close to the transition temperature, including the internal friction analysis. The access to high-temperature measurements due to the contactless character of the laser-based arrangement was shown to be beneficial for ferromagnetic SMAs, where the phonon-mediated softening had to be analyzed above the Curie point. Finally, we showed that the RUS data contained a sufficient information for a full characterization of an material with a moderate anisotropy factor. This was be initially utilized for improving the accuracy in the sample orientation, and then for the accurate determination of the evolutions of both c and c 44 .

Author Contributions

Conceptualization, H.S. and P.S.; investigation, M.J. and L.B.; resources, O.H.; data curation, M.J. and P.S.; writing–original draft preparation, H.S. and O.H.; writing–review and editing, O.H. All authors have read and agreed to the published version of the manuscript.

Funding

This work was supported by Czech Science Foundation, project No.20-12624S. The work of H. Seiner was supported by the Centre of Excellence for Nonlinear Dynamic Behaviour of Advanced Materials in Engineering CZ.02.1.01/0.0/0.0/15_003/0000493 (Excellent Research Teams) in the framework of Operational Programme Research, Development and Education. The work of O. Heczko was supported by the Czech Ministry of Education, Youth and Sports through Project MATFUN – CZ.02.1.01/0.0/0.0/15_003/0000487.

Conflicts of Interest

The authors declare no conflict of interest.

References

  1. Delaey, L. Diffusionless transformations. In Phase Transformations in Materials; Kostorz, G., Ed.; Wiley-VCH: Weinheim, Germany, 2001; pp. 583–654. [Google Scholar]
  2. Nakanishi, N. Elastic constants as they relate to lattice properties and martensite formation. Prog. Mater. Sci. 1980, 24, 143–265. [Google Scholar] [CrossRef]
  3. Lüthi, B. Physical Acoustics in the Solid State; Springer: Berlin/Heidelberg, Germany, 2005. [Google Scholar]
  4. Otsuka, K.; Ren, X. Physical metallurgy of Ti-Ni-based shape memory alloys. Prog. Mater. Sci. 2005, 50, 511–678. [Google Scholar] [CrossRef]
  5. Chernenko, V.A.; Pons, J.; Seguí, C.; Cesari, E. Premartensitic phenomena and other phase transformations in Ni-Mn-Ga alloys studied by dynamical mechanical analysis and electron diffraction. Acta Mater. 2002, 50, 53–60. [Google Scholar] [CrossRef]
  6. Muto, S.; Oshima, R.; Fujita, F.E. Elastic softening and elastic strain energy consideration in the f.c.c.-f.c.t. transformation of FePd alloys. Acta Metall. Mater. 1990, 38, 685–694. [Google Scholar] [CrossRef]
  7. Stipcich, M.; Mañosa, L.; Planes, A.; Morin, M.; Zarestky, J.; Lograsso, T.; Stassis, C. Elastic constants of Ni-Mn-Ga magnetic shape memory alloys. Phys. Rev. B Condens. Matter Mater. Phys. 2004, 70, 054115. [Google Scholar] [CrossRef] [Green Version]
  8. Worgull, J.; Petti, E.; Trivisonno, J. Behavior of the elastic properties near an intermediate phase transition in Ni2MnGa. Phys. Rev. B Condens. Matter Mater. Phys. 1996, 54, 15695–15699. [Google Scholar] [CrossRef]
  9. Musgrave, M.J.P. Crystal Acoustics; Holden Day: San Francisco, CA, USA, 1965. [Google Scholar]
  10. Ledbetter, H.M. Sound velocities and elastic-constant averaging for polycrystalline copper. J. Phys. D Appl. Phys. 1980, 13, 1879–1884. [Google Scholar] [CrossRef]
  11. Seiner, H.; Kopeček, J.; Sedlák, P.; Bodnárová, L.; Landa, M.; Sedmák, P.; Heczko, O. Microstructure, martensitic transformation and anomalies in c′-softening in Co-Ni-Al ferromagnetic shape memory alloys. Acta Mater. 2013, 61, 5869–5876. [Google Scholar] [CrossRef]
  12. Zoubková, K. Elastic Response of Ferromagnetic Shape Memory Alloys in the Vicinity of the Critical Point. Master’s Thesis, Czech Technical University, Prague, Czech Republic, 2018. [Google Scholar]
  13. Papadakis, E.P.; Lerch, T.P. Pulse superposition, pulse-echo overlap and related techniques. In Handbook of Elastic Properties of Solids, Liquids and Gases, 1–4; Levy, M., Bass, H., Stern, R., Eds.; Academic Press: San Diego, CA, USA, 2001; pp. 39–66. [Google Scholar]
  14. Migliori, A.; Sarrao, J.L.; Visscher, W.M.; Bell, T.M.; Lei, M.; Fisk, Z.; Leisure, R.G. Resonant ultrasound spectroscopic techniques for measurement of the elastic moduli of solids. Phys. B Phys. Condens. Matter 1993, 183, 1–24. [Google Scholar] [CrossRef] [Green Version]
  15. Leisure, R.G.; Willis, F.A. Resonant ultrasound spectroscopy. J. Phys. Condens. Matter 1997, 9, 6001–6029. [Google Scholar] [CrossRef]
  16. Hirao, M.; Ogi, H. EMATs for Science and Industry: Noncontacting Ultrasonic Measurements; Kluwer Academic Publishers: London, UK, 2003. [Google Scholar]
  17. Vasil’ev, A.N.; Kokorin, V.V.; Savchenko, Y.I.; Chernenko, V.A. The magnetoelastic properties of a Ni2MnGa single crystal. Sov. Phys. JETP 1990, 71, 803–805. [Google Scholar]
  18. Landa, M.; Sedlák, P.; Seiner, H.; Heller, L.; Bicanová, L.; Šittner, P.; Novák, V. Modal resonant ultrasound spectroscopy for ferroelastics. Appl. Phys. A Mater. Sci. Process. 2009, 96, 557–567. [Google Scholar] [CrossRef]
  19. Hurley, D.H.; Reese, S.J.; Park, S.K.; Utegulov, Z.; Kennedy, J.R.; Telschow, K.L. In situ laser-based resonant ultrasound measurements of microstructure mediated mechanical property evolution. J. Appl. Phys. 2010, 107, 063510. [Google Scholar] [CrossRef] [Green Version]
  20. Wolfe, J.P. Imaging Phonons (Acoustic Wave Propagation in Solids); Cambridge University Press: Cambridge, UK, 1998. [Google Scholar]
  21. Sedlák, P.; Seiner, H.; Zídek, J.; Janovská, M.; Landa, M. Determination of All 21 Independent Elastic Coefficients of Generally Anisotropic Solids by Resonant Ultrasound Spectroscopy: Benchmark Examples. Exp. Mech. 2014, 54, 1073–1085. [Google Scholar] [CrossRef]
  22. Sato, S.; Inakagi, K.; Gusev, V.E.; Wright, O.B. Resonant ultrasound spectroscopy using optical excitation and detection. AIP Conf. Proc. 1999, 463, 424–426. [Google Scholar]
  23. Zadler, B.J.; Le Rousseau, J.H.L.; Scales, J.A.; Smith, M.L. Resonant ultrasound spectroscopy: Theory and application. Geophys. J. Int. 2004, 156, 154–169. [Google Scholar] [CrossRef]
  24. Sumino, Y.; Ohno, I.; Goto, T.; Kumazawa, M. Measurement of elastic constants and internal frictions on single-crystal mgo by rectangular parallelepiped resonance. J. Phys. Earth 1976, 24, 263–273. [Google Scholar] [CrossRef] [Green Version]
  25. Seiner, H.; Sedlák, P.; Koller, M.; Landa, M.; Ramírez, C.; Osendi, M.I.; Belmonte, M. Anisotropic elastic moduli and internal friction of graphene nanoplatelets/silicon nitride composites. Compos. Sci. Technol. 2013, 75, 93–97. [Google Scholar] [CrossRef]
  26. Straka, L.; Drahokoupil, J.; Pacherová, O.; Fabiánová, K.; Kopecký, V.; Seiner, H.; Hänninen, H.; Heczko, O. The relation between lattice parameters and very low twinning stress in Ni50Mn25+xGa25-x magnetic shape memory alloys. Smart Mater. Struct. 2016, 25, 025001. [Google Scholar] [CrossRef] [Green Version]
  27. Sozinov, A.; Likhachev, A.A.; Lanska, N.; Söderberg, O.; Ullakko, K.; Lindroos, V.K. Stress- and magnetic-field-induced variant rearrangement in Ni-Mn-Ga single crystals with seven-layered martensitic structure. Mater. Sci. Eng. A 2004, 378, 399–402. [Google Scholar] [CrossRef]
  28. Scheerbaum, N.; Heczko, O.; Liu, J.; Hinz, D.; Schultz, L.; Gutfleisch, O. Magnetic field-induced twin boundary motion in polycrystalline Ni-Mn-Ga fibres. New J. Phys. 2008, 10, 073002. [Google Scholar] [CrossRef] [Green Version]
  29. Straka, L.; Heczko, O.; Seiner, H.; Lanska, N.; Drahokoupil, J.; Soroka, A.; Fähler, S.; Hänninen, H.; Sozinov, A. Highly mobile twinned interface in 10 M modulated Ni-Mn-Ga martensite: Analysis beyond the tetragonal approximation of lattice. Acta Mater. 2011, 59, 7450–7463. [Google Scholar] [CrossRef]
  30. Zhao, P.; Dai, L.; Cullen, J.; Wuttig, M. Magnetic and elastic properties of Ni49.0Mn23.5 Ga27.5 premartensite. Metall. Mater. Trans. A Phys. Metall. Mater. Sci. 2007, 38, 745–751. [Google Scholar] [CrossRef]
  31. Dai, L.; Cui, J.; Wuttig, M. Elasticity of Austenitic and Martensitic NiMnGa. Proc. SPIE Int. Soc. Opt. Eng. 2003, 5053, 595–602. [Google Scholar]
  32. Ogi, H.; Sato, K.; Asada, T.; Hirao, M. Complete mode identification for resonance ultrasound spectroscopy. J. Acoust. Soc. Am. 2002, 112, 2553–2557. [Google Scholar] [CrossRef]
  33. Recarte, V.; Pérez-Landazábal, J.I.; Nó, M.L.; San Juan, J. Study by resonant ultrasound spectroscopy of the elastic constants of the β phase in Cu-Al-Ni shape memory alloys. Mater. Sci. Eng. A 2004, 370, 488–491. [Google Scholar] [CrossRef]
  34. Landa, M.; Sedlák, P.; Šittner, P.; Seiner, H.; Heller, L. On the evaluation of temperature dependence of elastic constants of martensitic phases in shape memory alloys from resonant ultrasound spectroscopy studies. Mater. Sci. Eng. A 2008, 481–482, 567–573. [Google Scholar] [CrossRef]
  35. Landa, M.; Sedlák, P.; Šittner, P.; Seiner, H.; Novák, V. Temperature dependence of elastic properties of cubic and orthorhombic phases in Cu-Al-Ni shape memory alloy near their stability limits. Mater. Sci. Eng. A 2007, 462, 320–324. [Google Scholar] [CrossRef]
  36. Sugimoto, K.; Mori, T.; Otsuka, K.; Shimizu, K. Simultaneous measurements of internal friction, young’s modulus and shape change associated with thermoelastic martensite transformation in CuAlNi single crystals. Scr. Metall. 1974, 8, 1341–1348. [Google Scholar] [CrossRef]
  37. Sedlák, P.; Seiner, H.; Landa, M.; Novák, V.; Šittner, P.; Mañosa, L. Elastic constants of bcc austenite and 2H orthorhombic martensite in CuAlNi shape memory alloy. Acta Mater. 2005, 53, 3643–3661. [Google Scholar] [CrossRef]
  38. Seiner, H.; Sedlak, P.; Landa, M. Shape recovery mechanism observed in single crystals of Cu-Al-Ni shape memory alloy. Phase Transitions 2008, 81, 537–551. [Google Scholar] [CrossRef]
  39. Vronka, M.; Seiner, H.; Heczko, O. Temperature dependence of twinning stress–Analogy between Cu–Ni–Al and Ni–Mn–Ga shape memory single crystals. Philos. Mag. 2017, 97, 1479–1497. [Google Scholar] [CrossRef]
  40. Seiner, H.; Heczko, O.; Sedlák, P.; Bodnárová, L.; Novotný, M.; Kopeček, J.; Landa, M. Combined effect of structural softening and magneto-elastic coupling on elastic coefficients of NiMnGa austenite. J. Alloy. Compd. 2013, 577, S131–S135. [Google Scholar] [CrossRef]
  41. Seiner, H.; Sedlák, P.; Bodnárová, L.; Drahokoupil, J.; Kopecký, V.; Kopeček, J.; Landa, M.; Heczko, O. The effect of antiphase boundaries on the elastic properties of Ni-Mn-Ga austenite and premartensite. J. Phys. Condens. Matter 2013, 25, 425402. [Google Scholar] [CrossRef] [PubMed]
  42. Söderberg, O.; Straka, L.; Novák, V.; Heczko, O.; Hannula, S.-P.; Lindroos, V.K. Tensile/compressive behaviour of non-layered tetragonal Ni52.8Mn25.7Ga21.5 alloy. Mater. Sci. Eng. A 2004, 386, 27–33. [Google Scholar] [CrossRef]
  43. Sozinov, A.; Lanska, N.; Soroka, A.; Zou, W. 12% magnetic field-induced strain in Ni-Mn-Ga-based non-modulated martensite. Appl. Phys. Lett. 2013, 102, 021902. [Google Scholar] [CrossRef]
  44. Bodnárová, L.; Zelený, M.; Sedlák, P.; Straka, L.; Heczko, O.; Sozinov, A.; Seiner, H. Switching the soft shearing mode orientation in Ni-Mn-Ga non-modulated martensite by Co and Cu doping. Smart Mater. Struct. 2020, 29, 045022. [Google Scholar] [CrossRef]
  45. Heczko, O.; Seiner, H.; Sedlák, P.; Kopeček, J.; Kopecký, V.; Landa, M. Resonant ultrasound spectroscopy—A tool to probe magneto-elastic properties of ferromagnetic shape memory alloys. Eur. Phys. J. B 2013, 86, 62. [Google Scholar] [CrossRef]
  46. James, R.D.; Zhang, Z. A Way to Search for Multiferroic Materials with “Unlikely” Combinations of Physical Properties. Springer Ser. Mater. Sci. 2005, 79, 159–175. [Google Scholar]
  47. Cui, J.; Chu, Y.S.; Famodu, O.O.; Furuya, Y.; Hattrick-Simpers, J.; James, R.D.; Ludwig, A.; Thienhaus, S.; Wuttig, M.; Zhang, Z.; et al. Combinatorial search of thermoelastic shape-memory alloys with extremely small hysteresis width. Nat. Mater. 2006, 5, 286–290. [Google Scholar] [CrossRef]
  48. Seiner, H.; Kopecký, V.; Landa, M.; Heczko, O. Elasticity and magnetism of Ni2MnGa premartensitic tweed. Phys. Status Solidi (B) Basic Res. 2014, 251, 2097–2103. [Google Scholar] [CrossRef]
  49. Ren, X.; Miura, N.; Zhang, J.; Otsuka, K.; Tanaka, K.; Koiwa, M.; Suzuki, T.; Chumlyakov, Y.I.; Asai, M. A comparative study of elastic constants of Ti-Ni based alloys prior to martensitic transformation. Mater. Sci. Eng. A 2001, 312, 196–206. [Google Scholar] [CrossRef]
  50. Brill, T.M.; Mittelbach, S.; Assmus, W.; Mullner, M.; Luthi, B. Elastic properties of NiTi. J. Phys. Condens. Matter 1991, 3, 9621–9627. [Google Scholar] [CrossRef]
  51. Mercier, O.; Melton, K.N.; Gremaud, G.; Hägi, J. Single-crystal elastic constants of the equiatomic NiTi alloy near the martensitic transformation. J. Appl. Phys. 1980, 51, 1833–1834. [Google Scholar] [CrossRef]
  52. Ren, X.; Otsuka, K. The role of softening in elastic constant c44 in martensitic transformation. Scr. Mater. 1998, 38, 1669–1675. [Google Scholar] [CrossRef]
  53. Šittner, P.; Landa, M.; Lukáš, P.; Novák, V. R-phase transformation phenomena in thermomechanically loaded NiTi polycrystals. Mech. Mater. 2006, 38, 475–492. [Google Scholar] [CrossRef]
Figure 1. Simulated errors in c resulting from a small misorentation of the sample: (a) methods based on time-of-flight measurements; (b) resonant ultrasound spectroscopy. The misorientation angle ψ is defined in the sketch on the very left.
Metals 10 01383 g001
Figure 2. Evolution of the elastic constant c (a) and the internal friction parameter (b) for the CuAlNi single crystal.
Metals 10 01383 g002
Figure 3. Evolution of the elastic constant c for the Ni-Mn-Ga samples: (a) sample No.2 with the transition temperature below the Curie point T C ; (b) sample No.3 with the transition temperature above the curie point. In (a), the constants c for two tetragonal variants of martensite V1 and V2 are effective elastic constants only, obtained under the assumption that the material has a cubic symmetry (see the text for more details); the dash-dot line is the extrapolation of the behavior of austenite above the Curie point. In (b), the c below A S is again an effective parameter, representing the initial mixture of variants. Note the different temperature scales between (a,b).
Metals 10 01383 g003
Figure 4. (a) the misorientation between the sample edges ( y 1 , , 3 ) and the principal 1 0 0 directions. The map plotted on the unit sphere is a map of a function used for determination of the symmetry planes of the material for the measured 21 (triclinic) elastic constants, as introduced in [21]. In particular, the sharp minima (blue spots) correspond to directions perpendicular to the mirror planes. (b) the resulting evolution of the elastic constants.
Metals 10 01383 g004
Table 1. Chemical compositions of the studied samples and the corresponding transition temperatures determined by differential scanning calorimetry (if not stated otherwise).
Sample No.AlloyComposition (at.%) A S [K] A F [K] M S [K] M F [K] R S [K] R F [K]
1Cu-Al-Ni Cu 69.4 Al 27.2 Ni 3.4 395314299284--
2Ni-Mn-Ga Ni 50.0 Mn 28.9 Ga 21.1 328329328326--
3Ni-Mn-GaNi 50.5 Mn 30.4 Ga 19.1 400 a 420 a ----
4Ni-Timultiphase b 240286232226∼270245
a estimated from RUS measurements; b consisting of a nearly equiatomic matrix with Ti 2 Ni and TiC particles; total averaged composition Ni 48.8 Ti 51.2 (at %).
Publisher’s Note: MDPI stays neutral with regard to jurisdictional claims in published maps and institutional affiliations.

