
Granite Pluton at the Panasqueira Tungsten Deposit, Portugal: Genetic Implications as Revealed from New Geochemical Data
 ,
,
Abstract
:
1. Introduction
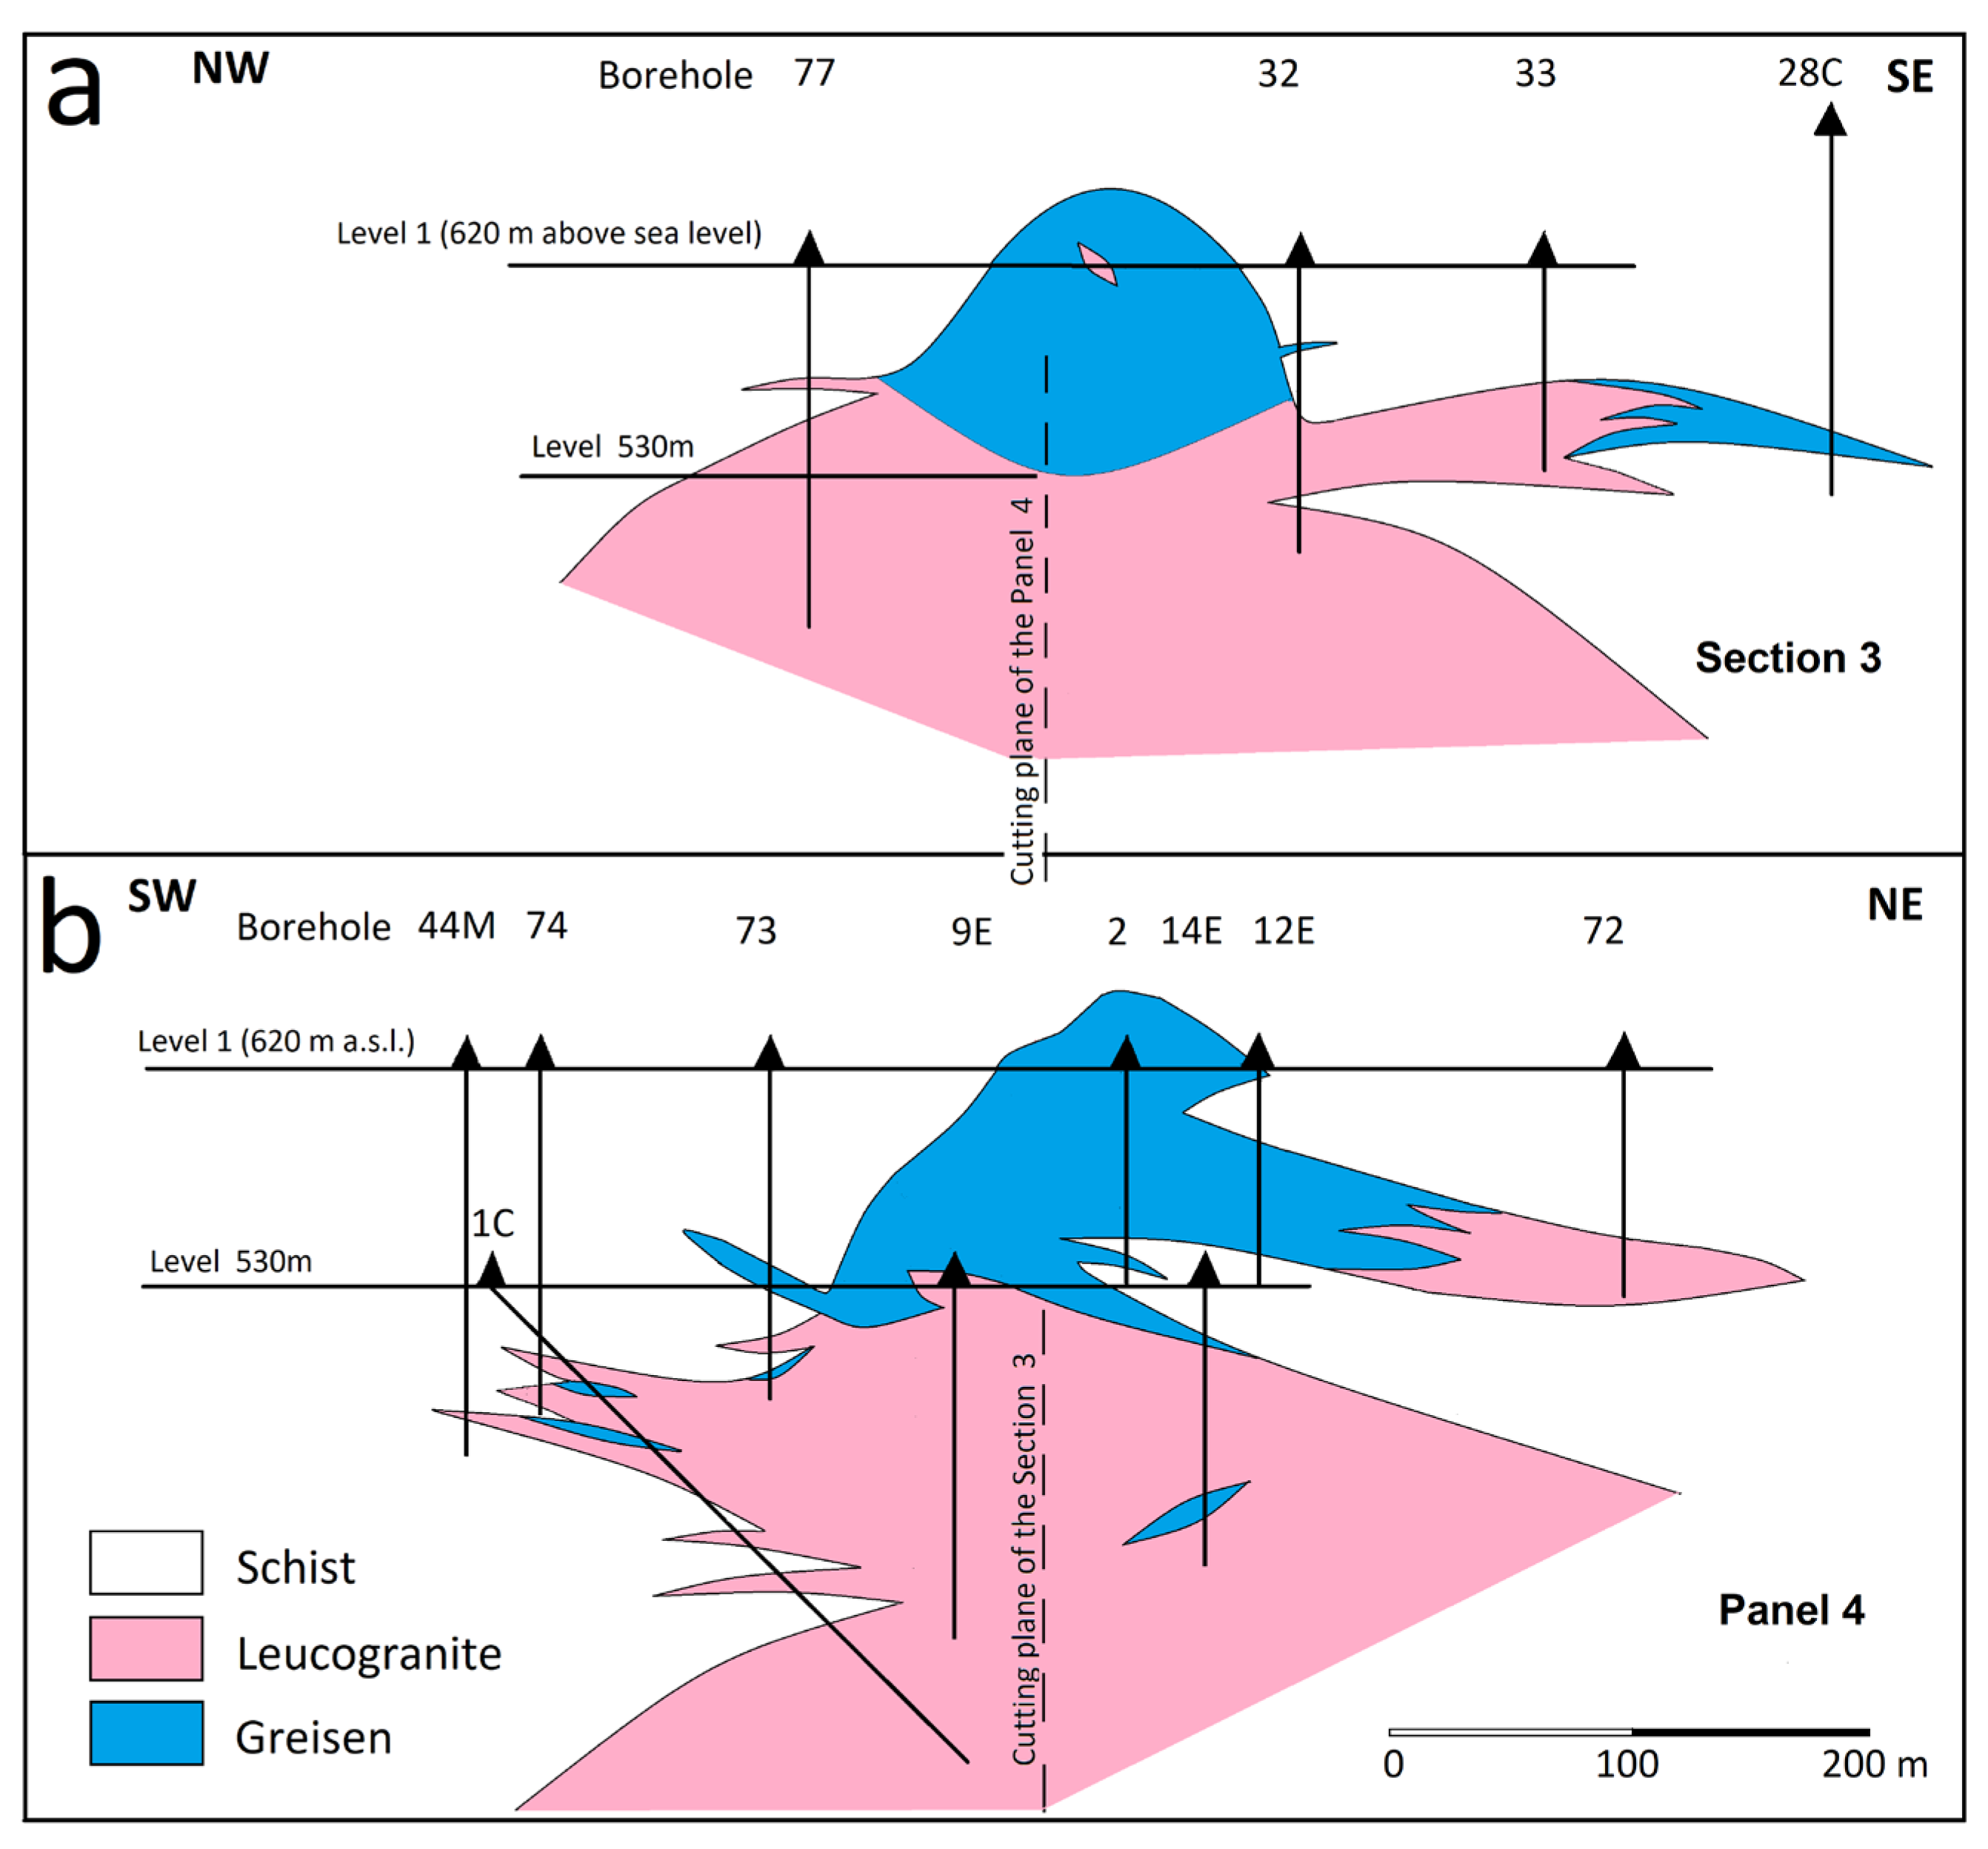
2. Geology of the Area
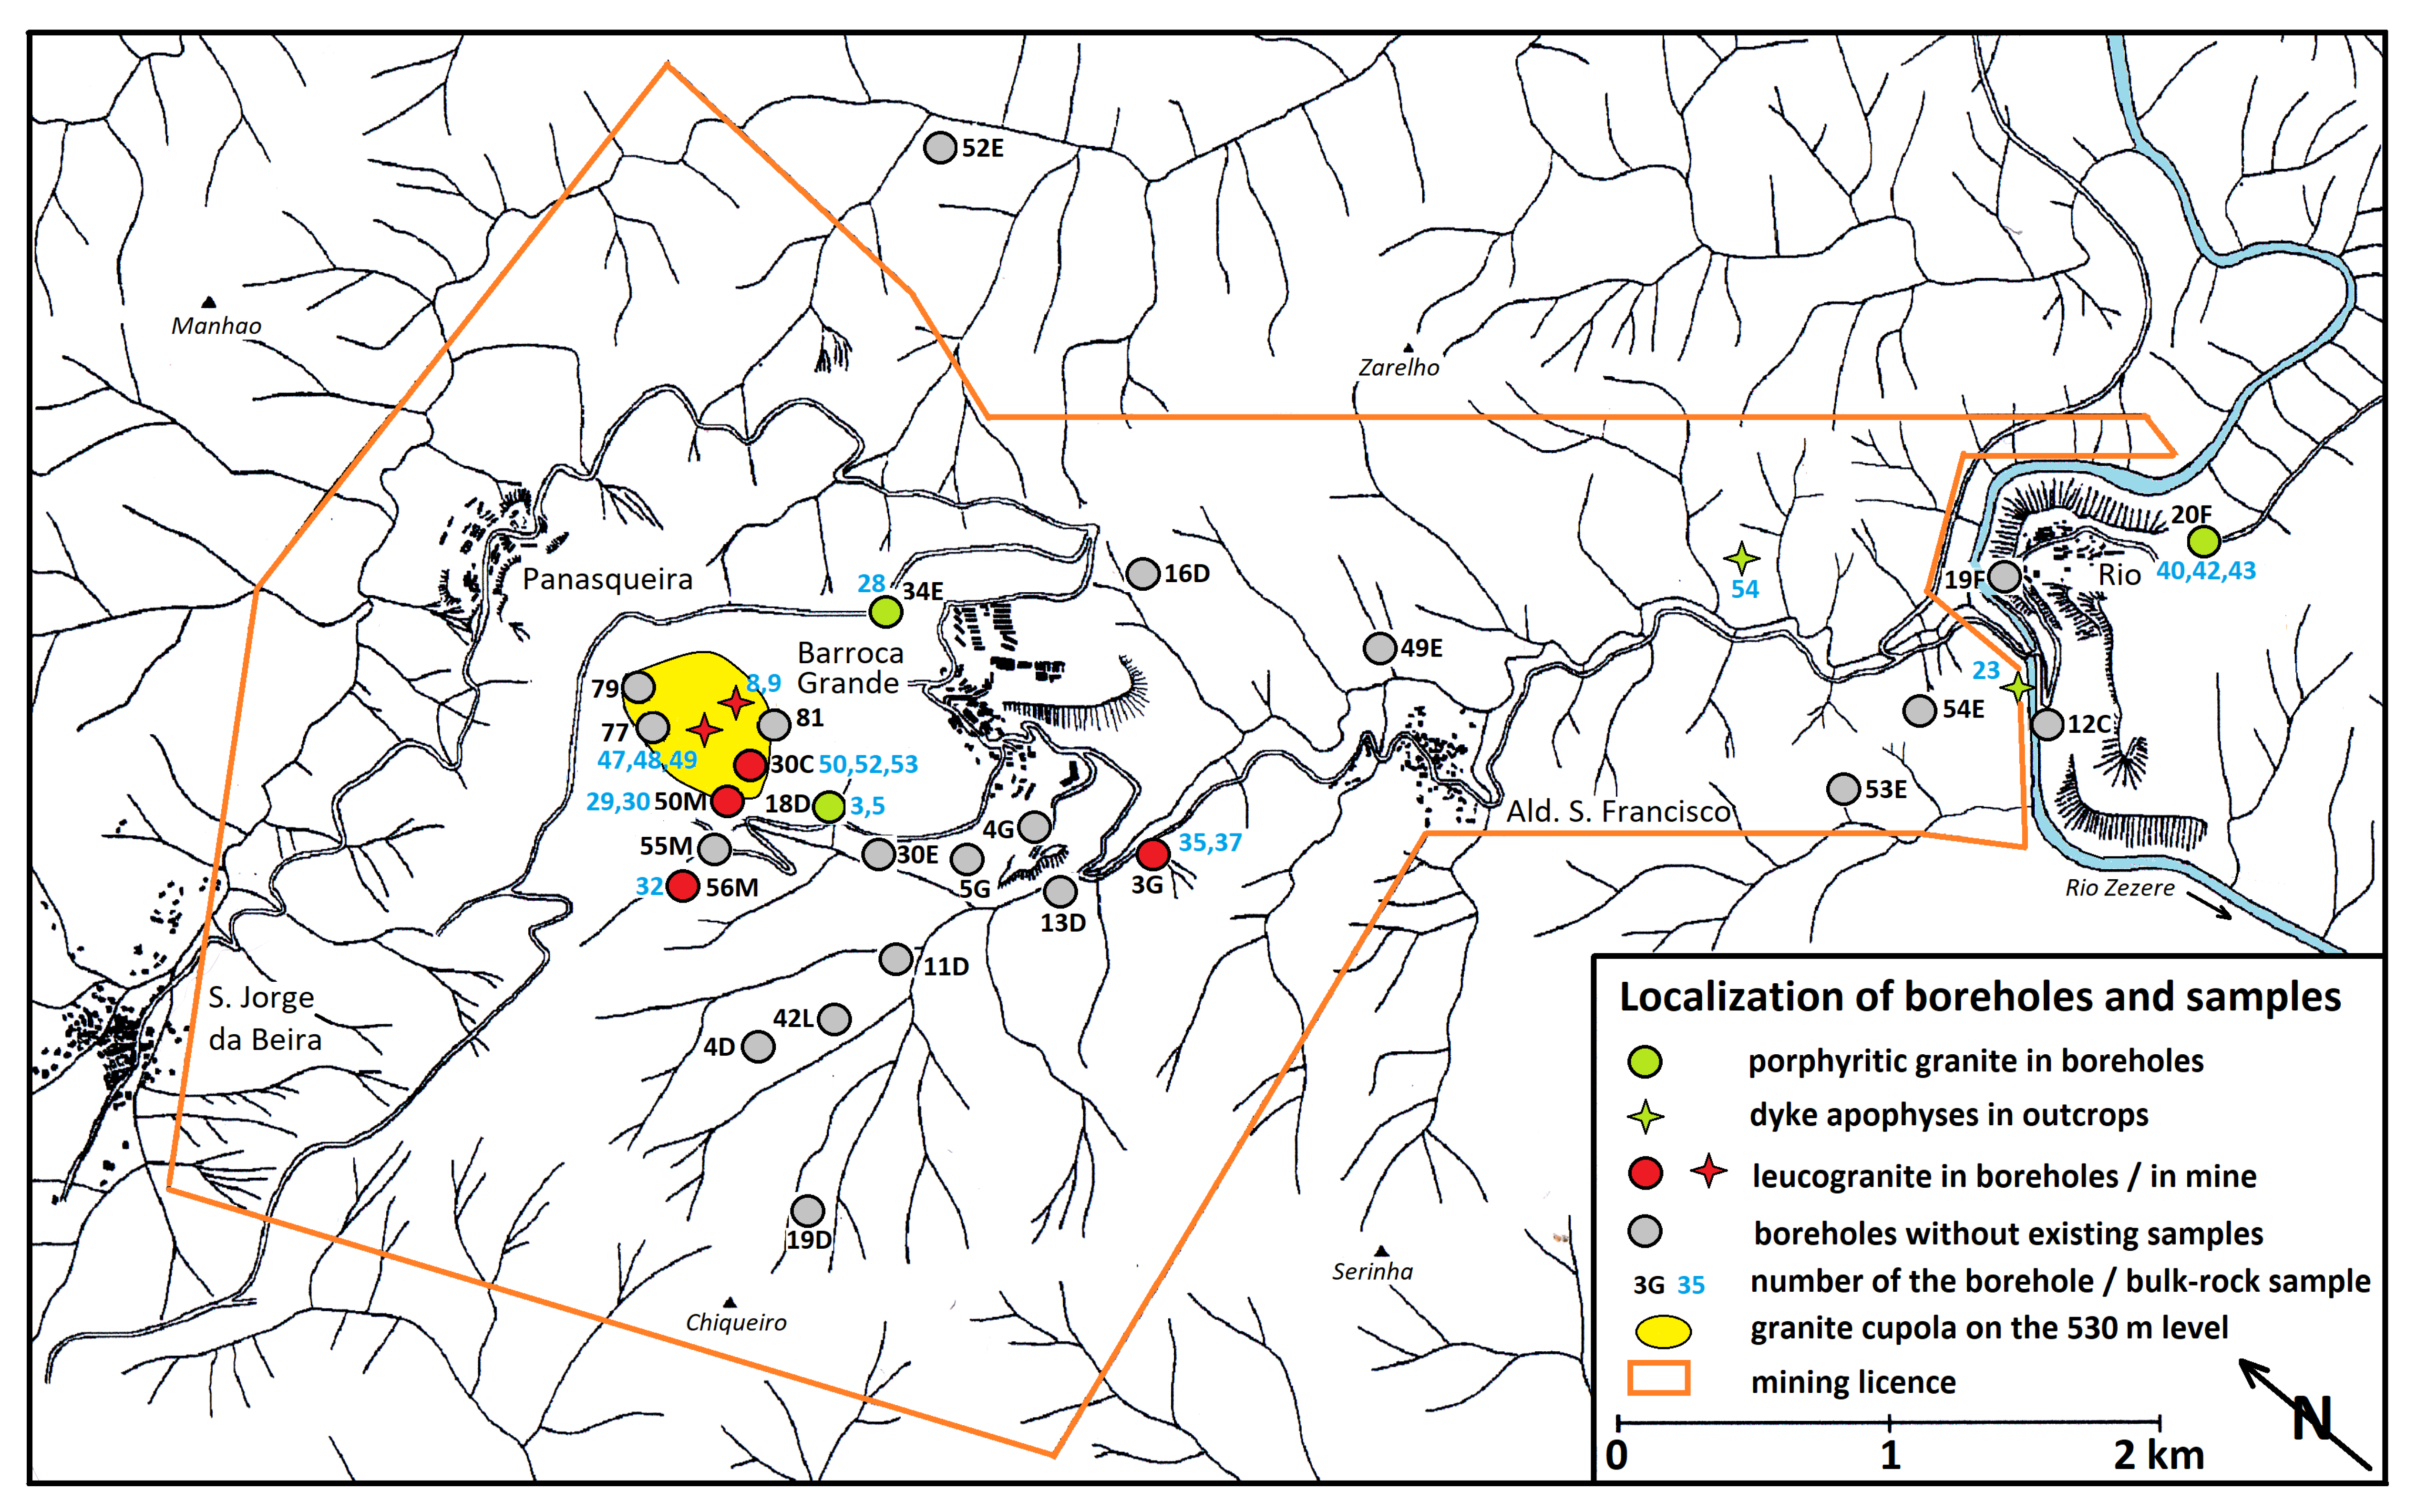
3. Materials and Methods
3.1. Bulk-Rock Geochemical Analysis
3.2. Automated Mineralogy
3.3. Electron-Microprobe Analyses of Minerals (EMPA)
3.4. Trace Elements in Quartz
3.5. Trace Elements in Mica
4. Results
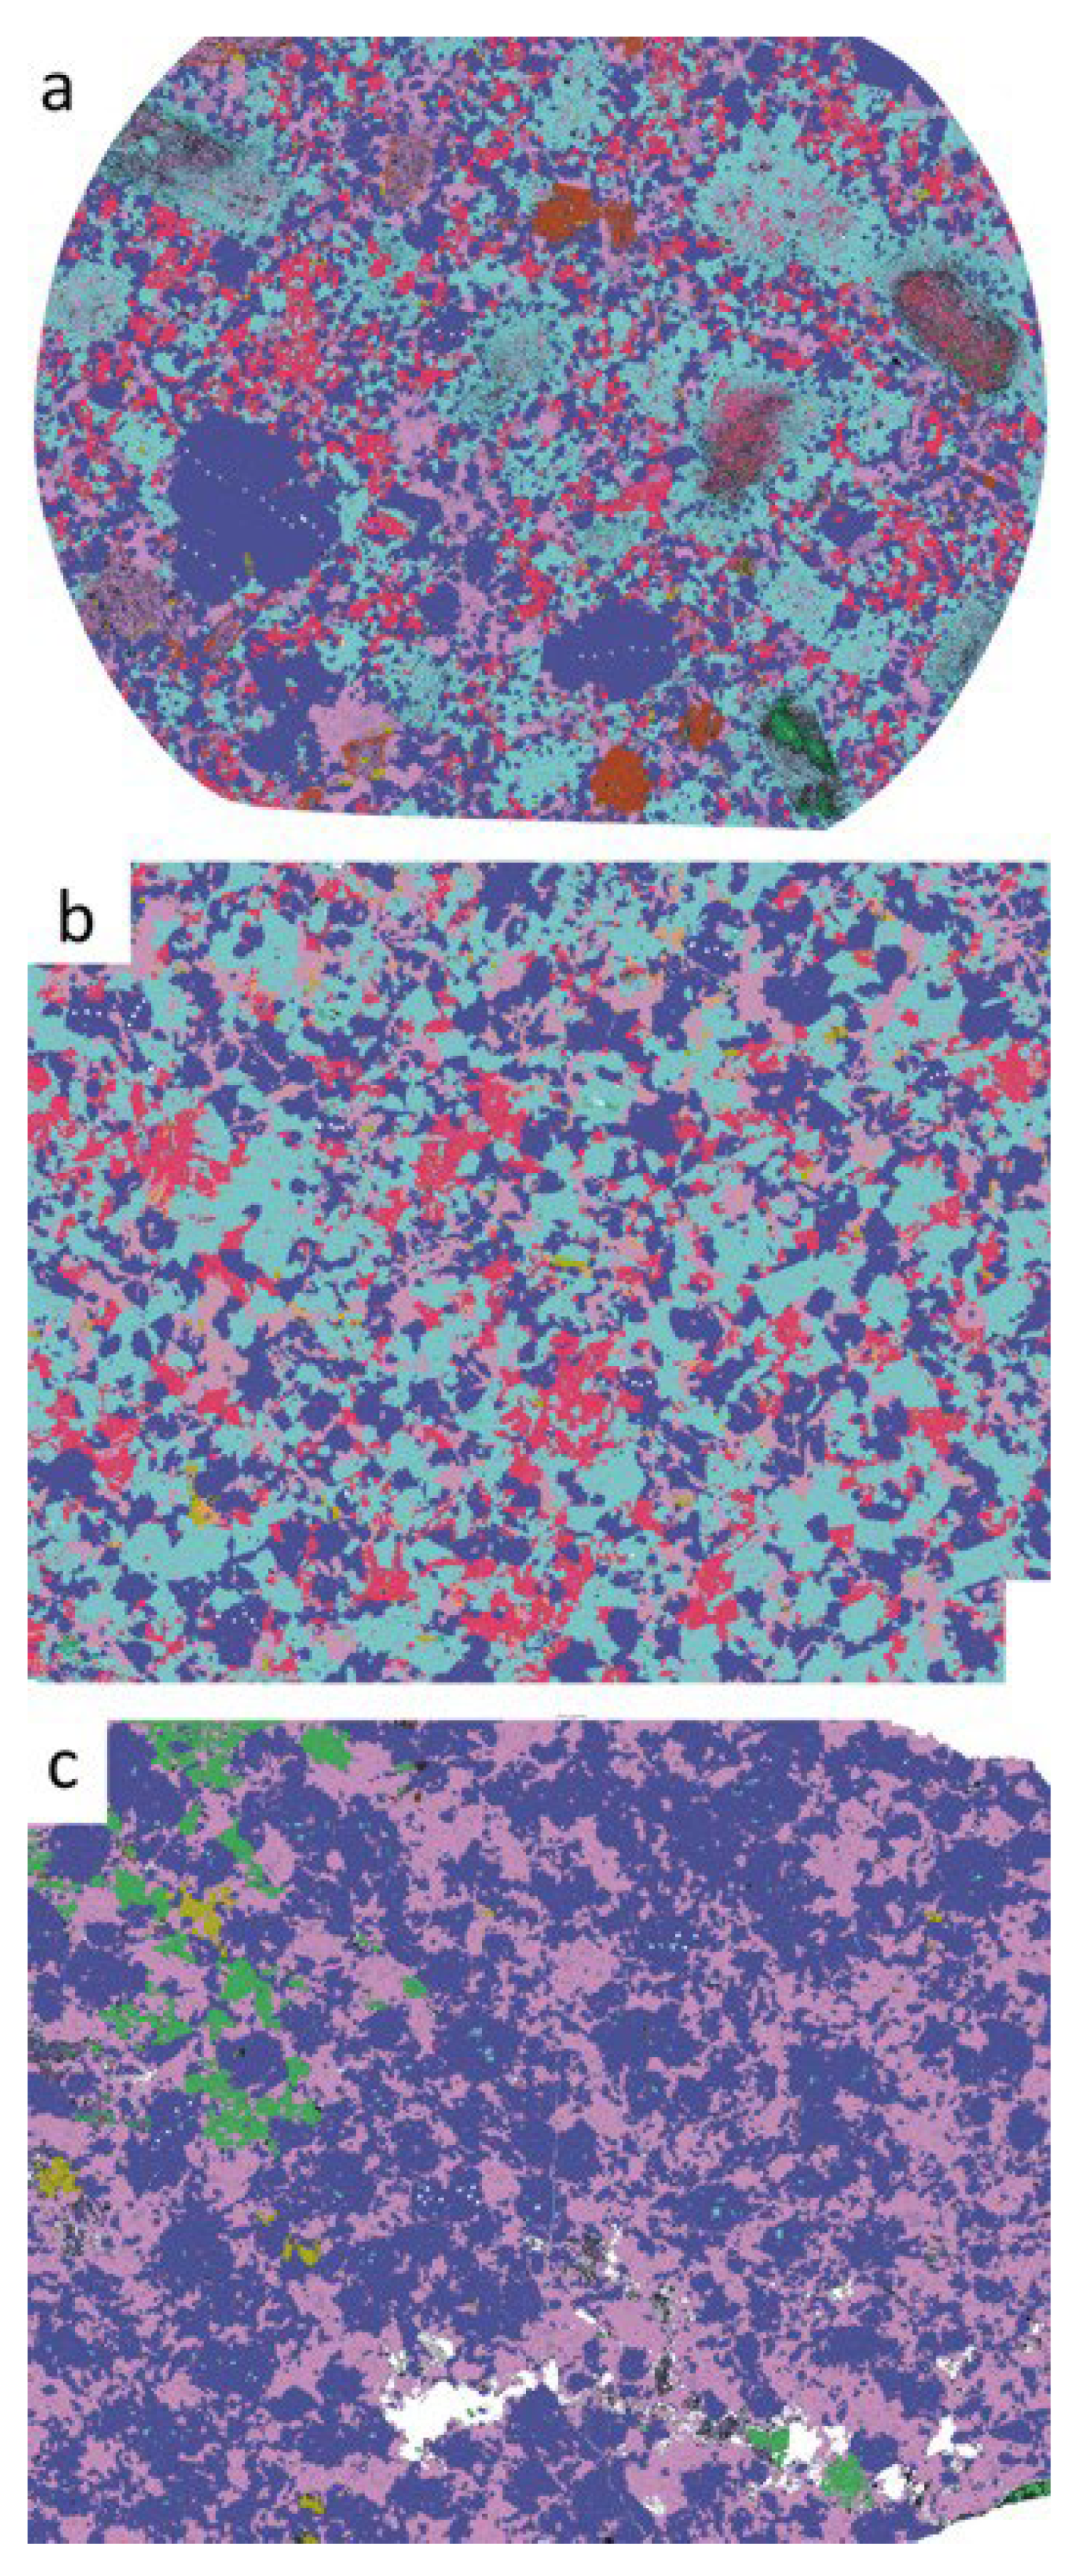
4.1. Textures of Granites, Greisens, and Quartz Veins
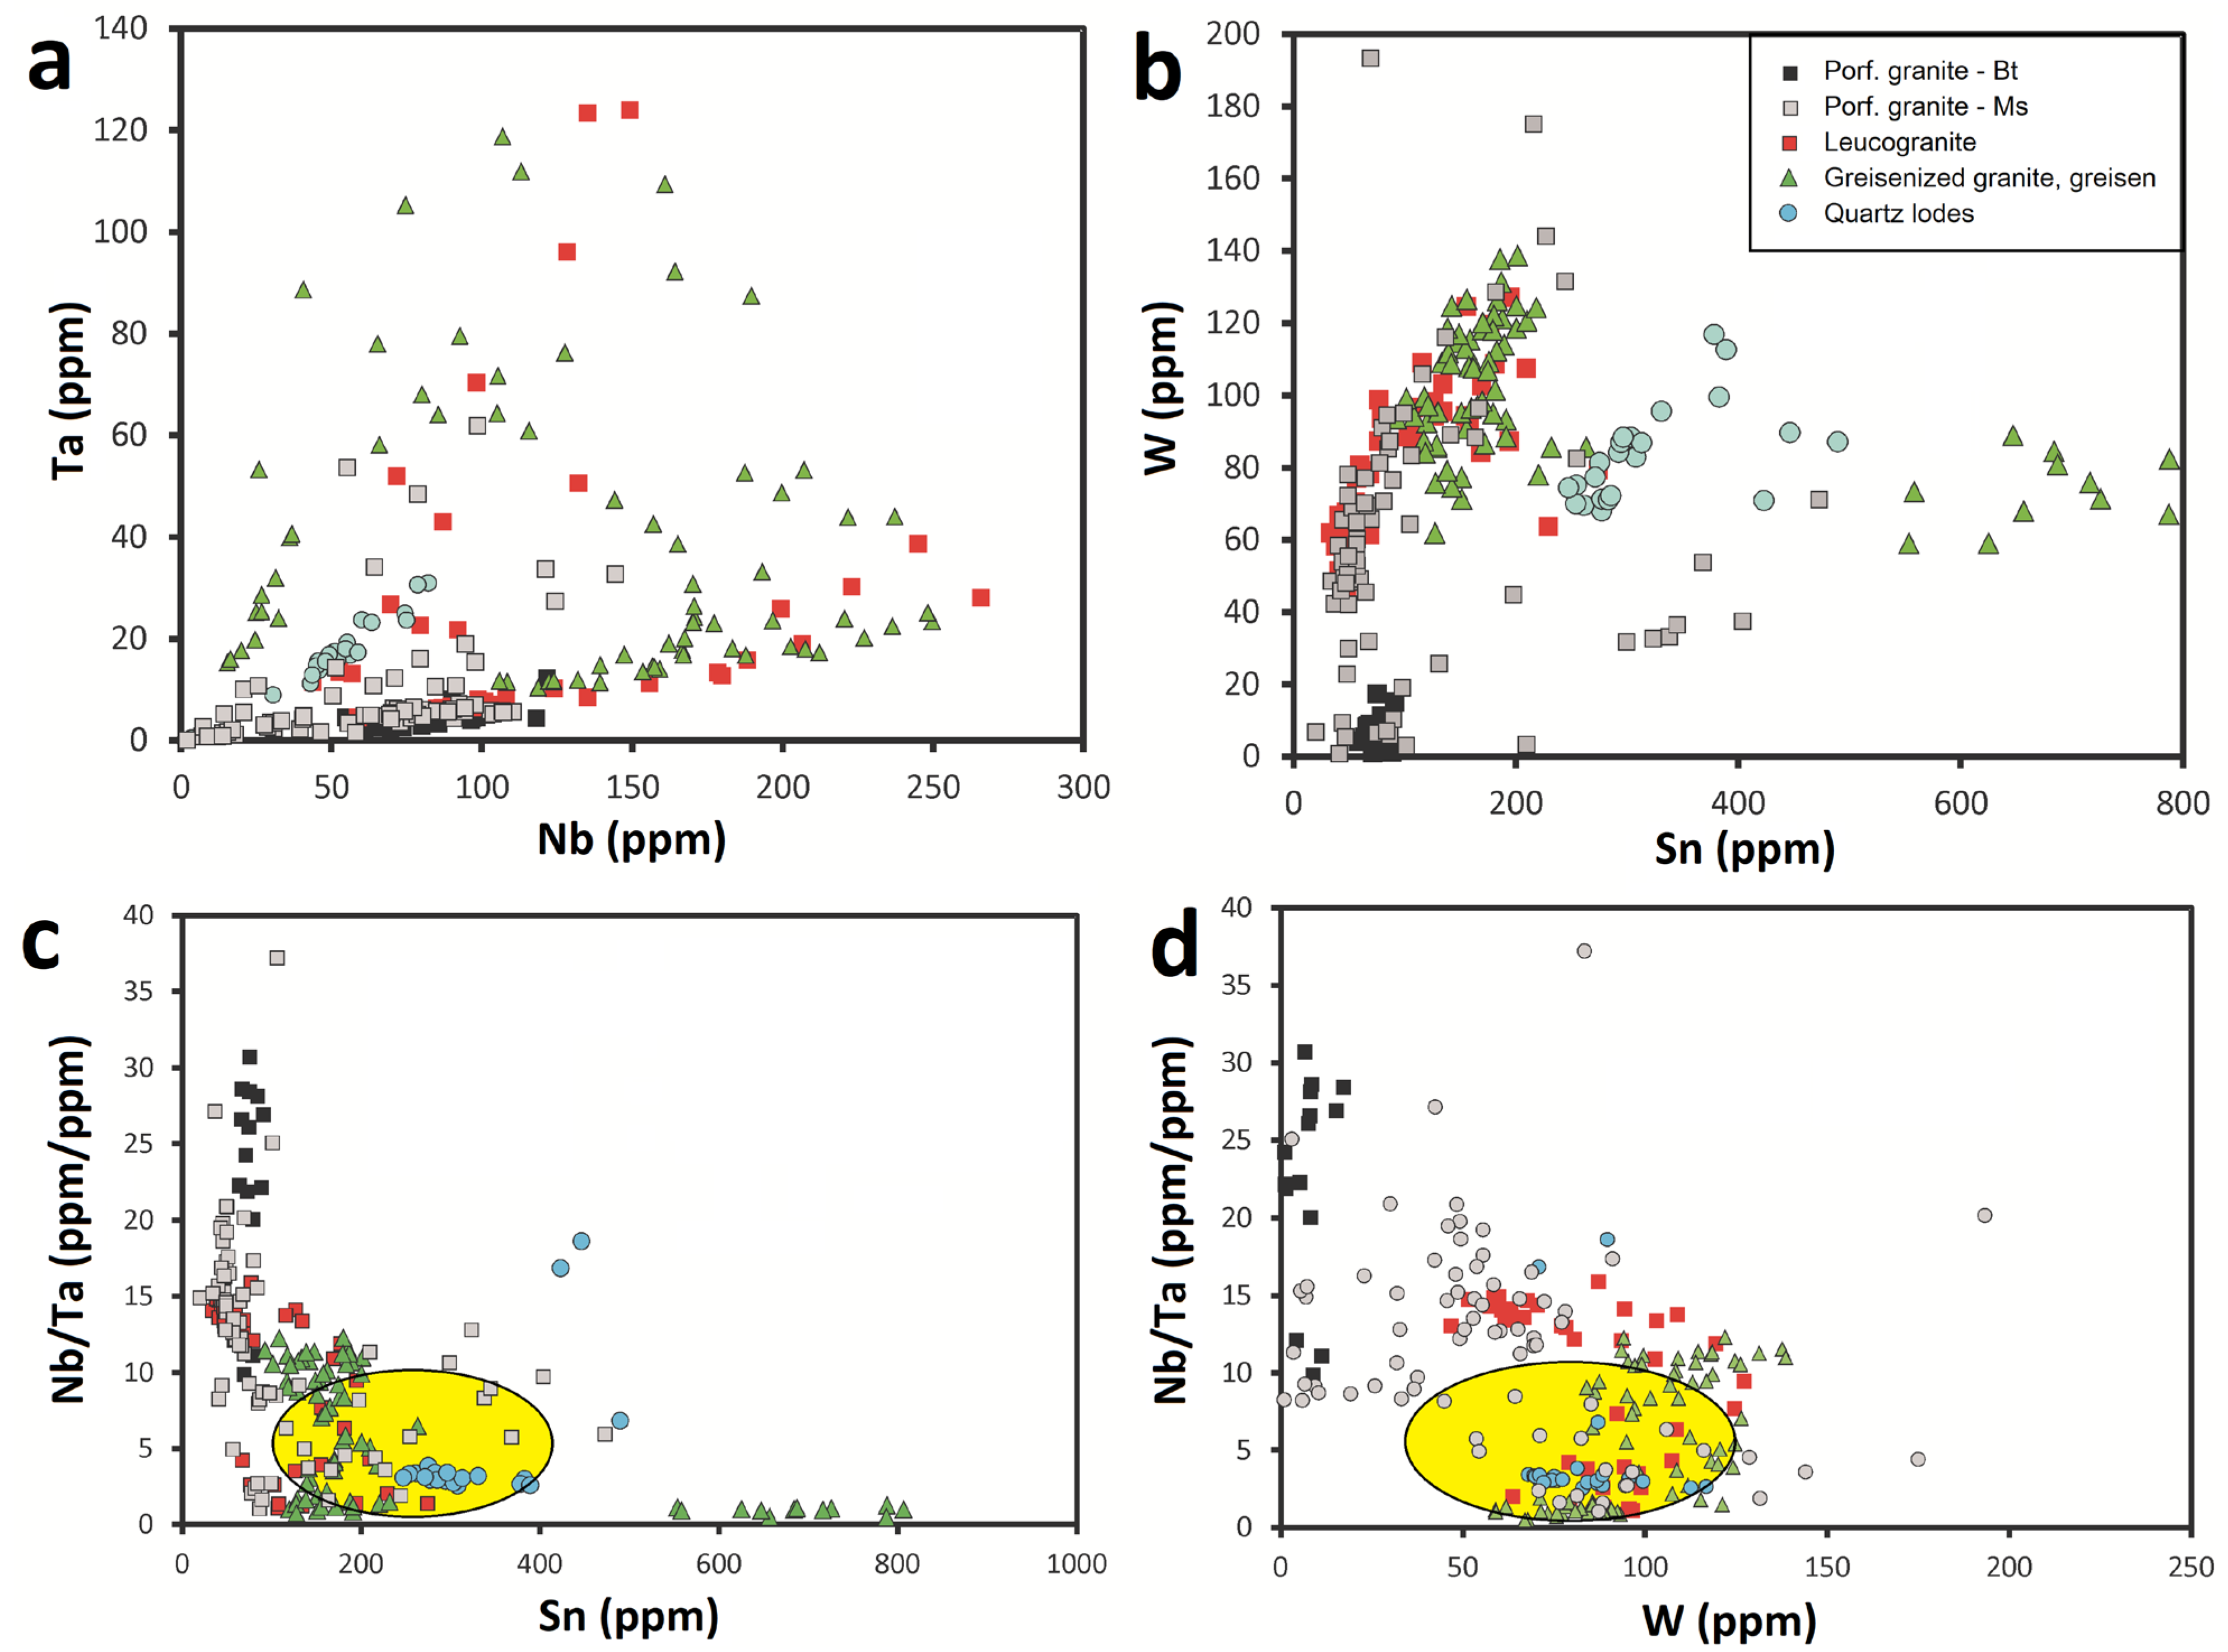
4.2. Bulk-Rock Chemical Composition of Granites and Greisens
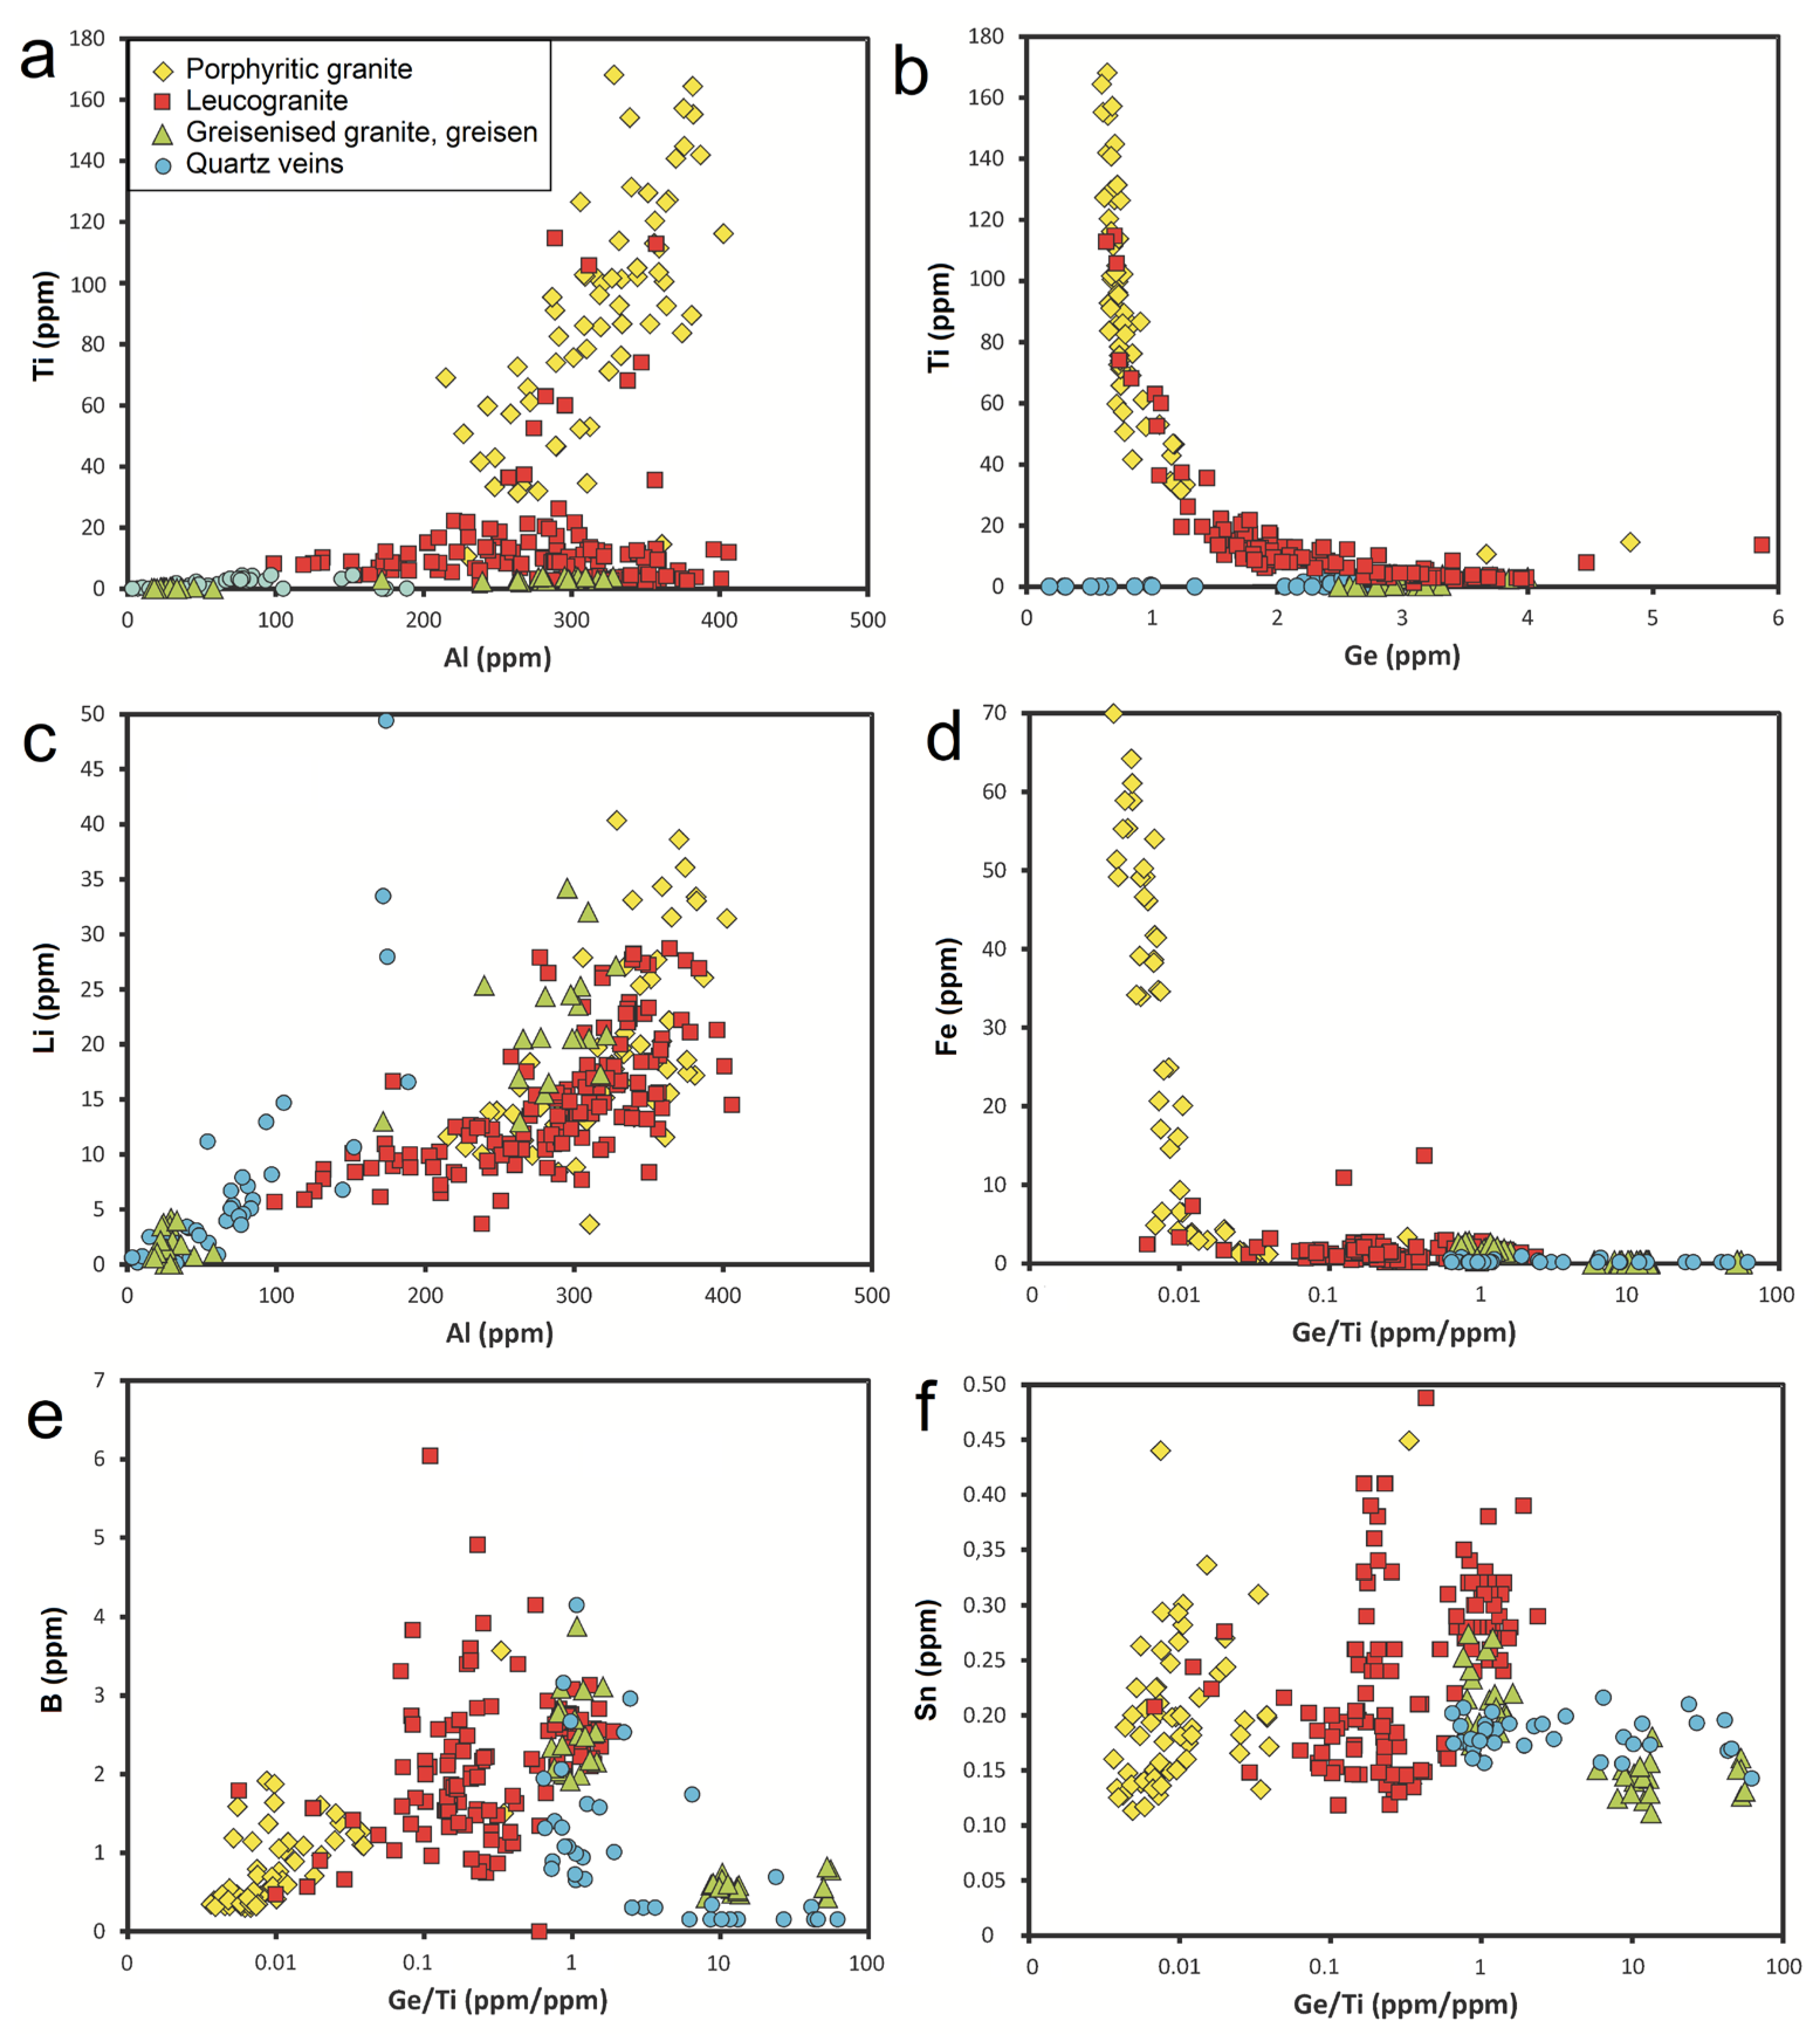
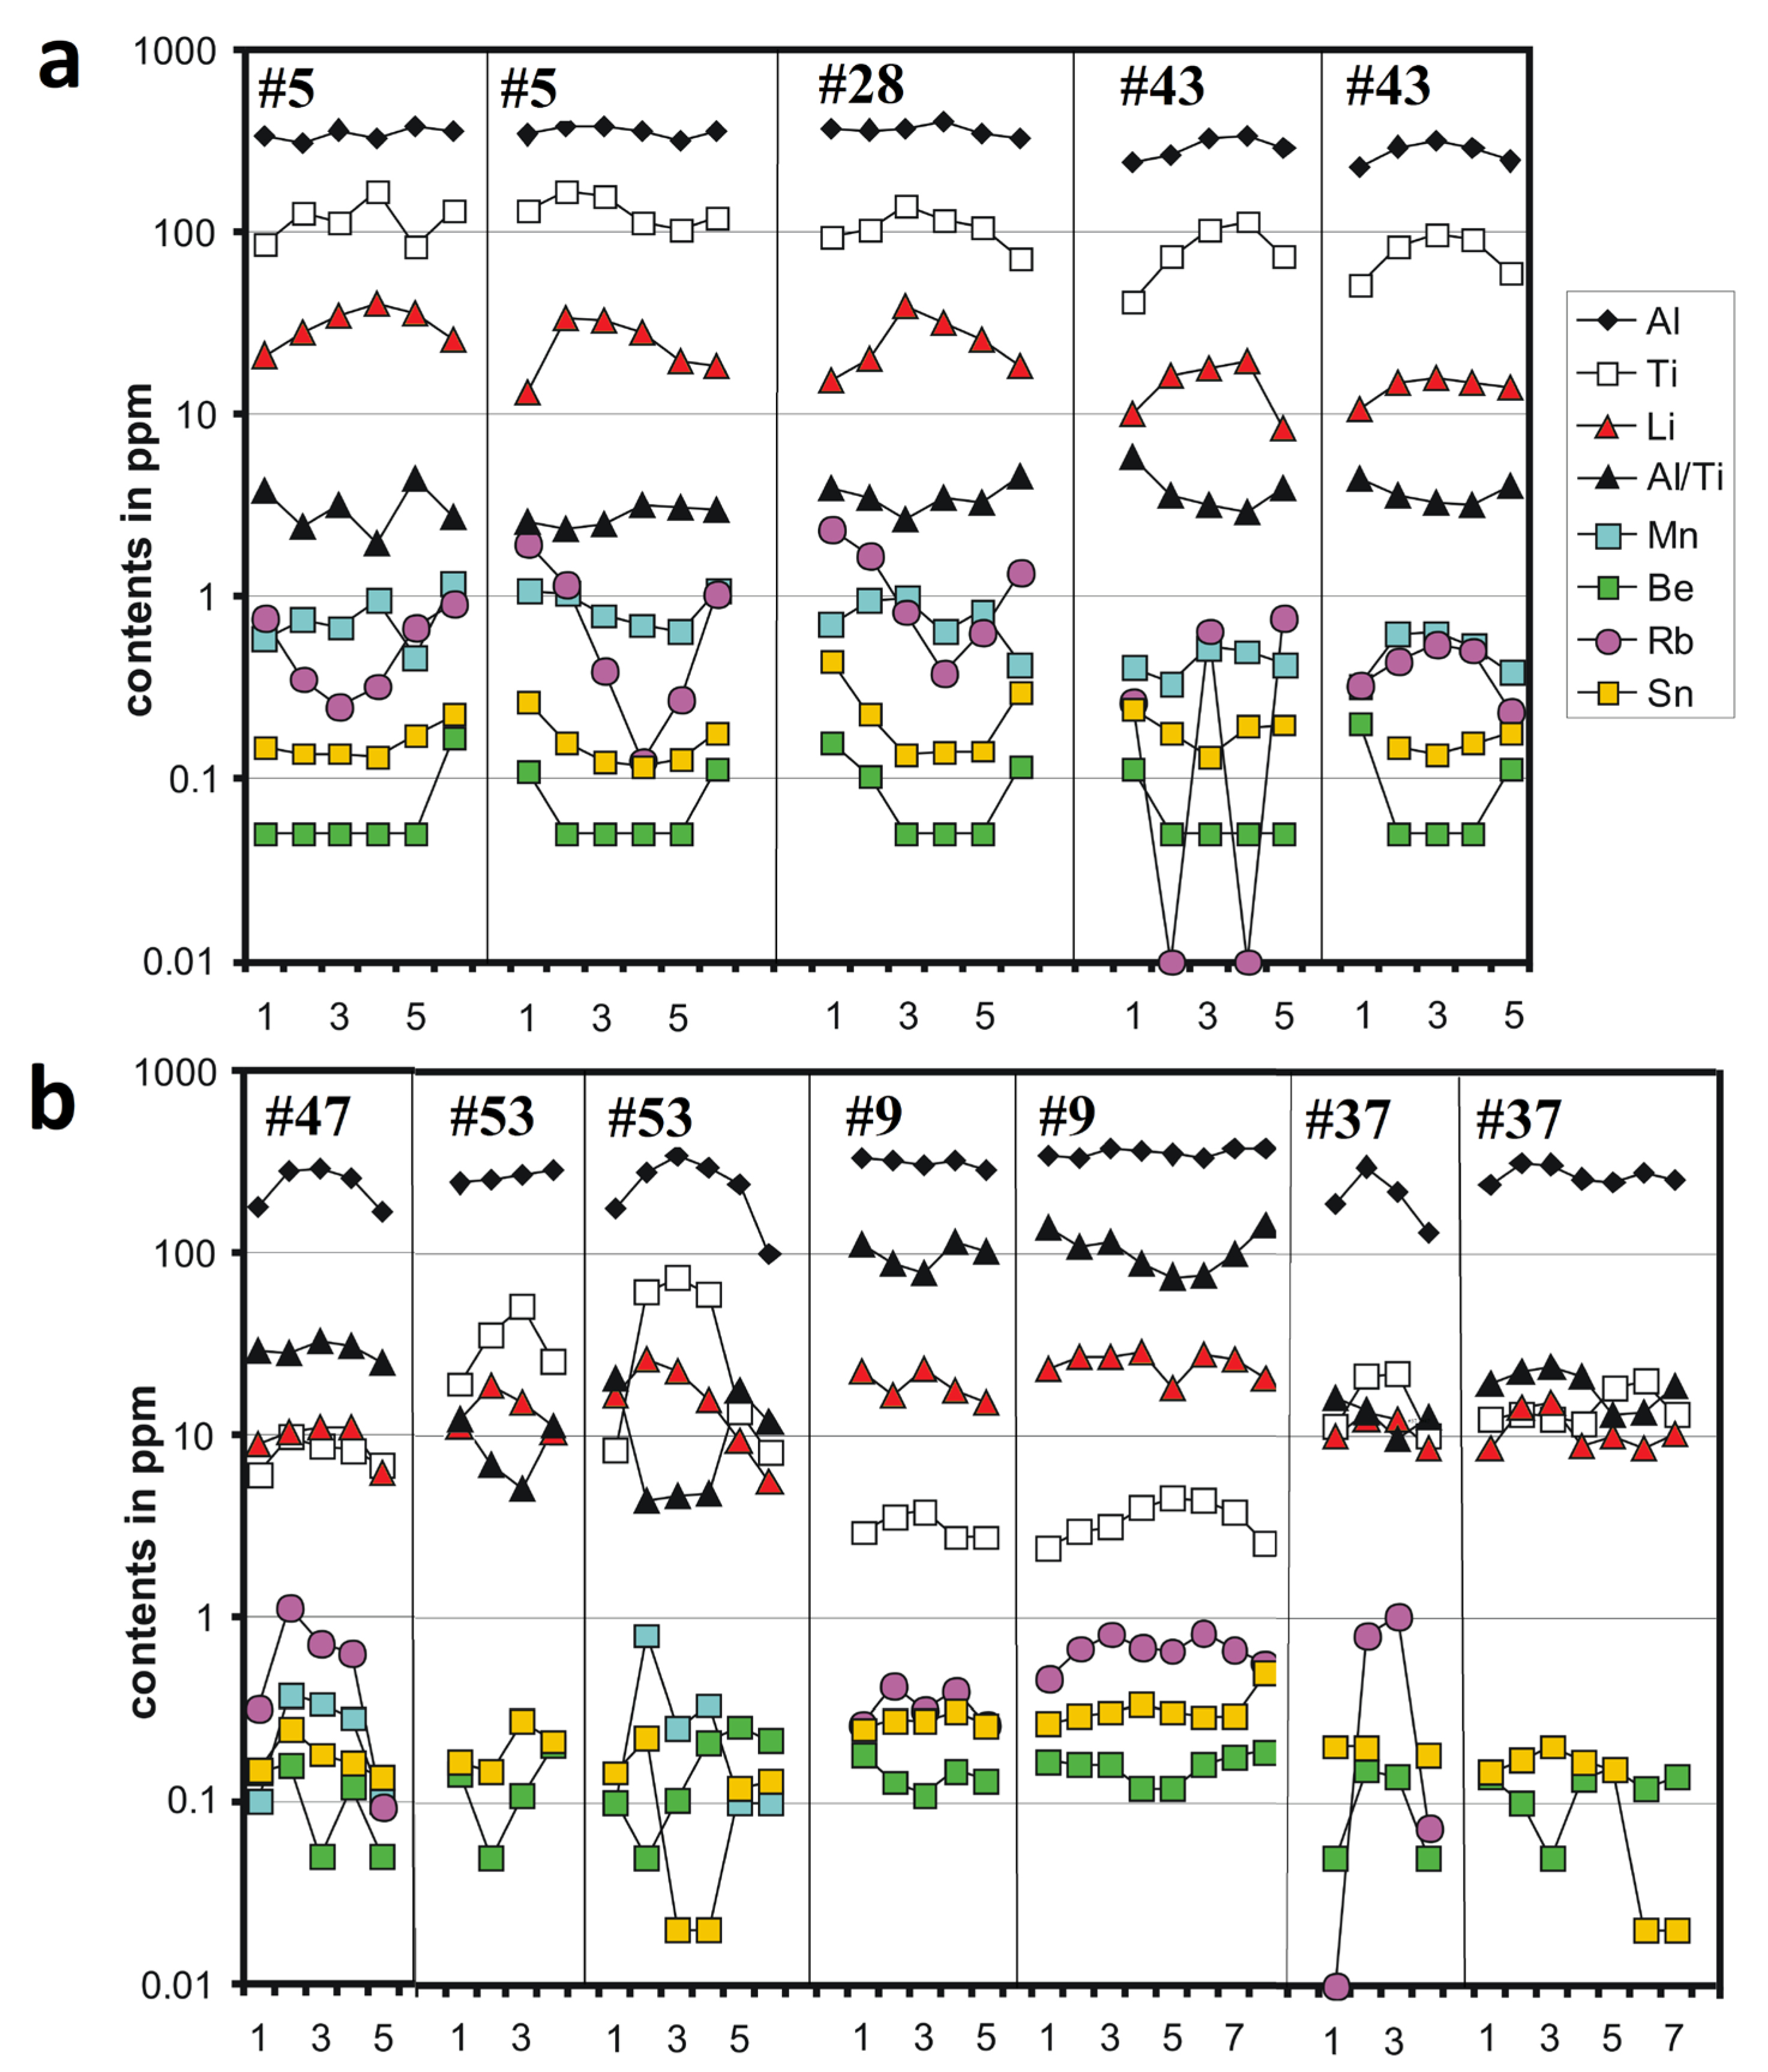
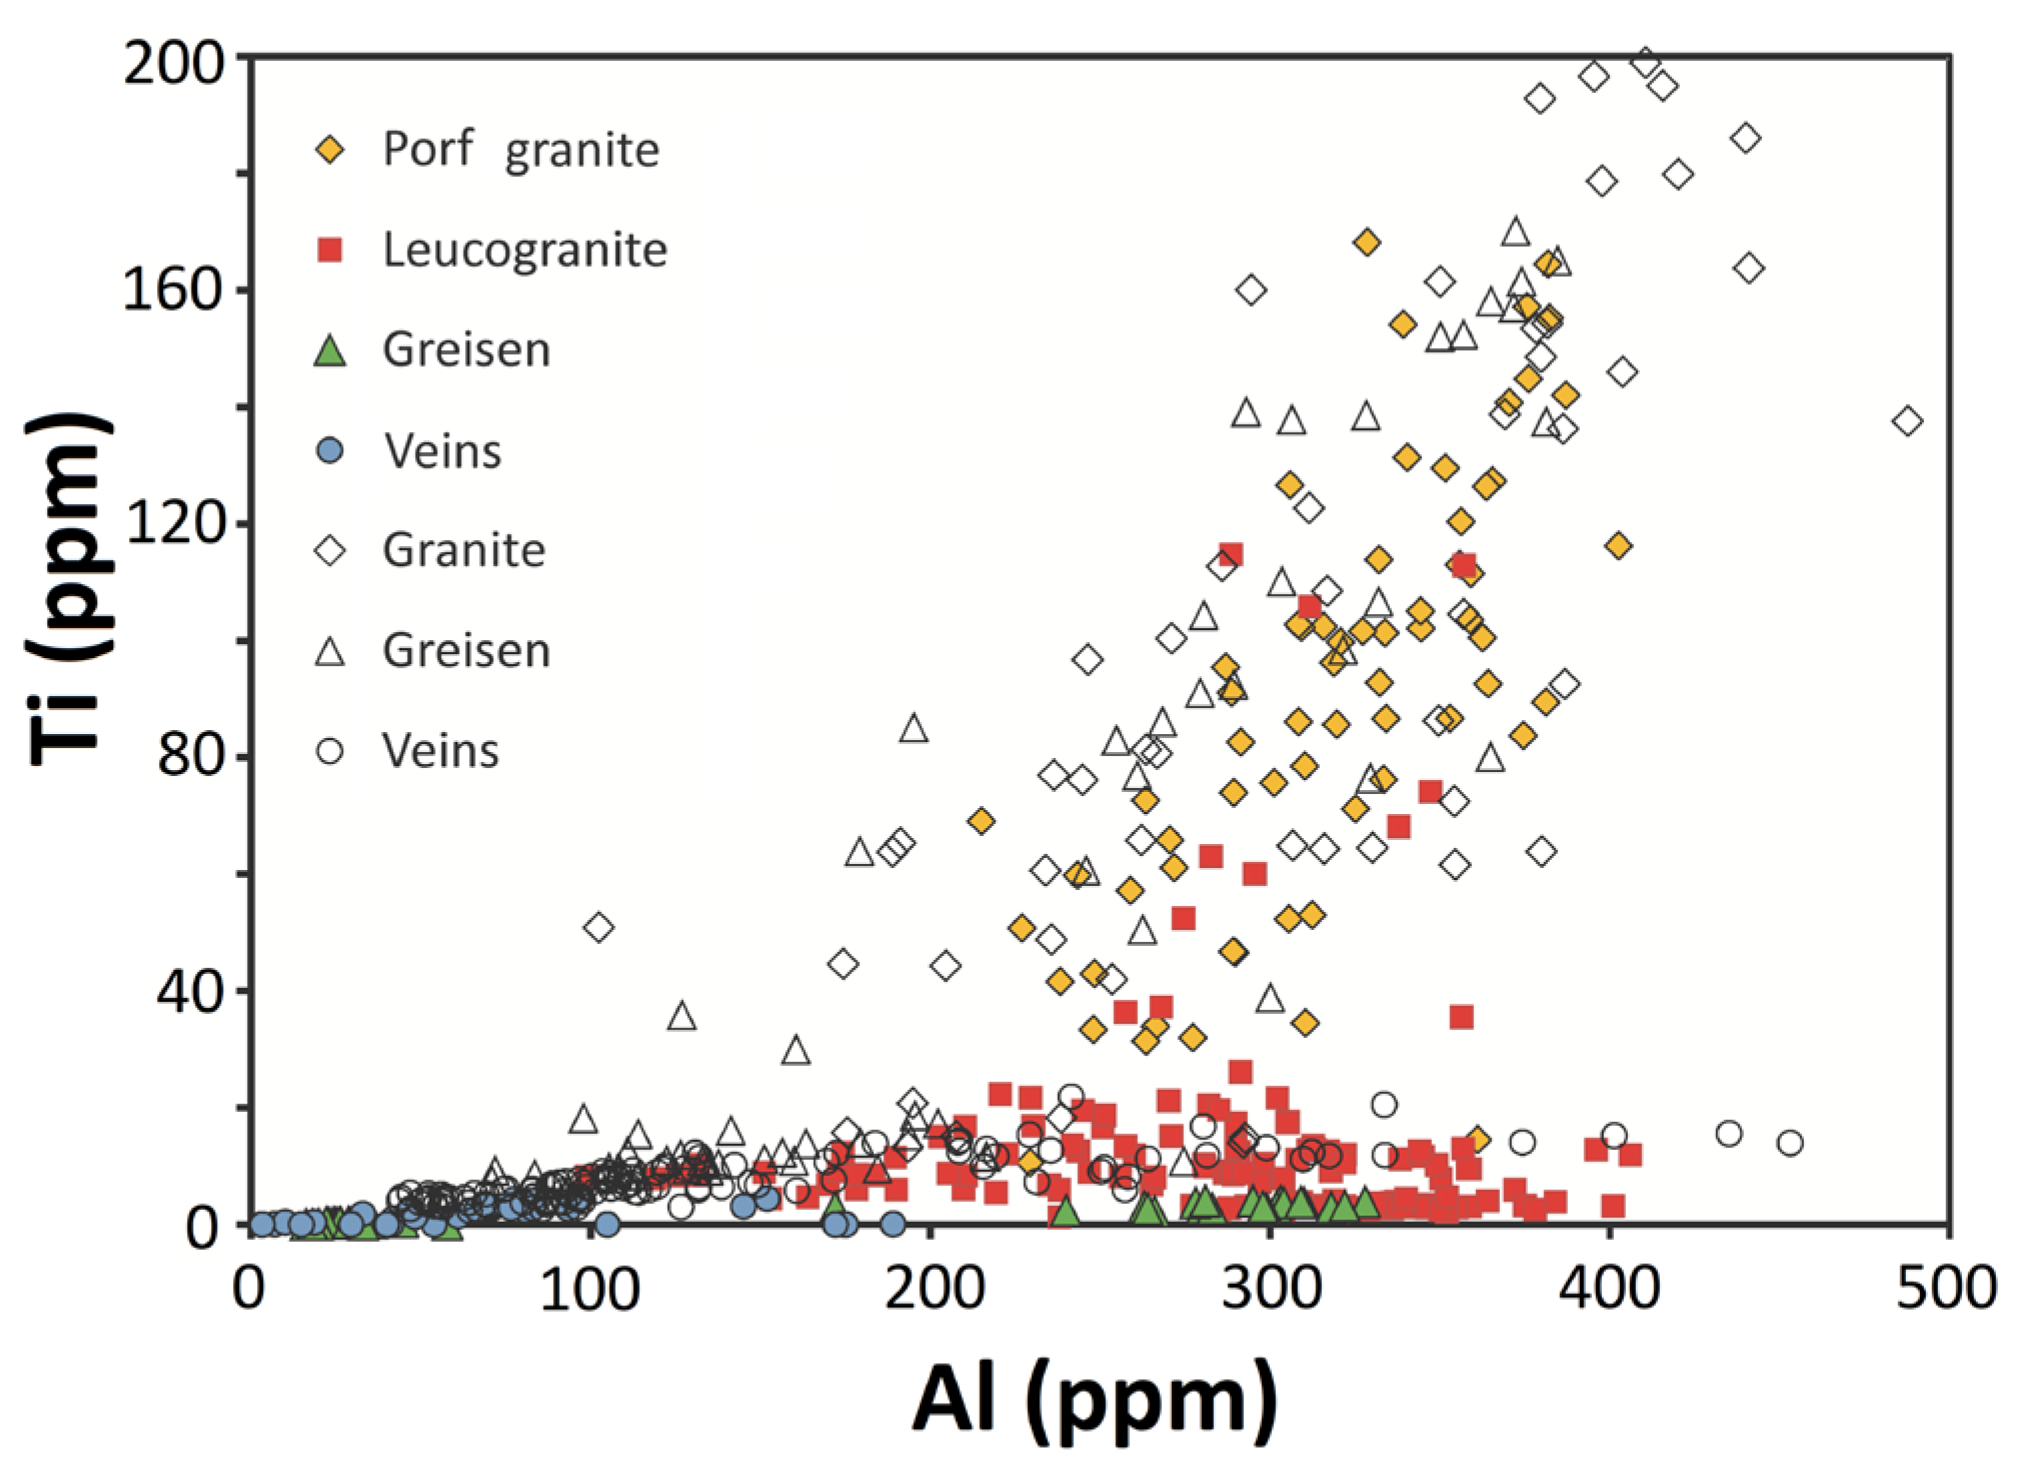
4.3. Quartz
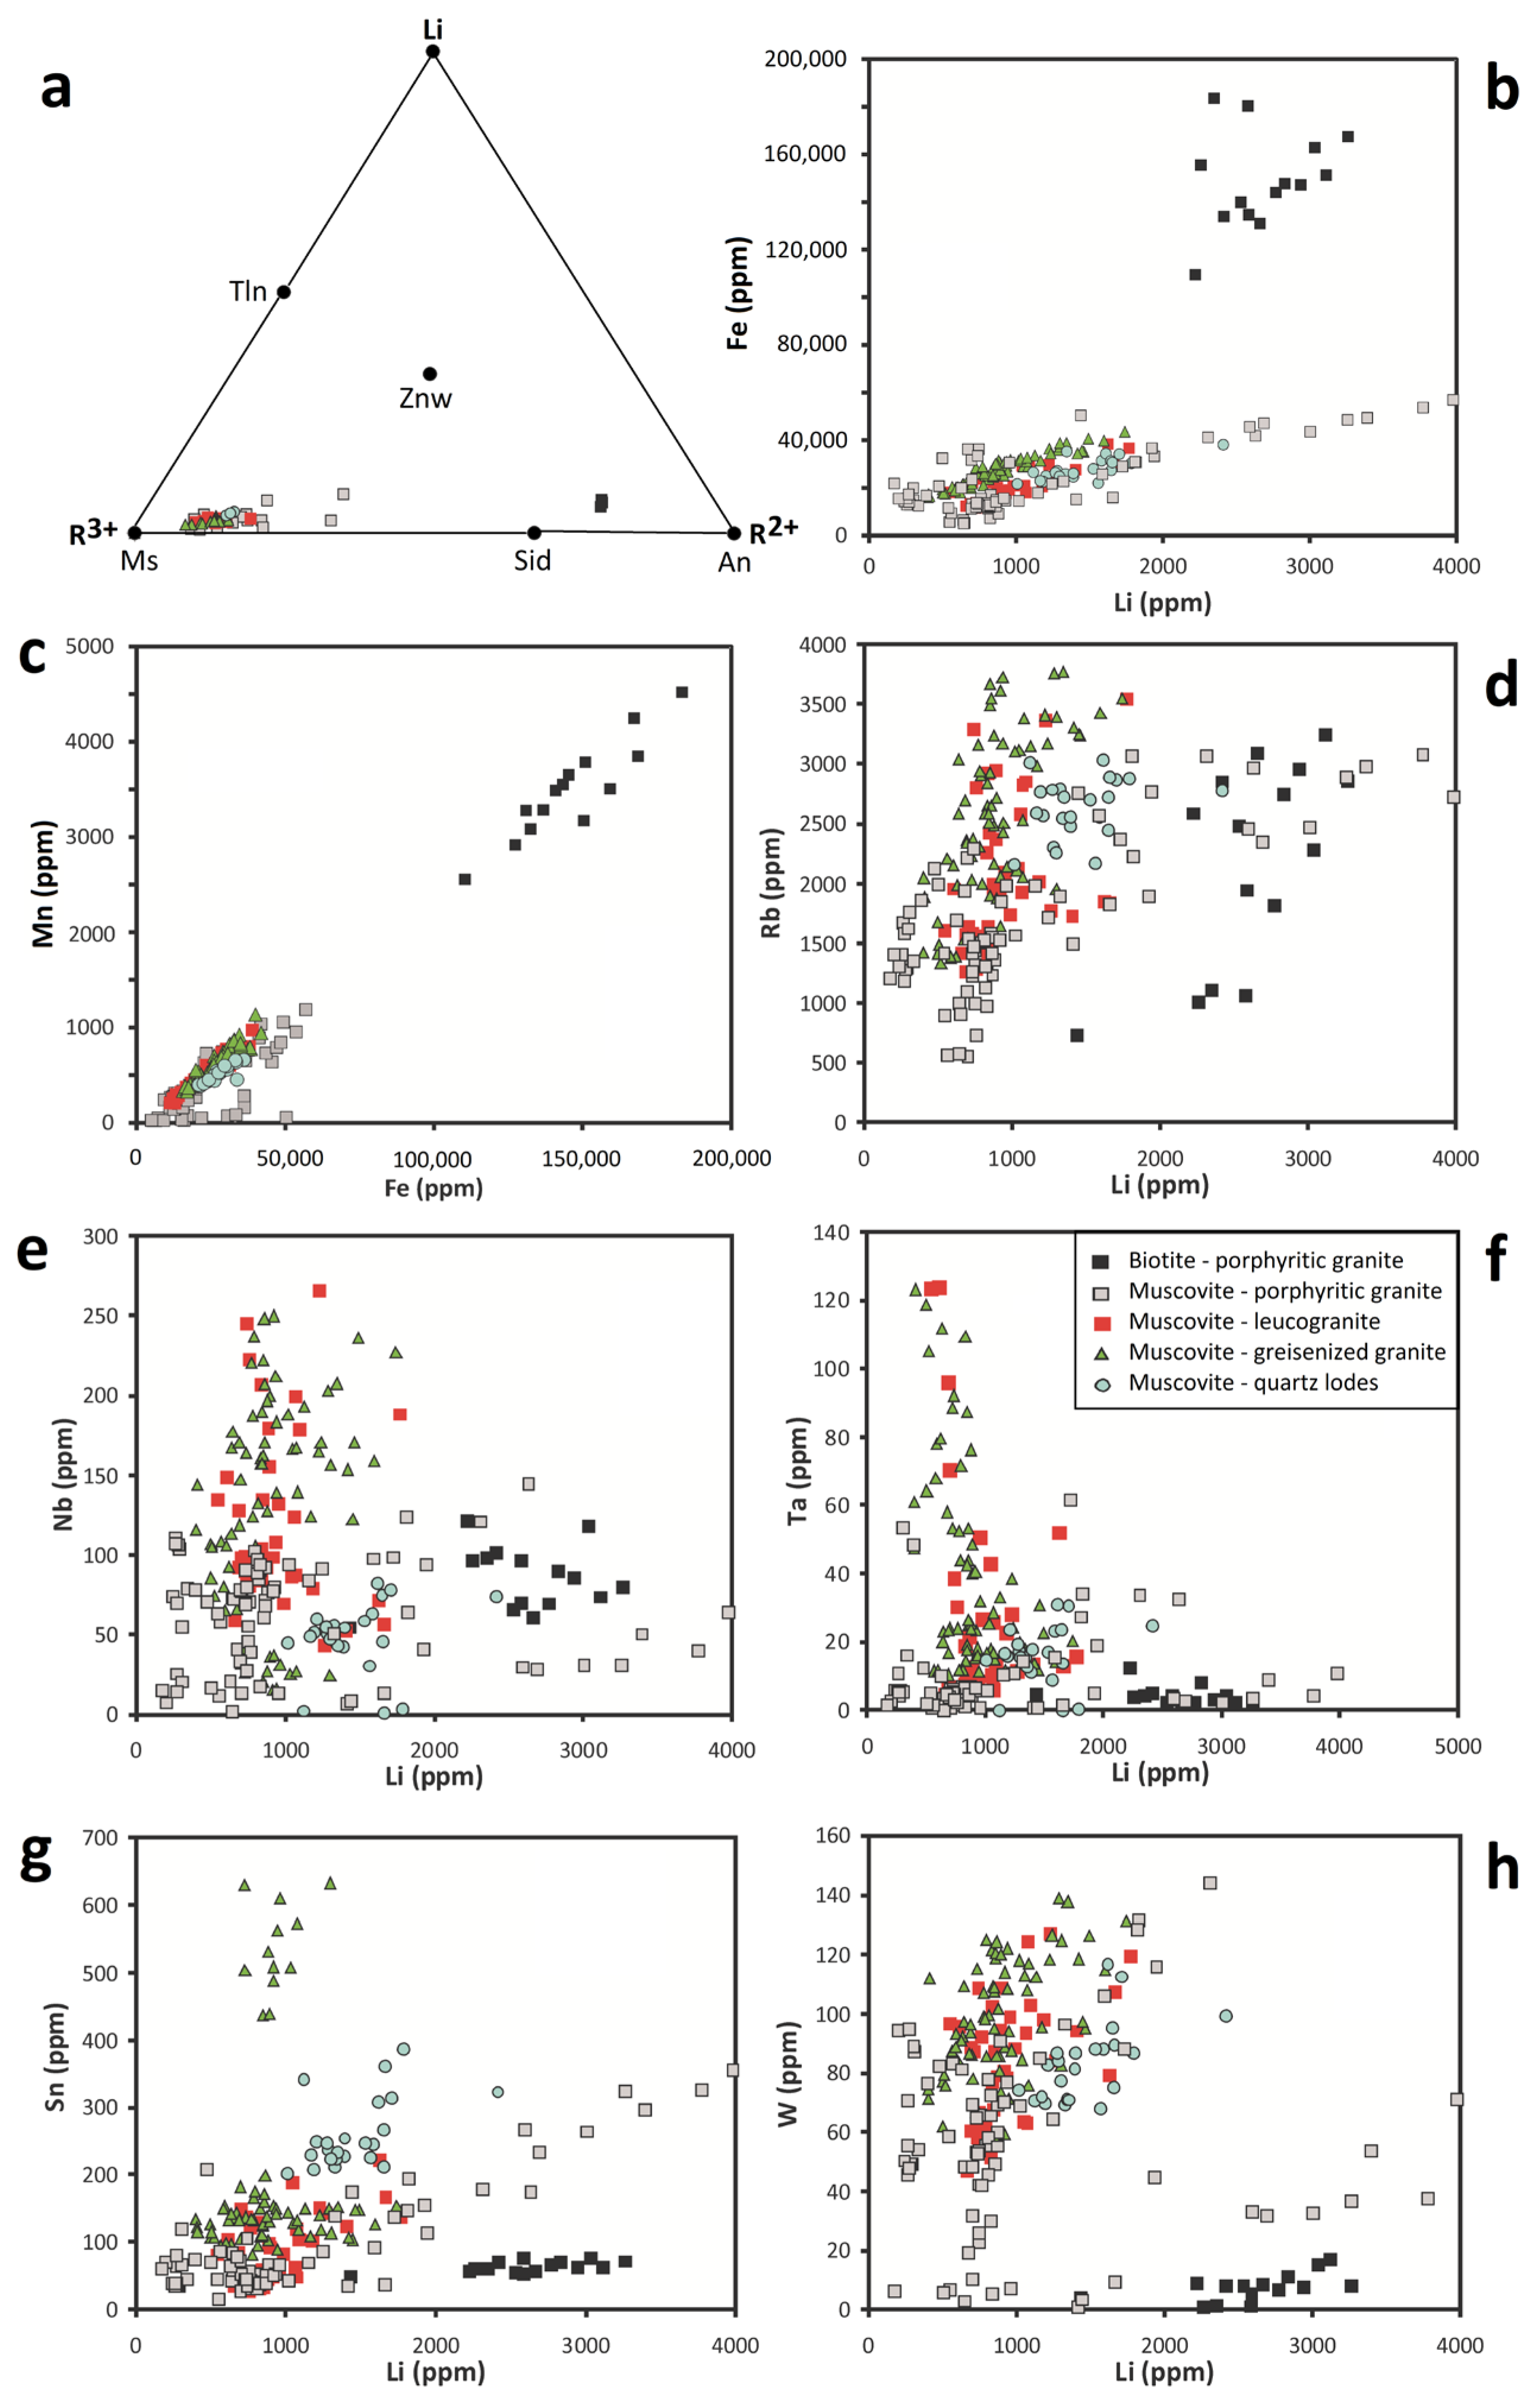
4.4. Micas

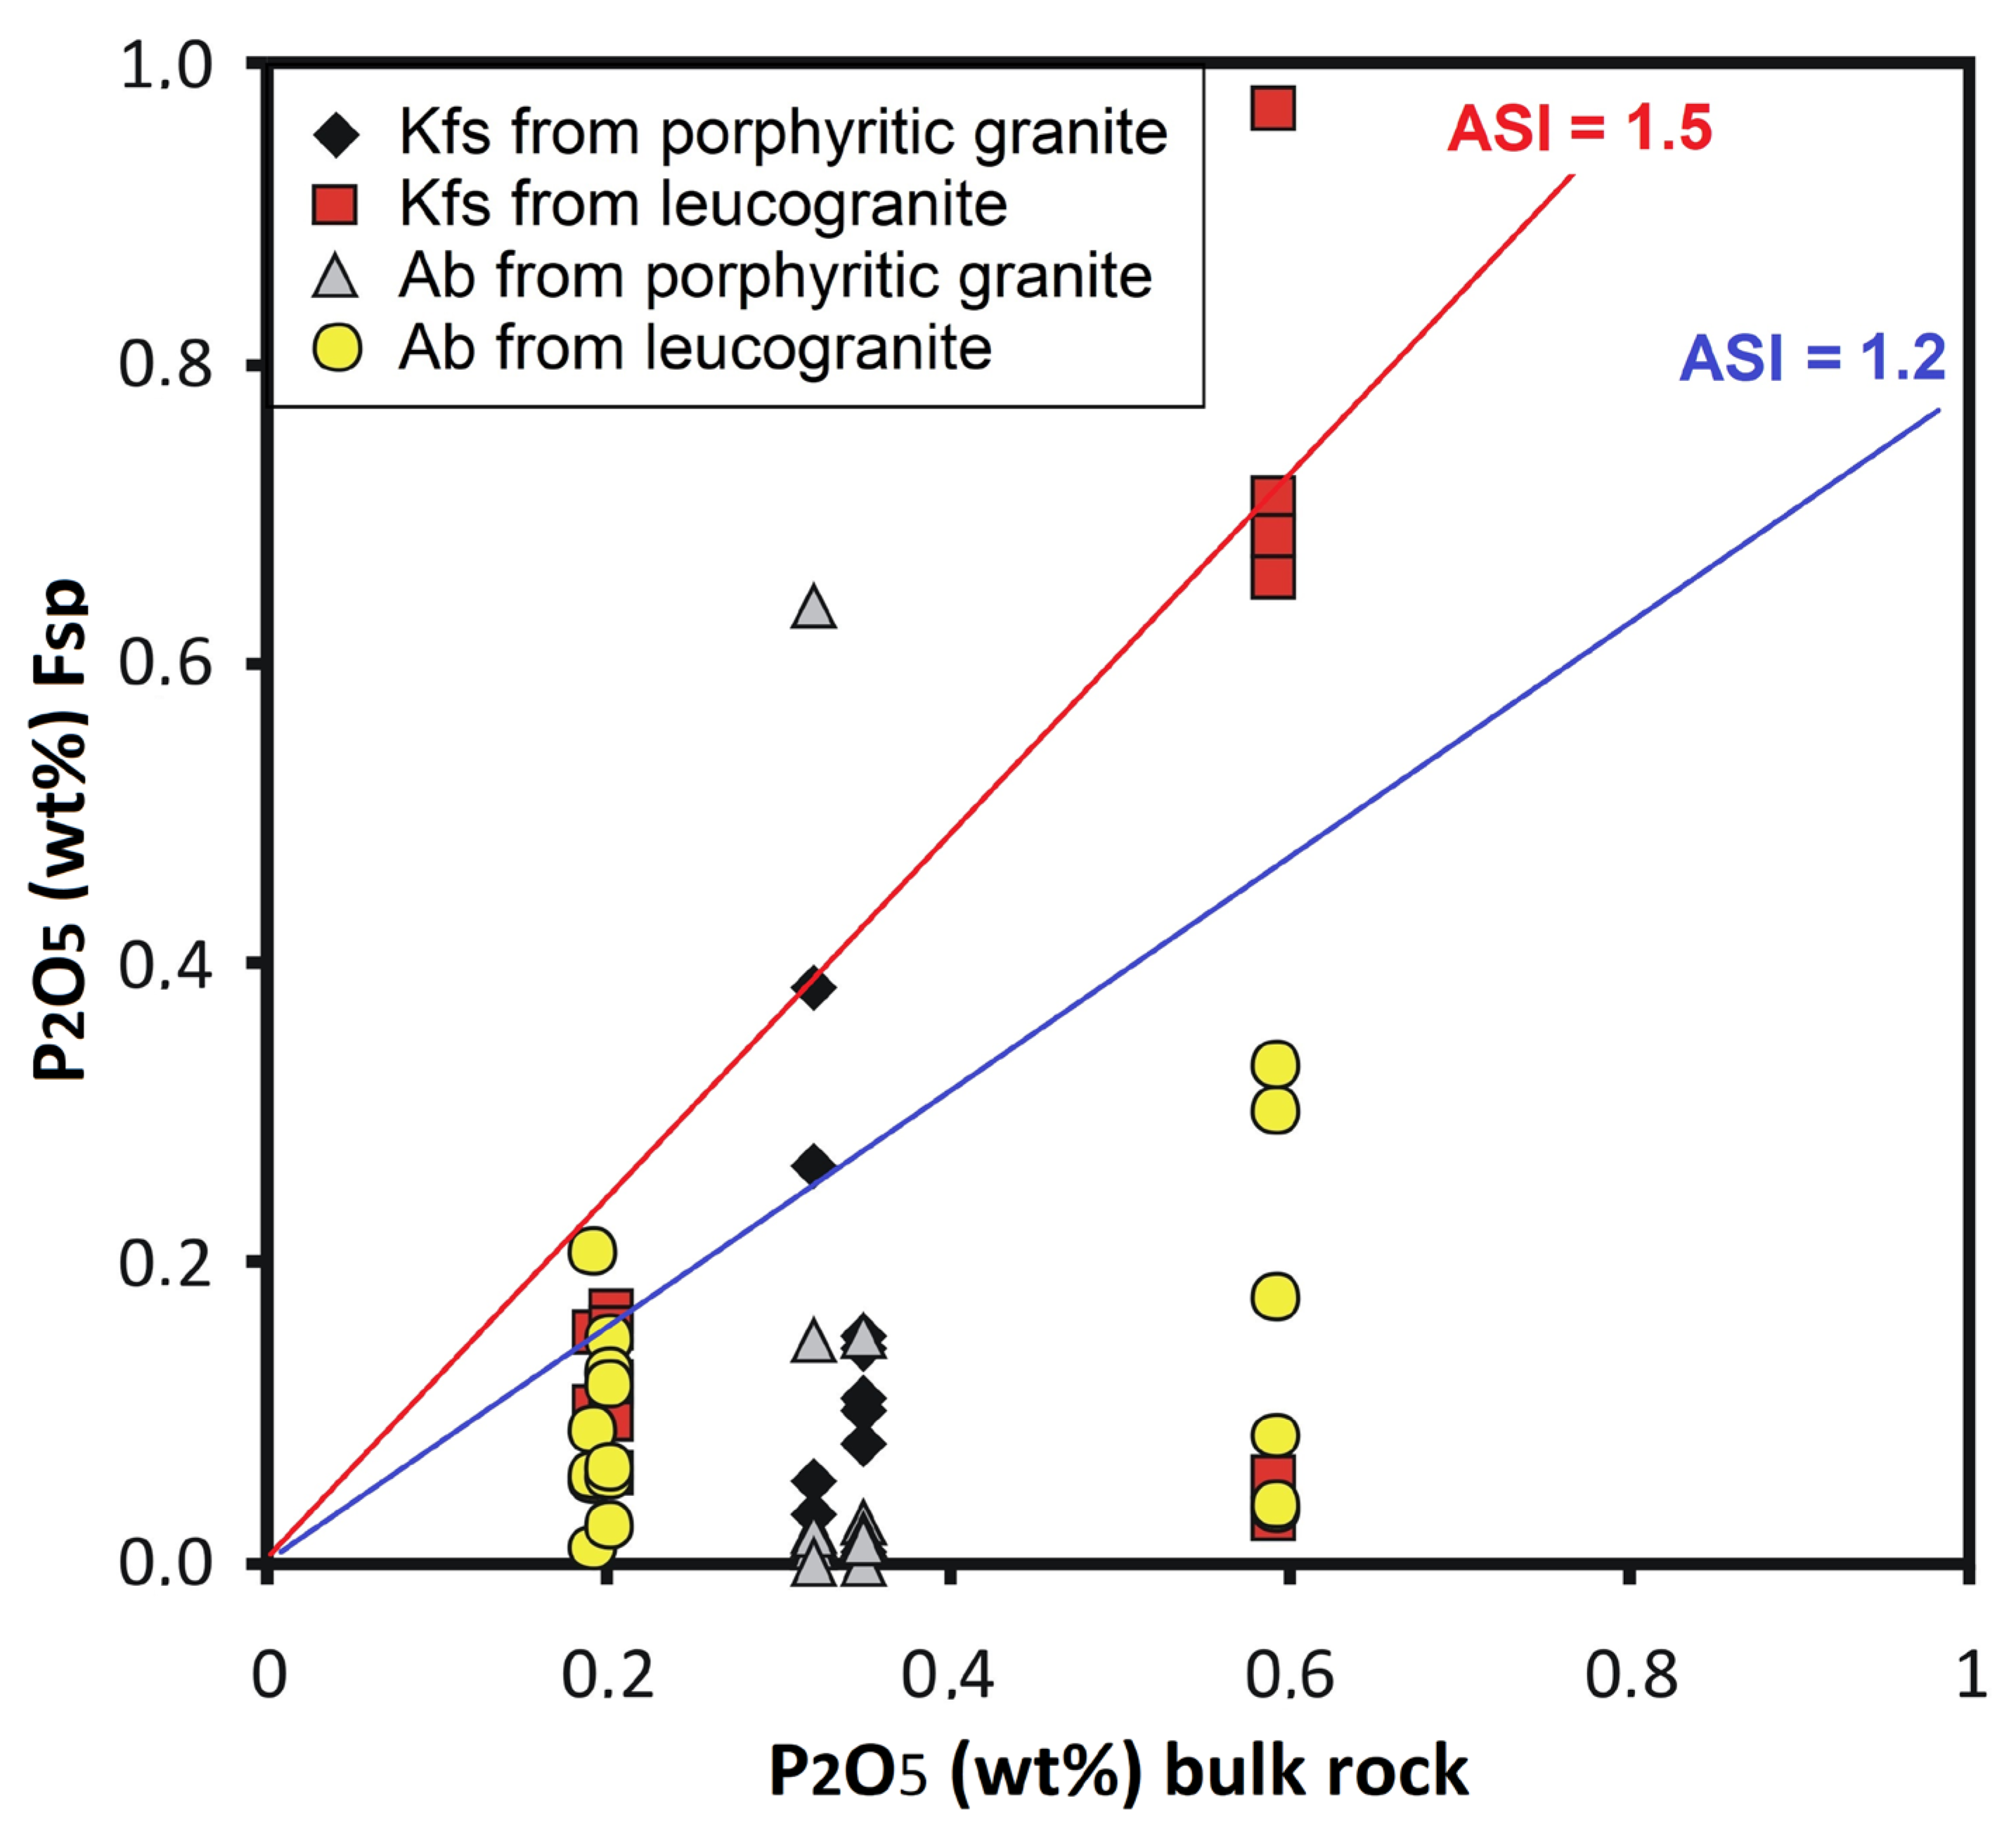
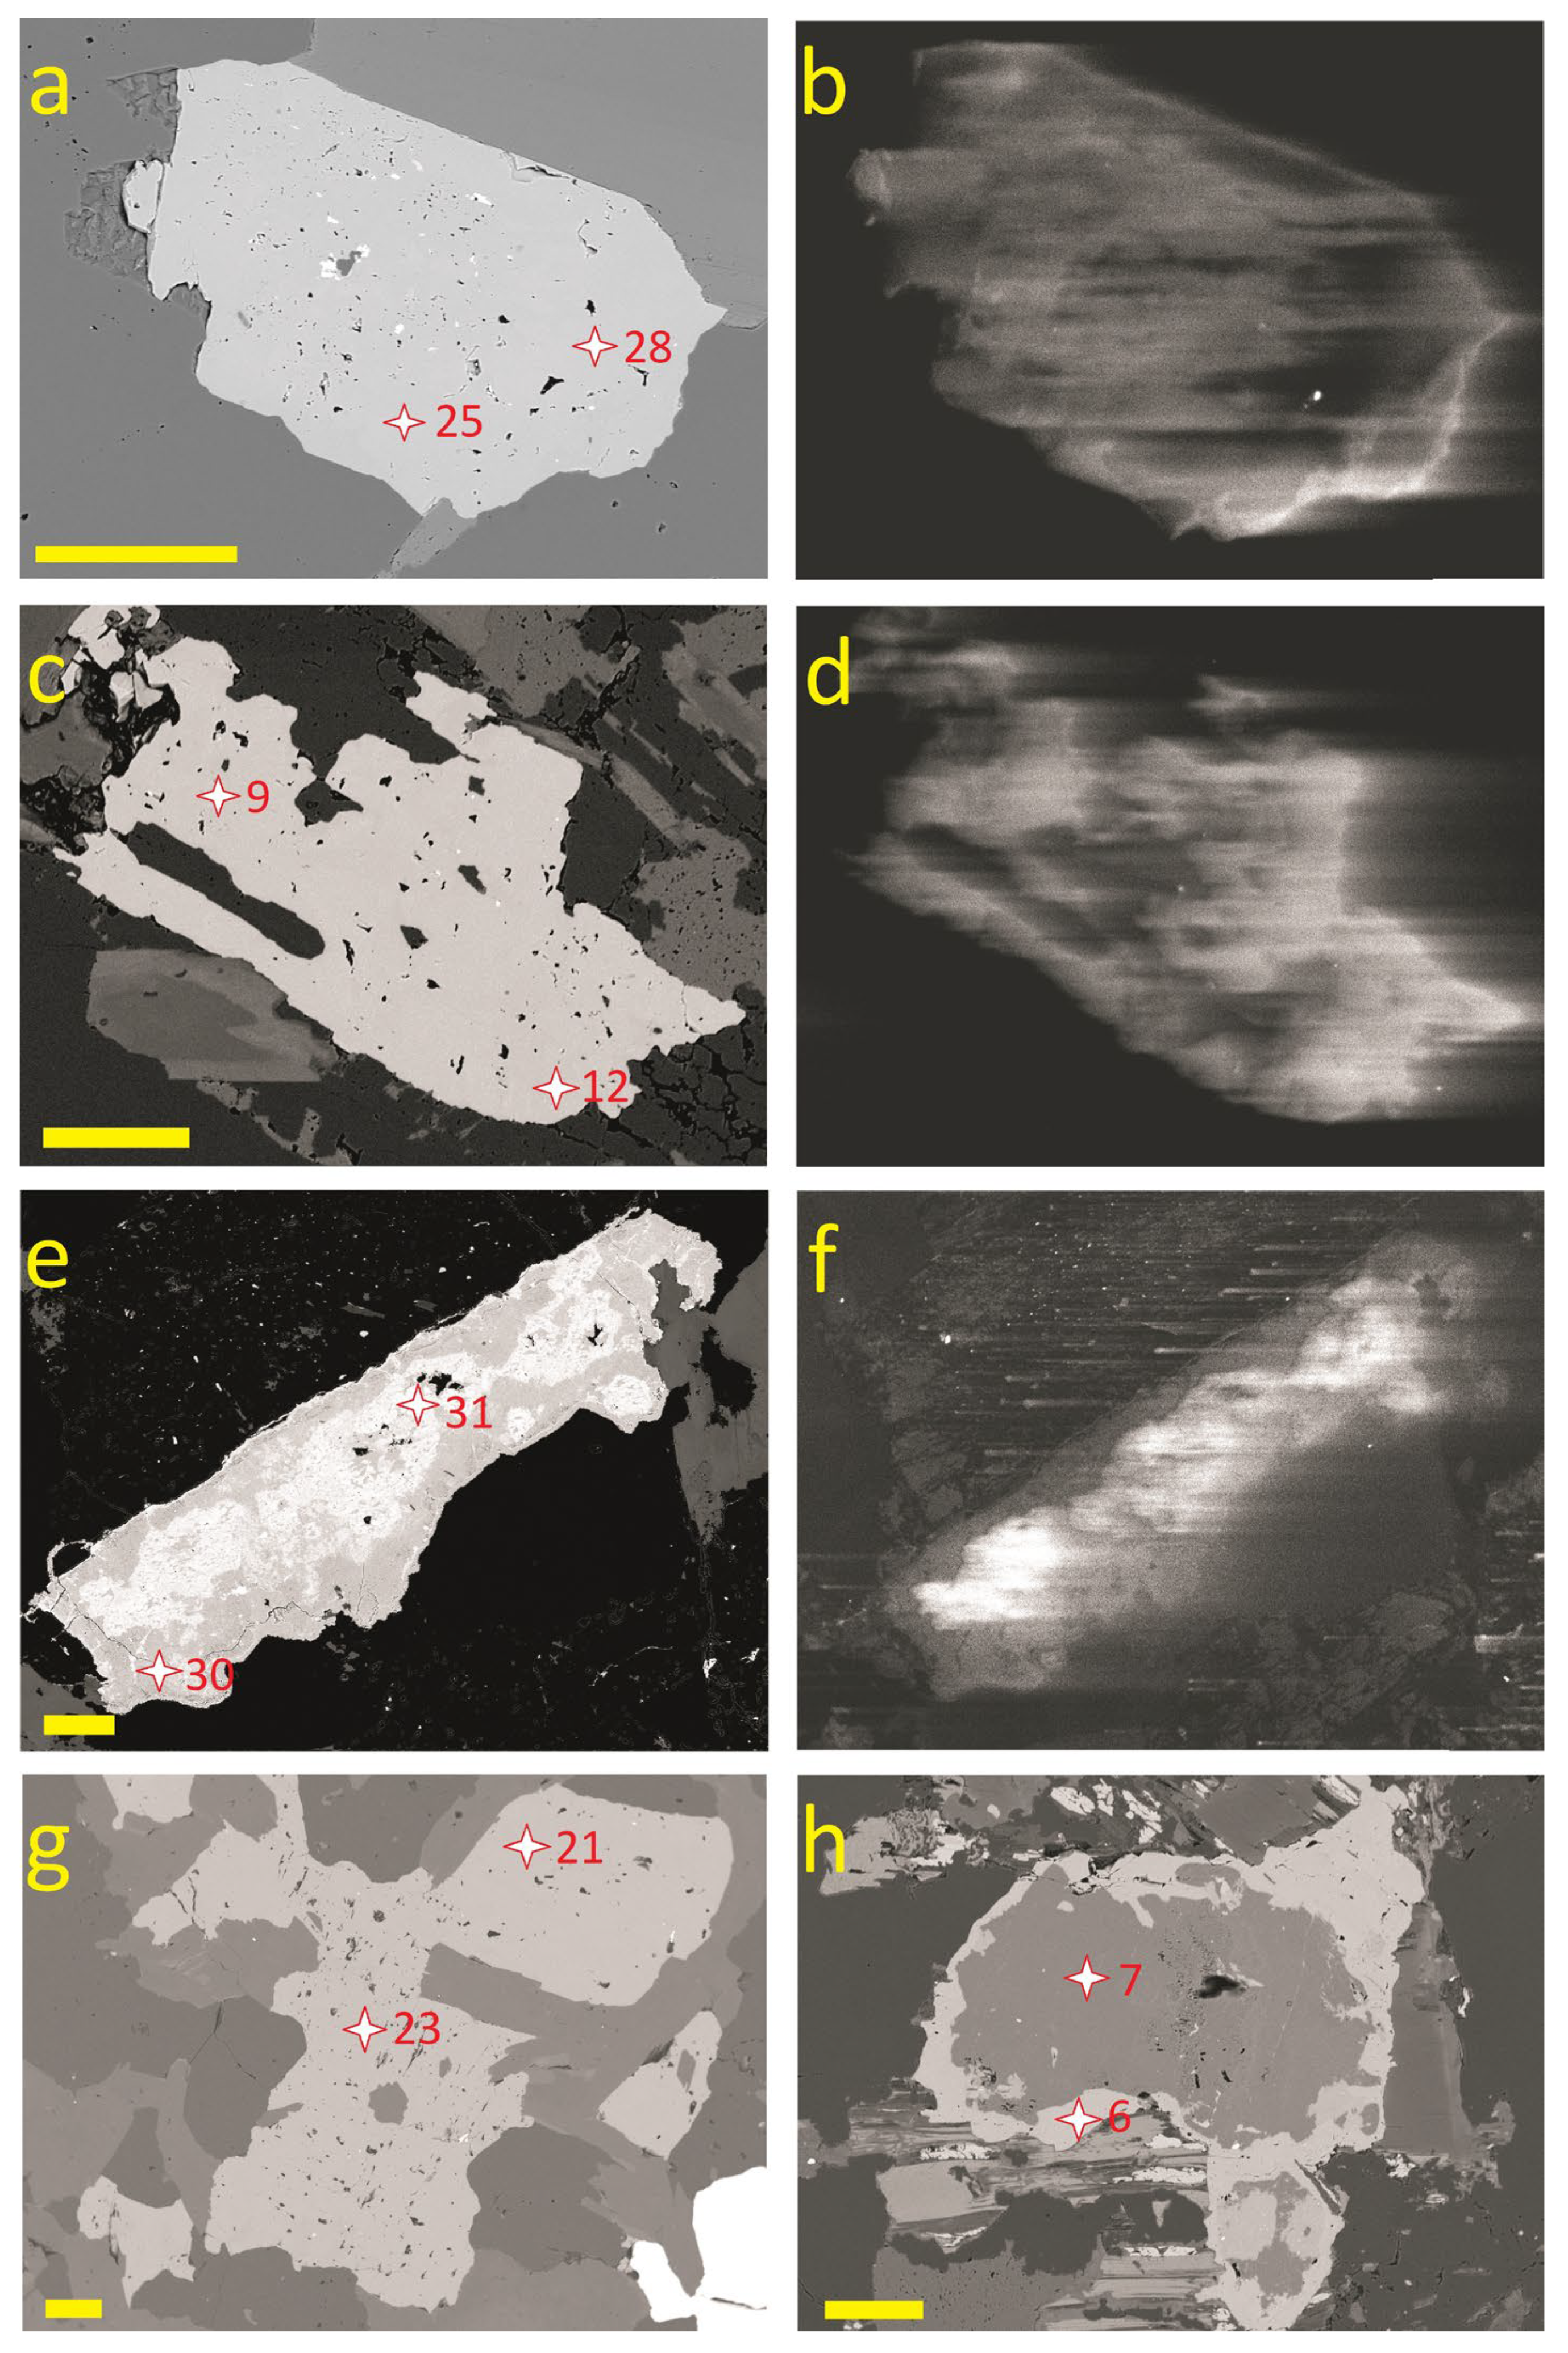
4.5. Feldspars
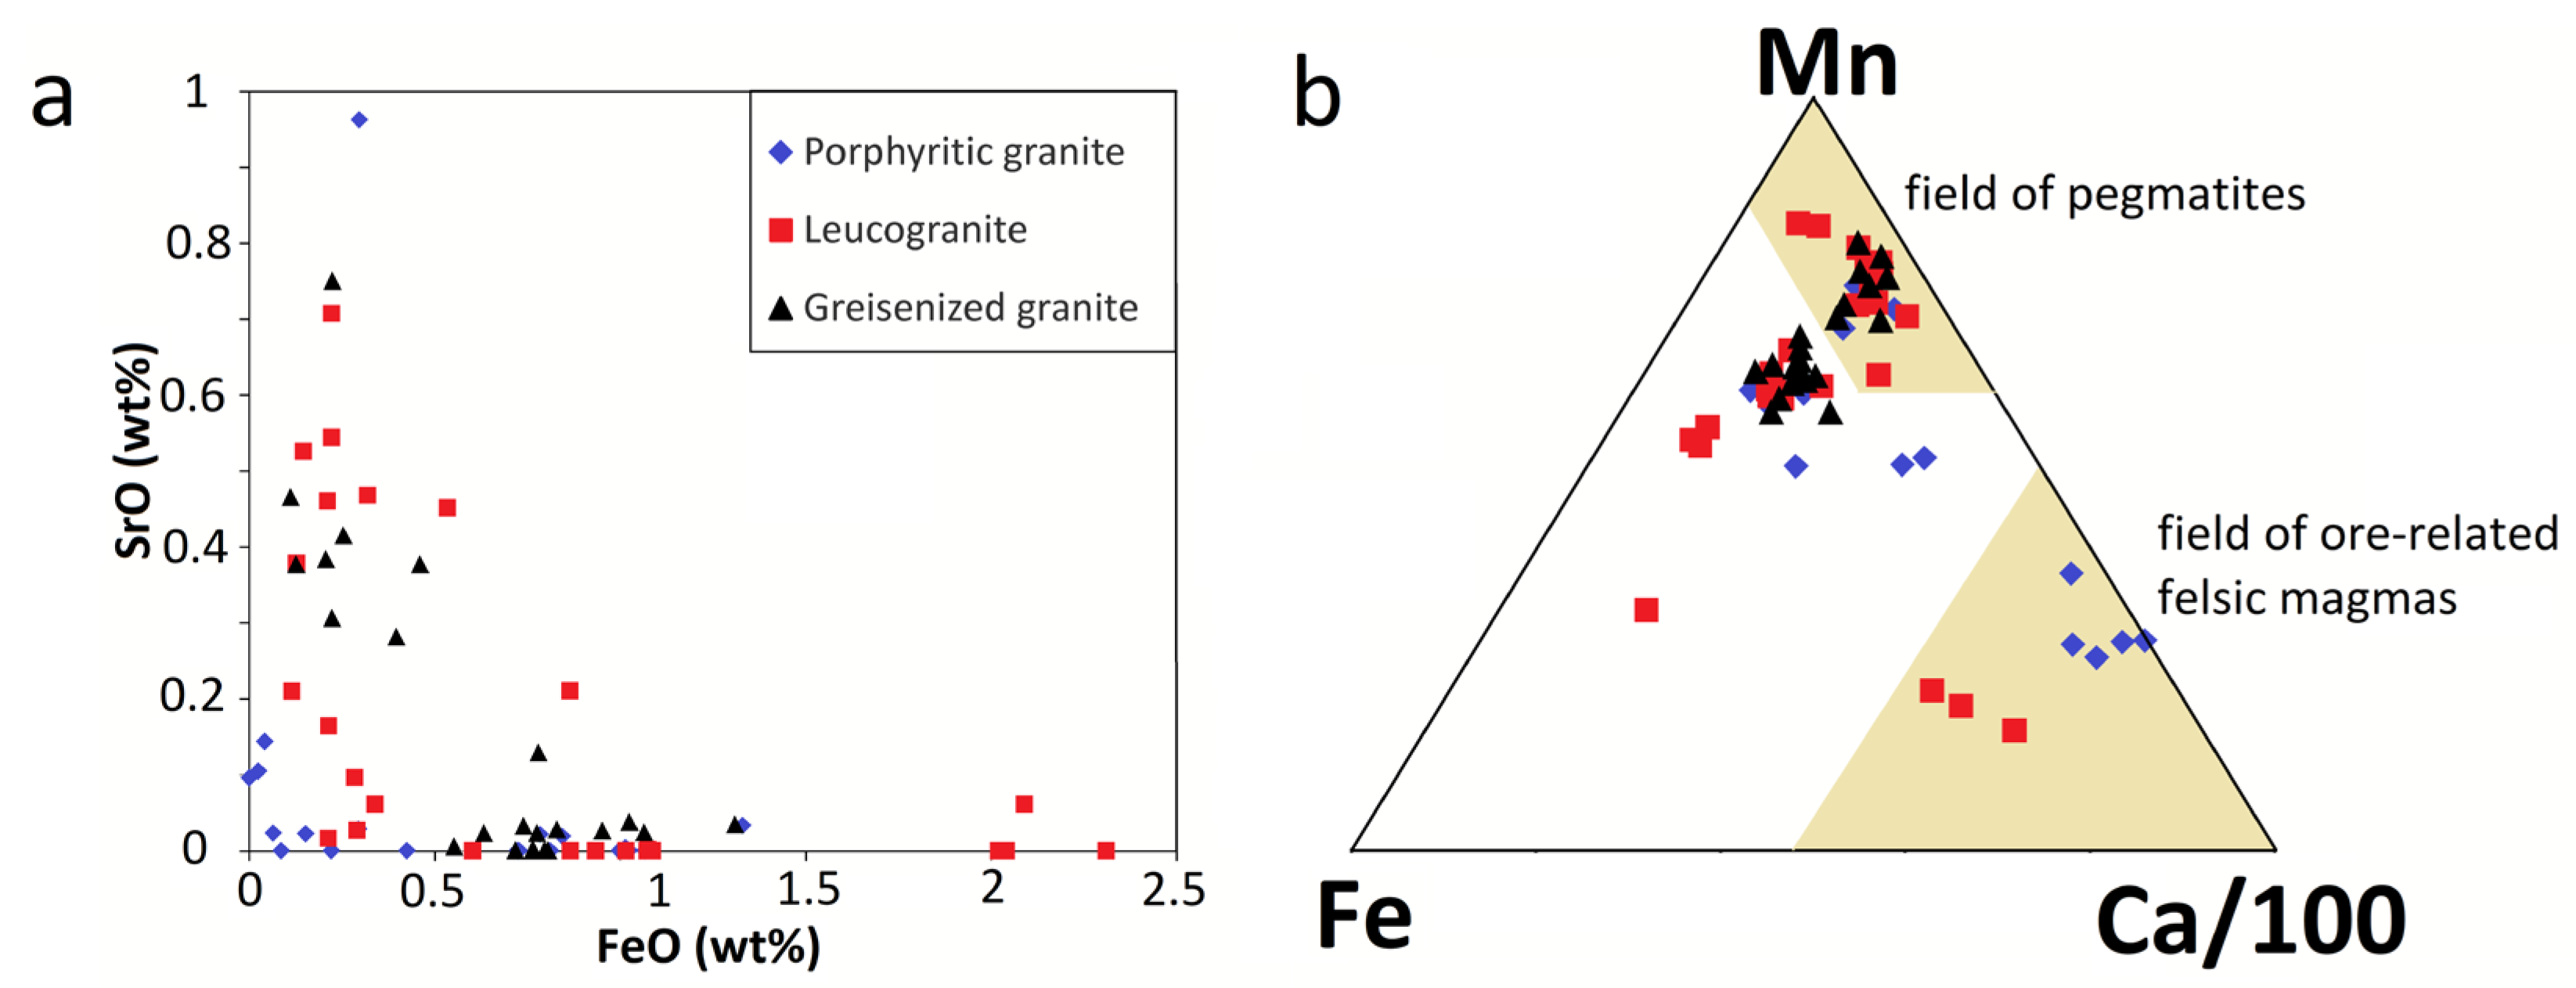
4.6. Apatite
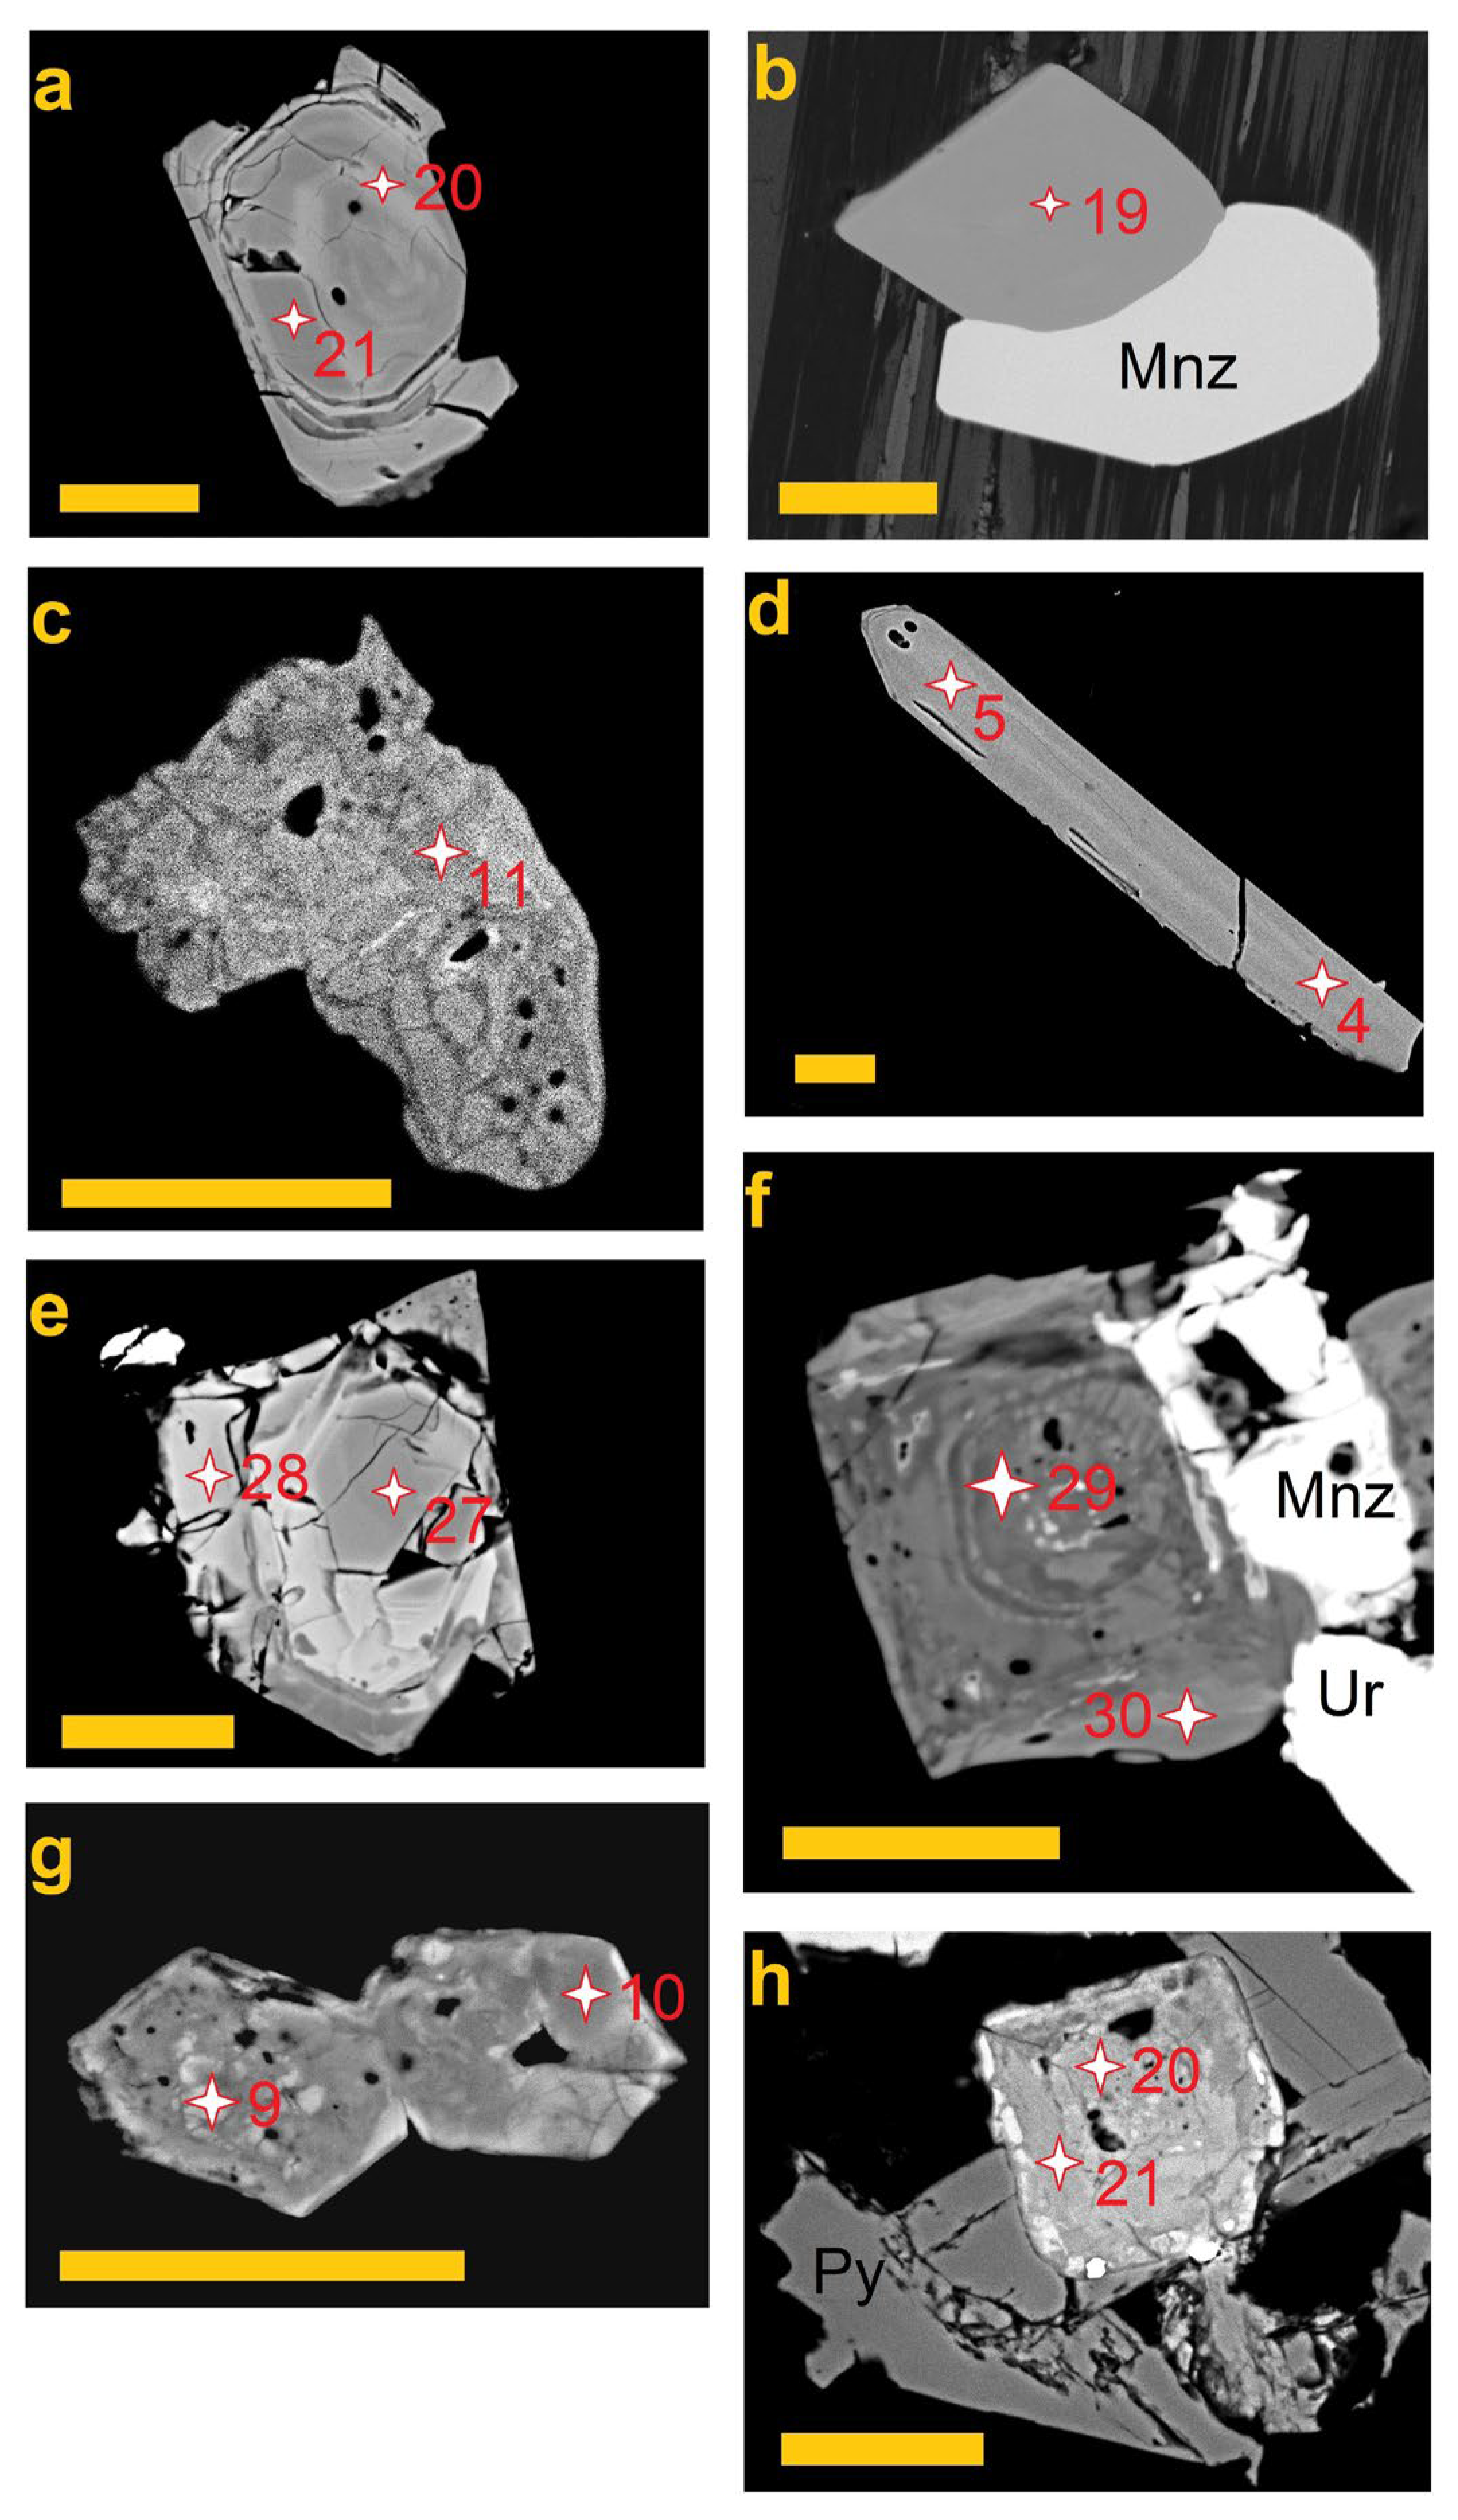
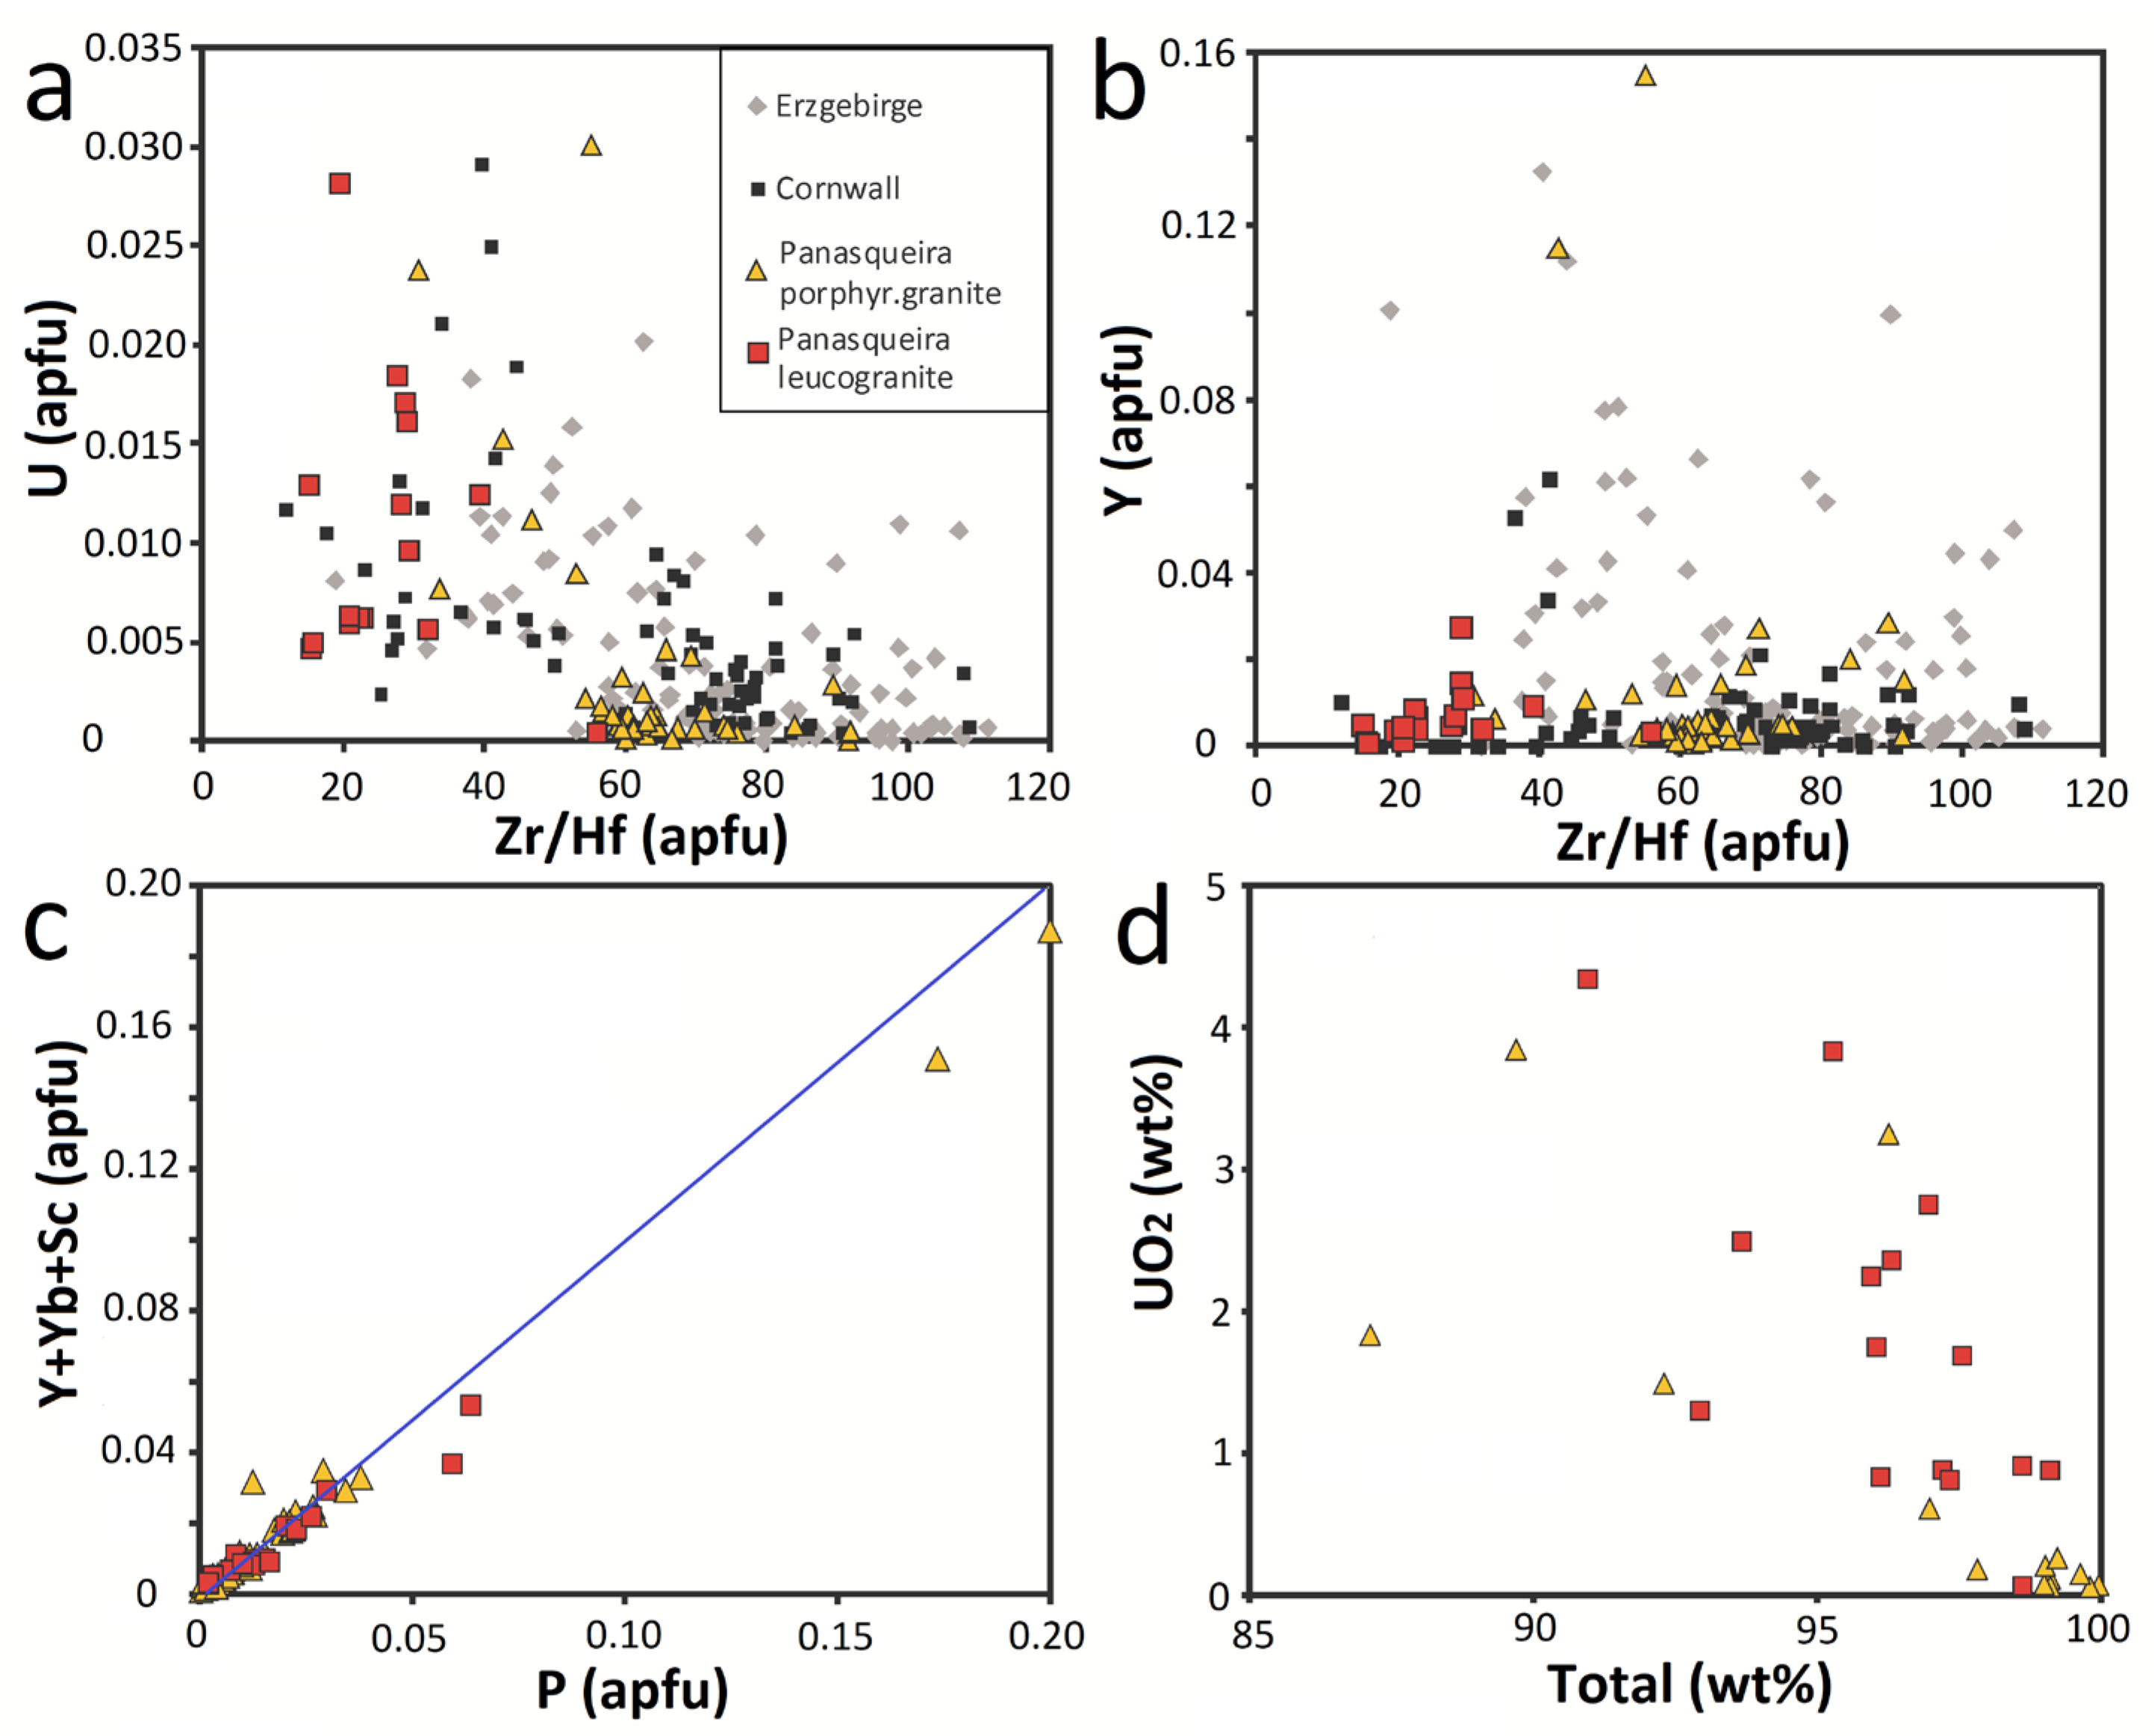
4.7. Zircon
5. Discussion
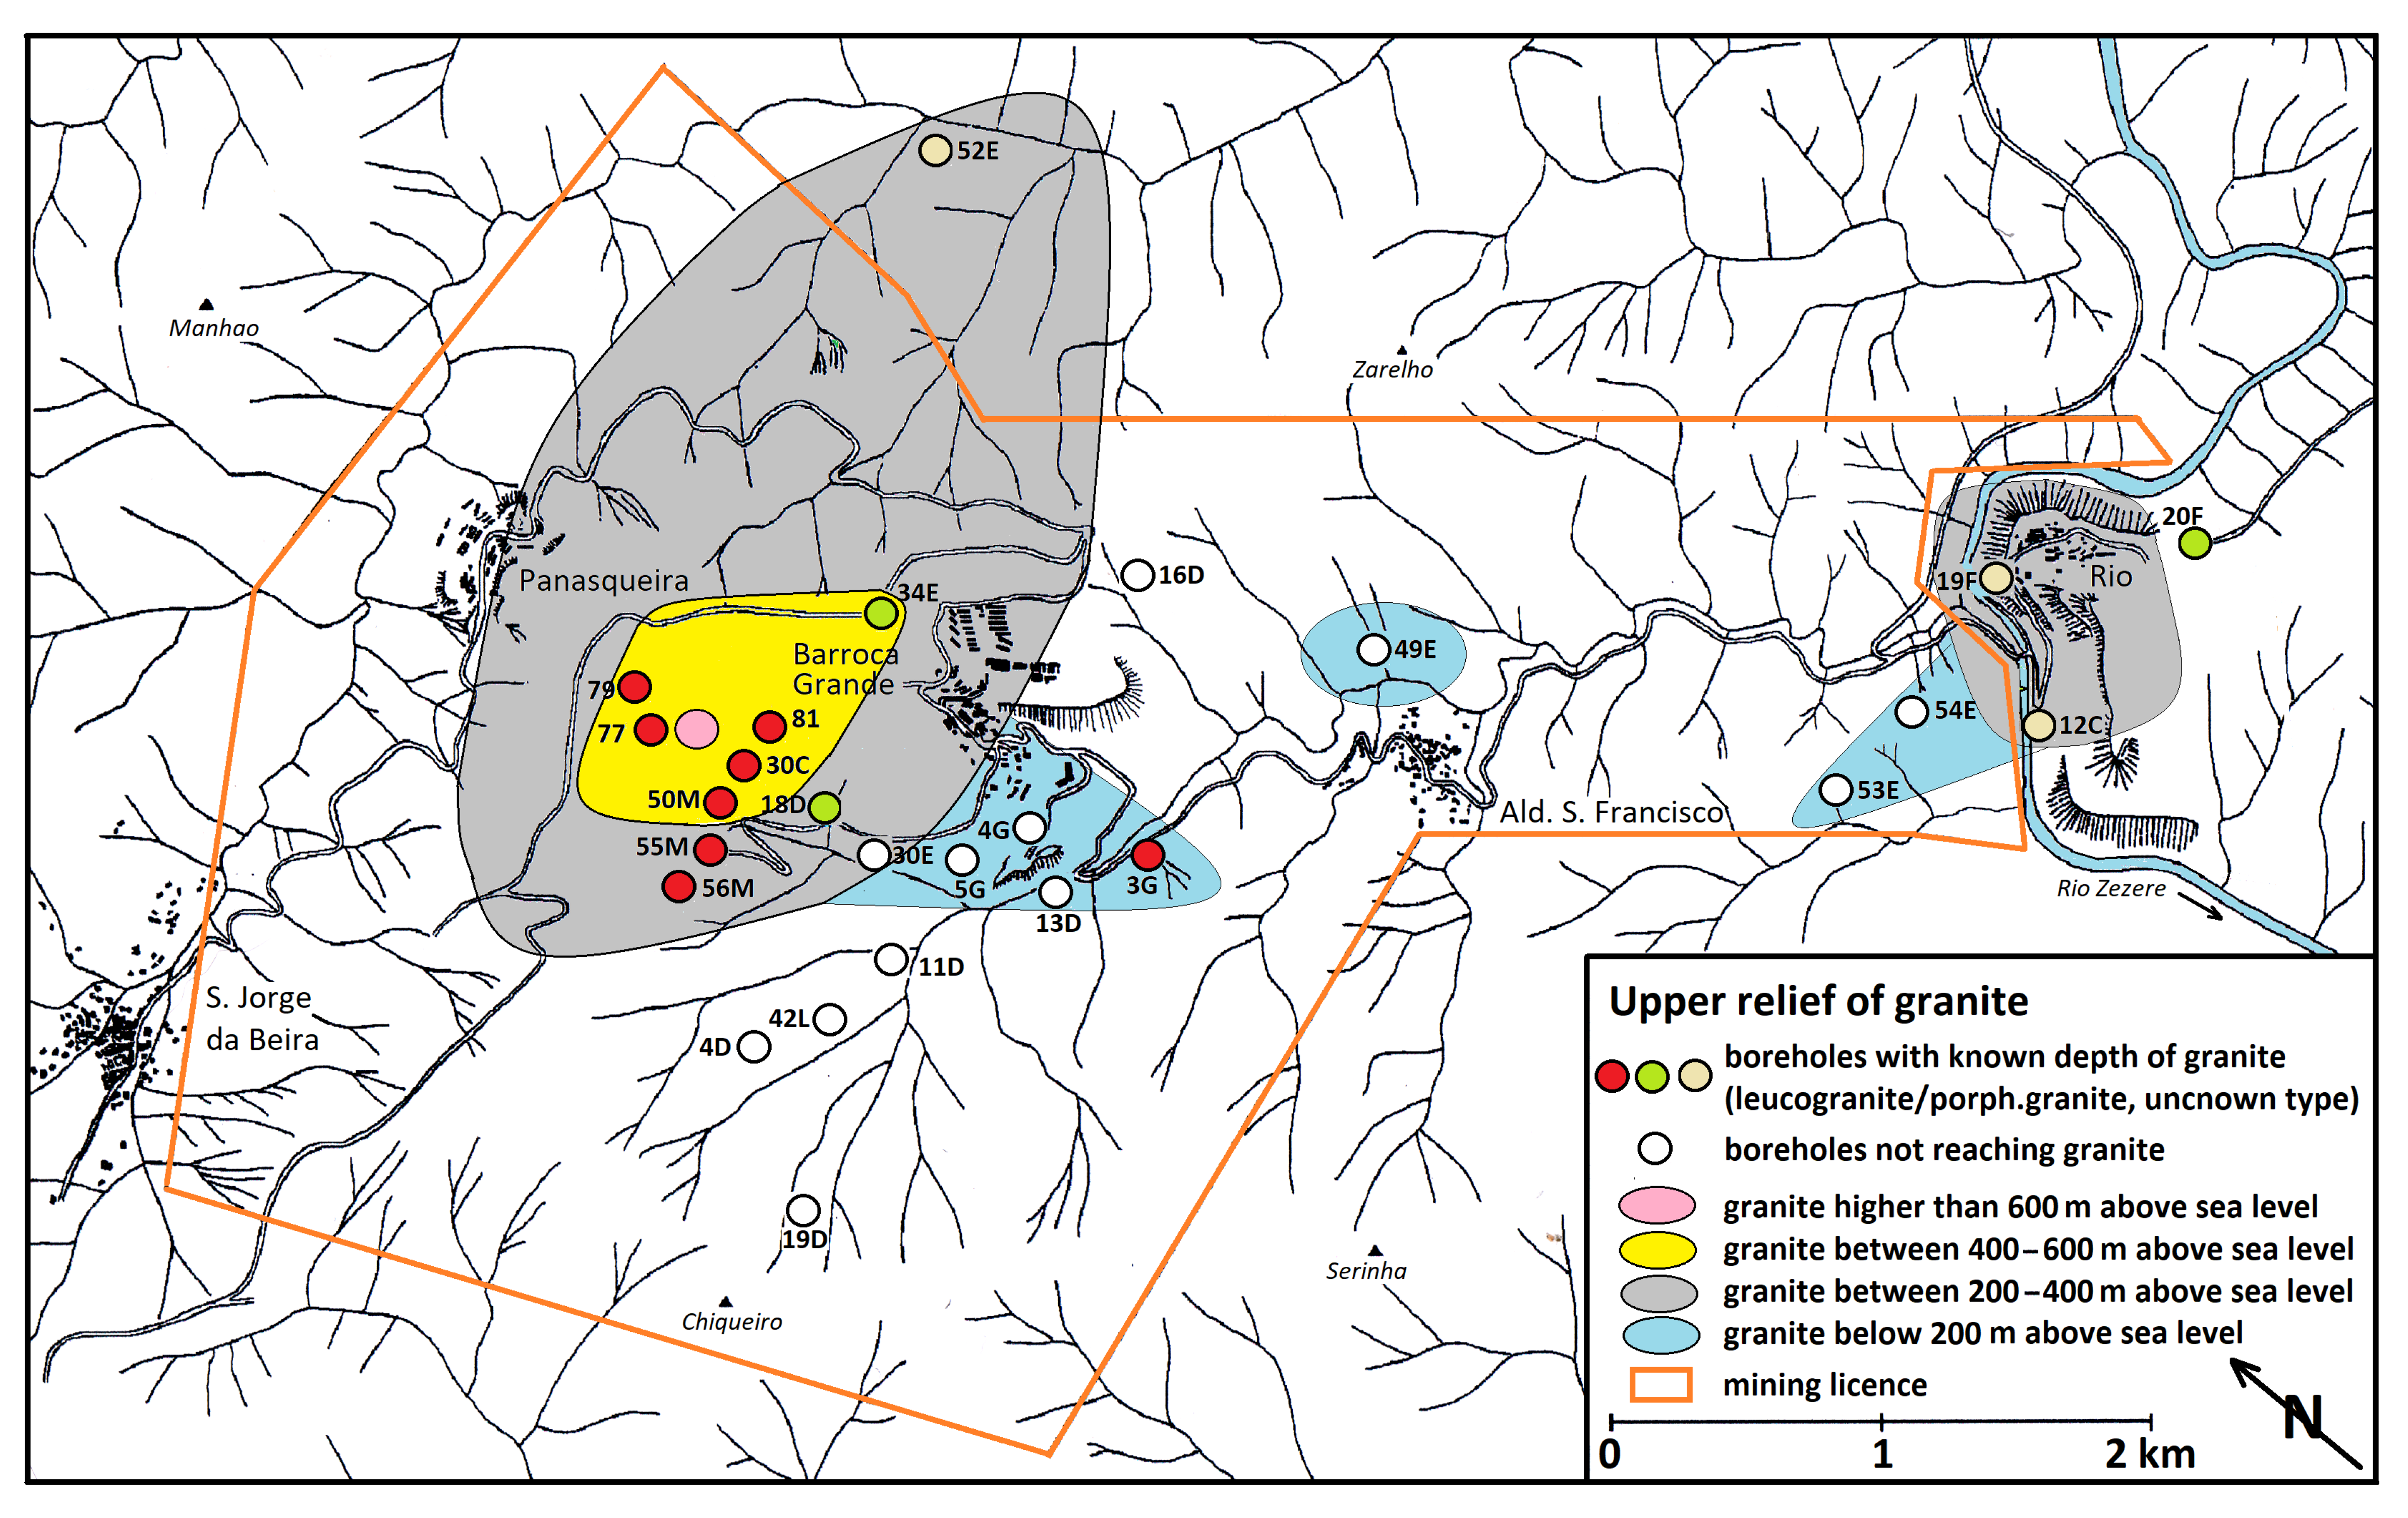
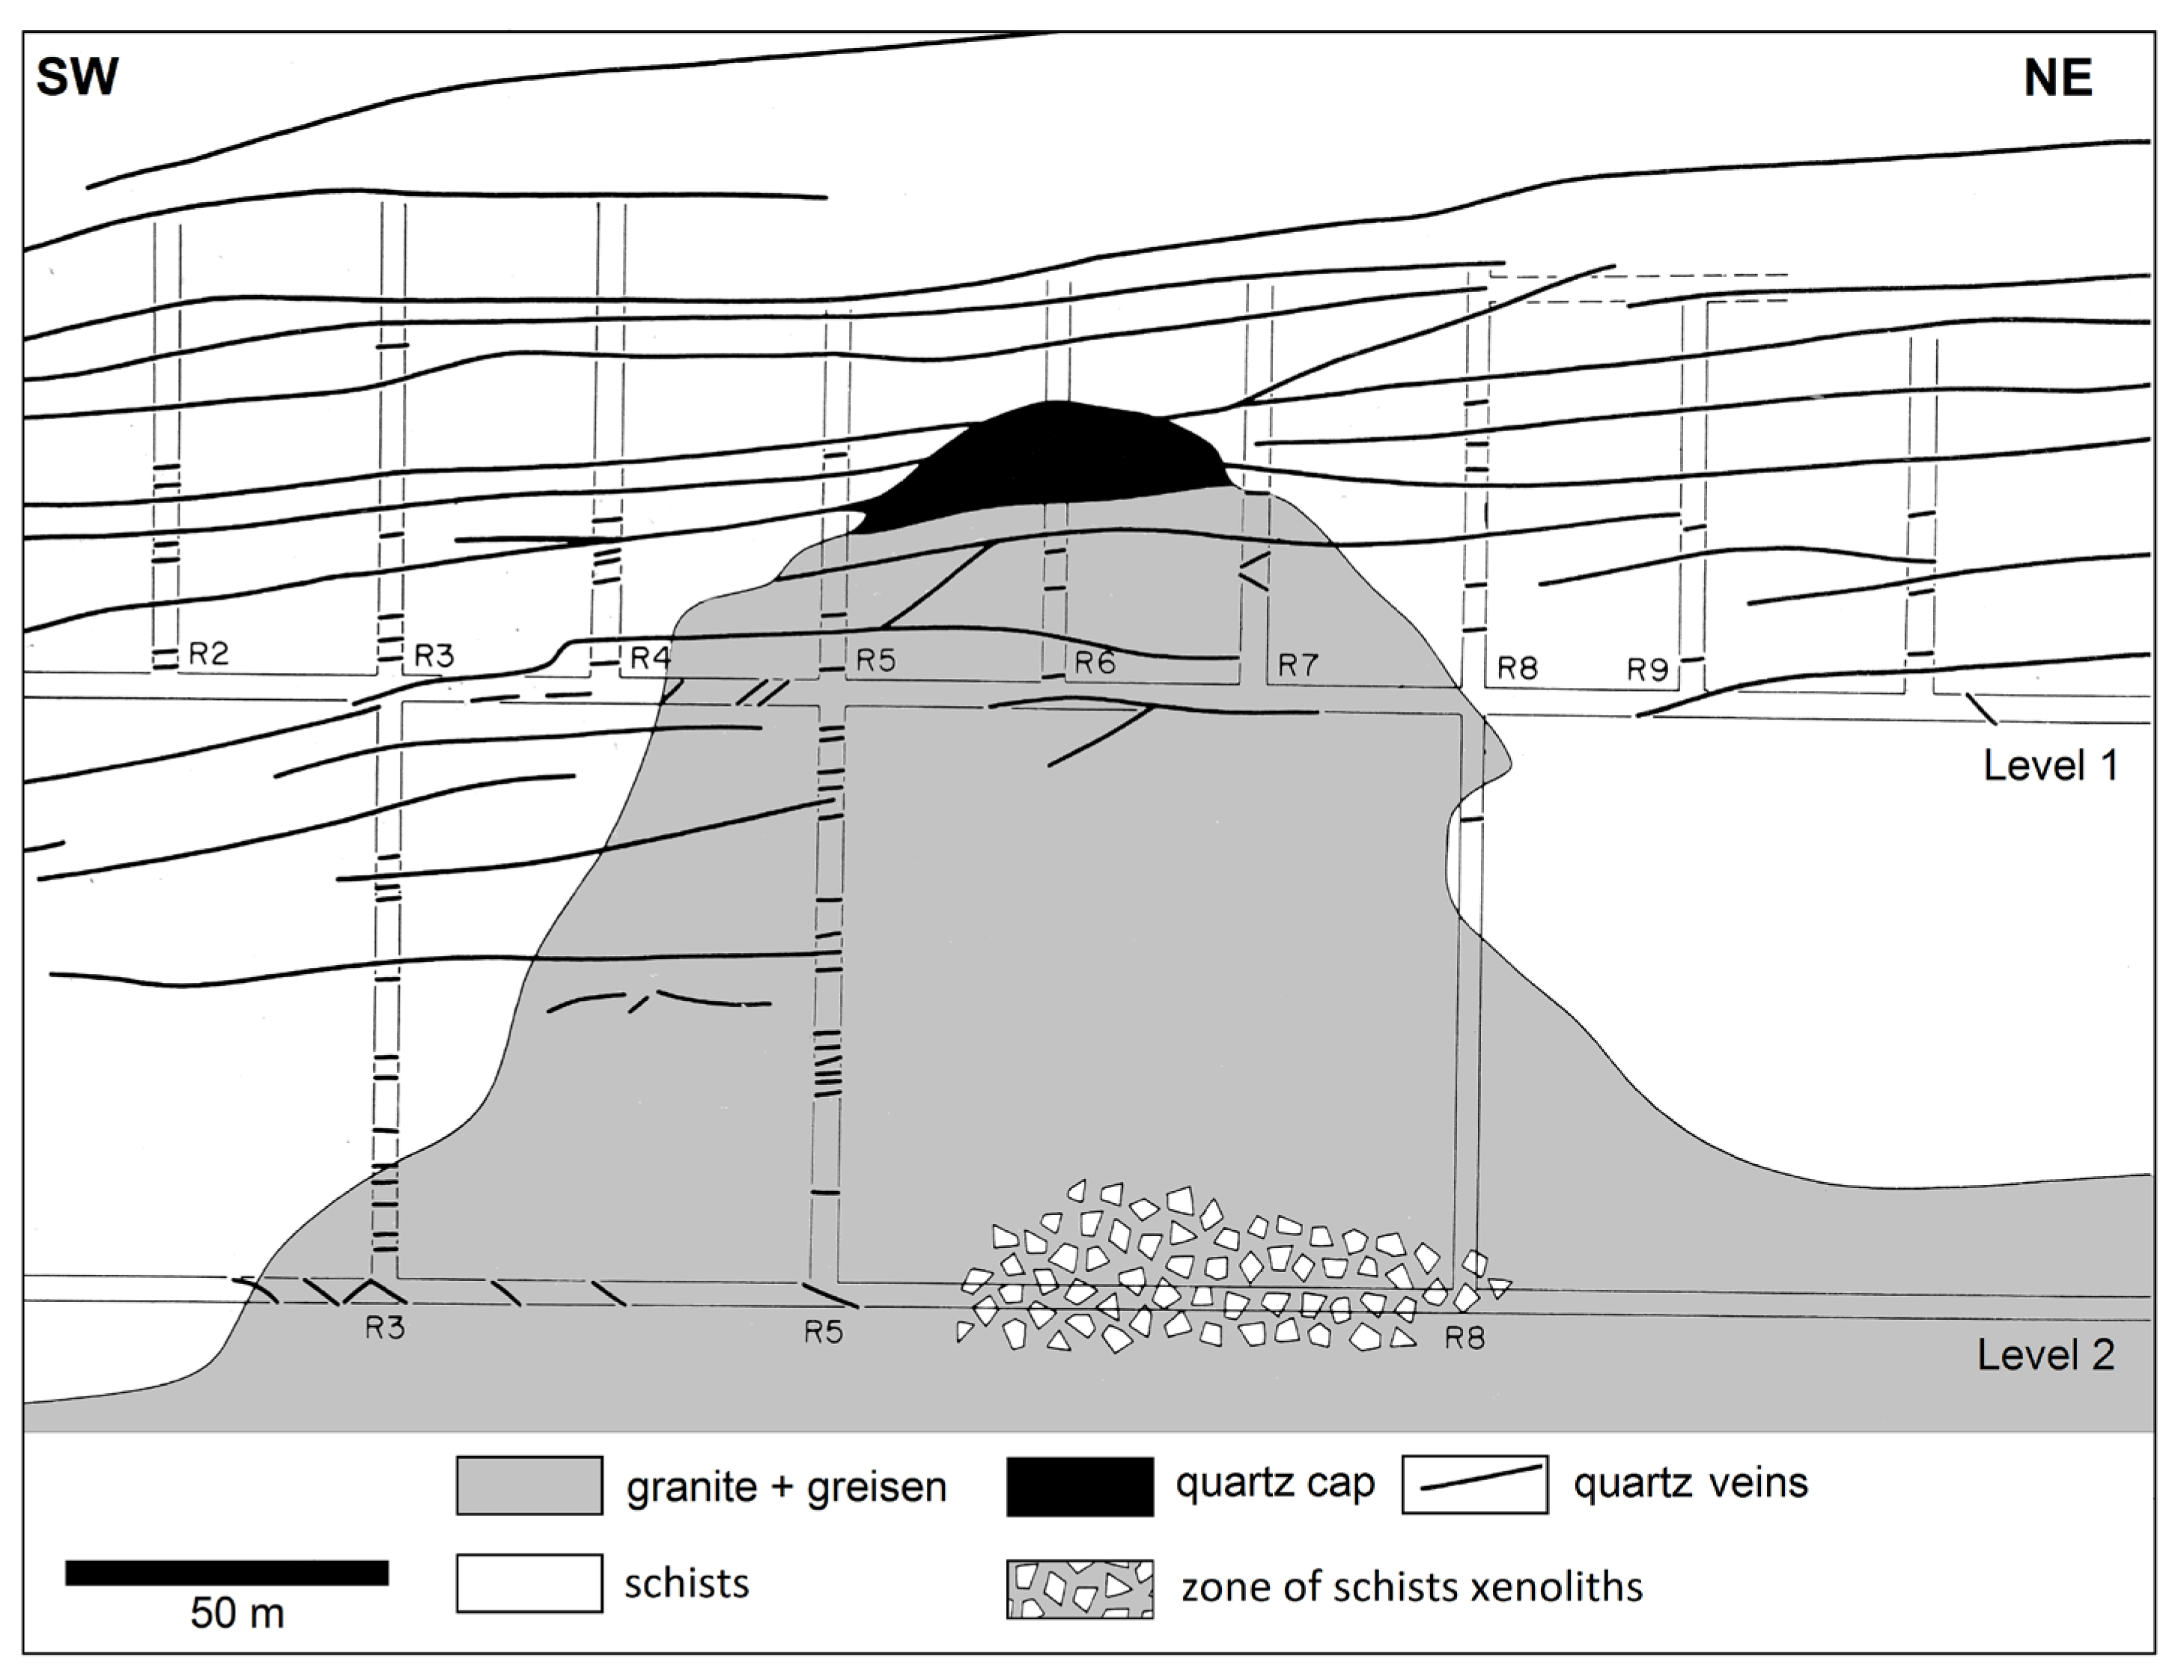
5.1. Evolution of the Panasqueira Hidden Pluton
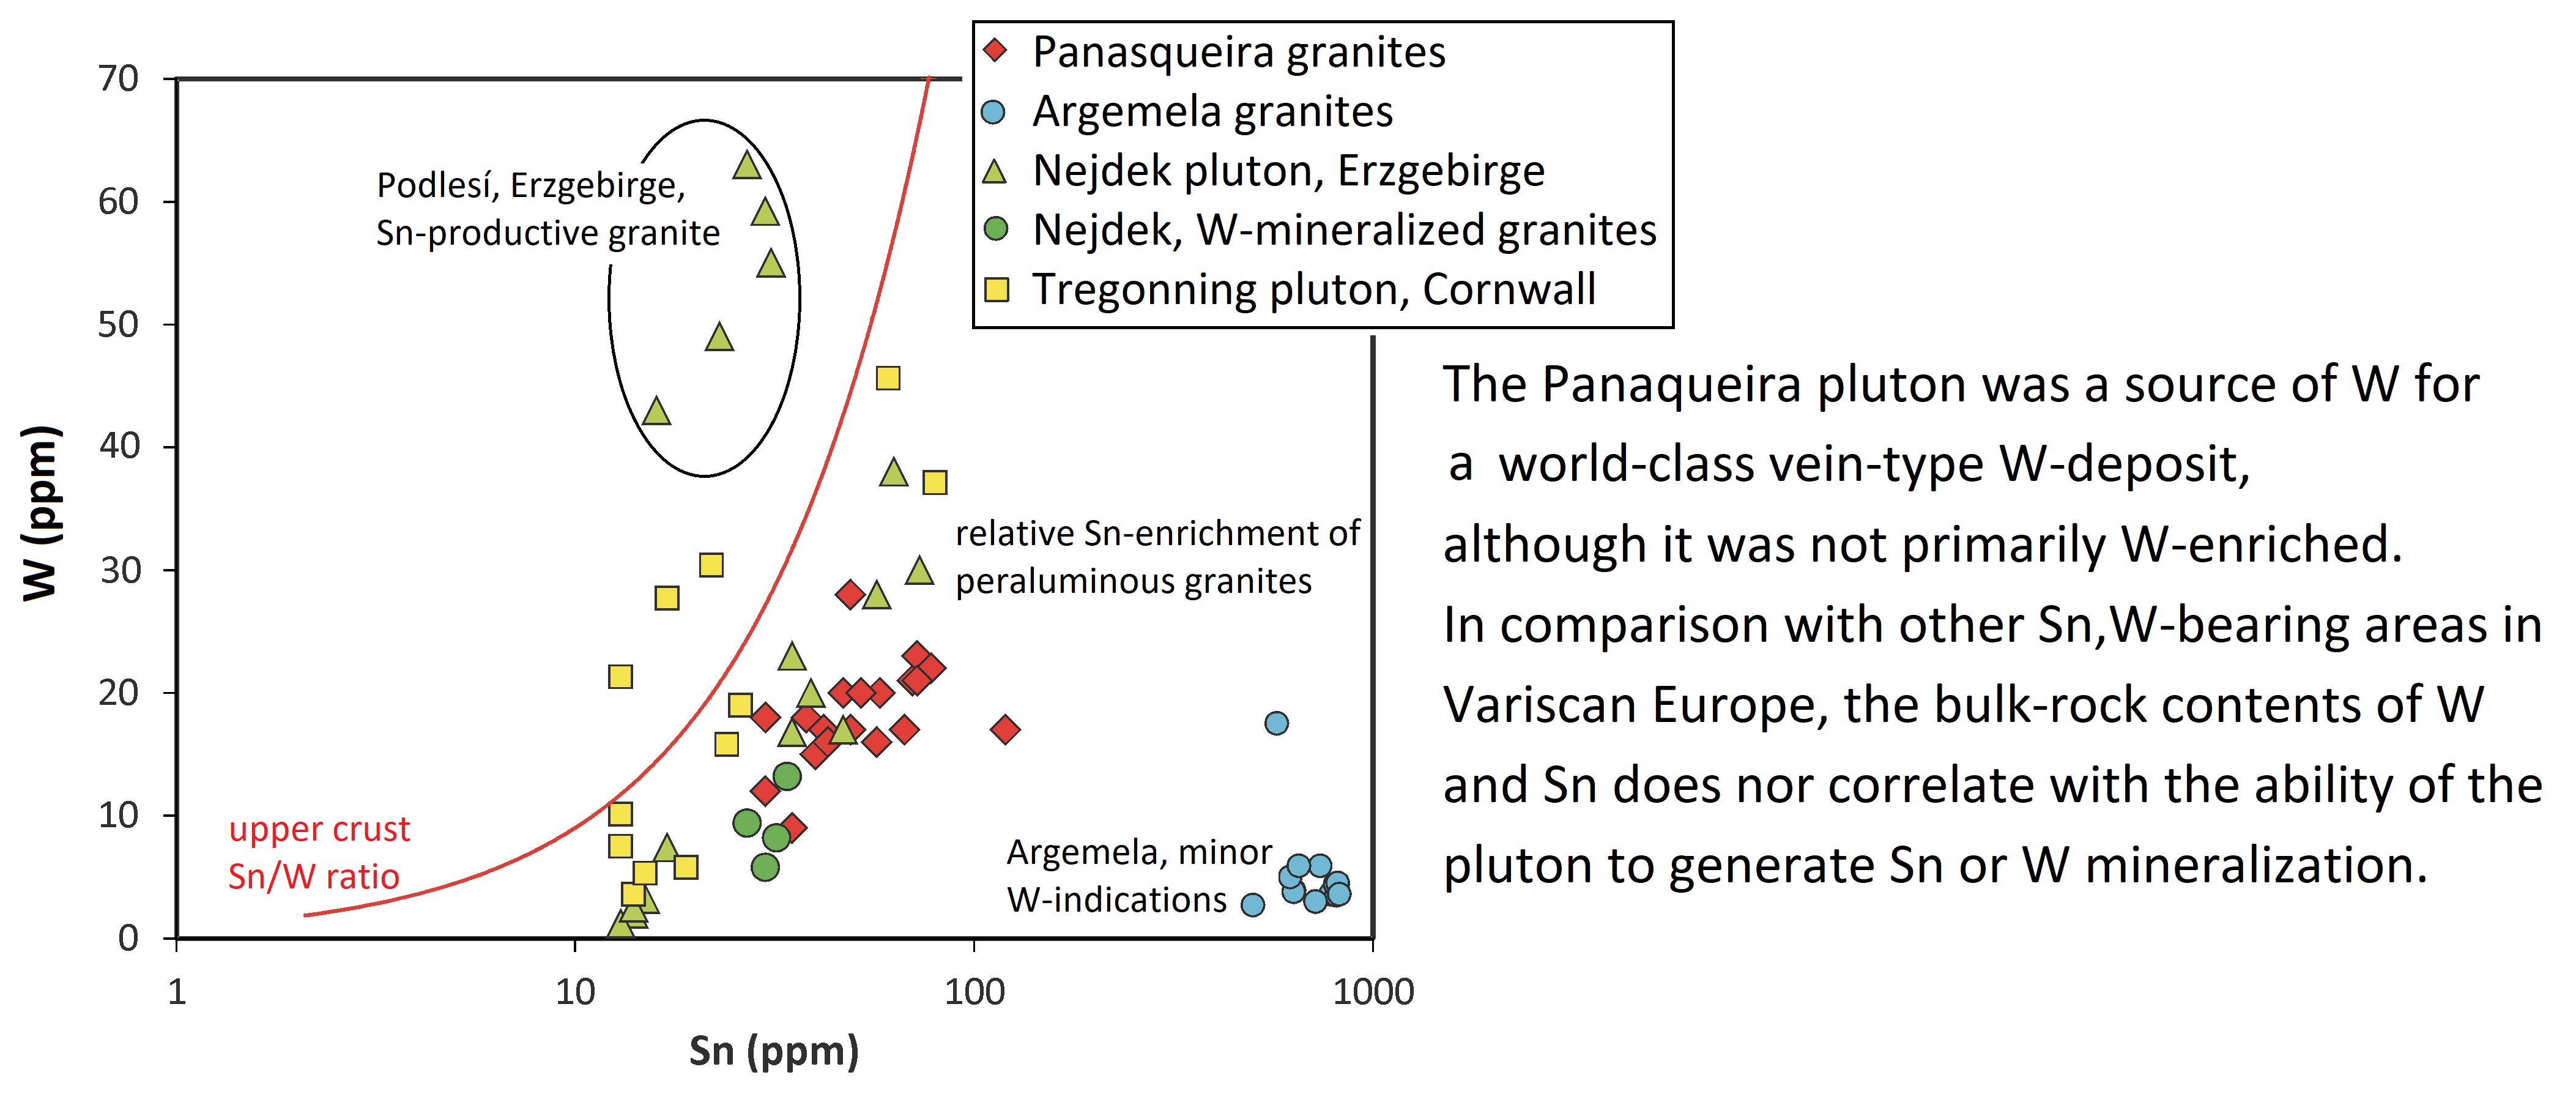
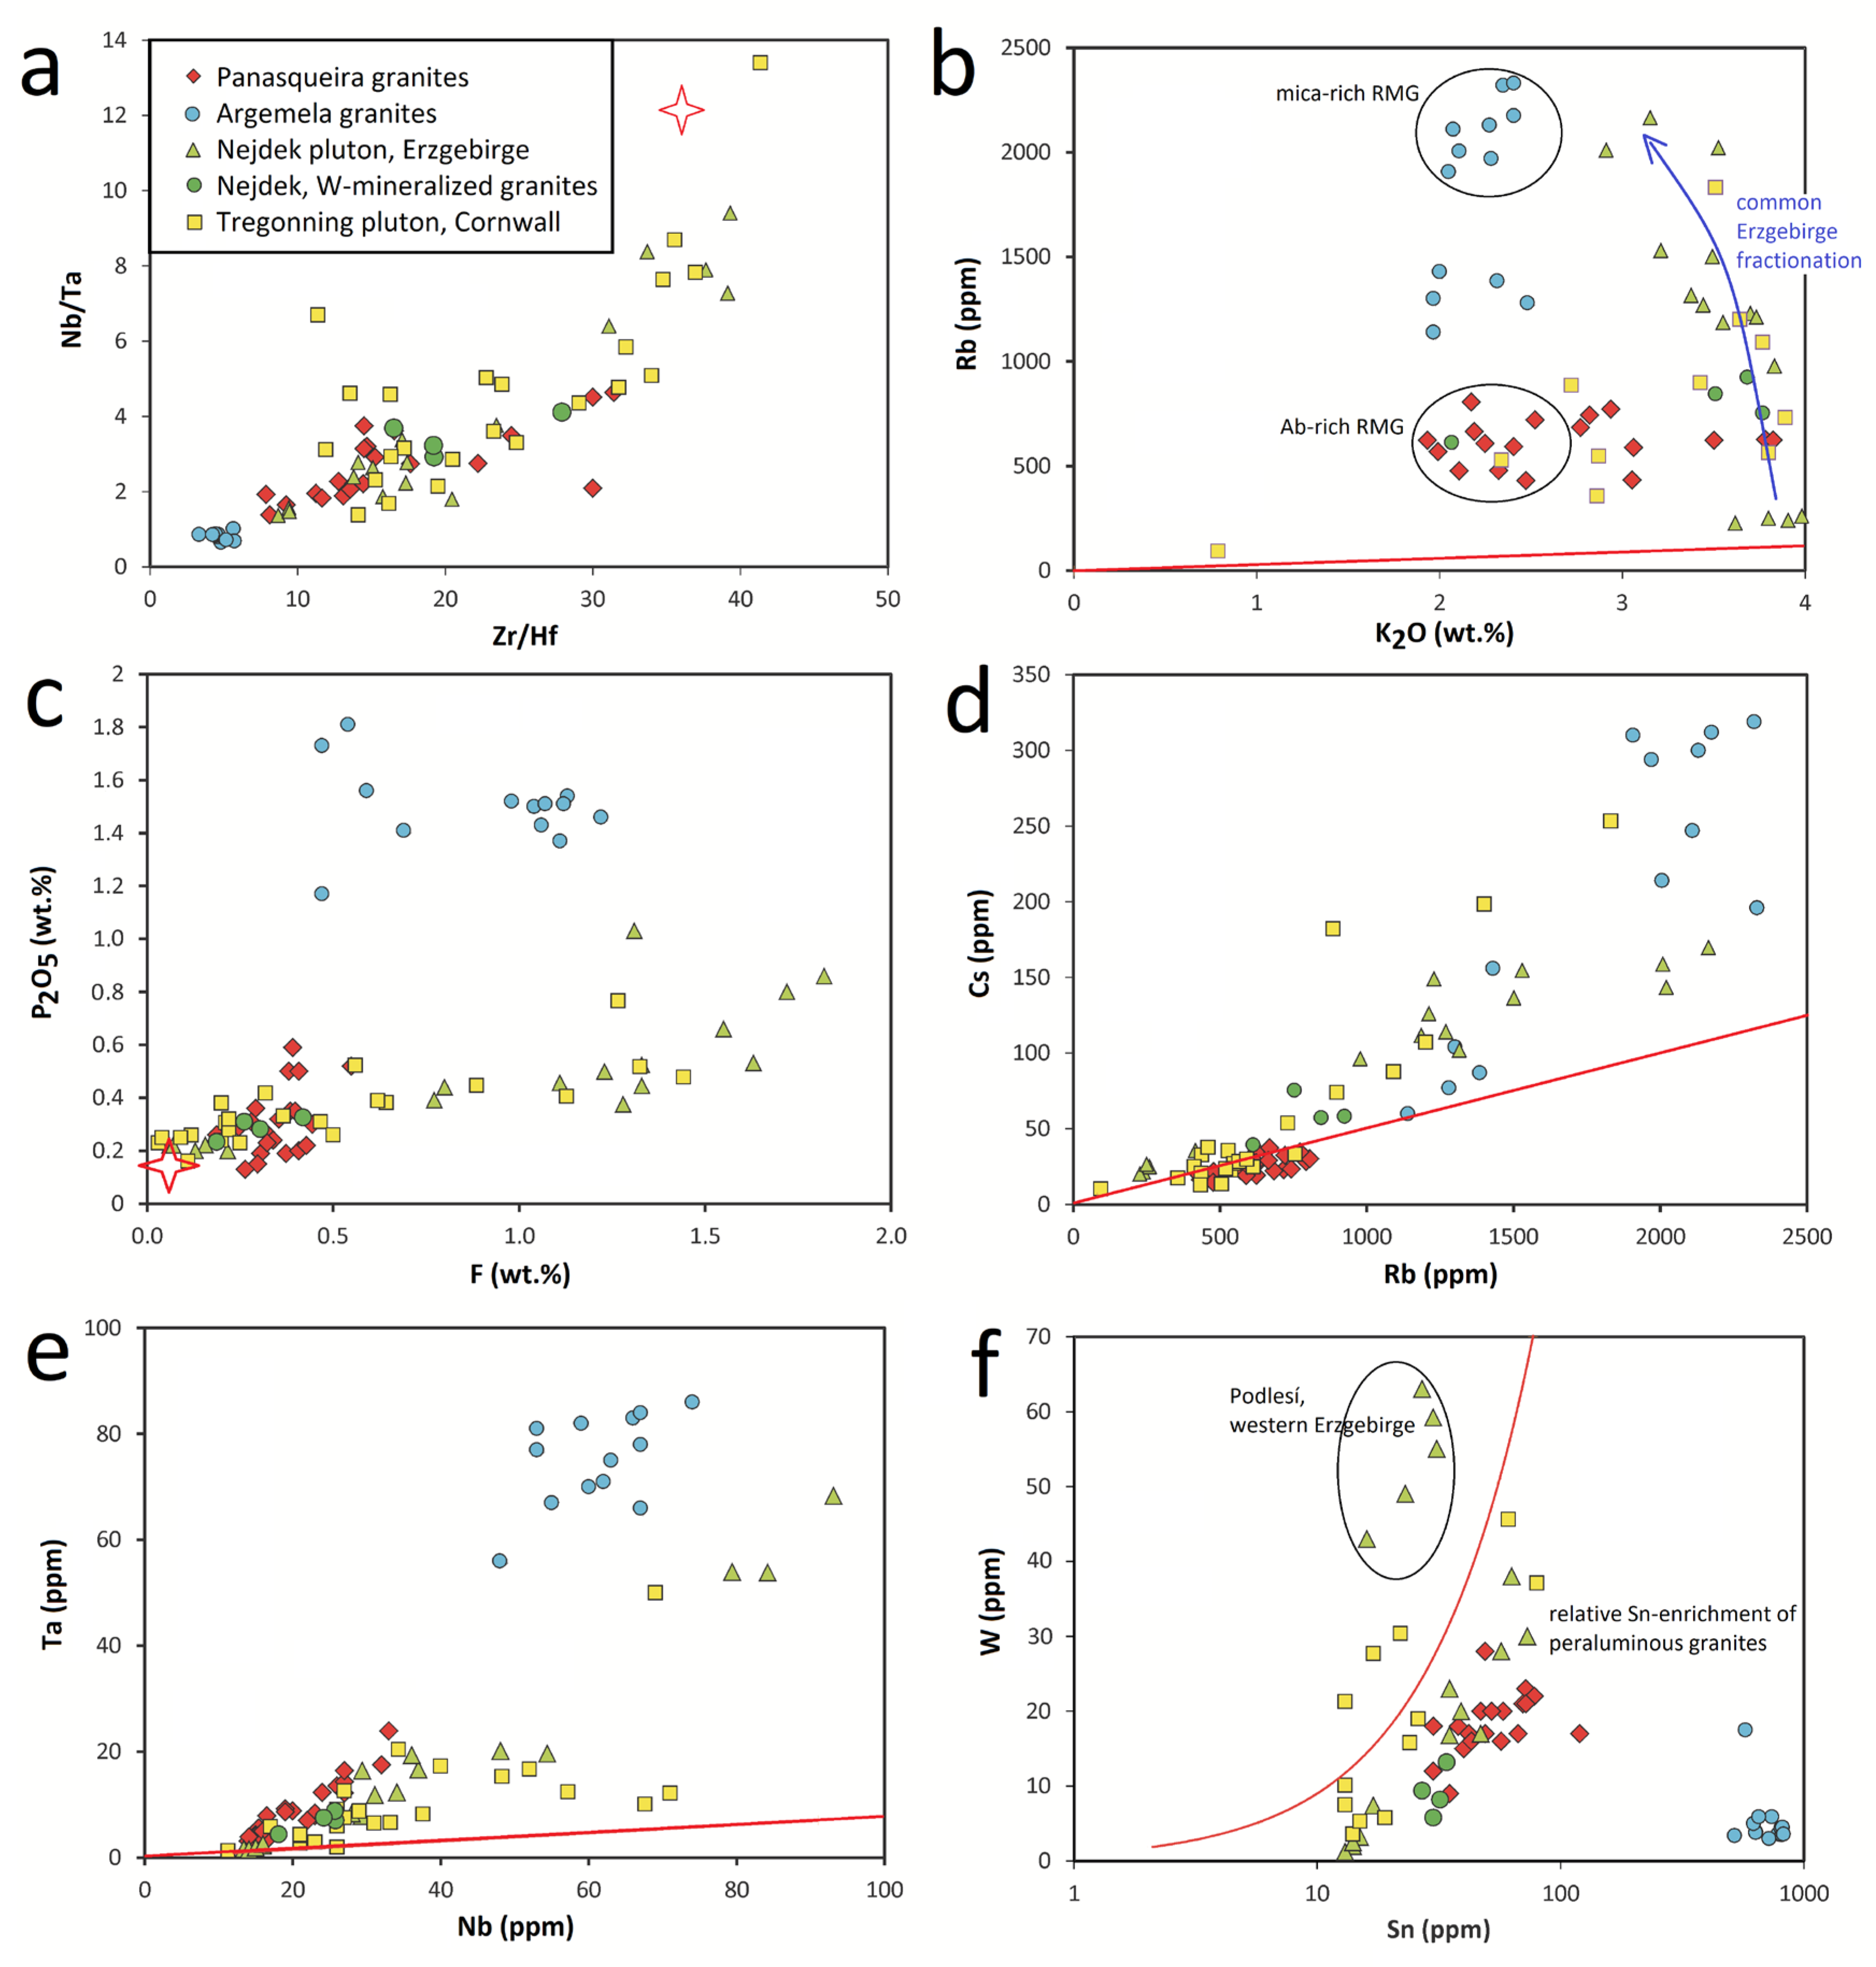
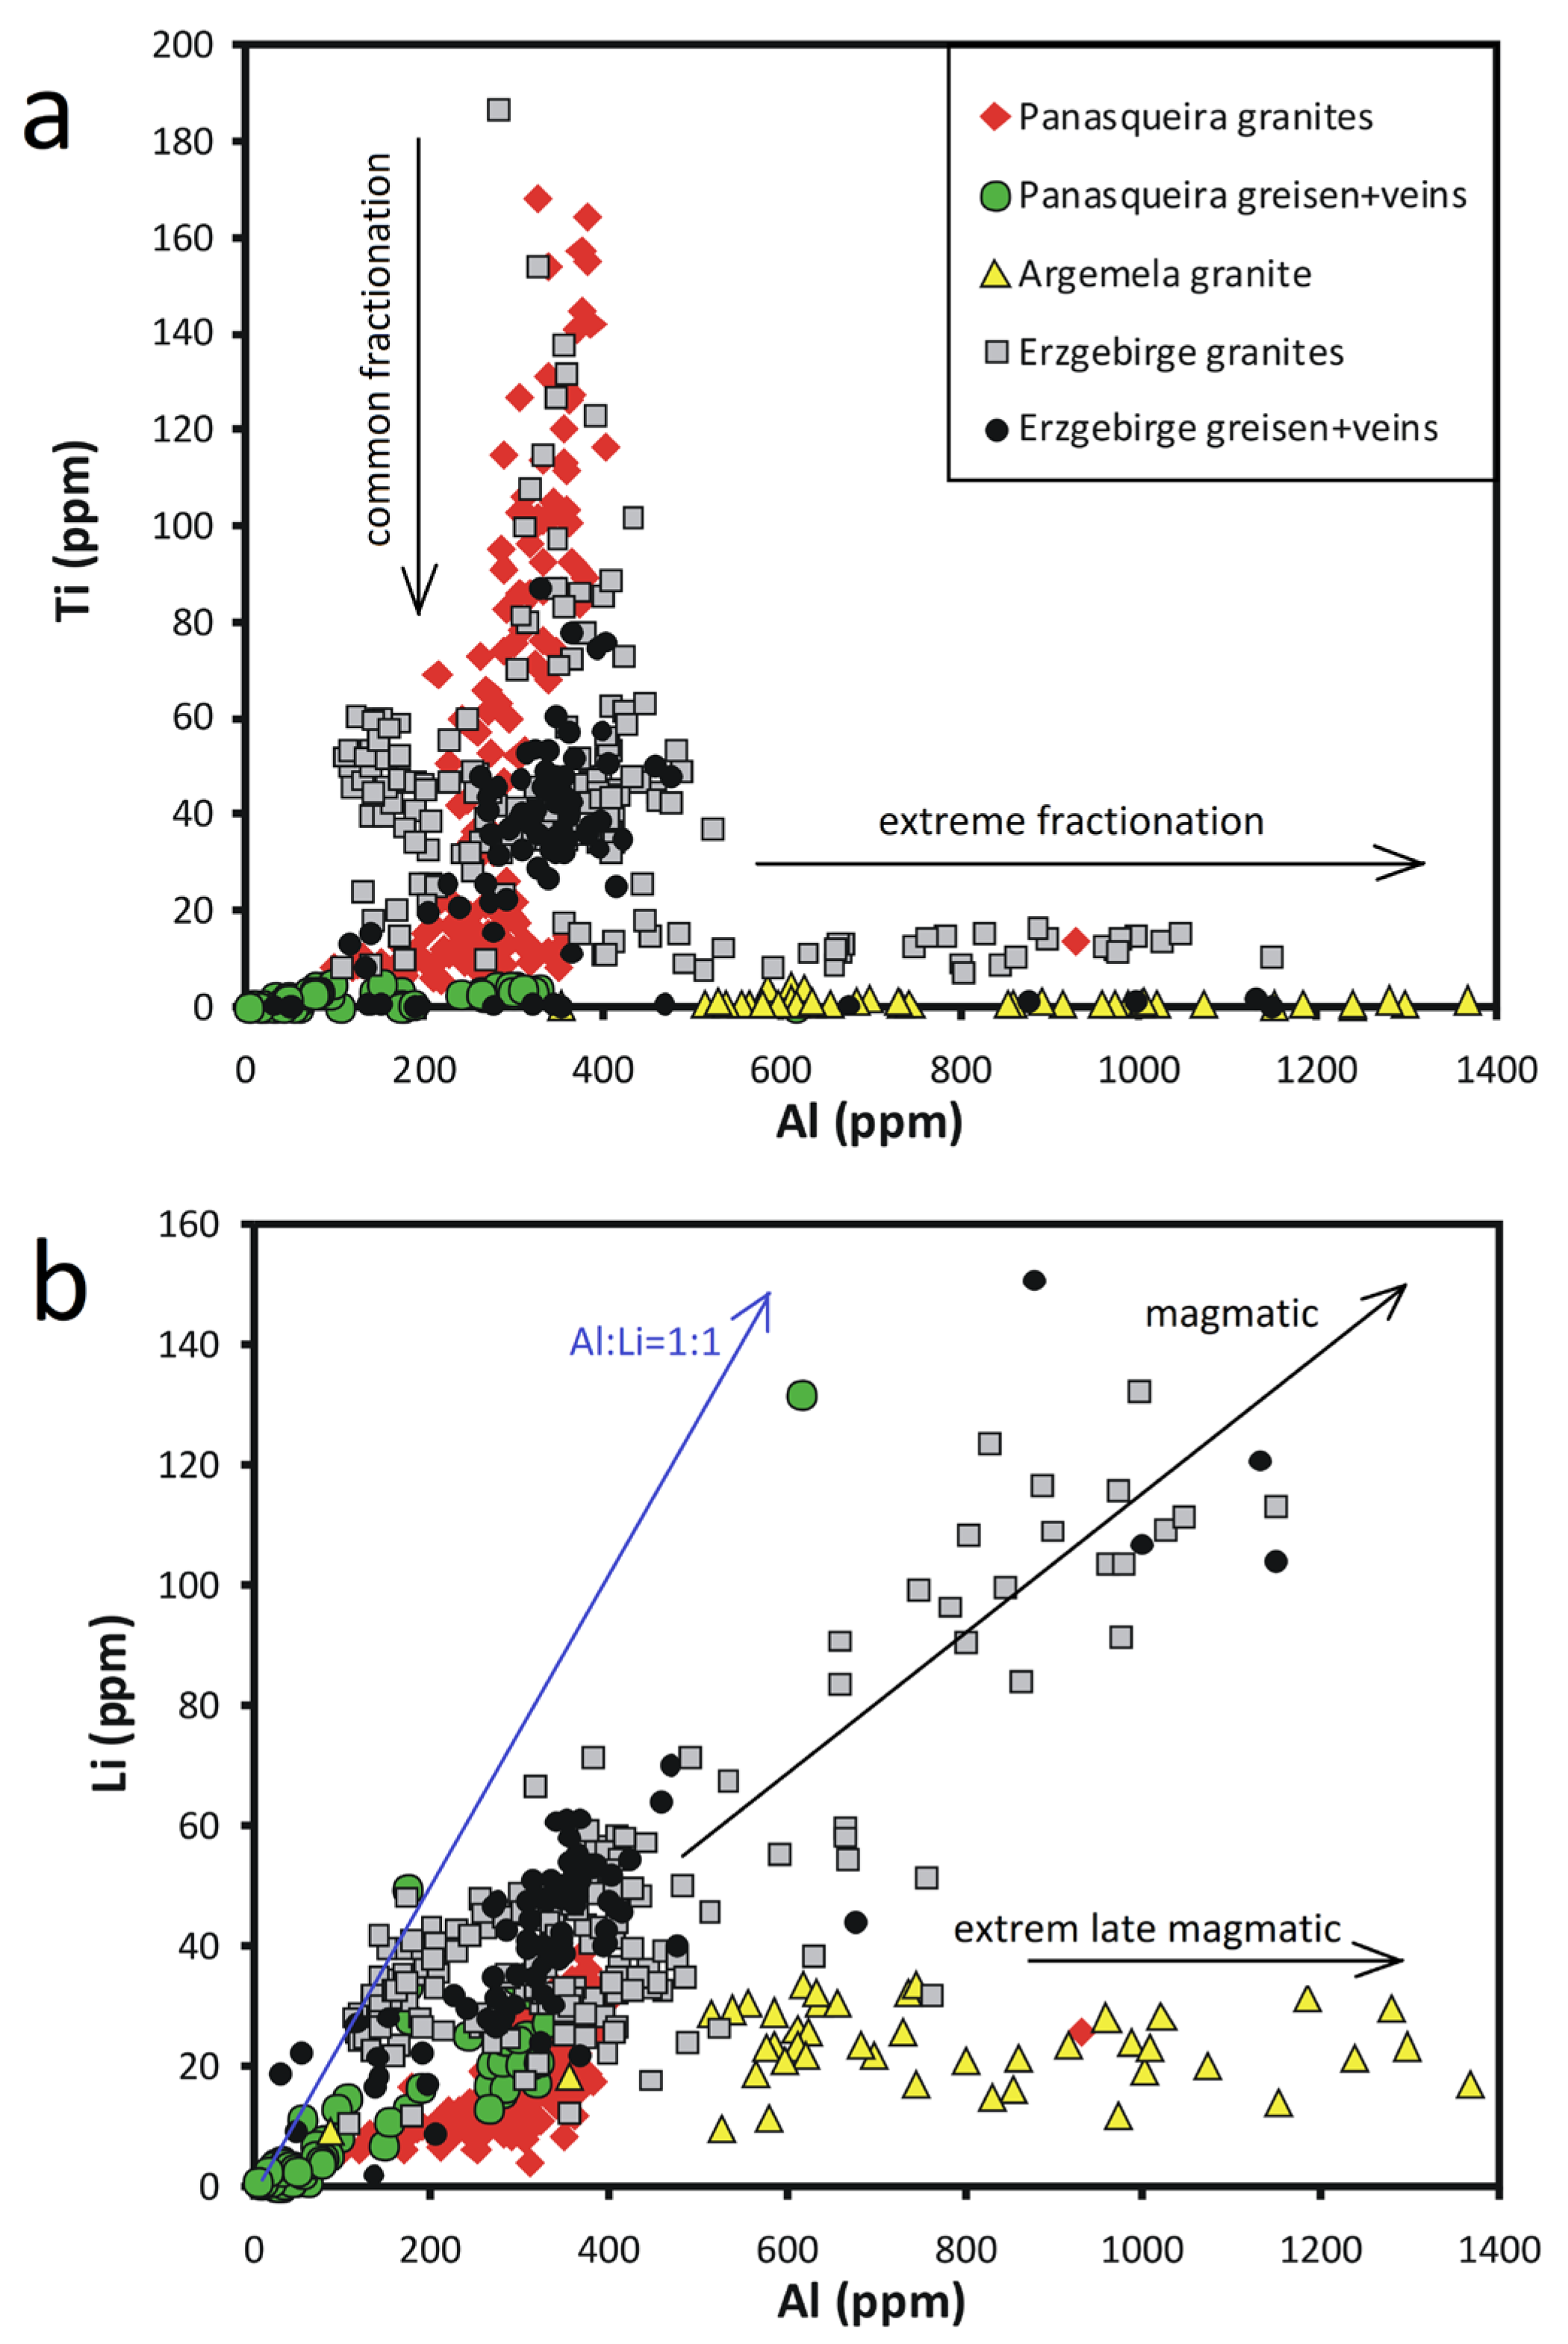
5.2. Comparison with Peraluminous Granites from Cornwall, the Erzgebirge, and Other Areas
6. Conclusions
Author Contributions
Funding
Data Availability Statement
Acknowledgments
Conflicts of Interest
Appendix A

| Borehole No. | Year of Realization | X | Y | Z | Max. Depth (m) | Core Fragments Preserved |
|---|---|---|---|---|---|---|
| 1C | 1952/53 | 31,814.9 | 54,560.98 | 530.09 | 272.6 | no |
| 12C | 1956 | 35,578.62 | 51,205.84 | 378.85 | 156.18 | no |
| 28C | 1964 | 32,220.79 | 54,605.52 | 679.03 | 150.4 | no |
| 29C | 1964 | 32,258.83 | 54,718.54 | 619.3 | 90.35 | no |
| 30C | 1966 | 32,047.38 | 54,563.2 | 528.7 | 82.26 | in mine without depth localization |
| 13D | 1969/70 | 32,520.91 | 53,300.05 | 608.0 | 492.3 | no |
| 18D | 1978/79 | 32,117.7 | 54,188.00 | 525.8 | 176.37 | yes |
| 9E | 1959 | 31,913.3 | 54,727.09 | 531.1 | 143.33 | no |
| 12E | 1957 | 31,973.59 | 54,851.43 | 621.4 | 91.02 | no |
| 14E | 1959 | 31,961.47 | 54,816.89 | 531.2 | 108.5 | no |
| 34E | 1971/72 | 32,846.6 | 54,536.3 | 796.9 | 361.92 | yes |
| 49E | 1981/82 | 34,028.5 | 53,141.1 | 515.5 | 343.7 | no |
| 52E | 1984 | 34,118.47 | 55,642.32 | 490.4 | 337.07 | no |
| 53E | 1984/85 | 34,860.15 | 51,562.1 | 464.59 | 340.68 | no |
| 54E | 1985 | 35,281.7 | 51,547.8 | 478.3 | 206.65 | no |
| 19F | 1982 | 35,779.00 | 51,688.00 | 364.4 | 132.79 | no |
| 20F | 1982 | 36,434.00 | 51,296.00 | 480.7 | 388.75 | yes |
| 3G | 1980/81 | 32,882.00 | 53,231.84 | 559.87 | 417.6 | yes |
| 4G | 1981 | 32,595.56 | 53,588.23 | 646.84 | 464.43 | no |
| 42L | 1983 | 31,607.05 | 53,638.00 | 564.5 | 79.54 | yes |
| 32 | 1948 | 32,025.25 | 54,708.58 | 619.2 | 120.65 | no |
| 33 | 1948 | 32,129.3 | 54,683.4 | 618.8 | 75.3 | no |
| 54 | 1950 | 32,059.42 | 54,812.66 | 683.65 | 106.6 | no |
| 72 | 1951 | 32,047.49 | 54,970.05 | 621.36 | 85.95 | no |
| 73 | 1951 | 31,866.53 | 54,653.5 | 619.5 | 130.11 | no |
| 74 | 1951 | 31,822.42 | 54,577.63 | 619.35 | 143.3 | no |
| 75 | 1952 | 31,947.61 | 54,385.85 | 528.1 | 126.2 | no |
| 76 | 1952 | 31,695.47 | 54,388.56 | 528.52 | 100.64 | no |
| 77 | 1952 | 31,849.22 | 54,830.44 | 620.63 | 151.4 | no |
| 79 | 1952 | 31,915.65 | 54,944.4 | 621.5 | 137.56 | no |
| 80 | 1952 | 32,241.96 | 54,880.6 | 620.31 | 125.68 | no |
| 81 | 1952 | 32,157.16 | 54,501.46 | 617.00 | 104.45 | no |
| 2N | 1991 | 31,969.7 | 53,729.25 | 471.00 | 86.59 | no |
| 44M | 1985 | 31,740.95 | 54,560.6 | 619.00 | 146.44 | no |
| 48M | 1985 | 31,884.02 | 54,481.82 | 618.3 | 111.78 | no |
| 50M | 1985 | 31,927.8 | 54,461.07 | 618.8 | 150.65 | yes |
| 55M | 1985 | 31,727.6 | 54,317.4 | 563.21 | 130.03 | yes |
| 56M | 1985/86 | 31,631.7 | 54,352.5 | 563.09 | 148.6 | yes |
| 74M | 1990 | 32,036.49 | 53,853.15 | 470.9 | 114.8 | no |
| Sample | Localization | Description |
|---|---|---|
| 1 | Borehole 50M, 114.8–115.0 m | Ms-rich greisen |
| 2 | Borehole 50M, 117.6–117.8 m | Greisenized leucogranite |
| 3 | Borehole 18D, 150.2–150.4 m | Greisenized granite passed into mica-rich greisen |
| 4 | Borehole 18D, 156.0–156.2 m | Porphyritic granite |
| 5 | Borehole 18D, 156.8–157.0 m | Porphyritic granite |
| 6 | Borehole 18D, 157.8–157.9 m | Quartz-phosphate veinlets |
| 7 | Borehole 18D, 172.2–172.3 m | Greisenized granite |
| 8 | Mine, level 1, E-part of the cupola, 25 m to the E of the panel 4 | Steep dike of the pink leucogranite through the greisen body |
| 9 | Mine, level 1, E-part of the cupola, 25 m to the E of the panel 4 | Transition of the leucogranite to greisen |
| 10 | Mine, level 1, western contact of the cupola | Quartz-rich greisen with sulfides |
| 11 | Mine, level 1, E-part of the cupola, E of steep granite dike | Mica-rich greisen |
| 12 | Mine, level 1, 5 m to the W from the western contact of the cupola | Flat quartz vein, 15–20 cm thick, with micaceous jacket, disseminated cassiterite, small aggregates of wolframite, common sulfides |
| 13 | The same place as previous sample | Cassiterite-rich domain |
| 14 | The same place as previous sample | Wolframite-rich domain |
| 15 | Not localized, sample from the mineral shop | 2 cm thick aggregate of white mica |
| 16 | Not localized, sample from the mineral shop | Piece of vein quartz with brown phosphate, white mica and arsenopyrite |
| 17 | Mine, level 3, D-18, R-1, AW30, | 40 cm thick flat quartz vein with mica jackets |
| 18 | Mine, level 3, D-19, R-3, AW34, | The lower micaceous jacket of major quartz vein with small vugs with apatite crystals |
| 19 | Mine, level 3, D-19, R-3, AW34, 30–35 mm thick lower micaceous jacket of the 60 cm thick quartz vein | Mica crystallizing directly on the schist, small vugs with mica crystal were later filled with milky quartz |
| 20 | Mine, level 3, D-19, R-3, AW34, | Complete section of a 6 cm thick quartz vein with 10–15 mm thick micaceous rims. Scheelite and apatite inside. |
| 21 | Mine, level 3, D-19, R-3, AW34, | Small wolframite chips from a 40–60 cm thick quartz vein |
| 22 | Rio, outcrop on the northern bank of the Rio Zezere, 9 m to the south of the bridge | Lower part of the steep 8 cm thick dike of greisenized aplite |
| 23 | Rio, outcrop on the northern bank of the Rio Zezere, 9 m to the south of the bridge | upper part of the steep 8 cm thick dike of greisenized aplite |
| 28 | Borehole 34E, 342.2–342.3 m | Weakly altered porphyritic granite, fresh feldspar crystals up to 10 × 4 mm, rich in white mica, no visible biotite |
| 29 | Borehole 50M, 118.4–118.6 m | Fine-grained muscovite leucogranite with disseminated pyrite |
| 30 | Borehole 50M, 123.4–123.6 m | Fine-grained, weakly greisenized leucogranite without sulfides |
| 31 | Borehole 56M, 132.4–132.5 m | Fine-grained leucogranite with local greisenization |
| 32 | Borehole 56M, 134.1–134.2 m | Fine-grained leucogranite, fresh |
| 33 | Borehole 3G, 356.6–356.8 m | Porphyritic granite with fine groundmass, feldspar grains up to 20 × 7 mm, quartz grains 5–10 mm across, accumulations of quartz, siderite, triplite and blue apatite |
| 34 | Borehole 3G, 355.9–356.0 m | Layered granite with oriented quartz and mica crystals (stockscheider) |
| 35 | Borehole 3G, 356.0–356.1 m | Layered granite below the stockscheider passing into greisenized granite |
| 36 | Borehole 3G, 358.2–358.3 m | Fine-grained mica-rich greisen |
| 37 | Borehole 3G, 362.1–362.2 m | Medium- to fine-grained leucogranite |
| 38 | Borehole 3G, 378.4–378.5 m | Contact granite/pegmatite dike |
| 39 | Borehole 20F, 239.4–239.5 m | Upper contact of granite body with thin stockscheider |
| 40 | Borehole 20F, 239.5–239.6 m | Fine-grained greisenized granite rich in mica, with strongly altered feldspars and disseminated pyrite |
| 41 | Borehole 20F, 262.6–262.7 m | Section through a thin granite dike with 2 cm stockscheider along the upper contact |
| 42 | Borehole 20F, 372.9–373.0 m | Fresh porphyritic granite with white 15 × 10 mm feldspars, 5 mm rounded quartz and medium-grained matrix |
| 43 | Borehole 20F, 379.2–379.4 m | Greisenized medium-grained porphyritic granite, feldspars strongly altered, disseminated pyrite |
| 44 | Borehole 42L, 35.5 m | 2 cm thick micaceous vein within schist |
| 45 | Borehole 3G, 359.0–359.2 m | Fine-grained weakly greisenized granite with irregular texture |
| 46 | Mine, level 530 m, panel 2-north, short crosscut to the west | Quartz-rich greisen with sulfide dissemination near a steep quartz-wolframite vein |
| 47 | Mine, level 530 m, panel 2-north, 25 m from the end of the panel, western wall | Enclave of fresh granite within greisen body, medium- to fine-grained granite, pink feldspars, white mica |
| 48 | Mine, the same place | Greisen with disseminated sulfides |
| 49 | Mine, level 530 m, panel 2-north, 5 m from the end of the panel, western wall | Enclave of white greisenized granite within greisen |
| 50 | Mine, level 530 m, borehole 30C on the north end on the panel 2, unlocalized fragments of the core on the original borehole place | Fine-grained leucogranite |
| 51 | The same place | Weakly greisenized leucogranite rich in muscovite |
| 52 | The same place | Weakly altered porphyritic granite with feldspars up to 10 × 5 mm |
| 53 | The same place | Fine- to medium-grained two-mica granite with quartz grains up to 5 mm across |
| 54 | Eastern slope of the valley between St. Francisco and Rio, NW-part of the greisen vein indicated by Thadeu | Blocks of fine-grained greisenized granite with disseminated arsenopyrite and small vugs filled with quartz and white mica crystals |
| 55 | Old stope on the eastern slope of the valley between St. Francisco and Rio, central part of the greisen vein indicated by Thadeu, outcrop | Steep 20 cm thick quartz vein with ca. 10 cm thick rim of greisenized granite along the E-contact |
References
- Thadeu, D.C. Geologia de couto mineiro da Panasqueira. Com. Serv. Geol. Portugal 1951, 32, 5–64. [Google Scholar]
- Bloot, C.; de Wolf, L.C.M. Geological features of the Panasqueira tin-tungsten ore-occurrence (Portugal). Bolet. Soc. Geol. Portugal 1953, 11, 1–58. [Google Scholar]
- D’Orey, F.C. Tungsten-tin mineralization and paragenesis in the Panasqueira and Vale de Ermida mining districts, Portugal. Com. Serv. Geol. Portugal 1967, 52, 117–167. [Google Scholar]
- Kelly, W.C.; Rye, R.O. Geologic, fluid inclusion and stable isotope studies of the tin-tungsten deposits of Panasqueira, Portugal. Econ. Geol. 1979, 74, 1721–1822. [Google Scholar] [CrossRef]
- Bussink, R.W. Geochemistry of the Panasqueira Tungsten-Tin Deposit, Portugal. Ph.D. Thesis, Instituut voor Aadwetenschappen der Rijksuniversiteit te Utrecht, Utrecht, The Netherlands, 1984. [Google Scholar]
- Oosterom, M.G.; Bussink, R.W.; Vriend, S.P. Lithogeochemical studies of aureoles around the Panasqueira tin-tungsten deposit, Portugal. Miner. Dep. 1984, 19, 283–288. [Google Scholar] [CrossRef]
- Foxford, K.A.; Nicholson, R.; Polya, D.A. Textural evolution of W-Cu-Sn-bearing hydrothermal veins at Minas da Panasqueira, Portugal. Min. Mag. 1991, 55, 435–445. [Google Scholar] [CrossRef]
- Neiva, A.M.R. Portuguese granites associated with Sn-W and Au mineralizations. Bull. Geol. Soc. Finl. 2002, 74, 79–101. [Google Scholar] [CrossRef]
- Breiter, K. Report about Laboratory Investigations of Rock Samples from the Panasqueira Mine and Recommendation for Future Exploration; Manuscript; Beralt Co.: Panasqueira, Portugal, 2001. [Google Scholar]
- Pinto, F.M.V. Estudo da distribuicao do Estanho na mina da Panasqueira. Master’s Thesis, Porto University, Porto, Portugal, 2007. [Google Scholar]
- Pinto, F.; Vieira, R.; Noronha, F. Different cassiterite generations at the Panasqueira deposit (Portugal): Implications for the metal zonation model. In Mineral Resources in Sustainable World, Proceedings of the 13th SGA Biennial Meeting, Nancy, France, 24–27 August 2015; The Society for Geology Applied to Mineral Deposits (SGA): Geneva, Switzerland, 2015; Volume 2, pp. 827–830. [Google Scholar]
- Goncalves, M.A.; Mateus, A.; Pinto, F.; Vieira, R. Using multifractal modelling, singularity mapping, and geochemical indexes for targeting buried mineralization: Application to the Panasqueira ore-system, Portugal. J. Geoch. Explor. 2018, 189, 42–53. [Google Scholar] [CrossRef]
- Carocci, E.; Marignac, C.; Cathelineau, M.; Truche, L.; Lecomte, A.; Pinto, F. Rutile from Panasqueira (Central Portugal): An excellent pathfinder for wolframite drposition. Minerals 2019, 9, 9. [Google Scholar] [CrossRef] [Green Version]
- Codeco, M.S.; Weis, P.; Trumbull, R.; Glodny, J.; Wiedenbeck, M.; Romer, R.L. Boron isotope muscovite-tourmaline geothermometry indicates fluid cooling during magmatic-hydrothermal W-Sn ore formation. Econ. Geol. 2019, 114, 153–163. [Google Scholar] [CrossRef]
- Mateus, A.; Figueiras, J.; Martins, I.; Reis, P.C.; Pinto, F. Relative abundance and compositional variation of silicates, oxides and phosphates in the W-Sn-rich lodes of the Panasqueira Mine (Portugal); implications to the ore-forming process. Minerals 2020, 10, 551. [Google Scholar] [CrossRef]
- Launay, G.; Sizaret, S.; Guillou-Frottier, L.; Gloaguen, E.; Pinto, F. Deciphering fluid flow at the magmatic-hydrothermal transition: A case study from the world-class Panasqueira W-Sn-(Cu) deposit (Portugal). Earth Planet. Sci. Lett. 2018, 499, 1–12. [Google Scholar] [CrossRef] [Green Version]
- Launay, G.; Sizaret, S.; Lach, P.; Melleton, J.; Gloaguen, E.; Poujol, M. Genetic relationship between greisenization and Sn-W mineralizations in vein and greisen deposits: Insights from the Panasqueira deposit (Portugal). BSGF—Earth Sci. Bull. 2021, 192, 2. [Google Scholar] [CrossRef]
- Noronha, F.; Dória, A.; Dubessy, J.; Charoy, J. Characterization and timing of the different types of fluids present in the barren and ore-veins of the W-Sn deposit of Panasqueira. Miner. Dep. 1992, 27, 72–79. [Google Scholar] [CrossRef]
- Lourenco, A. O granite da Panasqueira (Cúpola da Barroca Grande). Estudo de um Sistema granítico associado a mineralizacoes de estanho. In Proceedings of the VII Congresso Nacional de Geologia, University Évora, Évora, Portugal, 5 July 2006; pp. 187–190. [Google Scholar]
- Marignac, C.; Cuney, M.; Cathelineau, M.; Lecomte, A.; Carocci, E.; Pinto, F. The Panasqueira rare metal granite suites and their involvement in the genesis of the world-class Panasqueira W-Sn-Cu deposit: A petrographic, mineralogical, and geochemical study. Minerals 2020, 10, 562. [Google Scholar] [CrossRef]
- Portugal-Ferreira, M.; Costa, V.; Macedo, C.R.; Pereira, L.G. Datacoes K-Ar em biotite das rochas granitoides da Cova da Beira (Portugal Central). Mem. Not. Mus. Lab. Min. Geol. Univ. Coimbra 1977, 84, 39–48. [Google Scholar]
- Neiva, A.M.R.; Neiva, J.M.C.; Parry, S.J. Geochemistry of the granitic rocks and their minerals from Serra da Estrela, Central Portugal. Geochim. Cosmochim. Acta 1987, 51, 439–454. [Google Scholar] [CrossRef]
- Charoy, B.; Noronha, F. Multistage growth of a rare-element, volatile-rich microgranite at Argemela (Portugal). J. Petrol. 1996, 37, 73–94. [Google Scholar] [CrossRef]
- Michaud, J.A.S.; Gumiaux, C.; Pichavant, M.; Gloaguen, E.; Marcoux, E. From magmatic to hydrothermal Sn-Li-(Mn-Ta-W) mineralization: The Argemela area (central Portugal). Ore Geol. Rev. 2020, 116, 103215. [Google Scholar] [CrossRef]
- Lima, L.; Guedes, A.; Noronha, F. Tungsten mineralization associated to Argemela microgranite (Central Portugal). J. Iber. Geol. 2019, 45, 625–640. [Google Scholar] [CrossRef]
- Breiter, K.; Ďurišová, J.; Korbelová, Z.; Lima, A.; Vašinová Galiová, M.; Hložková, M.; Dosbaba, M. Rock textures and mineral zoning—A clue to understanding rare-metal granite evolution: Argemela stock, Central-Eastern Portugal. Lithos 2022, 410–411, 106562. [Google Scholar] [CrossRef]
- Ribeiro, R.F. Gravimetric Modelling and Geological Interpretation of Argemela–Panasqueira Area. Master’s Thesis, Porto University, Porto, Portugal, 2017. [Google Scholar]
- Shannon, J.R.; Walker, B.M.; Carten, R.B.; Geraghty, E.P. Unidirectional solidification textures and their significance in determining relative ages of intrusions at the Henderson Mine, Colorado. Geology 1982, 10, 293–297. [Google Scholar] [CrossRef]
- Breiter, K. From explosive breccia to unidirectional solidification textures: Magmatic evolution of a phosphorus- and fluorine-rich granite system (Podlesí, Krušné hory Mts., Czech Republic). Bull. Czech Geol. Surv. 2002, 77, 67–92. [Google Scholar]
- Hrstka, T.; Gottlieb, P.; Skála, R.; Breiter, K.; Motl, D. Automated mineralogy and petrology—Applications of TESCAN Integrated Mineral Analyzer (TIMA). J. Geosci. 2018, 63, 47–63. [Google Scholar] [CrossRef] [Green Version]
- Jochum, K.P.; Weis, U.; Stoll, B.; Kuzmin, D.; Yang, Q.; Raczek, I.; Jacob, D.E.; Stracke, A.; Birbaum, K.; Frick, D.A.; et al. Determination of reference values for NIST SRM 610–617 glasses following ISO guidelines. Geostand. Geoanal. Res. 2011, 35, 397–429. [Google Scholar] [CrossRef]
- Breiter, K.; Ďurišová, J.; Dosbaba, M. Chemical signature of quartz from S- and A-type rare-metal granites—A summary. Ore Geol. Rev. 2020, 125, 103674. [Google Scholar] [CrossRef]
- Flem, B.; Bédard, L.P. Determination of trace elements in BCS CRM 313/1 (BAS) and NIST SRM 1830 by inductively coupled plasma-mass spectrometry and instrumental neutron activation analysis. Geostand. Newslett. 2002, 26, 287–300. [Google Scholar] [CrossRef]
- McDonough, W.F.; Sun, S. The composition of the Earth. Chem. Geol. 1995, 120, 223–253. [Google Scholar] [CrossRef]
- Larsen, R.B.; Henderson, I.; Ihlen, P.M.; Jacamon, F. Distribution and petrogenetic behavior of trace elements of granitic quartz from South Norway. Contrib. Mineral. Petrol. 2004, 147, 615–628. [Google Scholar] [CrossRef]
- Monier, G.; Robert, J.L. Evolution of the miscibility gap between muscovite and biotite solid solutions with increasing lithium content: An experimental study in the system K2O–Li2O–MgO–FeO–Al2O3–SiO2–H2O–HF at 600 °C, 2 kbar PH2O: Comparison with natural lithium micas. Min. Mag. 1986, 50, 641–651. [Google Scholar] [CrossRef]
- Stepanov, A.; Mavrogenes, J.A.; Meffre, S.; Davidson, P. The key role of mica during igneous concentration of tantalum. Contrib. Mineral. Petrol. 2014, 167, 1009. [Google Scholar] [CrossRef]
- Foster, M.D. Interpretation of the composition of lithium micas. U.S. Geol. Surv. Prof. Pap. 1960, 354-E, 115–147. [Google Scholar]
- London, D.; Morgan, G.B., VI; Babb, H.A.; Loomis, J.L. Behaviour and effect of phosphorus in system Na2O–K2O–Al2O3–SiO2–P2O5–H2O at 200 MPa (H2O). Contrib. Mineral. Petrol. 1993, 113, 450–465. [Google Scholar] [CrossRef]
- Breiter, K.; Frýda, J.; Leichmann, J. Phosphorus and rubidium in alkali feldspars: Case studies and possible genetic interpretation. Bull. Czech Geol. Surv. 2002, 77, 93–104. [Google Scholar]
- Piccoli, P.M.; Candela, P.A. Apatite in igneous system. Rev. Mineral. Geochem. 2019, 48, 255–292. [Google Scholar] [CrossRef]
- Breiter, K.; Förster, H.-J.; Škoda, R. Extreme P-, Bi-, Nb-, Sc-, U- and F-rich zircon from fractionated perphosphorus granites: The peraluminous Podlesí granite system, Czech Republic. Lithos 2006, 88, 15–34. [Google Scholar] [CrossRef]
- Breiter, K.; Müller, A.; Shail, R.; Simons, B. Composition of zircons from the Cornubian Batholith of SW England and comparison with zircons from other European Variscan rare-metal granites. Min. Mag. 2016, 80, 1273–1289. [Google Scholar] [CrossRef]
- Zaraisky, G.P.; Aksyuk, A.M.; Devyatova, V.N.; Udoratina, O.V.; Chevychelov, V.Y. The Zr/Th ratio as a fractionation indicator of rare metal granites. Petrology 2009, 17, 25–45. [Google Scholar] [CrossRef]
- Breiter, K.; Škoda, R. Zircon and whole-rock Zr/Hf ratios as markers of the evolution of granitic magmas: Examples from the Teplice caldera (Czech Republic/Germany). Mineral. Petrol. 2017, 111, 435–457. [Google Scholar] [CrossRef]
- Lecumberri-Sanchez, P.; Vieira, R.; Heinrich, C.A.; Pinto, F.; Wälle, M. Fluid-rock interaction is decisive for the formation of tungsten deposits. Geology 2017, 45, 579–582. [Google Scholar] [CrossRef]
- Ballouard, C.; Pojol, M.; Boulvais, P.; Branquet, Y.; Tartese, R.; Vigneresse, J.-L. Nb-Ta fractionation in peraluminous granites: A marker of the magmatic-hydrothermal transition. Geology 2016, 44, 231–234. [Google Scholar] [CrossRef]
- Breiter, K.; Korbelová, Z.; Vašinová Galiová, M.; Hložková, M. Micas from the rare metal granites. Lithos, 2023; under review. [Google Scholar]
- Michaud, J.; Pichavant, M. The H/F ratio as an indicator of contrasted wolframite deposition mechanism. Ore Geol. Rew. 2019, 104, 266–272. [Google Scholar] [CrossRef] [Green Version]
- Rudnick, R.L.; Gao, S. Composition of the continental crust. Treatise Geochem. 2003, 3, 1–64. [Google Scholar]
- Müller, A.; Seltman, R.; Halls, C.; Siebel, W.; Dulski, P.; Jeffries, T.; Spratt, J.; Kronz, A. The magmatic evolution of the Land’s End pluton, Cornwall, and associated pre-enrichment of metals. Ore Geol. Rev. 2006, 28, 329–367. [Google Scholar] [CrossRef]
- Breiter, K.; Ďurišová, J.; Hrstka, T.; Korbelová, Z.; Vašinová Galiová, M.; Müller, A.; Simons, B.; Shail, R.K.; Williamson, B.J.; Davies, J.A. The transition from granite to banded aplite-pegmatite sheet complexes: An example from Megiliggar Rocks, Tregonning topaz granite, Cornwall. Lithos 2018, 302–303, 370–388. [Google Scholar] [CrossRef]
- Štemprok, M.; Pivec, E.; Langrová, A. The petrogenesis of a wolframite-bearing greisen in the Vykmanov granite stock, Western Krušné hory pluton (Czech Republic). Bull. Geosci. 2005, 80, 163–184. [Google Scholar]
- Götze, J.; Möckel, R. (Eds.) Quartz: Deposits, Mineralogy and Analytics; Springer: Berlin, Germany, 2012; pp. 1–360. [Google Scholar]
- Breiter, K.; Müller, A. Evolution of rare-metal granitic magmas documented by quartz chemistry. Europ. J. Mineral. 2009, 21, 335–346. [Google Scholar] [CrossRef]
- Ďurišová, J. Origin of greisen assemblages in the western Krušné hory Mts. Věst. Ústř. Úst. Geol. 1984, 59, 141–152. [Google Scholar]
- Korges, M.; Weis, P.; Lüders, V.; Laurent, O. Depressurization and boiling of a single magmatic fluid as a mechanism for tin-tungsten deposit formation. Geology 2018, 46, 75–78. [Google Scholar] [CrossRef] [Green Version]


| Rock Type Sample | Porphyr. Granite #5 | Leucogranite #37 | Greisen #10 |
|---|---|---|---|
| Quartz | 35.61 | 32.37 | 52.25 |
| Albite | 28.67 | 38.47 | 0.38 |
| K-feldspar | 11.57 | 12.93 | 0.11 |
| Muscovite | 7.53 | 13.33 | 31.78 |
| Fe-mica | 14.71 | 1.92 | 8.68 |
| Apatite | 0.56 | 0.76 | 0.49 |
| Kaolinite | 0.35 | 0.13 | 0.05 |
| Fe-sulfides | 6.21 | ||
| Hematite | 0.62 | 0.55 | |
| Topaz | 0.01 |
| Sample | 5 | 52 | 43 | 8 | 32 | 37 | 47 | 9 | 48 |
|---|---|---|---|---|---|---|---|---|---|
| Rock | Porphyritic Granite | Leucogranite | Greisenized Granite | ||||||
| SiO2 | 72.45 | 71.72 | 73.60 | 73.93 | 75.31 | 73.68 | 74.46 | 74.02 | 75.44 |
| TiO2 | 0.33 | 0.25 | 0.16 | 0.01 | 0.01 | 0.04 | 0.03 | 0.02 | 0.03 |
| Al2O3 | 14.75 | 13.89 | 13.46 | 15.16 | 14.60 | 14.97 | 14.26 | 15.17 | 12.93 |
| Fe2O3tot | 2.19 | 2.39 | 2.95 | 1.16 | 1.74 | 1.06 | 1.33 | 1.65 | 3.17 |
| MnO | 0.04 | 0.05 | 0.03 | 0.02 | 0.03 | 0.02 | 0.03 | 0.03 | 0.04 |
| MgO | 0.43 | 0.38 | 0.42 | 0.07 | 0.09 | 0.07 | 0.09 | 0.11 | 0.27 |
| CaO | 0.50 | 0.66 | 0.52 | 0.24 | 0.24 | 0.66 | 0.34 | 0.28 | 0.37 |
| Na2O | 2.99 | 1.98 | 2.32 | 2.50 | 2.72 | 3.98 | 2.45 | 2.65 | 1.83 |
| K2O | 4.56 | 5.15 | 2.98 | 5.47 | 3.04 | 3.40 | 5.15 | 3.54 | 2.90 |
| P2O5 | 0.32 | 0.52 | 0.36 | 0.19 | 0.19 | 0.59 | 0.27 | 0.20 | 0.22 |
| C | 0.10 | 0.10 | 0.16 | −0.01 | 0.05 | 0.01 | 0.01 | 0.02 | 0.14 |
| S | 0.02 | 0.17 | 0.70 | 0.02 | 0.16 | 0.02 | 0.11 | 0.03 | 0.68 |
| LOI | 1.40 | 3.00 | 3.10 | 1.20 | 2.00 | 1.60 | 1.40 | 2.30 | 2.50 |
| F | 0.35 | 0.55 | 0.29 | 0.31 | 0.37 | 0.39 | 0.32 | 0.41 | 0.43 |
| Total | 99.99 | 100.02 | 99.90 | 99.96 | 99.98 | 99.99 | 99.82 | 99.98 | 99.70 |
| As | 117 | 27 | 452 | 1200 | 367 | 113 | 531 | 369 | 5390 |
| B | 15 | 17 | 15 | 24 | 24 | 21 | 19 | 30 | 22 |
| Ba | 226 | 176 | 29 | 75 | 18 | 8 | 68 | 42 | 32 |
| Bi | 3.5 | 1.2 | 23.2 | 7.3 | 15.1 | 5 | 10 | 4.4 | 42.9 |
| Cs | 35 | 37 | 19 | 28 | 33 | 23 | 23 | 35 | 26 |
| Cu | 21 | 30 | 249 | 16 | 132 | 5 | 108 | 15 | 468 |
| Ga | 26 | 26 | 34 | 29 | 36 | 35 | 30 | 35 | 31 |
| Hf | 3.5 | 3.1 | 2.9 | 3.3 | 3.2 | 2.1 | 1.8 | 2.6 | 1.4 |
| Nb | 17 | 17 | 15 | 26 | 24 | 27 | 20 | 27 | 19 |
| Pb | 21 | 4 | 4 | 46 | 15 | 4 | 19 | 20 | 48 |
| Rb | 626 | 669 | 430 | 793 | 721 | 743 | 717 | 772 | 593 |
| Sc | 4 | 3 | 3 | <1 | −1 | 3 | 2 | <1 | 1 |
| Sn | 30 | 67 | 42 | 43 | 70 | 30 | 57 | 78 | 72 |
| Sr | 42 | 54 | 15 | 21 | 18 | 82 | 19 | 19 | 12 |
| Ta | 3.6 | 7.9 | 4.3 | 13.5 | 12.3 | 12.2 | 8.8 | 16.4 | 9.2 |
| Th | 12.8 | 12.2 | 6.4 | 1.5 | 1.0 | 2.0 | 1.1 | 1.2 | 0.8 |
| Tl | 1.6 | 2.0 | 0.8 | 2.2 | 1.4 | 1.5 | 1.7 | 1.7 | 1.4 |
| U | 17 | 25 | 30 | 20 | 27 | 56 | 26 | 18 | 18 |
| V | 14 | 6 | 6 | <5 | <5 | <5 | <5 | <5 | <5 |
| W | 12 | 17 | 17 | 16 | 21 | 18 | 16 | 22 | 21 |
| Y | 13.8 | 9.9 | 10.3 | 0.6 | 0.9 | 5.4 | 3.2 | 0.8 | 2.8 |
| Zn | 148 | 203 | 7 | 30 | 15 | 5 | 235 | 63 | 291 |
| Zr | 110 | 93 | 71 | 26 | 36 | 29 | 23 | 24 | 19 |
| La | 22.1 | 16.3 | 9.3 | 0.6 | −0.5 | 2.7 | 1.5 | 0.7 | 1.3 |
| Ce | 51.3 | 43.8 | 21.8 | 0.9 | 0.5 | 5.6 | 2.9 | 0.9 | 2.6 |
| Pr | 6.49 | 5.22 | 2.71 | 0.10 | 0.08 | 0.73 | 0.38 | 0.12 | 0.33 |
| Nd | 26.0 | 21.7 | 10.7 | <0.4 | <0.4 | 2.9 | 1.7 | <0.4 | 1.3 |
| Sm | 4.8 | 4.5 | 2.6 | −0.1 | −0.1 | 0.9 | 0.4 | <0.1 | 0.4 |
| Eu | 0.57 | 0.46 | 0.17 | <0.05 | <0.05 | 0.17 | 0.07 | <0.05 | <0.05 |
| Gd | 3.56 | 3.20 | 1.98 | <0.05 | 0.07 | 0.92 | 0.40 | 0.11 | 0.44 |
| Tb | 0.49 | 0.42 | 0.33 | 0.01 | 0.01 | 0.14 | 0.08 | 0.02 | 0.07 |
| Dy | 2.90 | 2.10 | 1.90 | 0.08 | 0.15 | 0.87 | 0.49 | 0.10 | 0.49 |
| Ho | 0.49 | 0.37 | 0.36 | <0.05 | −0.05 | 0.17 | 0.09 | −0.05 | 0.08 |
| Er | 1.38 | 0.93 | 1.02 | 0.06 | 0.09 | 0.45 | 0.29 | 0.06 | 0.31 |
| Tm | 0.21 | 0.12 | 0.18 | <0.05 | <0.05 | 0.08 | 0.07 | <0.05 | 0.05 |
| Yb | 1.66 | 0.88 | 1.29 | 0.10 | 0.30 | 0.65 | 0.54 | 0.15 | 0.54 |
| Lu | 0.22 | 0.14 | 0.16 | 0.02 | 0.04 | 0.09 | 0.06 | 0.02 | 0.07 |
| ASI | 1.37 | 1.38 | 1.68 | 1.45 | 1.78 | 1.31 | 1.39 | 1.74 | 1.89 |
| Zr/Hf | 31.4 | 30.0 | 24.5 | 7.9 | 11.3 | 13.8 | 12.8 | 9.2 | 13.6 |
| Nb/Ta | 4.6 | 2.1 | 3.5 | 1.9 | 2.0 | 2.2 | 2.3 | 1.6 | 2.1 |
| Sample | 43 | 47 | 9 | Lim. Det. | |||||||||||||||
|---|---|---|---|---|---|---|---|---|---|---|---|---|---|---|---|---|---|---|---|
| Rock | Porphyritic Granite | Leucogranite | Greisenized Granite | ||||||||||||||||
| Spot | 17 | 18 | 19 | 20 | 21 | 38 | 39 | 40 | 41 | 42 | 53 | 54 | 55 | 56 | 57 | 58 | 59 | 60 | |
| Li | 10.6 | 15 | 15.7 | 14.9 | 13.9 | 8.9 | 10.4 | 10.9 | 11 | 6.1 | 23.3 | 27.7 | 27.6 | 28.7 | 18.4 | 28.2 | 26.9 | 21.1 | 0.2 |
| Be | 0.2 | 0.05 | 0.05 | 0.05 | 0.11 | 0.14 | 0.16 | 0.05 | 0.12 | 0.05 | 0.17 | 0.16 | 0.16 | 0.12 | 0.12 | 0.16 | 0.18 | 0.19 | 0.05 |
| B | 1.1 | 0.6 | 0.3 | 0.3 | 0.6 | 1.6 | 2.5 | 1.5 | 1.5 | 1.1 | 2.6 | 2.5 | 2.4 | 2.6 | 2.9 | 2.3 | 2.8 | 0.2 | |
| Ge | 0.78 | 0.79 | 0.73 | 0.67 | 0.72 | 2.56 | 1.95 | 1.97 | 1.89 | 2.44 | 3.76 | 3.69 | 3.4 | 3.15 | 2.8 | 3.08 | 3.56 | 3.95 | 0.1 |
| Rb | 0.33 | 0.45 | 0.55 | 0.51 | 0.23 | 0.32 | 1.14 | 0.73 | 0.65 | 0.09 | 0.48 | 0.69 | 0.83 | 0.71 | 0.67 | 0.85 | 0.69 | 0.58 | 0.05 |
| Sn | 0.15 | 0.14 | 0.16 | 0.18 | 0.15 | 0.25 | 0.18 | 0.16 | 0.13 | 0.27 | 0.3 | 0.31 | 0.35 | 0.31 | 0.29 | 0.3 | 0.51 | 0.05 | |
| Al | 227 | 291 | 319 | 289 | 243 | 178 | 281 | 287 | 256 | 170 | 350 | 339 | 375 | 364 | 352 | 340 | 384 | 378 | 5 |
| P | 5.0 | 4.9 | 5.1 | 5.5 | 5.0 | 5.5 | 6.3 | 6.6 | 5.5 | 4.4 | 11.4 | 11.7 | 11.0 | 11.4 | 11.8 | 10.6 | 10.9 | 12.7 | 1 |
| Ti | 51 | 83 | 96 | 91 | 60 | 6.1 | 9.9 | 8.8 | 8.3 | 6.9 | 2.5 | 3.0 | 3.2 | 4.1 | 4.7 | 4.5 | 3.9 | 2.6 | 0.2 |
| Mn | 0.3 | 0.6 | 0.6 | 0.5 | 0.4 | 0.1 | 0.4 | 0.3 | 0.9 | 0.1 | 0.5 | ||||||||
| Fe | 3.0 | 3.7 | 0.7 | 2.4 | 1.9 | 1.9 | 0.8 | 1.7 | 1.8 | 2.8 | 2.0 | 3.0 | 1.9 | 2.1 | 1.7 | 0.2 | |||
| Sample | 5 | 28 | 43 | 8 | 53 | 9 | 10 | 11 | 20 | ||
|---|---|---|---|---|---|---|---|---|---|---|---|
| Rock | Porphyritic Granite | Leucogranite | Greisenized Leucogranite | Ore Vein | |||||||
| SiO2 | % | 36.01 | 45.98 | 46.74 | 46.78 | 46.60 | 47.19 | 46.36 | 46.18 | 46.79 | 46.59 |
| TiO2 | % | 2.57 | 0.38 | 0.48 | 0.40 | 0.04 | 0.24 | 0.10 | 0.07 | 0.06 | 0.16 |
| Al2O3 | % | 19.06 | 34.30 | 32.01 | 32.45 | 33.22 | 33.89 | 32.91 | 33.19 | 32.26 | 32.93 |
| FeO | % | 22.36 | 2.57 | 4.06 | 2.95 | 4.29 | 2.41 | 4.05 | 3.99 | 4.41 | 3.89 |
| MnO | % | 0.52 | 0.07 | 0.08 | 0.05 | 0.08 | 0.05 | 0.08 | 0.07 | 0.10 | 0.07 |
| MgO | % | 3.97 | 0.93 | 0.79 | 0.77 | 0.09 | 0.63 | 0.10 | 0.04 | 0.10 | 0.66 |
| ZnO | % | 0.17 | 0.03 | 0.05 | 0.04 | 0.03 | 0.03 | 0.06 | 0.05 | 0.05 | 0.04 |
| CaO | % | <0.01 | <0.01 | 0.01 | <0.01 | <0.01 | <0.01 | <0.01 | <0.01 | <0.01 | 0.01 |
| Cs2O | % | 0.06 | 0.01 | <0.01 | <0.01 | <0.01 | <0.01 | 0.01 | <0.01 | 0.01 | <0.01 |
| Rb2O | % | 0.23 | 0.11 | 0.13 | 0.09 | 0.21 | 0.10 | 0.21 | 0.15 | 0.25 | 0.13 |
| Li2O | % | 0.48 | 0.23 | 0.26 | 0.09 | 0.16 | 0.19 | 0.24 | 0.18 | 0.18 | 0.32 |
| Na2O | % | 0.09 | 0.58 | 0.71 | 0.68 | 0.68 | 0.76 | 0.43 | 0.63 | 0.51 | 0.43 |
| K2O | % | 9.41 | 10.35 | 10.50 | 10.95 | 10.51 | 10.77 | 10.85 | 10.61 | 10.79 | 10.29 |
| F | % | 2.17 | 0.92 | 2.03 | 1.14 | 1.44 | 1.55 | 1.14 | 1.48 | 1.45 | 1.41 |
| Fekv | % | −0.92 | −0.39 | −0.85 | −0.48 | −0.61 | −0.65 | −0.48 | −0.62 | −0.61 | −0.60 |
| Total | % | 96.18 | 96.07 | 96.97 | 95.91 | 96.74 | 97.16 | 96.03 | 96.03 | 96.34 | 96.35 |
| Si | apfu | 5.583 | 6.152 | 6.293 | 6.312 | 6.270 | 6.266 | 6.275 | 6.256 | 6.337 | 6.264 |
| Ti | apfu | 0.299 | 0.038 | 0.049 | 0.040 | 0.004 | 0.024 | 0.010 | 0.007 | 0.006 | 0.016 |
| Al | apfu | 3.482 | 5.408 | 5.079 | 5.159 | 5.267 | 5.303 | 5.250 | 5.298 | 5.148 | 5.218 |
| Fe | apfu | 2.898 | 0.288 | 0.457 | 0.333 | 0.483 | 0.267 | 0.458 | 0.452 | 0.499 | 0.438 |
| Mn | apfu | 0.069 | 0.008 | 0.009 | 0.006 | 0.009 | 0.005 | 0.009 | 0.008 | 0.011 | 0.008 |
| Mg | apfu | 0.918 | 0.185 | 0.159 | 0.155 | 0.019 | 0.125 | 0.020 | 0.009 | 0.020 | 0.132 |
| Zn | apfu | 0.020 | 0.003 | 0.005 | 0.004 | 0.003 | 0.003 | 0.006 | 0.005 | 0.005 | 0.004 |
| Ca | apfu | 0.000 | 0.000 | 0.001 | 0.000 | 0.000 | 0.000 | 0.000 | 0.000 | 0.000 | 0.001 |
| Cs | apfu | 0.004 | 0.000 | 0.000 | 0.000 | 0.000 | 0.000 | 0.000 | 0.000 | 0.001 | 0.000 |
| Rb | apfu | 0.015 | 0.006 | 0.007 | 0.005 | 0.012 | 0.006 | 0.012 | 0.009 | 0.014 | 0.008 |
| Li | apfu | 0.302 | 0.123 | 0.140 | 0.048 | 0.084 | 0.104 | 0.129 | 0.098 | 0.098 | 0.175 |
| Na | apfu | 0.028 | 0.149 | 0.184 | 0.178 | 0.176 | 0.197 | 0.112 | 0.166 | 0.134 | 0.112 |
| K | apfu | 1.860 | 1.767 | 1.803 | 1.885 | 1.804 | 1.824 | 1.873 | 1.834 | 1.863 | 1.764 |
| F | apfu | 1.066 | 0.389 | 0.862 | 0.486 | 0.611 | 0.651 | 0.487 | 0.634 | 0.620 | 0.601 |
| Li | ppm | 2253 | 1065 | 1201 | 412 | 721 | 904 | 1103 | 835 | 840 | 1505 |
| Sc | ppm | 25.1 | 30.7 | 90.5 | 14.4 | 1.8 | 26.6 | 1.2 | 0.7 | 2.0 | 2.4 |
| Ga | ppm | 74 | 110 | 153 | 131 | 141 | 148 | 158 | 126 | 127 | 111 |
| Ge | ppm | 4.0 | 4.0 | 4.2 | 4.2 | 7.1 | 4.2 | 8.1 | 6.3 | 6.9 | 6.0 |
| Rb | ppm | 1960 | 1694 | 1936 | 1698 | 2541 | 1984 | 3264 | 2416 | 2549 | 2731 |
| Nb | ppm | 89 | 74 | 100 | 55 | 183 | 109 | 196 | 124 | 136 | 52 |
| In | ppm | 0.41 | 0.93 | 1.19 | 0.93 | 1.42 | 0.70 | 1.37 | 0.95 | 1.18 | 1.17 |
| Sn | ppm | 73 | 100 | 91 | 115 | 143 | 66 | 177 | 126 | 420 | 335 |
| Cs | ppm | 310 | 41 | 42 | 56 | 111 | 34 | 157 | 89 | 126 | 147 |
| Ta | ppm | 5.8 | 9.1 | 12 | 10 | 63 | 20 | 38 | 24 | 56 | 17 |
| W | ppm | 6.1 | 64 | 83 | 71 | 99 | 83 | 114 | 91 | 98 | 88 |
| Tl | ppm | 11.9 | 6.2 | 7.2 | 8.4 | 9.8 | 7.2 | 15.6 | 10.1 | 11.0 | 12.6 |
| Mineral | K-Feldspar | Plagioclase | |||||||||||
|---|---|---|---|---|---|---|---|---|---|---|---|---|---|
| Sample | 5 | 28 | 8 | 37 | 9 | 11 | 5 | 28 | 8 | 37 | 9 | 10 | |
| Rock | Porphyritic Granite | Leucogranite | Greisenized Granite | Porphyritic Granite | Leucogranite | Greisenized Granite | |||||||
| Spot | 7 | 21 | 25 | 50 | 38 | 68 | 9 | 24 | 32 | 48 | 41 | 58 | |
| P2O5 | wt.% | 0.26 | 0.14 | 0.11 | 0.97 | 0.12 | 0.82 | 0.15 | 0.15 | 0.09 | 0.18 | 0.13 | 1.11 |
| SiO2 | wt.% | 64.23 | 64.23 | 63.90 | 63.73 | 64.59 | 63.53 | 68.71 | 68.04 | 68.49 | 68.38 | 68.44 | 66.41 |
| Al2O3 | wt.% | 18.04 | 17.95 | 17.94 | 18.70 | 18.27 | 18.57 | 19.24 | 19.37 | 19.25 | 19.02 | 19.20 | 20.01 |
| FeO | wt.% | <0.01 | <0.01 | 0.02 | 0.01 | <0.01 | 0.01 | 0.01 | <0.01 | <0.01 | <0.01 | 0.01 | 0.01 |
| CaO | wt.% | <0.01 | <0.01 | <0.01 | 0.01 | <0.01 | <0.01 | 0.04 | 0.07 | 0.03 | 0.02 | <0.01 | 0.23 |
| Rb2O | wt.% | 0.14 | 0.20 | 0.10 | 0.20 | 0.13 | 0.14 | <0.01 | <0.01 | <0.01 | <0.01 | 0.02 | <0.01 |
| K2O | wt.% | 17.03 | 16.33 | 17.19 | 15.95 | 16.52 | 16.64 | 0.07 | 0.15 | 0.16 | 0.16 | 0.16 | 0.16 |
| Na2O | wt.% | 0.29 | 0.26 | 0.22 | 0.56 | 0.23 | 0.43 | 11.85 | 11.70 | 11.65 | 11.48 | 11.62 | 11.56 |
| Total | wt.% | 100.00 | 99.11 | 99.48 | 100.13 | 99.86 | 100.13 | 100.06 | 99.48 | 99.67 | 99.24 | 99.57 | 99.50 |
| P | apfu | 0.010 | 0.006 | 0.004 | 0.038 | 0.005 | 0.032 | 0.005 | 0.006 | 0.003 | 0.007 | 0.005 | 0.041 |
| Si | apfu | 2.986 | 3.001 | 2.990 | 2.941 | 2.995 | 2.943 | 2.998 | 2.988 | 3.000 | 3.005 | 3.001 | 2.917 |
| Al | apfu | 0.988 | 0.989 | 0.989 | 1.017 | 0.998 | 1.014 | 0.989 | 1.003 | 0.994 | 0.985 | 0.992 | 1.036 |
| Fe | apfu | 0.000 | 0.000 | 0.001 | 0.000 | 0.000 | 0.000 | 0.000 | 0.000 | 0.000 | 0.000 | 0.000 | 0.000 |
| Ca | apfu | 0.000 | 0.000 | 0.000 | 0.001 | 0.000 | 0.000 | 0.002 | 0.003 | 0.001 | 0.001 | 0.000 | 0.011 |
| Rb | apfu | 0.003 | 0.004 | 0.002 | 0.004 | 0.003 | 0.003 | 0.000 | 0.000 | 0.000 | 0.000 | 0.000 | 0.000 |
| K | apfu | 1.010 | 0.973 | 1.026 | 0.939 | 0.977 | 0.983 | 0.004 | 0.008 | 0.009 | 0.009 | 0.009 | 0.009 |
| Na | apfu | 0.026 | 0.023 | 0.020 | 0.050 | 0.021 | 0.038 | 1.003 | 0.996 | 0.989 | 0.978 | 0.988 | 0.984 |
| Rock | Porphyritic Granite | Leucogranite | Greisen | Porphyrit. Granite | Detection Limit | ||||||
|---|---|---|---|---|---|---|---|---|---|---|---|
| Sample | 5 | 5 | 28 | 8 | 8 | 37 | 37 | 9 | 10 | 5 | |
| Spot | 6 | 25 | 16 | 9 | 12 | 30 | 31 | 13 | 23 | 7 | |
| Mineral | Ap | Ap | Ap | Ap | Ap | Ap | Ap | Ap | Ap | Isokite | |
| P2O5 | 43.33 | 43.95 | 42.15 | 43.10 | 43.42 | 40.52 | 43.33 | 43.03 | 42.89 | 39.53 | 0.02 |
| SiO2 | 0.01 | 0.06 | na | bdl | 0.01 | bdl | bdl | na | bdl | 0.03 | 0.01 |
| SO3 | 0.02 | 0.01 | na | bdl | 0.01 | 1.47 | 0.02 | na | 0.01 | 1.65 | 0.01 |
| CaO | 51.43 | 53.51 | 50.98 | 51.03 | 50.92 | 52.46 | 45.78 | 52.32 | 50.34 | 29.64 | 0.02 |
| MnO | 2.62 | 0.27 | 2.83 | 2.78 | 2.96 | 0.23 | 7.24 | 2.67 | 3.55 | 0.05 | 0.02 |
| FeO | 1.00 | 0.02 | 0.30 | 0.13 | 1.07 | 0.29 | 0.86 | 0.22 | 0.21 | 0.24 | 0.02 |
| SrO | bdl | 0.10 | 0.96 | 0.38 | bdl | 0.03 | 0.21 | 0.75 | 0.38 | bdl | 0.03 |
| MgO | 0.04 | bdl | bdl | bdl | 0.02 | 0.06 | bdl | 0.01 | 0.01 | 22.52 | 0.01 |
| Na2O | 0.01 | 0.06 | na | 0.01 | 0.01 | 0.56 | 0.04 | na | 0.02 | 0.71 | 0.01 |
| F | 3.40 | 4.17 | 4.47 | 3.41 | 3.26 | 3.56 | 3.03 | 4.57 | 3.40 | 9.10 | 0.03 |
| F eq. | −1.43 | −1.76 | −1.88 | −1.44 | −1.38 | −1.50 | −1.28 | −1.93 | −1.43 | −3.84 | |
| Total | 100.42 | 100.40 | 99.81 | 99.40 | 100.31 | 97.67 | 99.24 | 101.65 | 99.37 | 99.65 | |
| P | 3.057 | 3.083 | 3.034 | 3.070 | 3.064 | 2.930 | 3.102 | 3.035 | 3.063 | 0.980 | |
| Si | 0.001 | 0.005 | 0.001 | 0.001 | 0.001 | ||||||
| S | 0.001 | 0.001 | 0.001 | 0.001 | 0.094 | 0.002 | 0.000 | 0.036 | |||
| Ca | 4.592 | 4.750 | 4.643 | 4.599 | 4.548 | 4.800 | 4.147 | 4.670 | 4.550 | 0.930 | |
| Mn | 0.185 | 0.019 | 0.204 | 0.198 | 0.209 | 0.016 | 0.519 | 0.188 | 0.254 | 0.001 | |
| Fe | 0.070 | 0.002 | 0.021 | 0.009 | 0.075 | 0.021 | 0.061 | 0.016 | 0.015 | 0.006 | |
| Sr | 0.005 | 0.047 | 0.018 | 0.001 | 0.010 | 0.036 | 0.019 | ||||
| Mg | 0.004 | 0.001 | 0.002 | 0.008 | 0.001 | 0.001 | 0.983 | ||||
| Na | 0.002 | 0.010 | 0.001 | 0.001 | 0.093 | 0.006 | 0.003 | 0.040 | |||
| F | 0.896 | 1.093 | 1.200 | 0.907 | 0.859 | 0.962 | 0.810 | 1.200 | 0.907 | 0.843 | |
| Sample | 5 | 28 | 47 | 53 | 37 | |||||||||
|---|---|---|---|---|---|---|---|---|---|---|---|---|---|---|
| Localization | Borehole 18D | Borehole 34E | Cupola | Cupola | Borehole 3G | |||||||||
| Rock Type | Porfyritic Granite | Porfyritic Granite | Leucogranite | Leucogranite | Leucogranite. Greisenized | |||||||||
| Spot | 20 | 21 | 19 | 4 | 5 | 11 | 20 | 21 | 27 | 28 | 29 | 30 | 9 | 10 |
| P2O5 | 0.17 | 0.06 | 0.15 | 1.45 | 1.03 | 0.76 | 0.27 | 0.48 | 0.13 | 2.32 | 0.97 | 0.38 | 0.45 | 0.39 |
| As2O3 | bdl | bdl | bdl | bdl | bdl | bdl | bdl | bdl | bdl | bdl | bdl | bdl | bdl | 0.01 |
| SiO2 | 32.98 | 33.39 | 31.66 | 31.39 | 31.68 | 29.03 | 31.57 | 32.04 | 33.21 | 29.27 | 30.78 | 32.40 | 29.88 | 30.75 |
| ZrO2 | 64.23 | 64.97 | 67.14 | 61.99 | 63.95 | 58.33 | 57.77 | 59.73 | 62.88 | 55.58 | 58.55 | 59.26 | 55.76 | 53.84 |
| HfO2 | 2.02 | 1.87 | 1.63 | 1.49 | 1.30 | 3.23 | 4.76 | 3.21 | 1.93 | 3.28 | 2.56 | 4.87 | 3.45 | 4.71 |
| ThO2 | 0.05 | 0.04 | bdl | 0.05 | 0.09 | 0.13 | 0.03 | 0.09 | 0.03 | 0.06 | 0.06 | bdl | 0.18 | 0.04 |
| UO2 | 0.32 | 0.10 | 0.05 | 0.21 | 0.12 | 3.25 | 0.83 | 0.81 | 0.06 | 2.24 | 1.75 | 0.91 | 2.49 | 3.83 |
| Y2O3 | 0.14 | 0.05 | 0.10 | 1.64 | 1.23 | 0.67 | 0.07 | 0.23 | 0.21 | 1.59 | 0.54 | 0.26 | 0.26 | 0.21 |
| Yb2O3 | 0.04 | bdl | 0.03 | 0.41 | 0.29 | 0.27 | 0.11 | 0.20 | bdl | 0.59 | 0.22 | 0.23 | 0.15 | 0.17 |
| Al2O3 | 0.00 | 0.04 | bdl | bdl | 0.02 | 0.29 | 0.03 | 0.05 | bdl | bdl | bdl | bdl | 0.22 | 0.33 |
| Sc2O3 | 0.02 | 0.05 | bdl | 0.08 | 0.07 | 0.21 | 0.16 | 0.12 | 0.07 | 0.71 | 0.37 | 0.07 | 0.12 | 0.09 |
| MnO | bdl | 0.05 | 0.02 | bdl | bdl | 0.00 | 0.05 | 0.04 | bdl | bdl | bdl | 0.06 | 0.03 | 0.04 |
| FeO | 0.37 | 0.24 | 0.35 | 0.30 | 0.28 | 0.08 | 0.31 | 0.06 | 0.06 | 0.31 | 0.24 | 0.13 | 0.37 | 0.44 |
| CaO | 0.01 | 0.01 | bdl | 0.03 | 0.01 | 0.03 | 0.19 | 0.29 | 0.04 | bdl | 0.01 | 0.03 | 0.32 | 0.43 |
| Total | 100.34 | 100.84 | 101.14 | 99.02 | 100.06 | 96.26 | 96.12 | 97.34 | 98.62 | 95.96 | 96.05 | 98.61 | 93.67 | 95.29 |
| P | 0.004 | 0.001 | 0.004 | 0.038 | 0.027 | 0.021 | 0.007 | 0.013 | 0.003 | 0.064 | 0.026 | 0.010 | 0.013 | 0.011 |
| As | 0.000 | 0.000 | 0.000 | 0.000 | 0.000 | 0.000 | 0.000 | 0.000 | 0.000 | 0.000 | 0.000 | 0.000 | 0.000 | 0.000 |
| Si | 1.009 | 1.013 | 0.970 | 0.972 | 0.973 | 0.956 | 1.018 | 1.013 | 1.026 | 0.950 | 0.991 | 1.019 | 0.998 | 1.016 |
| Zr | 0.958 | 0.961 | 1.004 | 0.936 | 0.958 | 0.937 | 0.909 | 0.921 | 0.947 | 0.879 | 0.920 | 0.909 | 0.908 | 0.867 |
| Hf | 0.018 | 0.016 | 0.014 | 0.013 | 0.011 | 0.030 | 0.044 | 0.029 | 0.017 | 0.030 | 0.023 | 0.044 | 0.033 | 0.044 |
| Th | 0.000 | 0.000 | 0.000 | 0.000 | 0.001 | 0.001 | 0.000 | 0.001 | 0.000 | 0.000 | 0.000 | 0.000 | 0.001 | 0.000 |
| U | 0.002 | 0.001 | 0.000 | 0.001 | 0.001 | 0.024 | 0.006 | 0.006 | 0.000 | 0.016 | 0.013 | 0.006 | 0.019 | 0.028 |
| Y | 0.002 | 0.001 | 0.002 | 0.027 | 0.020 | 0.012 | 0.001 | 0.004 | 0.003 | 0.027 | 0.009 | 0.004 | 0.005 | 0.004 |
| Yb | 0.000 | 0.000 | 0.000 | 0.004 | 0.003 | 0.003 | 0.001 | 0.002 | 0.000 | 0.006 | 0.002 | 0.002 | 0.002 | 0.002 |
| Al | 0.000 | 0.001 | 0.000 | 0.000 | 0.001 | 0.011 | 0.001 | 0.002 | 0.000 | 0.000 | 0.000 | 0.000 | 0.009 | 0.013 |
| Sc | 0.001 | 0.001 | 0.000 | 0.002 | 0.002 | 0.006 | 0.004 | 0.003 | 0.002 | 0.020 | 0.010 | 0.002 | 0.003 | 0.003 |
| Mn | 0.000 | 0.001 | 0.000 | 0.000 | 0.000 | 0.000 | 0.001 | 0.001 | 0.000 | 0.000 | 0.000 | 0.002 | 0.001 | 0.001 |
| Fe | 0.009 | 0.006 | 0.009 | 0.008 | 0.007 | 0.002 | 0.008 | 0.002 | 0.002 | 0.008 | 0.006 | 0.003 | 0.010 | 0.012 |
| Ca | 0.000 | 0.000 | 0.000 | 0.001 | 0.000 | 0.001 | 0.006 | 0.010 | 0.001 | 0.000 | 0.000 | 0.001 | 0.011 | 0.015 |
| Zr/Hf | 54.4 | 59.4 | 70.4 | 71.1 | 84.0 | 30.8 | 20.8 | 31.8 | 55.8 | 28.9 | 39.1 | 20.8 | 27.6 | 19.5 |
Disclaimer/Publisher’s Note: The statements, opinions and data contained in all publications are solely those of the individual author(s) and contributor(s) and not of MDPI and/or the editor(s). MDPI and/or the editor(s) disclaim responsibility for any injury to people or property resulting from any ideas, methods, instructions or products referred to in the content. |
© 2023 by the authors. Licensee MDPI, Basel, Switzerland. This article is an open access article distributed under the terms and conditions of the Creative Commons Attribution (CC BY) license (https://creativecommons.org/licenses/by/4.0/).
Share and Cite
Breiter, K.; Ďurišová, J.; Korbelová, Z.; Vašinová Galiová, M.; Hložková, M. Granite Pluton at the Panasqueira Tungsten Deposit, Portugal: Genetic Implications as Revealed from New Geochemical Data. Minerals 2023, 13, 163. https://doi.org/10.3390/min13020163
Breiter K, Ďurišová J, Korbelová Z, Vašinová Galiová M, Hložková M. Granite Pluton at the Panasqueira Tungsten Deposit, Portugal: Genetic Implications as Revealed from New Geochemical Data. Minerals. 2023; 13(2):163. https://doi.org/10.3390/min13020163
Chicago/Turabian StyleBreiter, Karel, Jana Ďurišová, Zuzana Korbelová, Michaela Vašinová Galiová, and Michaela Hložková. 2023. "Granite Pluton at the Panasqueira Tungsten Deposit, Portugal: Genetic Implications as Revealed from New Geochemical Data" Minerals 13, no. 2: 163. https://doi.org/10.3390/min13020163