
Toward a Dualistic Growth? Population Increase and Land-Use Change in Rome, Italy
by
 , and
, and
Leonardo Bianchini
1 ,
,
Gianluca Egidi
1,
Ahmed Alhuseen
2,
Adele Sateriano
3,
Sirio Cividino
4,
Matteo Clemente
5 and
Vito Imbrenda
6,* 1
Department of Agricultural and Forestry Sciences (DAFNE), Tuscia University, Via San Camillo de Lellis, I-01100 Viterbo, Italy
2
Global Change Research Institute CAS, Lipova 9, 370 05 Ceske Budejovice, Czech Republic
3
Independent Researcher, I-00184 Rome, Italy
4
Department of Agriculture, University of Udine, Via del Cotonificio 114, I-33100 Udine, Italy
5
Department of Planning, Design and Architectural Technologies, University of Rome ‘La Sapienza’, Via E. Gianturco 2, I-00186 Rome, Italy
6
IMAA—CNR (Institute of Methodologies for Environmental Analysis—Italian National Research Council), c.da Santa Loja snc, I-85050 Tito Scalo, Italy
*
Author to whom correspondence should be addressed.
Land 2021, 10(7), 749; https://doi.org/10.3390/land10070749
Submission received: 30 June 2021
/
Accepted: 13 July 2021
/
Published: 17 July 2021
(This article belongs to the Special Issue Recent Progress in Urbanisation Dynamics Research)
Abstract
:The spatial mismatch between population growth and settlement expansion is at the base of current models of urban growth. Empirical evidence is increasingly required to inform planning measures promoting urban containment in the context of a stable (or declining) population. In these regards, per-capita indicators of land-use change can be adopted with the aim at evaluating long-term sustainability of urbanization processes. The present study assesses spatial variations in per-capita indicators of land-use change in Rome, Central Italy, at five years (1949, 1974, 1999, 2008, and 2016) with the final objective of quantifying the mismatch between urban expansion and population growth. Originally specialized in agricultural productions, Rome’s metropolitan area is a paradigmatic example of dispersed urban expansion in the Mediterranean basin. By considering multiple land-use dynamics, per-capita indicators of landscape change delineated three distinctive waves of growth corresponding with urbanization, suburbanization, and a more mixed stage with counter-urbanization and re-urbanization impulses. By reflecting different socioeconomic contexts on a local scale, urban fabric and forests were identified as the ‘winner’ classes, expanding homogeneously over time at the expense of cropland. Agricultural landscapes experienced a more heterogeneous trend with arable land and pastures declining systematically and more fragmented land classes (e.g., vineyards and olive groves) displaying stable (or slightly increasing) trends. The continuous reduction of per-capita surface area of cropland that’s supports a reduced production base, which is now insufficient to satisfy the rising demand for fresh food at the metropolitan scale, indicates the unsustainability of the current development in Rome and more generally in the whole Mediterranean basin, a region specialized traditionally in (proximity) agricultural productions.
1. Introduction
Land use/land cover changes (LULCCs) are due to a large number of factors encompassing climate change, occurrence of natural risk, regulation/conservation policies, and human disturbance mainly consisting in various forms of urbanization [1,2,3,4,5,6,7,8,9]. In this perspective, in urban areas, settlement expansion and landscape transformations were intimately associated, involving multiple research dimensions encompassing ecology, planning, economic issues, and social aspects [10]. For a comprehensive study of urbanization-driven landscape changes, defining urban growth in terms of density, spatial morphology, socioeconomic implications, and environmental impacts is a difficult task [11,12,13]. Focusing on agglomeration, contemporary urbanization has been progressively shifted beyond the typical ideal city models in which the density of population, settlements, and economic activities display a significant decline moving away from downtown [14]. Urban sprawl was proposed as a comprehensive definition of this evolution: while sprawl comes across as a matter of degree not easily quantifiable, it is argued that in this case the density gradient of any urban function (population, buildings, and businesses) became less steep over time [15,16,17]. However, low-density development differs from place to place, thus defining of such a process is a mostly place-specific exercise [18]. Impacts of sprawl on fringe landscapes are also mixed and hardly predictable as land-use change in metropolitan regions is often the result of a complex interplay of socioeconomic factors and land constraints (e.g., accessibility, infrastructural development, land/house prices, and access to credit) [19,20,21,22].
The dynamic linkage between landscape transformations and population dynamics in advanced economies became increasingly multifaceted because of the mutual interplay of environmental, social, and planning dimensions that influence the level of sustainable development at different spatial scales from regions to local communities [23,24]. It was demonstrated how population dynamics have influenced sprawl less intensively than what occurred under more compact and dense stages of urban expansion in the past [25]. In fact, the current model of urban development (i.e., low-density settlements scattered on a natural or agricultural matrix) results in spatially articulated settlement morphologies leading to high rates of land consumption [26,27,28].
Following Couch et al. [2], urban sprawl has been increasingly treated as a process of urban change rather than a pattern of urbanization. In this sense, the definition given by Glaster and other scholars nearly twenty years ago [1] is the one that best allows sprawl to be intended as a process and not merely a spatial pattern. Within this approach, the simplest indicator for measuring the extent of sprawl in a metropolitan area is a ratio of two growth rates: the rate at which land development near the outer suburbs has increased divided by the rate at which the population of the metropolitan area has grown [29]. Measuring urban and suburban expansion in this context, a recent study defined exurban development as a process in which “the spread of development across the landscape far outpaces population growth” [30,31,32]. Similarly, another study notes that “if land is being consumed at a faster rate than population growth, then a metropolitan area can be characterized as ‘sprawling’. If population is growing more rapidly than land is being consumed for urbanization, then a metropolitan area can be characterized as ‘densifying’” [3]. Taking this approach, Wiewel and Persky’s work on Chicago’s suburban sprawl [13] demonstrated that between 1970–1990, urbanized land grew by 46%, while the population increased by only 4% (a ratio of 11.5 to 1). This is only an example of the possible use of per-capita indicators of land-use [33,34,35,36,37,38].
A large imbalance between a place’s spatial expansion and its population change (where the former increases much more rapidly than the latter) is not unusual in advanced economies [39]. Growth of this sort produces a lower density outcome with people and their residential and commercial buildings using more space often at the expense of forests and farmland [40]. Examining landscapes from the other side of the fringe, exurban development has produced fragmented and chaotic natural landscapes that are progressively losing their characteristic traits (e.g., as far as the composition, configuration, and structure are concerned) [41]. While land-use change in metropolitan regions was the subject of earlier studies delineating knock-on effects on the environmental matrix [42,43,44], the relationship between land-use change and urban cycles has not yet been adequately studied, especially in regions where human pressure has increased more rapidly in recent years [45].
Based on earlier studies [46], a complete urban cycle is usually represented as a sequence of four development stages with different demographic characteristics from urbanization to suburbanization and from counter-urbanization to re-urbanization [47]. The downtown population increased in both the first and the fourth stage; the suburban population increased in the second stage; and the rural population in metropolitan regions increased in the third stage [48]. Per-capita land-use indicators seem to be an appropriate solution to better delineate the temporal outline of different stages of a complete urban cycle, in turn quantifying the incipient mismatch between population growth and urban expansion [49]. This evidence indicates, likely better than other indicators, the shift from compact models to a more dispersed settlements’ structure [50]. By linking (urban) form and (ecological) functions in peri-urban areas, a long-term analysis of per-capita land-use indicators provides the necessary informative base to any policy aimed at containing urban expansion [51,52,53,54]. In this direction, spatial planning is urgently required to finely tune urban expansion with population increase and growth in economic activities, limiting settlement diffusion (e.g., in shrinking cities) [55].
The drastic spread of official statistics, land-use maps, and geo-spatial databases support a refined landscape analysis investigating per-capita land-use indicators over a sufficiently long-time interval [56]. Per-capita indicators of land-use change represent a suitable tool to test assumptions on the relationship between urban cycles and landscape transformations over different waves of metropolitan expansion [57]. In this direction, exploratory multivariate data analysis contributes to reveal the complex linkage between compositional changes in relict, fringe landscapes, and the increase of resident population, considered an anticipatory indicator of the specific stage of a given city life cycle [58,59].
Grounded on this theory, our study provides a long-term analysis of per-capita land cover changes at the fringe of a metropolitan region in southern Europe. In light of different models of urban expansion from compact and radio-centric urbanization to dispersed expansion of low-density settlements, the present study documents urban and peri-urban changes over nearly 70 years (1949–2016). As a novel contribution to land-use science, the present work delineates the prevalent mode of urban expansion in Rome (Italy) considering both socioeconomic functions (whose changes are reflected in the sequential stages of the city life cycle) and morphological shifts (e.g., compact vs. dispersed). The Rome metropolitan area is a typical semi-compact and dense city in southern Europe experiencing different waves of settlement expansion and represents an example of metropolitan transformations in the Mediterranean [60,61,62]. The empirical results of this study allow for the discussion of the (supposed) unsustainability of current urban expansion compared with past settlement structures as far as land fragmentation and loss of relict habitats and traditional crops at the fringe are concerned.
2. Materials and Methods
2.1. Study Area
The investigated area covers a large part of Rome’s province (Latium region, Central Italy) encompassing the municipalities of Rome and Fiumicino (1500 km2, see Figure 1). The study area is mostly flat and corresponds with the so called ‘Agro Romano’, a cultivated district with traditional rural landmarks, biodiversity, and cultural heritage surrounding the historical city of Rome along the alluvial plain of the Tiber river [60]. Climate regime in Rome is typically Mediterranean with rainfalls concentrated in the fall and spring and mild temperatures in the winter. Average annual rainfalls and mean daily temperatures were nearly 700 mm and 16 °C in the period between 1960–1990, although in the last decades the study area is becoming drier and warmer as a consequence of reduced precipitation and increased temperatures.
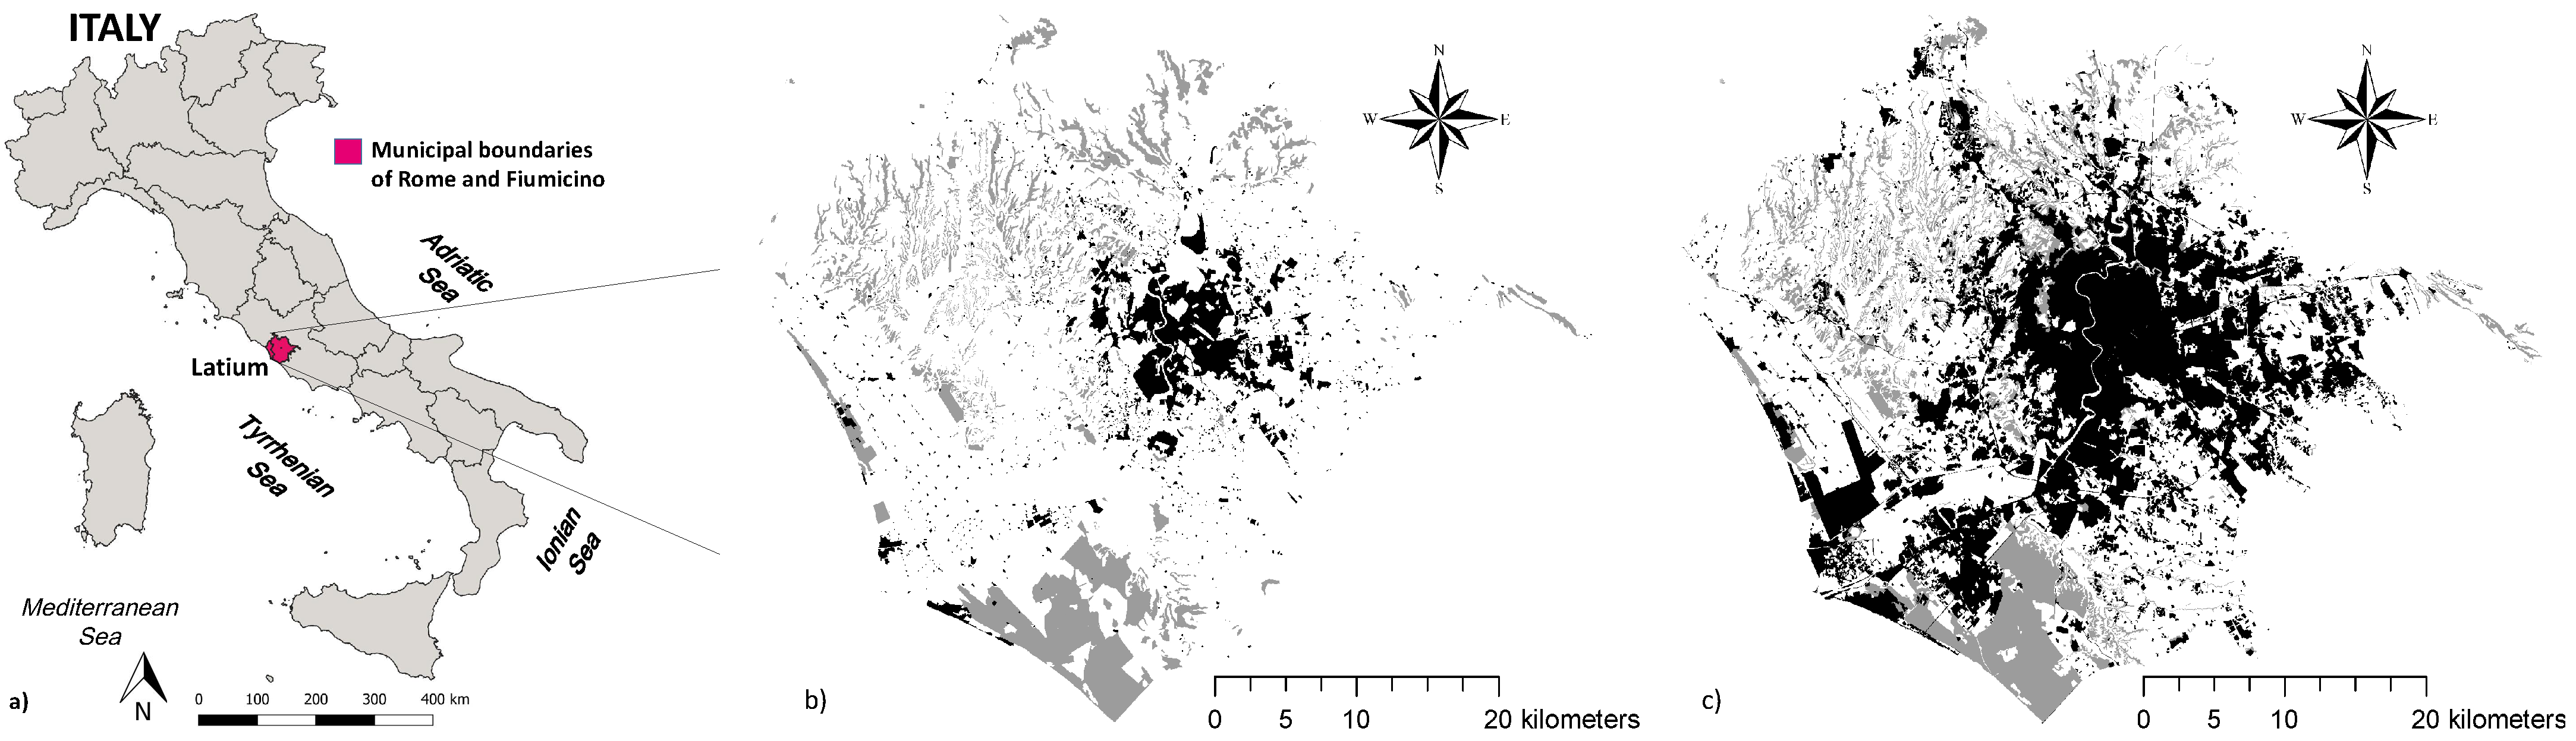
During the investigated period (1949–2016), this area has been subjected to considerable transformations due to a mix of drivers. Among them, Common Agricultural Policy, local market conditions, demographic trends, and conservation measures (e.g., Natura 2000 network) have stimulated on the one hand a strong intensification and simplification of the agricultural productions; on the other, an expansion of land abandonment phenomena, all contributing to an increased environmental fragility of these areas [63,64]. A pivotal role has been played by urban growth impacting agricultural lands and compromising their distinctive socioecological features. The low-density discontinuous settlement that developed on the edges of Rome (Figure 2) penetrates into the Agro Romano, fragmenting its agro-forestry matrix. The negative effects of this expansion can be cumulative and can increasingly affect large areas as shown by the regional distribution of per-capita land consumption computed at the municipal scale.
In particular, despite the fact that Rome exhibits intermediate values for the extent of urban areas on the total municipal area and for per-capita built-up areas partially due to a huge municipal area, the neighboring municipalities exhibit a sprawling urbanization with variable settlement densities that are frequently higher than those observed in the central municipality. Settlements traditionally organized on radial axes around the consolidated city are characterized by variable sealing rates with very heterogeneous percentages in the regional area, particularly high around the county seats (not only in Rome but also in the other Latium provinces), representing sub-centers in expansion. Simultaneously, the original settlement structure in the rural districts of the Agro Romano has been transformed into a medium and low-rise fabric spatially decomposed as a result of urban de-concentration processes only partially devised with consequent spatial colonization of areas located at 20–40 km from the central city.
Urban settlements in Rome can be divided into 2 main districts: (1) the consolidated urban fabric hosting 63.4% of the population (as the percentage share in the total population) with a population density of 4873 inhabitants/km2 and (2) the suburbs hosting the 36.6% of the population (as the percentage share in the total population) with a population density of 1037 inhabitants/km2 (2011 census).
2.2. Land-Use Maps
Following earlier studies [26], a database reporting the surface area of several land-use classes was derived from elaboration of 3 compatible maps with a land nomenclature based on a simplified Corine Land Cover classification system [57,58,59,61,62]: (i) the Italian Istituto Geografico Militare topographic map (1:25,000 scale) produced in 1949, (ii) a land-use map (1:25,000) produced by the Cartographical Service of the Rome’s province authority derived from field surveys and in-house photo-interpretation of digital ortho-photographs taken for cadastral purposes, and (iii) land-use maps (1:25,000) realized by the Cartographical Service of Latium regional authority from photo-interpretation of digital ortho-images released from the Italian National Geoportal. In addition, a first map was originally produced for 1999 and subsequently updated for 2008 and 2016 with new images referring to the same years. Eight homogeneous classes with a minimum mapping unit of 1 hectare have been considered: (i) arable land, (ii) crop mosaic, (iii) vineyards, (iv) olive groves, (v) woodlands, (vi) pastures, (vii) water bodies and wetlands, (viii) impervious land, and (ix) urban parks.
2.3. Land-Use Indicators
In this work, we used per-capita indicators as suggested by the United Nations [66] for the achievement of the Sustainable Development Goals (SDGs). In particular, the 2030 Agenda strongly encourages the adoption of the indicator “relationship between land consumption and population growth”. In addition, Italy has adopted this indicator in the annual report of soil consumption drawn up by ISPRA (Italian National Institute for Environmental Protection and Research, see Reference [65]). For each investigated year (1949, 1974, 1999, 2008, and 2016), a per-capita indicator of surface area by land-use class was constructed considering (i) the total extension (ha) of land devoted to a given class and (ii) the total population residing in the study area (municipalities of Rome and Fiumicino). Total population was derived from integration of population census data (conducted every 10 years in Italy on behalf of the National Statistical Institute, Istat) and results from the national population registry available for each country’s municipality. Annual rates of change over time were also calculated separately for each time interval (1949–1974, 1974–1999, 1999–2008, and 2008–2016) and land-use class.
To summarize long-term land-use patterns and trends in the study area, a Principal Component Analysis (PCA) was run on a matrix composed of two indicators’ sets: (i) the relative proportion of the 9 classes (see above) by year (i.e., class area in total landscape, labelled with ‘c’) and (ii) per-capita surface area (ha) of each land-use class by year (labelled with ‘p’). PCA is a multivariate exploratory technique aimed at analyzing two-way data matrices, inspecting the latent relationship among variables organized by rows and columns together. In our case, PCA provides delineates a dynamic representation of land-use change in the study area considering year-by-year class transformations by evaluating both landscape composition (class area) and land-use intensity (per-capita class area). The input matrix was constituted of 9 land-use classes (columns) and 2 indicators (percent class share in the total landscape and per-capita surface area by class) quantified at five years each (rows) and occupying ten rows. Components were extracted on the base of the absolute eigenvalue. Components with eigenvalue > 1 were regarded as significant and analyzed further for loadings and scores’ structure. A biplot was realized with the aim of illustrating the statistical distribution of component loadings (land-use classes) and scores (indicators and years), evidencing the apparent linkages between land-use composition and landscape structure. This plot provided a refined and summary outlook of similarities and differences in landscape transformations across the study area.
3. Results
The study area has experienced land-use changes over time (Figure 3). Urban growth with sequential acceleration and deceleration waves has been associated with a moderate increase in the forest area. Landscape transformations have negatively impacted the traditional agricultural matrix that has contracted significantly. Urban fabric, initially compact and concentrated around the central city, has gradually expanded into rural areas occupying more than 30% of the surface area administered by Rome’s municipality in 2016 and developing a spatially heterogeneous shape. Based on the landscape structure in 1949, the agricultural matrix formed a natural interface between urban areas and forests. In 2016, it was extremely fragmented, no longer acting as a buffer zone between settlements and woods, and now placed in close contact in most cases. These changes have transformed Rome’s morphology, initially dense and organized mono-centrically around the historical town. During the study period, urban development progressively lost its radio-centric and additive character. In 2016, Rome’s morphology was found more dispersed and spatially discontinuous. Taken together, these preliminary results highlight a transition from a compact form to a more dispersed and fragmented morphology common with other Mediterranean cities.
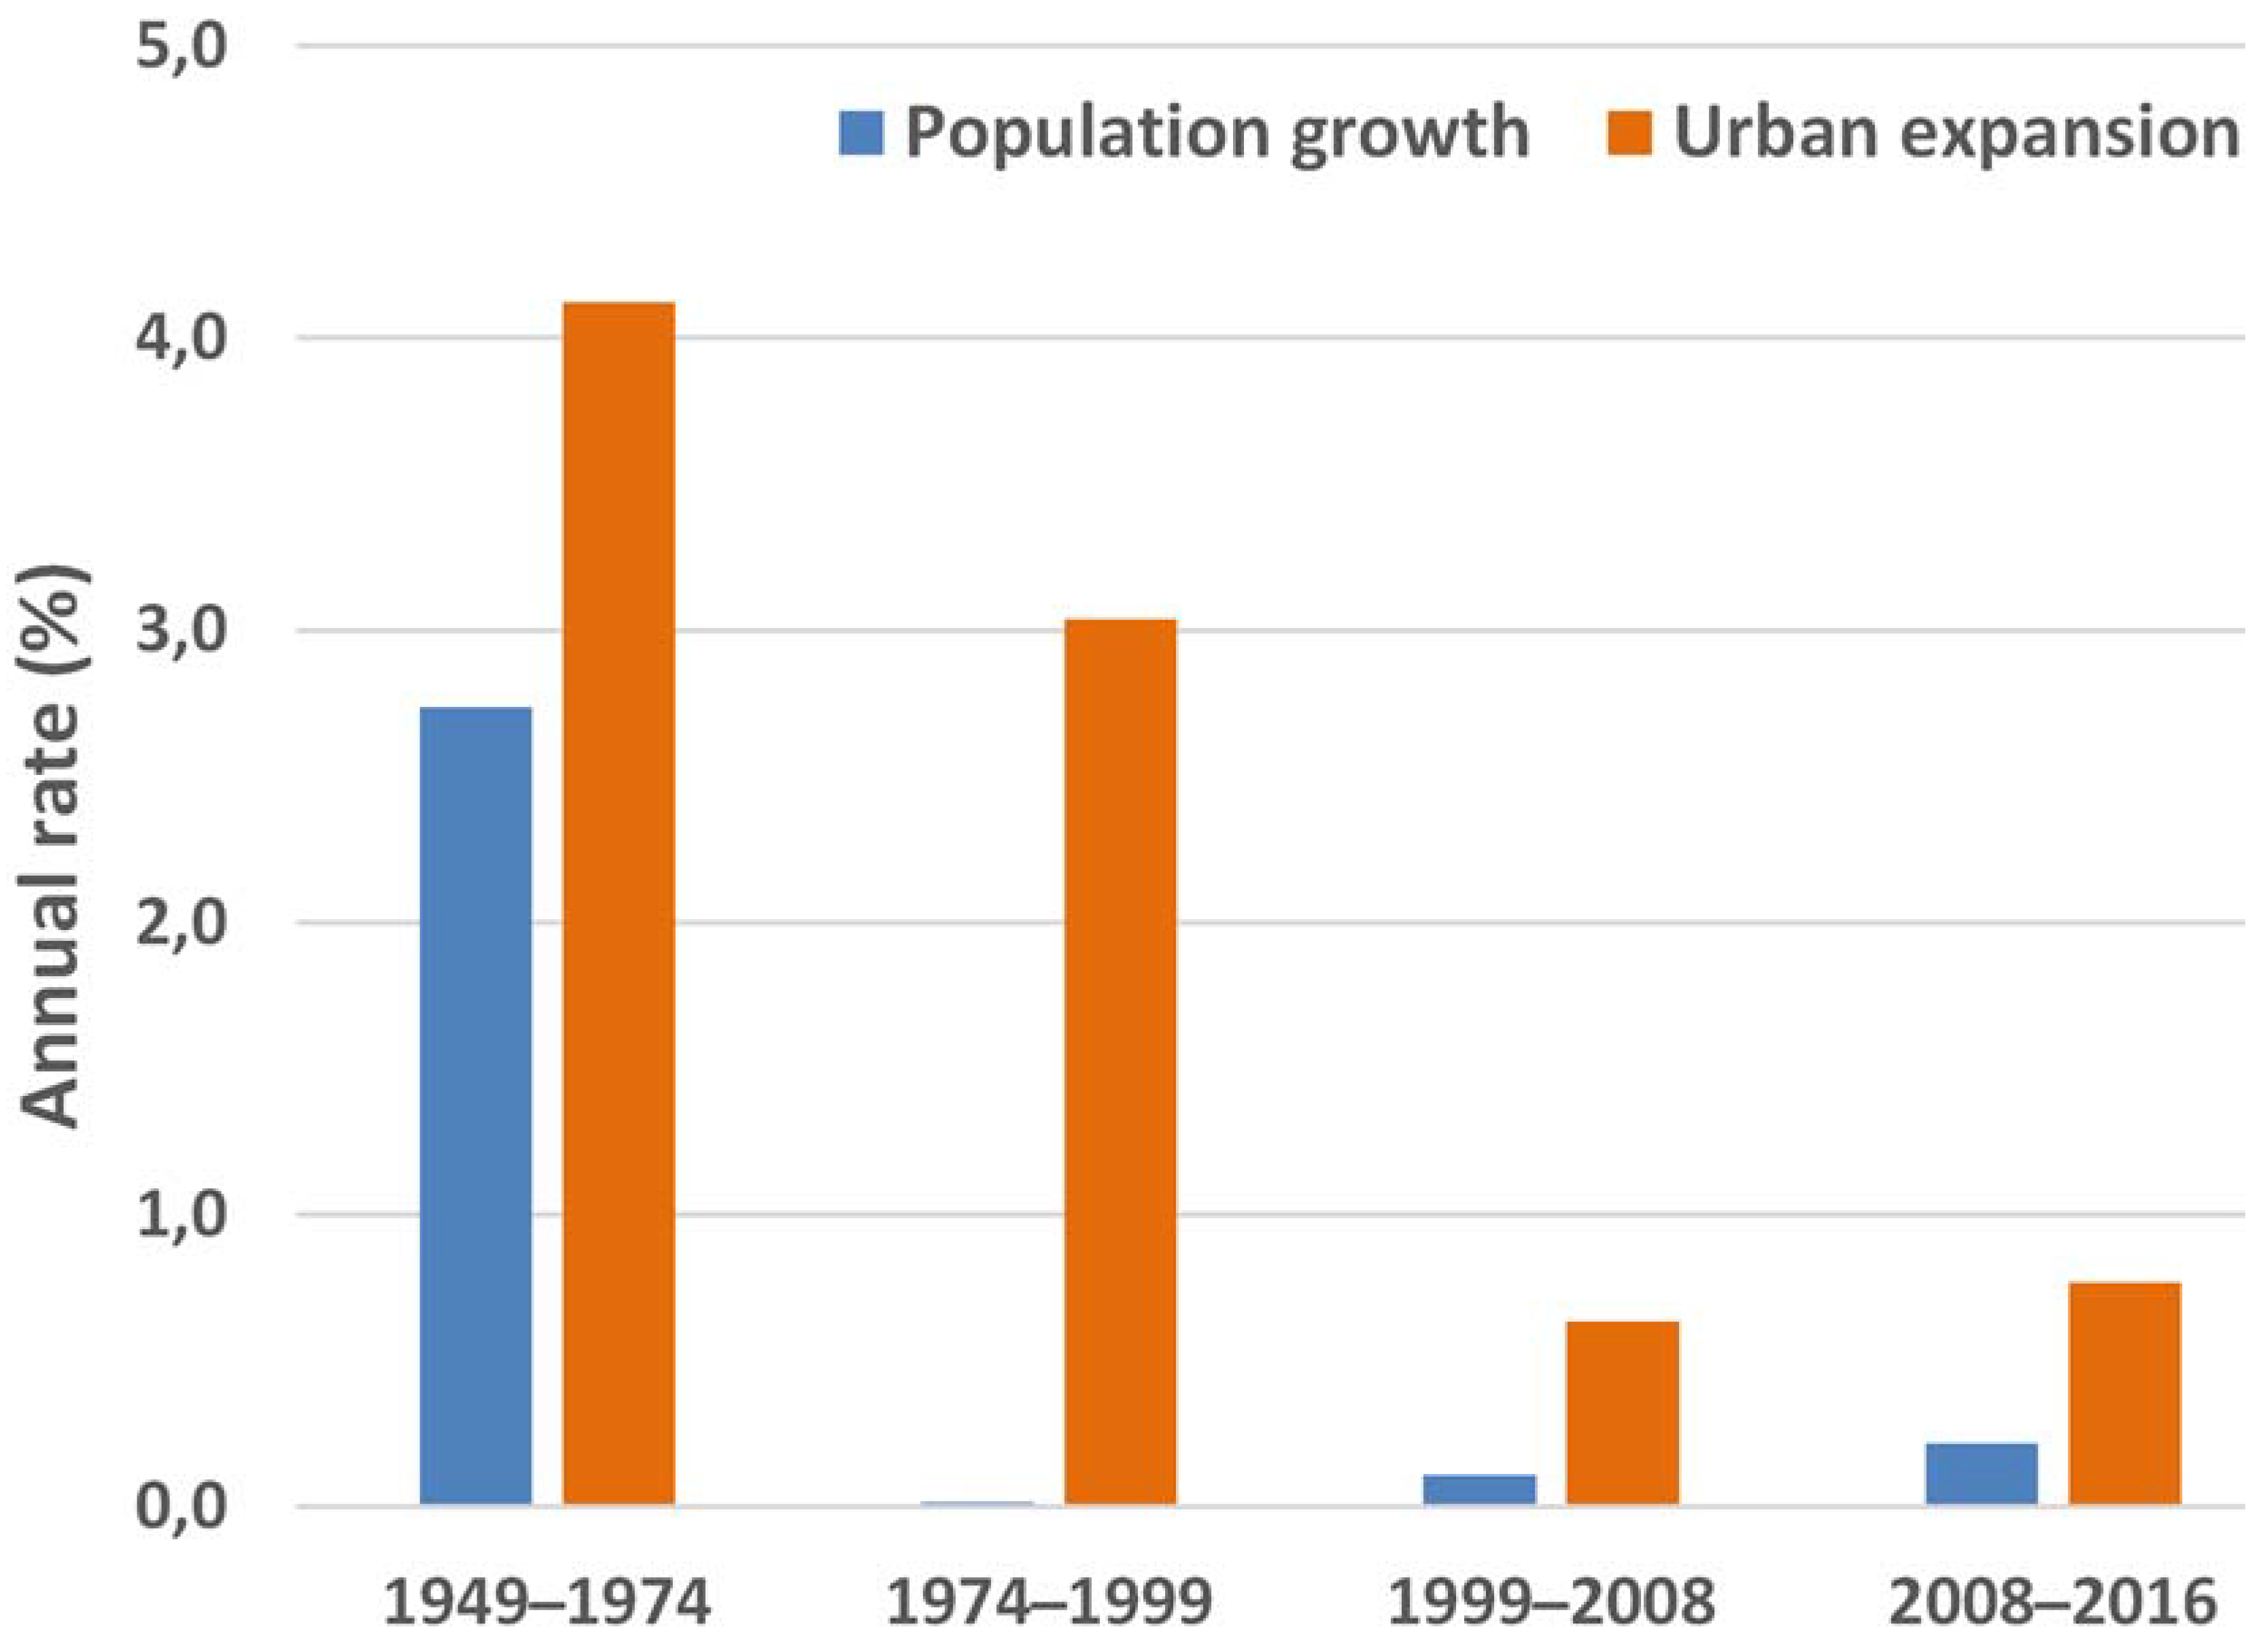
The long-term transformation of Rome’s landscape (1949–2016) coincided with intense population growth in the study area (Figure 3). However, combining urban expansion and population growth rates, different rates of change were observed in the four sub-periods of investigation. The first period (1949–1974) was characterized by a sustained rate of urban expansion (about 4% per year) associated with an equally high rate of population growth (about 3% per year) and their ratio is about 1.5. This period reflects compact, dense, and radio-centric urbanization leveraged by demographic growth. The second time interval (1974–1999) delineated a massive urban expansion (about 3% per year) that did not correspond to a similar demographic trend, though, as the population grew very weakly with a ratio reaching the tremendous value of about 188. This period coincides with a phase of suburbanization, the result of which was the suburban expansion of low-density and spatially dispersed settlements in the metropolitan area. The largest mismatch between urban expansion and population growth was observed at this stage. The two subsequent periods (1999–2008 and 2008–2016) were rather similar, characterized by moderate urban growth in the face of modest demographic dynamics. In relative terms, the mismatch between the two growth rates remained high with ratio values of about 6 and 3.5, respectively.
Considering the availability of different land-uses per-capita as an indicator of long-term transformations in urban, agricultural, and forest landscapes (Table 1), a substantial reduction in per-capita arable land was observed over time. Impervious lands (urban settlements) exhibit opposite dynamics similar to what has been observed for urban parks and gardens, a class physically associated with settlements and therefore dependent on their dynamics over time.
Following a significant decrease in the first time interval (1949–1974), forests have exhibited slight increases in more recent periods. Despite the significant contraction of agricultural areas, the cropland mosaic has undergone an important spatial reorganization. Some agricultural systems exhibited a decrease (vineyards and pastures), while other classes exhibited a slight growth (olive groves). In every case, trends over time have been non-linear, highlighting a substantial heterogeneity that corresponds to very different dynamics over space according to the different phases of urban expansion as better demonstrated in the following analysis. The empirical analysis of per-capita land-use change in the four phases of metropolitan development outlined above highlights different dynamics in the first two time periods, corresponding with two sequential stages of the urban cycle in Europe (urbanization–suburbanization). By contrast, land-use change rates are fairly homogeneous in the two most recent periods (Table 2). These periods represent a rather heterogeneous phase of the urban cycle that combines elements of counter-urbanization (slow but constant land consumption at progressively greater distances from urban centers) and re-urbanization (slow recovery of the population even in central areas). More specifically, urbanization in Rome (1949–1974) coincided with a significant contraction of the per-capita surfaces of almost all agricultural and forest land-use (except olive groves, pastures, and crop mosaics) in favor of urban settlements. In the context of suburbanization (1974–1999), a slower (per-capita) contraction of all agricultural land-use was observed in favor of both urban settlements and forests. In the face of a continuous growth of urban settlements, the natural landscape responded in a very different way in the most recent phases. Arable lands continued to decline significantly. This extensive use of agricultural land characteristic of the study area has constituted a stock of buildable area over the entire study period considering the modest value added.
The agricultural mosaic together with vineyards and olive groves demonstrated evident signs of recovery. This result is in line with a generalized fragmentation of rural spaces at the fringe. Expansion of tree crops coincided with the consolidation of agricultural mosaics, a highly fragmented landscape that retains important elements of naturalness. The future challenge for fragmented landscapes will be to preserve this type of land-use from further isolation, fragmentation, and degradation resulting from urban growth. On the contrary, pastures have undergone a slow but steady decrease in line with what has been observed for arable lands. In the Mediterranean, fringe pastures have traditionally represented a reservoir of land potentially buildable or convertible to other (economically more profitable) uses. From this perspective, the expansion of pastures in 1949–1974 confirms the massive urban pressure typical of that period when pastures, often representing a human-driven evolution of arable lands, were frequently regarded as a ‘temporary’ land use pending ‘speculative’ conversion to more profitable uses. In the subsequent periods, pastures mostly acted as the largest stock of land to be converted, sometimes along with arable land.
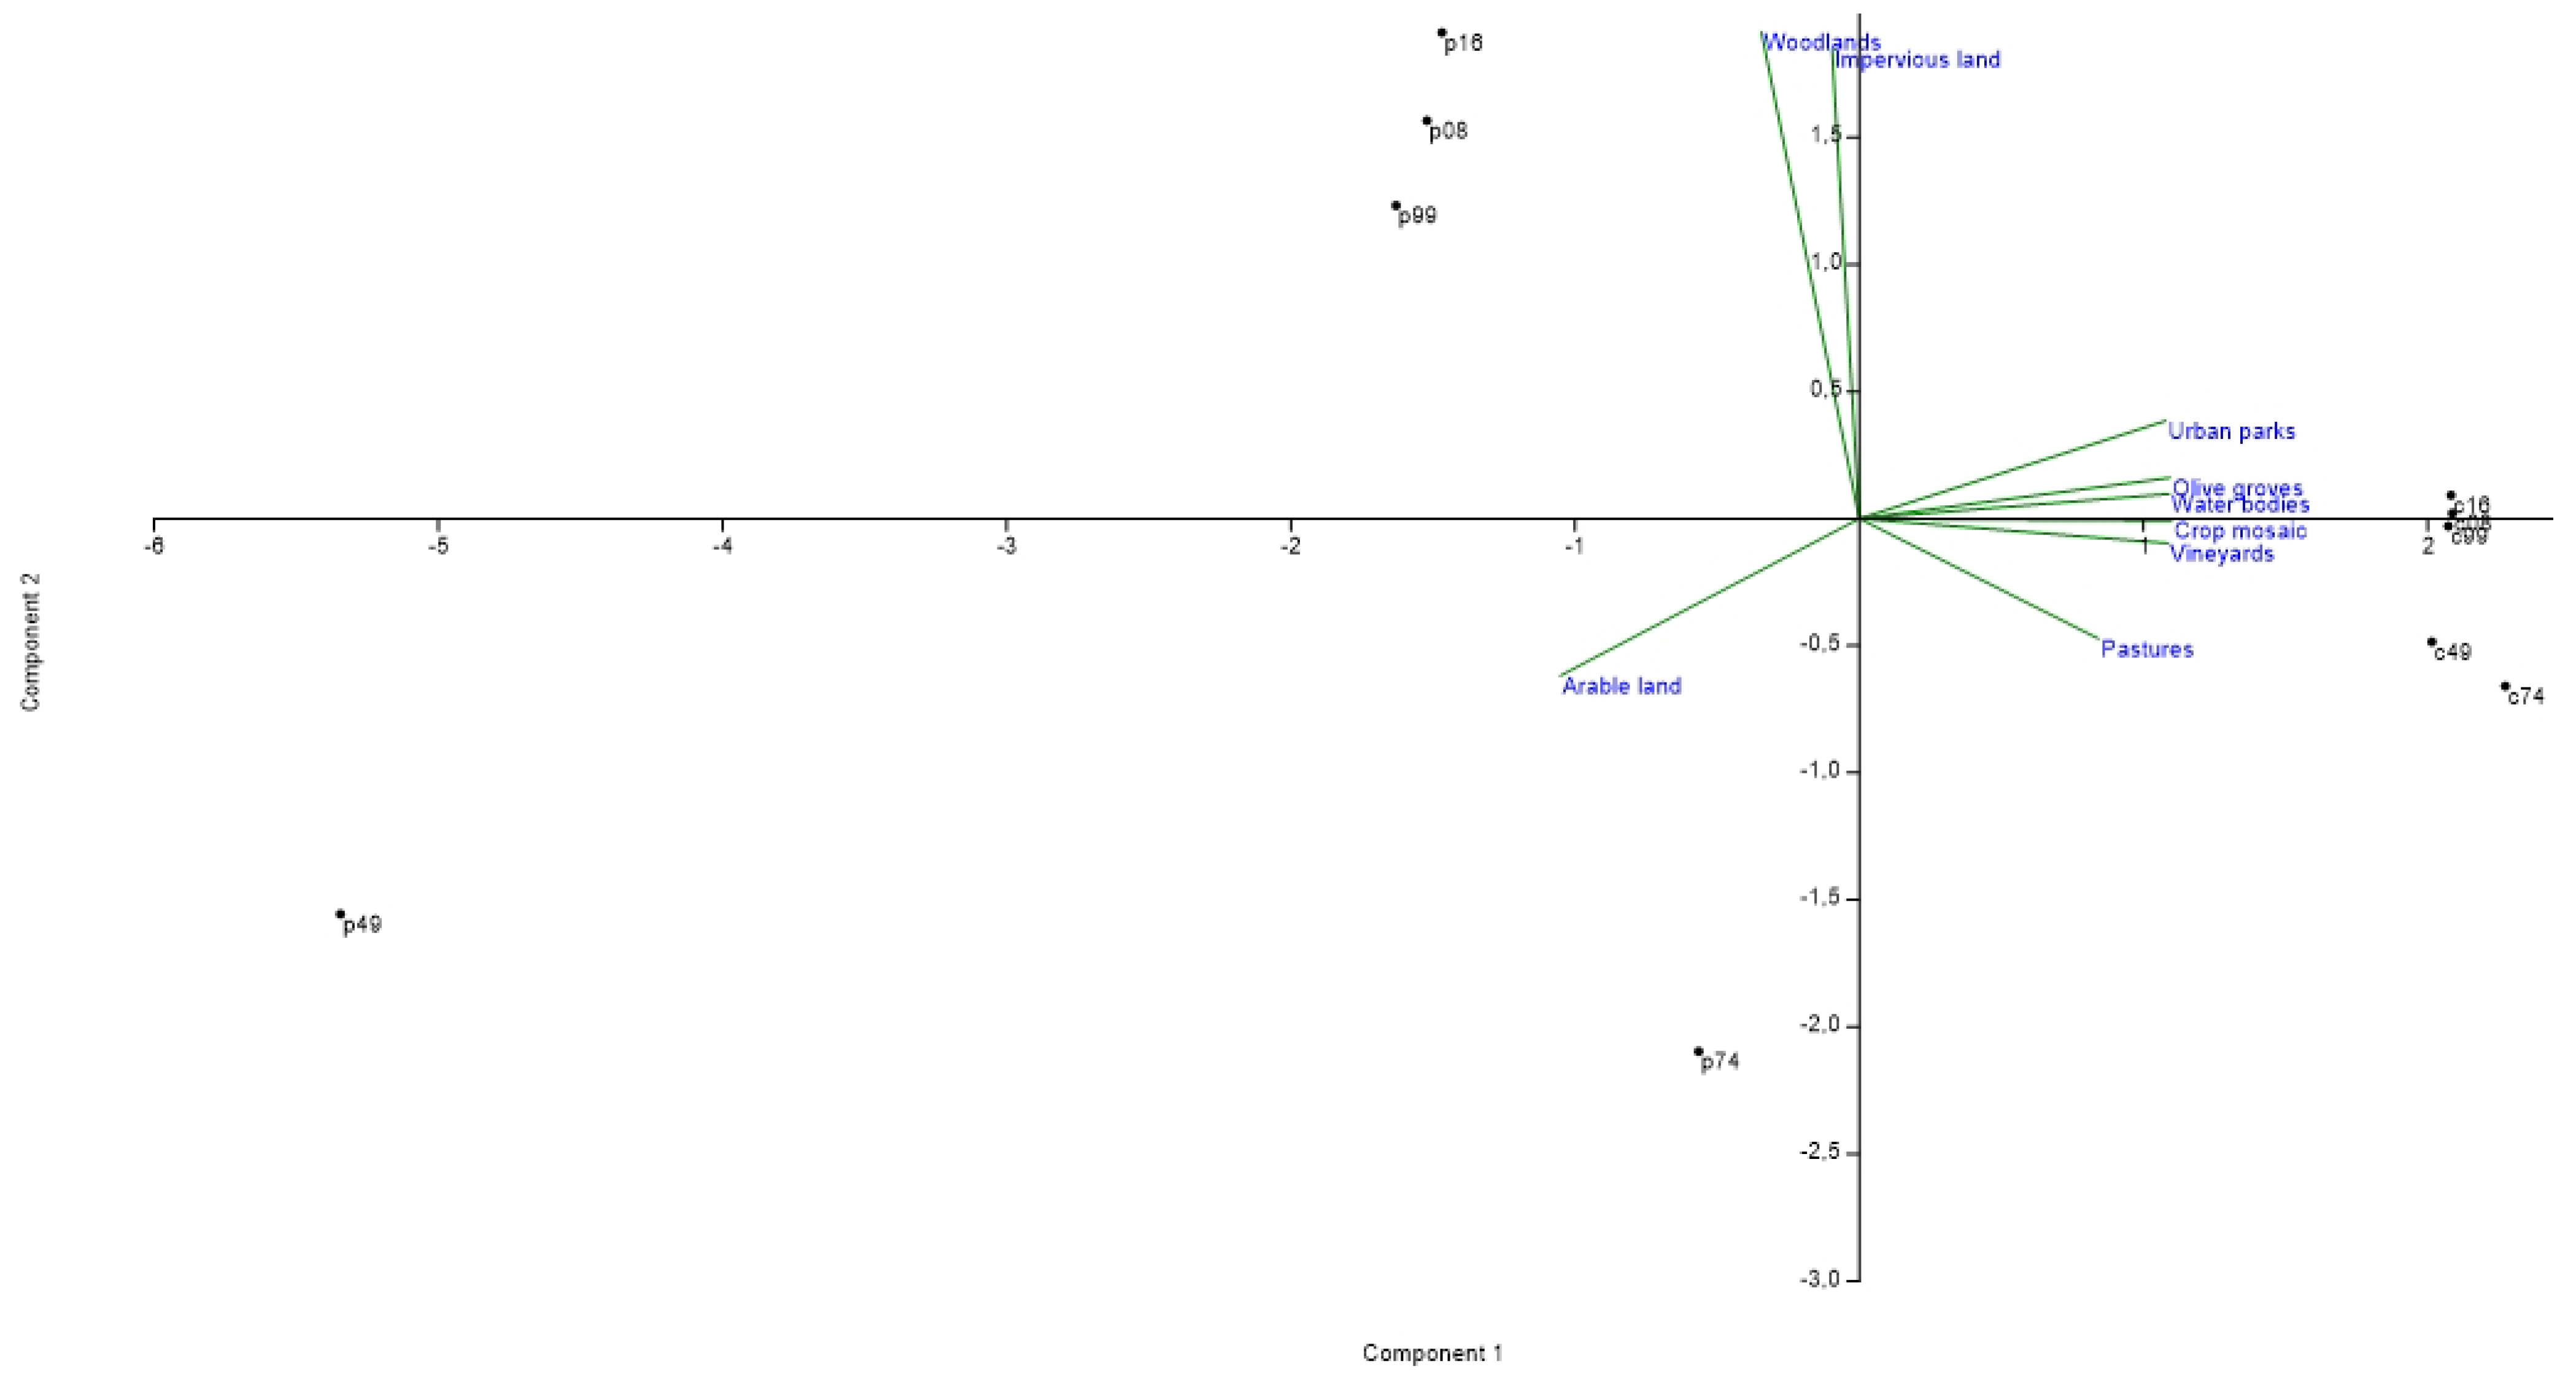
Based on the previous results, a PCA was developed to summarize the main transformations in fringe landscapes and compare the latent trends in terms of the total area and area per-capita for each land-use class (Figure 4). The PCA extracted two axes cumulatively explaining more than 90% of the total variance. Component 1 (71.9%) clearly discriminates the total dynamics (negative scores) from the per-capita land-use indicators (positive scores), differentially depicting trends in the agricultural landscape. In fact, arable lands are considered in opposition to other agricultural land uses. This result highlights how the greatest transformations of the agricultural landscape in the study area concerned the arable lands, which have undergone a strong downsizing in per-capita terms. In contrast, all other uses of agricultural land have experienced much more modest changes. Component 2 (18.7%) demonstrates a marked similarity between urban settlements and forest areas, the two land uses that exhibited increases (more or less strong) during the survey period and to the detriment of agricultural areas. Component 2 also discriminates between earlier periods (p49 and p74) and more recent times (p99, p08, and p16), suggesting a substantial diversification in the three phases of urban development previously outlined (urbanization, suburbanization, and a mixed stage between counter-urbanization and latent re-urbanization).
4. Discussion
The analysis of landscape transformations conducted through the use of per-capita surface indicators by land use class provided an integrated view of environmental and socioeconomic nature. As far as built settlements are concerned, per-capita land-use indicators quantified the mismatch between urban expansion and population growth, outlining distinctive phases of the metropolitan cycle [67]. In the study area, this indicator has assumed profoundly different values in correspondence with (i) compact urbanization and (ii) low-density suburbanization, assuming intermediate values in the most recent period characterized by the coexistence of re-urbanization and counter-urbanization impulses. With regard to non-urban land-use, per-capita indicators provide an even more significant view; in the case of agricultural landscapes, the negative evolution of per-capita cropland indicated the impossibility to satisfy the growing (local) demand for fresh food. These contexts, however, were known for centuries for their specialization in primary production, which experienced a significant decline in the most recent decades [68]. Therefore, a recent analysis [69] argues that there is a need to focus more on the form and quality of urbanization processes rather than simply on the volume and speed of urbanization. Thus, the measure of the amounts of land in urban use and their spatial configuration remains crucial to provide useful information on anticipating future needs and to ensure an adequate supply of public goods such as infrastructure, open spaces, and common facilities for urban expansion [70].
The multivariate analysis clearly indicates the long-term competition between land-use, highlighting the relationship between ‘predators’ (urban settlements and more recently forests) and ‘prey’ (arable land and more recently pastures). This interpretation, in line with earlier studies developed in the Mediterranean basin, highlights the substantial dichotomy between ‘predators’ with a competitive advantage (urban settlements) and more marginal actors (forests) that opportunistically occupy landscape niches left free from abandonment of agricultural land as a result of real estate speculation [70]. This dynamic is visible in marginal areas, while being occasionally observed at the fringe, for example in contexts where physical (e.g., steepness and accessibility) and/or regulatory (planning/zoning) constraints to building are more pronounced [71,72,73]. Simultaneously, our analysis establishes how agricultural landscapes do not experience homogeneous dynamics [74,75,76]. In the face of the originally dominant arable lands that systematically acted as a ‘prey’ between 1949–2016, other land-uses have consolidated their spatial distribution with a significant increase in per-capita surface area. Among these, per-capita increase in olive groves, a ‘synanthropic’ crop in the Mediterranean basin, appears very significant, having occupied peri-urban voids generated by a fragmented growth of low-density settlements [77,78]. The rapid suburbanization process during the 1960s, 1970s, and the following period became a dominant form of urban growth and mainly contributed to the spatial dispersion of urban centers towards the urban fringes. However, remarkably, the dispersal of the employment was slower than that of the city during this period, therefore the commuters’ distances have increased. During 1980s and 1990s, settlement accesses have grown along road infrastructures, encouraging the emergence of new commercial, industrial, and leisure areas. The expansion of urban towards peripheries preying on more arable lands was fueled by the increase of car ownership, the expansion of transport infrastructure, and the emergence of new commercial and industrial areas that have served as new suburban job hubs [79]. The local context was at the base of landscape transformations, having land speculation, second homes, tourism development, and migration as characteristic roles in landscape changes at the fringe [80]. In these regards, socioeconomic factors have demonstrated to influence metropolitan growth in Rome. Assuming the relevance of a comparative analysis of land-use change over a sufficiently long term, a joint monitoring of landscape transformations and population supports sustainable development policies in metropolitan regions [79]. In comparison with northern, central, and western counterparts, southern European metropolises have experienced landscape fragmentation in a context of increasing ecological fragility. Urban sprawl has demonstrated to influence fringe landscapes with changes in the intimate structure of both agricultural and forest mosaics [81]. The intrinsic relationship between landscape transformations and different waves of urban expansion was also illustrated, distinguishing at least three developmental waves, namely urbanization, suburbanization, and a more mixed phase with impulses of counter-urbanization and re-urbanization. Per-capita indicators of land-use change clearly documented the complete unsustainability of recent urban expansion. The intrinsic mismatch between population growth and urban expansion enlarged in recent times, particularly evident during both suburbanization and the most recent developmental wave.
5. Conclusions
Comparative analysis delineating latent patterns and trends in land-use has recently benefited from indicators that assess the intrinsic mismatch between landscape transformations and population growth. Rising availability of high-resolution datasets supports such investigation, allowing for the construction of new indicators and refining empirical approaches to land-use science. An extensive use of per-capita land-use indicators will contribute to monitor the effectiveness of adopted policy measures and forecast possible future land-use changes in a spatial planning perspective. When evaluating long-term transformations of fringe landscapes, the empirical results of our study indicate the increasing mismatch between settlement expansion and population growth that can be easily captured through the ratio between the two growth rates. This ratio goes from the value of just 1.5 for the period of 1949–1974 to the enormous peak of 188 in the time frame of 1974–1999, and then reaches the values of about 6 and 3.5 in the subsequent periods (1999–2008 and 2008–2016, respectively). In combination, this developmental mode reveals all its traits of unsustainability, leading to landscape fragmentation and abnormal consumption of soil resources. Spatial planning (and primarily town master plans) should envisage practical action to contain the unavoidable effects of recent urban growth on the capacity of ecosystems to maintain a complete provision of services and goods in metropolitan region.
Author Contributions
Supervision, M.C.; project administration and funding acquisition, M.C.; conceptualization and writing—original draft preparation, A.S. and A.A.; writing—review and editing, S.C. and L.B.; software and data curation, S.C.; conceptualization, methodology, visualization, and supervision, G.E. and L.B.; writing—review and editing, V.I. All authors have read and agreed to the published version of the manuscript.
Funding
This research received no external funding.
Conflicts of Interest
The authors declare no conflict of interest.
References
- Bruegmann, R. Sprawl: A Compact History; University of Chicago Press: Chicago, IL, USA, 2005. [Google Scholar]
- Couch, C.; Petschel-Held, G.; Leontidou, L. (Eds.) Urban Sprawl in Europe: Landscape, Land-Use Change and Policy, 1st ed.; Wiley-Blackwell: Oxford, UK; Malden, MA, USA, 2007; ISBN 978-1-4051-3917-5. [Google Scholar]
- Brouwer, F.M.; Thomas, A.J.; Chadwick, M.J. Land Use Changes in Europe-Processes of Change, Environmental Transformations and Future Patterns; luwer AcademicPublishers: Dordrecht, The Netherlands, 1991. [Google Scholar]
- Lambin, E.F.; Turner, B.L.; Geist, H.J.; Agbola, S.B.; Angelsen, A.; Bruce, J.W.; Oliver, T.C.; Rodolf, D.; Gunther, F.; Carl, F.; et al. The causes of land-use and land-cover change: Moving beyond the myths. Glob. Environ. Chang. 2001, 11, 261–269. [Google Scholar] [CrossRef]
- Pelorosso, R.; Leone, A.; Boccia, L. Land cover and land use change in the Italian central Apennines: A comparison of assessment methods. Appl. Geogr. 2009, 29, 35–48. [Google Scholar] [CrossRef]
- Simoniello, T.; Coluzzi, R.; Imbrenda, V.; Lanfredi, M. Land cover changes and forest landscape evolution (1985–2009) in a typical Mediterranean agroforestry system (high Agri Valley). Nat. Hazards Earth Syst. Sci. 2015, 15, 1201–1214. [Google Scholar] [CrossRef] [Green Version]
- Imbrenda, V.; Coluzzi, R.; Lanfredi, M.; Loperte, A.; Satriani, A.; Simoniello, T. Analysis of landscape evolution in a vulnerable coastal area under natural and human pressure. Geomat. Nat. Hazards Risk 2018, 9, 1249–1279. [Google Scholar] [CrossRef] [Green Version]
- Coluzzi, R.; D’Emilio, M.; Imbrenda, V.; Giorgio, G.A.; Lanfredi, M.; Macchiato, M.; Simoniello, T.; Telesca, V. Investigating climate variability and long-term vegetation activity across heterogeneous Basilicata agroecosystems. Geomat. Nat. Hazards Risk 2019, 10, 168–180. [Google Scholar] [CrossRef] [Green Version]
- Quaranta, G.; Salvia, R.; Salvati, L.; Paola, V.D.; Coluzzi, R.; Imbrenda, V.; Simoniello, T. Long-Term Impacts of Grazing Management on Land Degradation in a Rural Community of Southern Italy: Depopulation Matters. Land Degrad. Dev. 2020, 31, 1–16. [Google Scholar] [CrossRef]
- Salvati, L.; Zambon, I.; Chelli, F.M.; Serra, P. Do Spatial Patterns of Urbanization and Land Consumption Reflect Different Socioeconomic Contexts in Europe? Sci. Total Environ. 2018, 625, 722–730. [Google Scholar] [CrossRef]
- O’Sullivan, A. Urban Economics; McGraw-Hill/Irwin: New York, NY, USA, 2002. [Google Scholar]
- Oueslati, W.; Alvanides, S.; Garrod, G. Determinants of Urban Sprawl in European Cities. Urban Stud. 2015, 52, 1594–1614. [Google Scholar] [CrossRef] [Green Version]
- Capello, R.; Nijkamp, P. Urban Dynamics and Growth: Advances in Urban. Economics: 266; North Holland: Amsterdam, Holland, 2004; ISBN 978-0-444-51481-3. [Google Scholar]
- Coulson, N.E. Really Useful Tests of the Monocentric Model. Land Econ. 1991, 67, 299–307. [Google Scholar] [CrossRef]
- Ahlfeldt, G. If Alonso Was Right: Modeling Accessibility and Explaining the Residential Land Gradient. J. Reg. Sci. 2011, 51, 318–338. [Google Scholar] [CrossRef]
- Kazemzadeh-Zow, A.; Shahraki, S.Z.; Salvati, L.; Samani, N.N. A Spatial Zoning Approach to Calibrate and Validate Urban Growth Models. Int. J. Geogr. Inf. Sci. 2017, 31, 763–782. [Google Scholar] [CrossRef]
- Salvati, L.; Ciommi, M.T.; Serra, P.; Chelli, F.M. Exploring the Spatial Structure of Housing Prices Under Economic Expansion and Stagnation: The Role of Socio-Demographic Factors in Metropolitan Rome, Italy. Land Use Policy 2019, 81, 143–152. [Google Scholar] [CrossRef]
- Schwarz, N. Urban Form Revisited—Selecting Indicators for Characterising European Cities. Landsc. Urban Plan. 2010, 96, 29–47. [Google Scholar] [CrossRef]
- Kasanko, M.; Barredo, J.I.; Lavalle, C.; McCormick, N.; Demicheli, L.; Sagris, V.; Brezger, A. Are European Cities Becoming Dispersed? A Comparative Analysis of 15 European Urban Areas. Landsc. Urban Plan. 2006, 77, 111–130. [Google Scholar] [CrossRef]
- Chelleri, L.; Schuetze, T.; Salvati, L. Integrating Resilience with Urban Sustainability in Neglected Neighborhoods: Challenges and Opportunities of Transitioning to Decentralized Water Management in Mexico City. Habitat Int. 2015, 48, 122–130. [Google Scholar] [CrossRef]
- Salvati, L.; Ferrara, A.; Chelli, F. Long-Term Growth and Metropolitan Spatial Structures: An Analysis of Factors Influencing Urban Patch Size under Different Economic Cycles. Geogr. Tidsskr./Dan. J. Geogr. 2018, 118, 56–71. [Google Scholar] [CrossRef]
- Imbrenda, V.; Quaranta, G.; Salvia, R.; Egidi, G.; Salvati, L.; ProkopovÃ, M.; Coluzzi, R.; Lanfredi, M. Land degradation and metropolitan expansion in a peri-urban environment. Geomat. Nat. Hazards Risk 2021, 12, 1797–1818. [Google Scholar] [CrossRef]
- Di Feliciantonio, C.; Salvati, L. ‘Southern’ Alternatives of Urban Diffusion: Investigating Settlement Characteristics and Socio-economic Patterns in Three Mediterranean Regions. Tijdschr. voor Econ. en Soc. Geogr. 2015, 106, 453–470. [Google Scholar] [CrossRef]
- De Rosa, S.; Salvati, L. Beyond a ‘Side Street Story’? Naples from Spontaneous Centrality to Entropic Polycentricism, towards a ‘Crisis City’. Cities 2016, 51, 74–83. [Google Scholar] [CrossRef]
- Cuadrado-Ciuraneta, S.; Durà-Guimerà, A.; Salvati, L. Not Only Tourism: Unravelling Suburbanization, Second-Home Expansion and “Rural” Sprawl in Catalonia, Spain. Urban Geogr. 2017, 38, 66–89. [Google Scholar] [CrossRef]
- Cecchini, M.; Zambon, I.; Pontrandolfi, A.; Turco, R.; Colantoni, A.; Mavrakis, A.; Salvati, L. Urban Sprawl and the ‘Olive’ Landscape: Sustainable Land Management for ‘Crisis’ Cities. GeoJournal 2019, 84, 237–255. [Google Scholar] [CrossRef]
- Schneider, A.; Woodcock, C.E. Compact, Dispersed, Fragmented, Extensive? A Comparison of Urban Growth in Twenty-Five Global Cities Using Remotely Sensed Data, Pattern Metrics and Census Information. Urban Stud. 2008, 45, 659–692. [Google Scholar] [CrossRef]
- Burger, M.; Meijers, E. Form Follows Function? Linking Morphological and Functional Polycentricity. Urban Stud. 2012, 49, 1127–1149. [Google Scholar] [CrossRef]
- Salvati, L. Agro-Forest Landscape and the ‘Fringe’ City: A Multivariate Assessment of Land-Use Changes in a Sprawling Region and Implications for Planning. Sci. Total Environ. 2014, 490, 715–723. [Google Scholar] [CrossRef]
- Veneri, P. The Identification of Sub-Centres in Two Italian Metropolitan Areas: A Functional Approach. Cities 2013, 31, 177–185. [Google Scholar] [CrossRef] [Green Version]
- Turok, I.; Mykhnenko, V. The Trajectories of European cities, 1960–2005. Cities 2007, 24, 165–182. [Google Scholar] [CrossRef]
- Pili, S.; Grigoriadis, E.; Carlucci, M.; Clemente, M.; Salvati, L. Towards Sustainable Growth? A Multi-Criteria Assessment of (Changing) Urban Forms. Ecol. Indic. 2017, 76, 71–80. [Google Scholar] [CrossRef]
- Di Feliciantonio, C.; Salvati, L.; Sarantakou, E.; Rontos, K. Class Diversification, Economic Growth and Urban Sprawl: Evidences from a Pre-Crisis European city. Qual. Quant. 2018, 52, 1501–1522. [Google Scholar] [CrossRef]
- Salvati, L. The Dark Side of the Crisis: Disparities in Per Capita Income (2000–12) and the Urban–Rural Gradient in Greece. Tijdschr. Econ. Soc. Geogr. 2016, 107, 628–641. [Google Scholar] [CrossRef]
- Samat, N.; Hasni, R.; Elhadary, Y. Modelling Land Use Changes at the Peri-Urban Areas Using Geographic Information Systems and Cellular Automata Model. J. Sustain. Dev. 2011, 4, 72. [Google Scholar] [CrossRef]
- Chorianopoulos, I.; Pagonis, T.; Koukoulas, S.; Drymoniti, S. Planning, Competitiveness and Sprawl in the Mediterranean City: The Case of Athens. Cities 2010, 27, 249–259. [Google Scholar] [CrossRef]
- Terzi, F.; Bolen, F. Urban Sprawl Measurement of Istanbul. Eur. Plan. Stud. 2009, 17, 1559–1570. [Google Scholar] [CrossRef]
- Alphan, H. Land-Use Change and Urbanization of Adana, Turkey. Land Degrad. Dev. 2003, 14, 575–586. [Google Scholar] [CrossRef]
- Matteucci, S.D.; Morello, J. Environmental Consequences of Exurban Expansion in an Agricultural Area: The Case of the Argentinian Pampas Ecoregion. Urban Ecosyst. 2009, 12, 287–310. [Google Scholar] [CrossRef]
- Kane, K.; Connors, J.P.; Galletti, C.S. Beyond Fragmentation at the Fringe: A Path-Dependent, High-Resolution Analysis of Urban Land Cover in Phoenix, Arizona. Appl. Geogr. 2014, 52, 123–134. [Google Scholar] [CrossRef]
- Anselm, N.; Brokamp, G.; Schütt, B. Assessment of Land Cover Change in Peri-Urban High Andean Environments South of Bogotá, Colombia. Land 2018, 7, 75. [Google Scholar] [CrossRef] [Green Version]
- York, A.M.; Shrestha, M.; Boone, C.G.; Zhang, S.; Harrington, J.A.; Prebyl, T.J.; Swann, A.; Agar, M.; Antolin, M.F.; Nolen, B.; et al. Land Fragmentation under Rapid Urbanization: A cross-site analysis of southwestern cities. Urban Ecosyst. 2011, 14, 429–455. [Google Scholar] [CrossRef]
- Çakir, G.; Ün, C.; Baskent, E.Z.; Köse, S.; Sivrikaya, F.; Keleş, S. Evaluating Urbanization, Fragmentation and Land Use/Land Cover Change Pattern in Istanbul City, Turkey from 1971 TO 2002. Land Degrad. Dev. 2008, 19, 663–675. [Google Scholar] [CrossRef]
- Catalán, B.; Saurí, D.; Serra, P. Urban Sprawl in the Mediterranean? Patterns of Growth and Change in the Barcelona Metropolitan Region 1993–2000. Landsc. Urban. Plan. 2008, 85, 174–184. [Google Scholar] [CrossRef]
- Salvati, L.; Serra, P. Estimating Rapidity of Change in Complex Urban Systems: A Multidimensional, Local-Scale Approach. Geogr. Anal. 2016, 48, 132–156. [Google Scholar] [CrossRef]
- Zambon, I.; Serra, P.; Sauri, D.; Carlucci, M.; Salvati, L. Beyond the ‘Mediterranean City’: Socioeconomic Disparities and Urban Sprawl in Three Southern European Cities. Geogr. Ann. Ser. B Hum. Geogr. 2017, 99, 319–337. [Google Scholar] [CrossRef]
- Jarah, S.H.A.; Zhou, B.; Abdullah, R.J.; Lu, Y.; Yu, W. Urbanization and Urban Sprawl Issues in City Structure: A Case of the Sulaymaniah Iraqi Kurdistan Region. Sustainability 2019, 11, 485. [Google Scholar] [CrossRef] [Green Version]
- Zambon, I.; Benedetti, A.; Ferrara, C.; Salvati, L. Soil Matters? A Multivariate Analysis of Socioeconomic Constraints to Urban Expansion in Mediterranean Europe. Ecol. Econ. 2018, 146, 173–183. [Google Scholar] [CrossRef]
- Hassan, M.M. Monitoring Land Use/Land Cover Change, Urban Growth Dynamics and Landscape Pattern Analysis in Five Fastest Urbanized Cities in Bangladesh. Remote Sens. Appl. Soc. Environ. 2017, 7, 69–83. [Google Scholar] [CrossRef]
- Serra, P.; Vera, A.; Tulla, A.F.; Salvati, L. Beyond Urban–Rural Dichotomy: Exploring Socioeconomic and Land-Use Processes of Change in Spain (1991–2011). Appl. Geogr. 2014, 55, 71–81. [Google Scholar] [CrossRef]
- Attorre, F.; Bruno, M.; Francesconi, F.; Valenti, R.; Bruno, F. Landscape Changes of Rome through Tree-Lined Roads. Landsc. Urban Plan. 2000, 49, 115–128. [Google Scholar] [CrossRef]
- Tsai, Y.-H. Quantifying Urban Form: Compactness versus “Sprawl”. Urban Stud. 2005, 42, 141–161. [Google Scholar] [CrossRef]
- Carlucci, M.; Grigoriadis, E.; Rontos, K.; Salvati, L. Revisiting a Hegemonic Concept: Long-Term ‘Mediterranean Urbanization’ in between City Re-Polarization and Metropolitan Decline. Appl. Spat. Anal. 2017, 10, 347–362. [Google Scholar] [CrossRef]
- Gavalas, V.S.; Rontos, K.; Salvati, L. Who Becomes an Unwed Mother in Greece? Sociodemographic and Geographical Aspects of an Emerging Phenomenon. Popul. Space Place 2014, 20, 250–263. [Google Scholar] [CrossRef]
- Weber, C.; Petropoulou, C.; Hirsch, J. Urban Development in the Athens Metropolitan Area Using Remote Sensing Data with Supervised Analysis and GIS. Int. J. Remote Sens. 2005, 26, 785–796. [Google Scholar] [CrossRef]
- Yu, Z.; Zhang, J.; Yang, G.; Schlaberg, J. Reverse Thinking: A New Method from the Graph Perspective for Evaluating and Mitigating Regional Surface Heat Islands. Remote Sens. 2021, 13, 1127. [Google Scholar] [CrossRef]
- Frenkel, A.; Ashkenazi, M. Measuring Urban Sprawl: How Can We Deal With It? Environ. Plann. B Plann. Des. 2008, 35, 56–79. [Google Scholar] [CrossRef] [Green Version]
- Ioannidis, C.; Psaltis, C.; Potsiou, C. Towards a Strategy for Control of Suburban Informal Buildings Through Automatic Change Detection. Comput. Environ. Urban Syst. 2009, 33, 64–74. [Google Scholar] [CrossRef]
- Lanfredi, M.; Coppola, R.; Simoniello, T.; Coluzzi, R.; D’Emilio, M.; Imbrenda, V.; Macchiato, M. Early Identification of Land Degradation Hotspots in Complex Bio-Geographic Regions. Remote. Sens. 2015, 7, 8154–8179. [Google Scholar] [CrossRef] [Green Version]
- Longhi, C.; Musolesi, A. European Cities in the Process of Economic Integration: Towards Structural Convergence. Ann. Reg. Sci. 2007, 41, 333–351. [Google Scholar] [CrossRef]
- Romano, B.; Zullo, F.; Fiorini, L.; Marucci, A.; Ciabò, S. Land Transformation of Italy Due to Half a Century of Urbanization. Land Use Policy 2017, 67, 387–400. [Google Scholar] [CrossRef]
- Fiorini, L.; Zullo, F.; Marucci, A.; Romano, B. Land Take and Landscape Loss: Effect of Uncontrolled Urbanization in Southern italy. J. Urban Manag. 2019, 8, 42–56. [Google Scholar] [CrossRef]
- Salvati, L. Agricultural Land-Use Changes and Soil Quality: Evaluating Long-Term Trends in a Rural Mediterranean Region. Int. Sch. Res. Not. 2013, 2013, 18240. [Google Scholar] [CrossRef] [Green Version]
- Salvati, L.; De Zuliani, E.; Sabbi, A.; Cancellieri, L.; Tufano, M.; Caneva, G.; Savo, V. Land-cover changes and sustainable development in a rural cultural landscape of central Italy: Classical trends and counter-intuitive results. Int. J. Sustain. Dev. World Ecol. 2017, 24, 27–36. [Google Scholar] [CrossRef]
- Marchetti, M.; Marino, D.; De Toni, A.; Giaccio, V.; Giannelli, A.; Mastronardi, L. Soil Consumption, Territorial Dynamics and Ecosystem Services (in Italian); ISPRA (Italian National Institute for Environmental Protection and Research, see Reference), Annual Report 2017. Available online: https://www.isprambiente.gov.it/en/publications/reports/soil-consumption-in-italy-1 (accessed on 16 July 2021).
- Union Nations. Transforming Our World: The 2030 Agenda for Sustainable Development. A/RES/70/1.2015. Available online: http://www.un.org/en/ga/search/view_doc.asp?symbol=A/RES/70/1 (accessed on 16 July 2021).
- Antrop, M. Landscape Change and the Urbanization Process in Europe. Landsc. Urban Plan. 2004, 67, 9–26. [Google Scholar] [CrossRef]
- Anarfi, K.; Hill, R.A.; Shiel, C. Highlighting the Sustainability Implications of Urbanisation: A Comparative Analysis of Two Urban Areas in Ghana. Land 2020, 9, 300. [Google Scholar] [CrossRef]
- OECD. Trends in Urbanisation and Urban Policies in OECD Countries: What Lessons for China? Organisation for Economic Co-Operation and Development and China Development Research Foundation. 2010. Available online: http://www.oecd.org/dataoecd/2/18/45159707.pdf (accessed on 16 July 2021).
- Robert, S.; Fox, D.; Boulay, G.; Grandclément, A.; Garrido, M.; Pasqualini, V.; Prévost, A.; Schleyer-Lindenmann, A.; Trémélo, M.-L. A Framework to Analyse Urban Sprawl in the French Mediterranean Coastal Zone. Reg. Environ. Chang. 2019, 19, 559–572. [Google Scholar] [CrossRef]
- Pozoukidou, G.; Ntriankos, I. Measuring and Assessing Urban Sprawl: A Proposed Indicator System for the City of Thessaloniki, Greece. Remote Sens. Appl. Soc. Environ. 2017, 8, 30–40. [Google Scholar] [CrossRef]
- Herrschel, T. City Regions, Polycentricity and the Construction of Peripheralities Through Governance. Urban Res. Pract. 2009, 2, 240–250. [Google Scholar] [CrossRef] [Green Version]
- Brezzi, M.; Veneri, P. Assessing Polycentric Urban Systems in the OECD: Country, Regional and Metropolitan Perspectives. Eur. Plan. Stud. 2015, 23, 1128–1145. [Google Scholar] [CrossRef]
- Paül, V.; Tonts, M. Containing Urban Sprawl: Trends in Land Use and Spatial Planning in the Metropolitan Region of Barcelona. J. Environ. Plan. Manag. 2005, 48, 7–35. [Google Scholar] [CrossRef]
- Volgmann, K.; Münter, A. Understanding Metropolitan Growth in German Polycentric Urban Regions. Reg. Stud. 2020, 1–14. [Google Scholar] [CrossRef]
- Lagarias, A.; Sayas, J. Urban Sprawl in the Mediterranean: Evidence from coastal medium-sized cities. Reg. Sci. Inq. 2018, 10, 15–32. [Google Scholar]
- Guastella, G.; Oueslati, W.; Pareglio, S. Patterns of Urban Spatial Expansion in European Cities. Sustainability 2019, 11, 2247. [Google Scholar] [CrossRef] [Green Version]
- Fertner, C.; Jørgensen, G.; Nielsen, T.A.S.; Nilsson, K.S.B. Urban Sprawl and Growth Management-Drivers, Impacts and Responses in Selected European and us Cities. Future Cities Environ. 2016, 2, 1–13. [Google Scholar] [CrossRef]
- Meijers, E. Measuring polycentricity and its promises. Eur. Plan. Stud. 2008, 16, 1313–1323. [Google Scholar] [CrossRef]
- European Environment Agency Urban Sprawl in Europe–The Ignored Challenge. Copenhagen, Denmark. 2006. Available online: https://www.eea.europa.eu/publications/eea_report_2006_10/eea_report_10_2006.pdf/view (accessed on 16 July 2021).
- Patacchini, E.; Zenou, Y.; Henderson, J.V.; Epple, D. Urban Sprawl in Europe. Brook. Whart. Pap. Urban Aff. 2009, 125–149. [Google Scholar]
Figure 1.
A map indicating the position of the study area (Rome and Fiumicino municipality) in Central Italy (a) and two maps illustrating the spatial distribution of basic land-use classes (black: urban settlements; grey: woodlands; and white: agricultural areas) in Rome 1949 (b); 2016 (c). Urban settlements include impervious land and urban parks; agricultural areas include arable land, crop mosaic, vineyards, and olive groves; and woodlands include forests, pastures, and water bodies.

Figure 2.
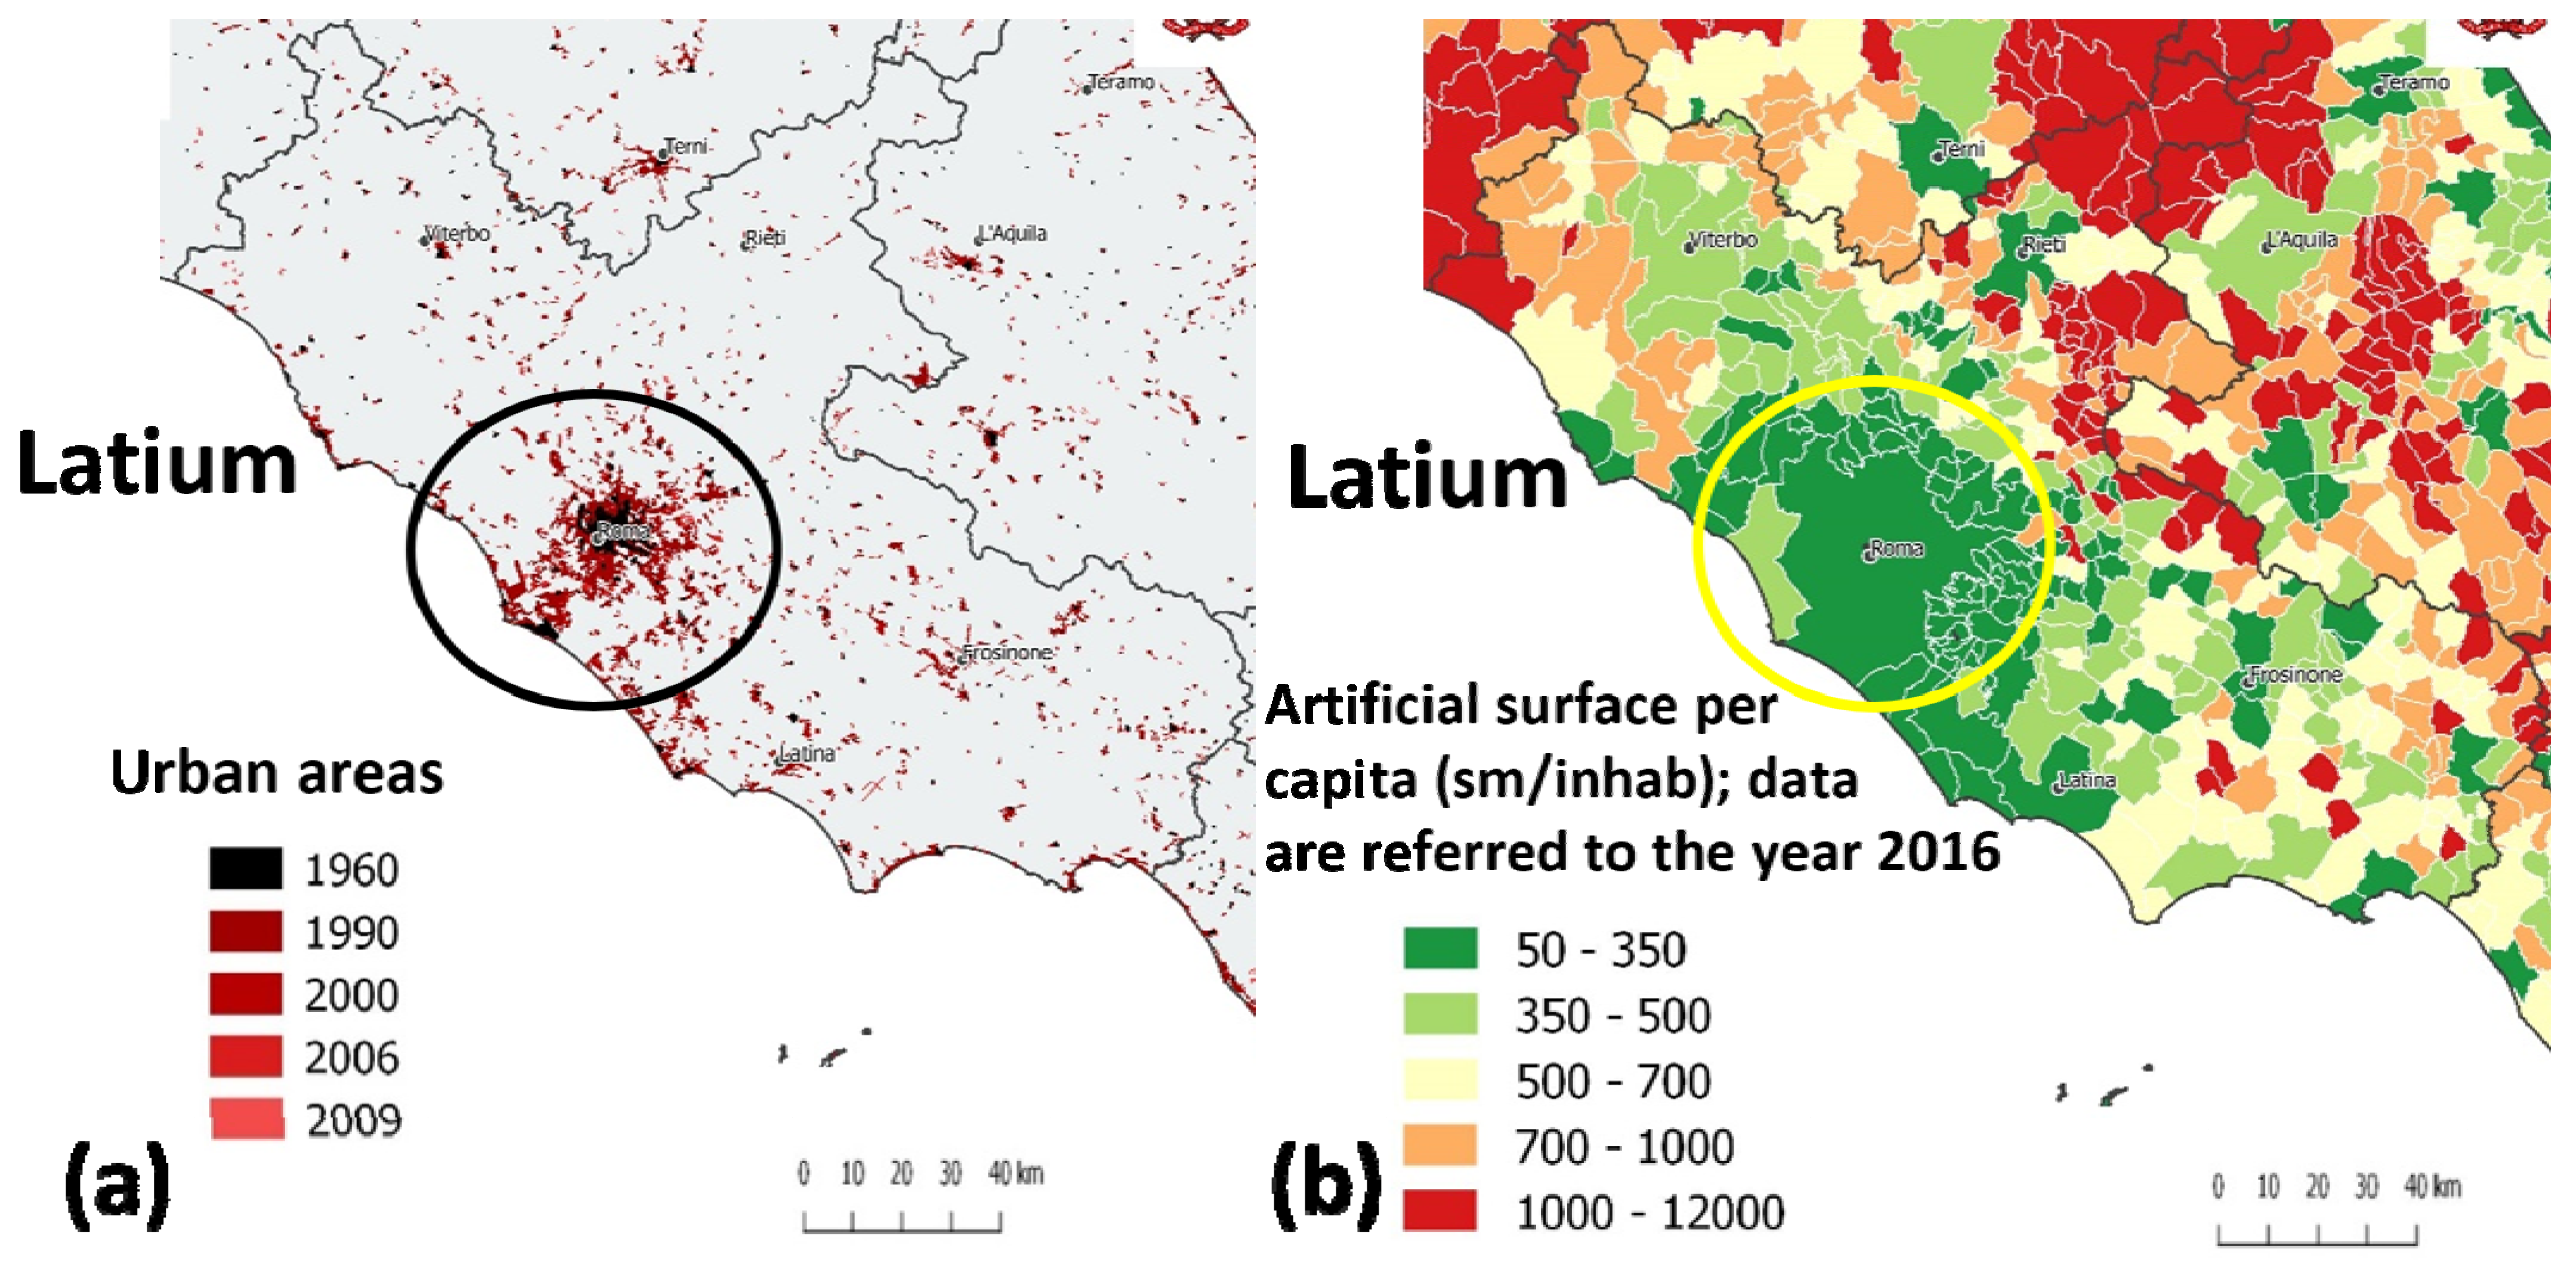
Boundaries of the Latium region located at the heart of Italy. Within the circle the municipalities of Rome and Fiumicino are shown with their corresponding urban areas (1960–2009, sub-figure (a)) and 2016 artificial surface per-capita (sub-figure (b)). These figures are taken from the annual report (2017) that ISPRA (Italian National Institute for Environmental Protection and Research) draws up on soil consumption, territorial dynamics and ecosystem services [65].
Figure 2.
Boundaries of the Latium region located at the heart of Italy. Within the circle the municipalities of Rome and Fiumicino are shown with their corresponding urban areas (1960–2009, sub-figure (a)) and 2016 artificial surface per-capita (sub-figure (b)). These figures are taken from the annual report (2017) that ISPRA (Italian National Institute for Environmental Protection and Research) draws up on soil consumption, territorial dynamics and ecosystem services [65].

Figure 3.
Percent annual rate of growth (population: blue; settlements: orange) by time interval in Rome. Urban expansion includes impervious land and parks/gardens within the city.
Figure 3.
Percent annual rate of growth (population: blue; settlements: orange) by time interval in Rome. Urban expansion includes impervious land and parks/gardens within the city.

Figure 4.
Results of a Principal Component Analysis run on the matrix including percent rates of change in land-use and per-capita land-use in Rome, 1949–2016.
Figure 4.
Results of a Principal Component Analysis run on the matrix including percent rates of change in land-use and per-capita land-use in Rome, 1949–2016.


Table 1.
Per-capita surface area (hectares) by land-use class in Rome, 1949–2016.
| Class | 1949 | 1974 | 1999 | 2008 | 2016 |
|---|---|---|---|---|---|
| Arable Land | 6.277 | 2.777 | 2.505 | 2.342 | 2.199 |
| Crop Mosaic | 0.161 | 0.178 | 0.070 | 0.111 | 0.112 |
| Vineyards | 0.221 | 0.126 | 0.068 | 0.069 | 0.070 |
| Olive Groves | 0.039 | 0.056 | 0.056 | 0.062 | 0.063 |
| Woodlands | 1.018 | 0.551 | 0.634 | 0.631 | 0.631 |
| Pastures | 0.549 | 0.770 | 0.433 | 0.425 | 0.422 |
| Water Bodies | 0.062 | 0.036 | 0.035 | 0.036 | 0.035 |
| Impervious Land | 0.594 | 0.800 | 1.388 | 1.460 | 1.530 |
| Urban Parks | 0.144 | 0.090 | 0.172 | 0.174 | 0.174 |
Table 2.
Percent change over time (annual rate) in the per-capita surface area by land-use class in Rome, 1949–2016.
Table 2.
Percent change over time (annual rate) in the per-capita surface area by land-use class in Rome, 1949–2016.
| Class | 1949–1974 | 1974–1999 | 1999–2008 | 2008–2016 |
|---|---|---|---|---|
| Arable Land | −2.23 | −0.39 | −0.72 | −0.77 |
| Crop Mosaic | 0.41 | −2.42 | 6.42 | 0.05 |
| Vineyards | −1.72 | −1.86 | 0.24 | 0.09 |
| Olive Groves | 1.79 | −0.06 | 1.22 | 0.21 |
| Woodlands | −1.84 | 0.61 | −0.05 | −0.01 |
| Pastures | 1.61 | −1.75 | −0.21 | −0.10 |
| Water Bodies | −1.70 | −0.05 | 0.09 | −0.23 |
| Impervious Land | 1.39 | 2.94 | 0.57 | 0.60 |
| Urban Parks | −1.51 | 3.67 | 0.11 | 0.03 |
Publisher’s Note: MDPI stays neutral with regard to jurisdictional claims in published maps and institutional affiliations. |
© 2021 by the authors. Licensee MDPI, Basel, Switzerland. This article is an open access article distributed under the terms and conditions of the Creative Commons Attribution (CC BY) license (https://creativecommons.org/licenses/by/4.0/).
Share and Cite
MDPI and ACS Style
Bianchini, L.; Egidi, G.; Alhuseen, A.; Sateriano, A.; Cividino, S.; Clemente, M.; Imbrenda, V. Toward a Dualistic Growth? Population Increase and Land-Use Change in Rome, Italy. Land 2021, 10, 749. https://doi.org/10.3390/land10070749
AMA Style
Bianchini L, Egidi G, Alhuseen A, Sateriano A, Cividino S, Clemente M, Imbrenda V. Toward a Dualistic Growth? Population Increase and Land-Use Change in Rome, Italy. Land. 2021; 10(7):749. https://doi.org/10.3390/land10070749
Chicago/Turabian StyleBianchini, Leonardo, Gianluca Egidi, Ahmed Alhuseen, Adele Sateriano, Sirio Cividino, Matteo Clemente, and Vito Imbrenda. 2021. "Toward a Dualistic Growth? Population Increase and Land-Use Change in Rome, Italy" Land 10, no. 7: 749. https://doi.org/10.3390/land10070749
Note that from the first issue of 2016, this journal uses article numbers instead of page numbers. See further details here.