Article

Phenological Response of Flood Plain Forest Ecosystem Species to Climate Change during 1961–2021

1
Global Change Research Institute AS CR v.v.i., Bělidla 986/4b, 60300 Brno, Czech Republic
2
Institute of Agrosystems and Bioclimatology, Mendel University in Brno, Zemědělská 1, 61300 Brno, Czech Republic
3
Department of Biometeorological Applications, Czech Hydrometeorological Institute, Na Šabatce 17, 14300 Prague, Czech Republic
*
Author to whom correspondence should be addressed.
Atmosphere 2022, 13(6), 978; https://doi.org/10.3390/atmos13060978
Submission received: 6 May 2022 / Revised: 10 June 2022 / Accepted: 13 June 2022 / Published: 17 June 2022
(This article belongs to the Section Biometeorology)

Abstract

:
The present study analyses 61 years of phenological observations (1961–2021) of five herb, five shrub, four tree, and one bird species representing the prevalent spring species of floodplain forest ecosystems in the Czech Republic, central Europe. The in situ observations were conducted at the Vranovice site (48°48′ N, 16°46′ E, 170 m above mean sea level) representing the Plaček’ forest National Reserve. The observed plants and bird species showed statistically significant (p < 0.05) shifts in phenological terms to an earlier date of the year, but the rate of the shift among the observed species differed. The most progressive shifts were detected for the herbs (14 days), followed by the shrubs (13 days), trees (9 days), and finally by the bird species (8 days). All the phenophases were significantly correlated with the daily maximum temperature (r = 0.72–0.91). The results also showed a decline in the correlation for species among the phenophases of the herbs and trees. The phenophases that were highly correlated in the past were less correlated and had higher variability in the last decades. We conclude that the phenological response of the ecosystem to warming in the spring resulted in higher variability and a lower correlation among the observed phenophases mainly caused by the most expressive phenological shifts of the early herbs.

1. Introduction

Phenology, the study of the seasonal timing of recurring biological events, is commonly known as an indicator of climate change, e.g., [1,2,3]. Various authors have already published that forest ecosystems in Europe are likely to be strongly influenced by climate change and that many species are already exhibiting phenological shifts, e.g., [4]. Several studies on phenological interactions have brought complex insights into phenological shifts and responses to climate change for plants [5] or animals [6]. For example, in the UK, the phenological climate sensitivity of broad taxonomic groups varies greatly, and primary producers showed the highest tendency towards “earliness” with seasonal warming [7]; the synchronicity between the phenology of predators and their prey is becoming weaker [8], and a phenological mismatch in the late breeding of Great Tits to the caterpillar food peak date was evaluated in the Netherlands [9].
Although there are many phenological studies, few of them can rely on long-term and robust in situ data for the robust group of species (from herbs to shrubs, trees, and animal representatives) and to analyse how each part of the ecosystem responds to climate change and the coherence of these responses. Phenological ecosystem studies mainly use vegetation indices and the start and end of the season or the length of the growing season for a specific ecosystem, e.g., [10], or there are studies regarding the phenology of communities for a shorter period such as 2008–2010, e.g., [11]. One of the major concerns about the biological impacts of recent anthropogenically driven climate change is that they can alter interactions between species in ways that could cascade through communities or even whole ecosystems, e.g., [8,12,13,14]. The ecosystem of floodplain forests is characterised by a rich species diversity of plants and animals and is influenced by the level of groundwater, elevation and time of flooding, and granular soil structure [15], and this type of ecosystem was used within this study as an experimental site.
There is a growing concern that climate change has significant impacts on species’ phenology and seasonal population dynamics, and thus causes interaction (a)synchrony between species [16,17,18]. If individual species change their phenologies, there is the potential for phenological mismatches: species that have historically undergone life history events on the same seasonal calendar may lose synchrony and therefore lose the ability to interact as they have in the past [8,16,17,19]. Given the match/mismatch hypothesis, the different extents or directions of the phenological shifts among interacting species may have significant implications for community structures and dynamics [20].
Here, we use long-term phenological data (61 years) of the flood plain forest ecosystem (shrubs, herbs, trees, and bird species) from central Europe, with aims to: (1) evaluate the correlation among the phenological phases of a given species (of the flood plain forest ecosystem) with meteorological parameters to determine both the change in correlation in time (using a running correlation) among the phenological phases and the phenological phases with the strongest meteorological predictor (that means the meteorological variable which is correlated with phenological dates the most and influences the onset of phenophases); and (2) analyse the overlaps among the chosen phenological phases and their lengthening or shortening trends to indicate the overlap index for the selected species in 1961–2021. For these goals (1) and (2), we hypothesise that each given group of species (herbs, shrubs, trees, and bird species) of the ecosystem has advanced to an earlier date in the year because the meteorological records showed a temperature trend to a warmer spring. Nevertheless, the warmer conditions in spring (mainly in February and March) can cause not only advancing phenological phases of early species but also their larger phenological separation from the latter species. We supposed the latter species, who are facing lower warmer trends, could advance the terms of the phenological dates to the earlier time, less than the early species. Subsequently, this situation can cause intense shifting and phenological differences among all the observed species and different lengths of phenological overlapping (among all the species).

2. Materials and Methods

The flood plain forest ecosystem study was conducted at the experimental site of Vranovice, the Plaček’ forest National Reserve (48°48′ N, 16°46′ E, altitude 170 m above sea level) in the southern part of the Czech Republic, central Europe. Phenological in situ observations were performed from 1961 to 2021. The experimental site was a forest ecosystem with remnants of the floodplain forest, which was characterised by a fully grown, multi aged canopy with high biological diversity (Figure 1). The species diversity of the flood plain forests is influenced by the level of groundwater, elevation and time of flooding, and soil granular structure [16]. Long-term phenological research was possible only in locations away from the flooding zone, i.e., with hornbeam–elm–ash growth. This growth ranged from a slightly elevated plateau (plain) to the edges of the flood plain forest. Flooding of this area rarely occurs and only for a short time during periods of higher water levels. This area was also chosen for phenological observations because of the considerable species diversity and rich herb components. The study site Plaček’ forest was established in the fifties as an additional experimental site for the UNESCO projects Man and the Biosphere and the International Biological Program [15]. Since 1961, phenological observations have been performed systematically for selected species, and since 2008, the observations have been performed by Mendel University in Brno and since 2016 by the Global Change Research Institute, CAS (Czech Academy of Sciences).

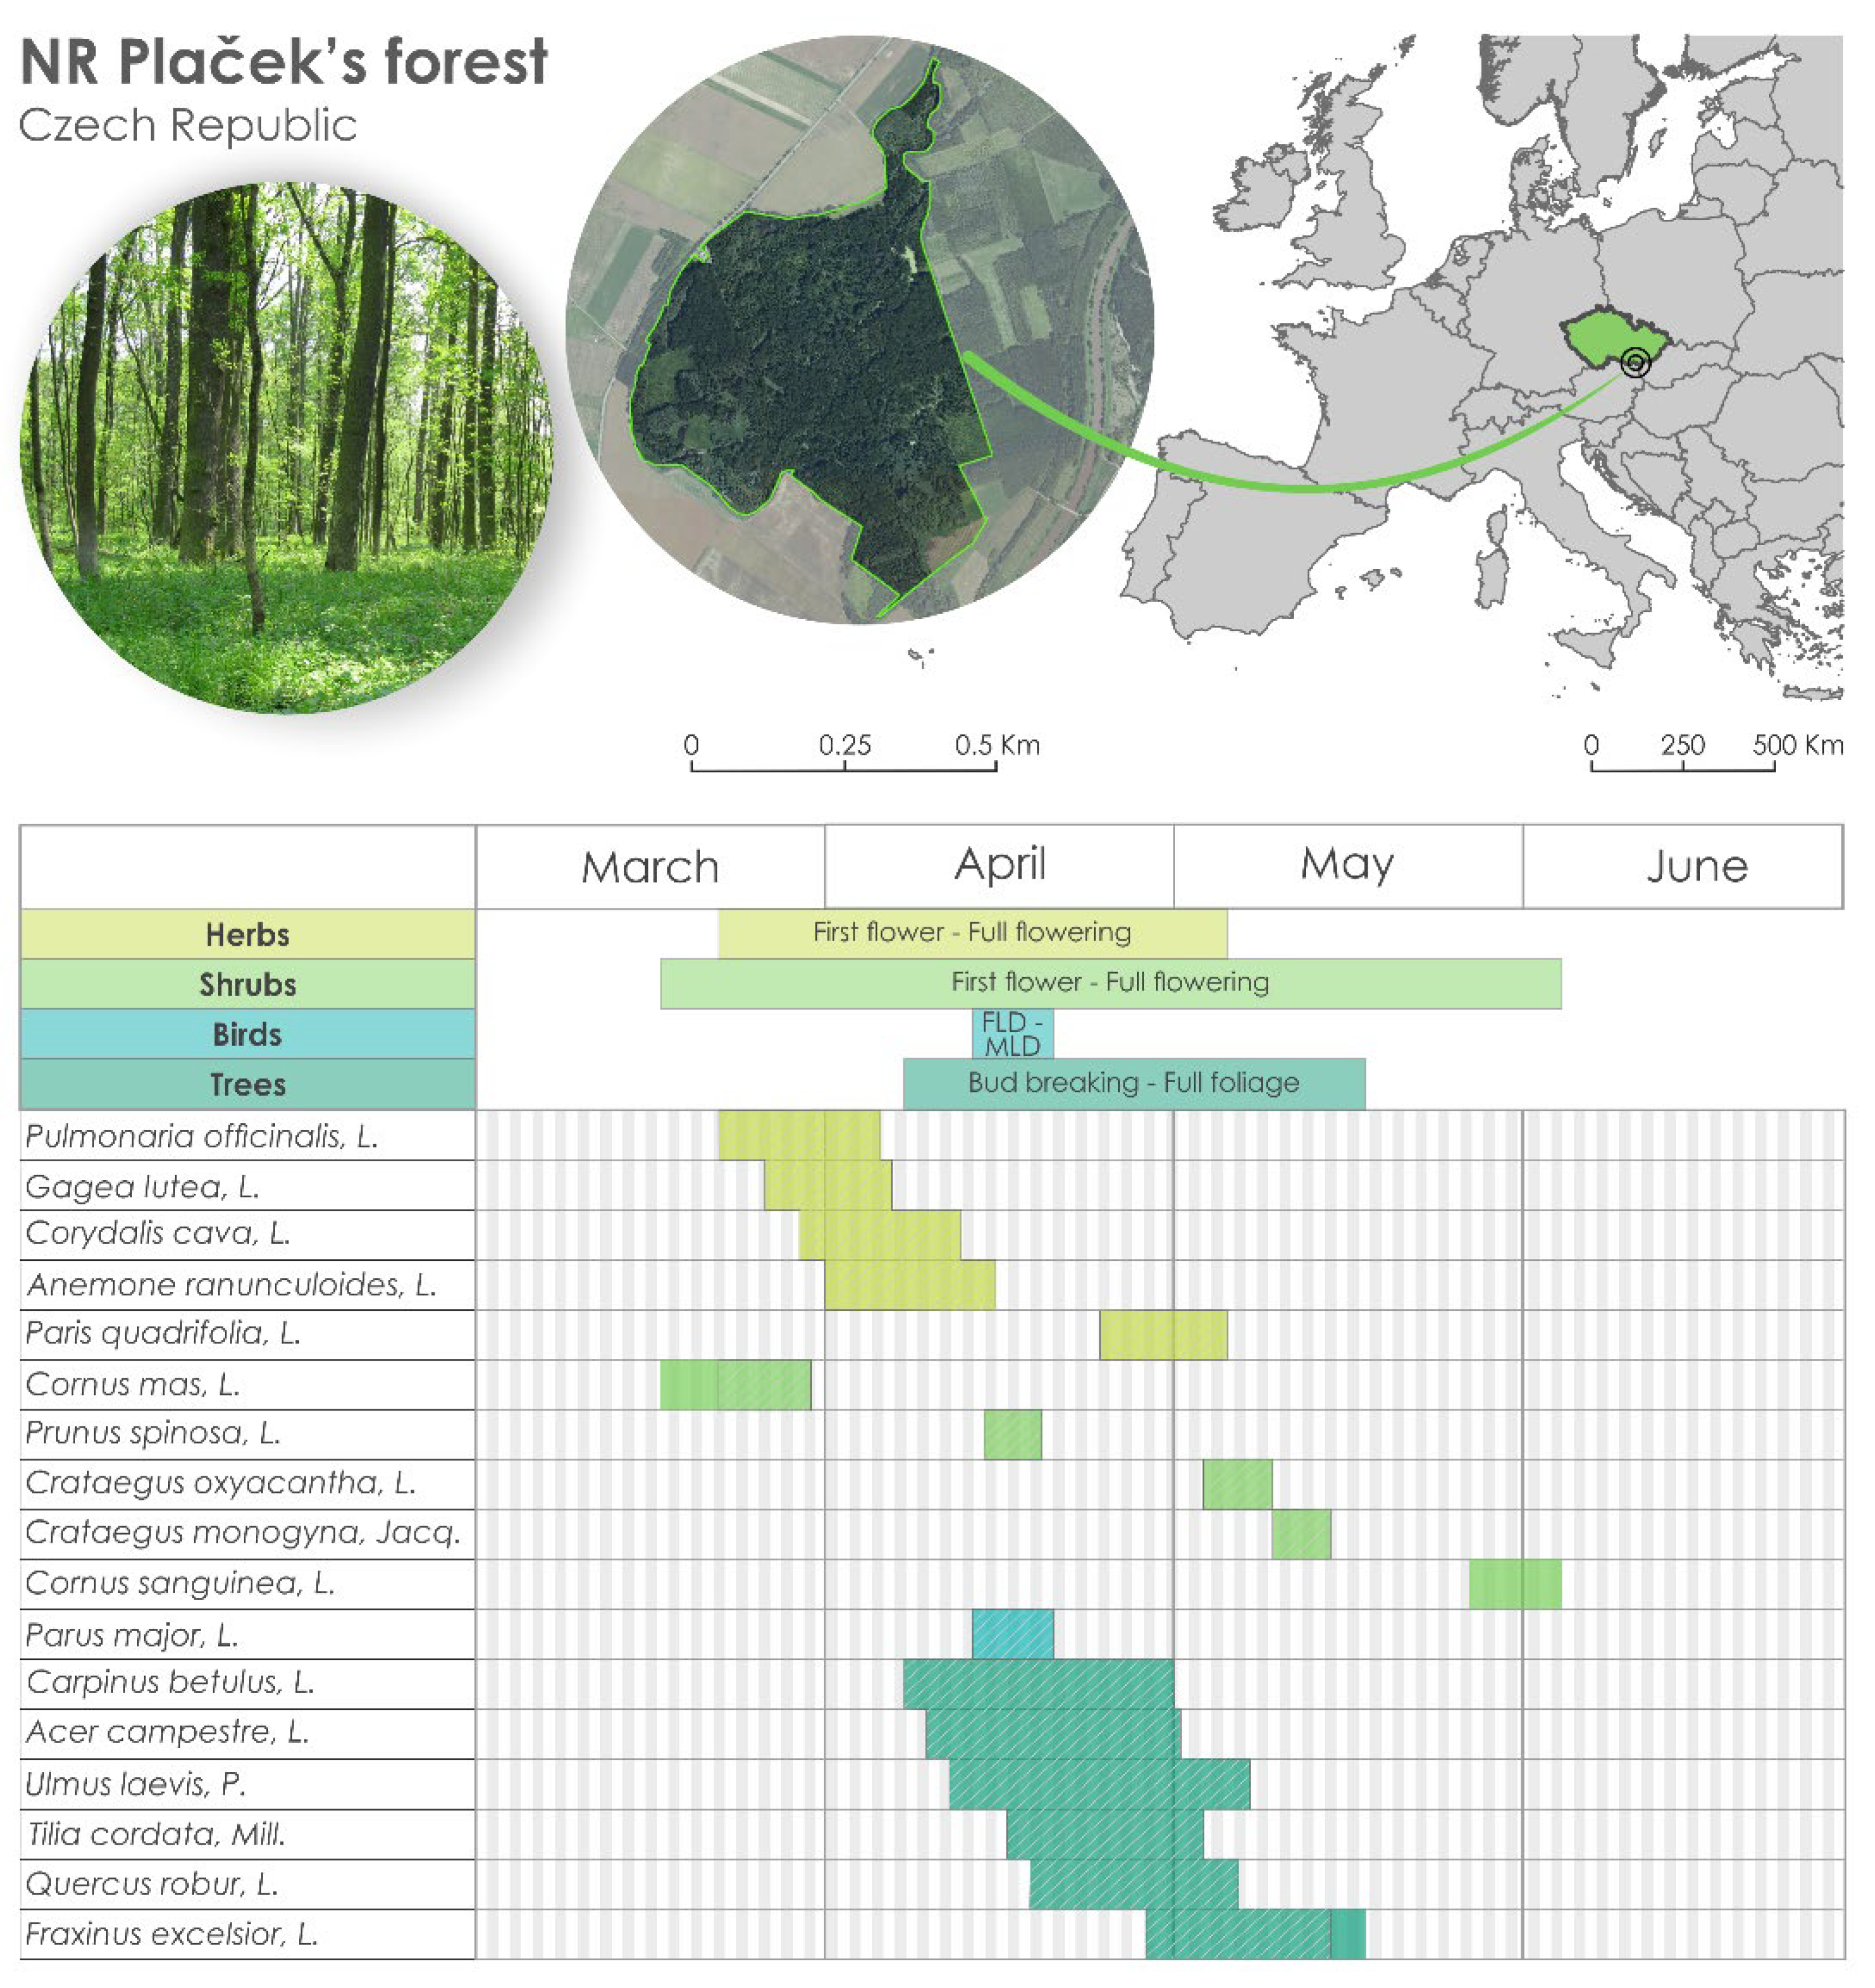
2.1. Phenological Data

Within this study, 17 species were observed (16 plants and 1 bird species, Figure 1), and for each species, 2 phenological phases were observed (all during the spring period). The phenological phases were defined as (the number of species shown in brackets): first flower + full flowering (5 herbs and 5 shrubs), bud breaking + full foliage (6 trees), and first laying date (FLD—the date when the first clutch in a given year was initiated at a given site) and mean laying date (MLD—the mean initiation date of all first clutches in the population at each site in a given year) (1 bird species) (Figure 1). The observations were performed by 3 observers during the whole period of observation. The observations were performed by senior lecturer Zdeněk Bauer for the longest time (from 1961 to 2009), who established the experimental site. Since 2009, the observations were done performed by a Ph.D. student from Mendel University in Brno and a junior scientist from the Global Change Research Institute CAS until now (both are co-authors of this study). The methodology of the observations was a crucial point and was exchanged as well as possible between all the observers. The methodology also bears on the Czech Hydrometeorological Institute’s methods and Guidelines for phenological observations [21].
For each species, we knew the phenological phases (e.g., for herbs and shrubs, first flower and full flowering; for trees, bud breaking and full foliage; and for bird species, FLD and MLD) and both phases together created a so-called phenological stage. The phenological stages of the species overlapped with each other and in total created 62 overlaps (Figure 1). The trends of the 62 overlaps were analysed for pairs of the phenophases of the selected species, so the length of the overlap was created, e.g., by the phenological phase of a herb with the phenological phase of a shrub (and for pairs of the overlaps of herb–tree, herb–bird, shrub–bird, tree–bird, and tree–shrub). Then, the ‘overlap index’ was calculated as the difference between the number of overlap days and the number of species. A high overlap index (and with a high number of overlapping days) indicates phenological stages that are long. On the other hand, a low overlap index (years with a small number of overlapping days) indicates short phenological stages. For the analysis, all possible overlaps of all the available species were included to see the dynamics and linkage among all the observed phenophases, not only those which were connected, e.g., by a trophic chain.

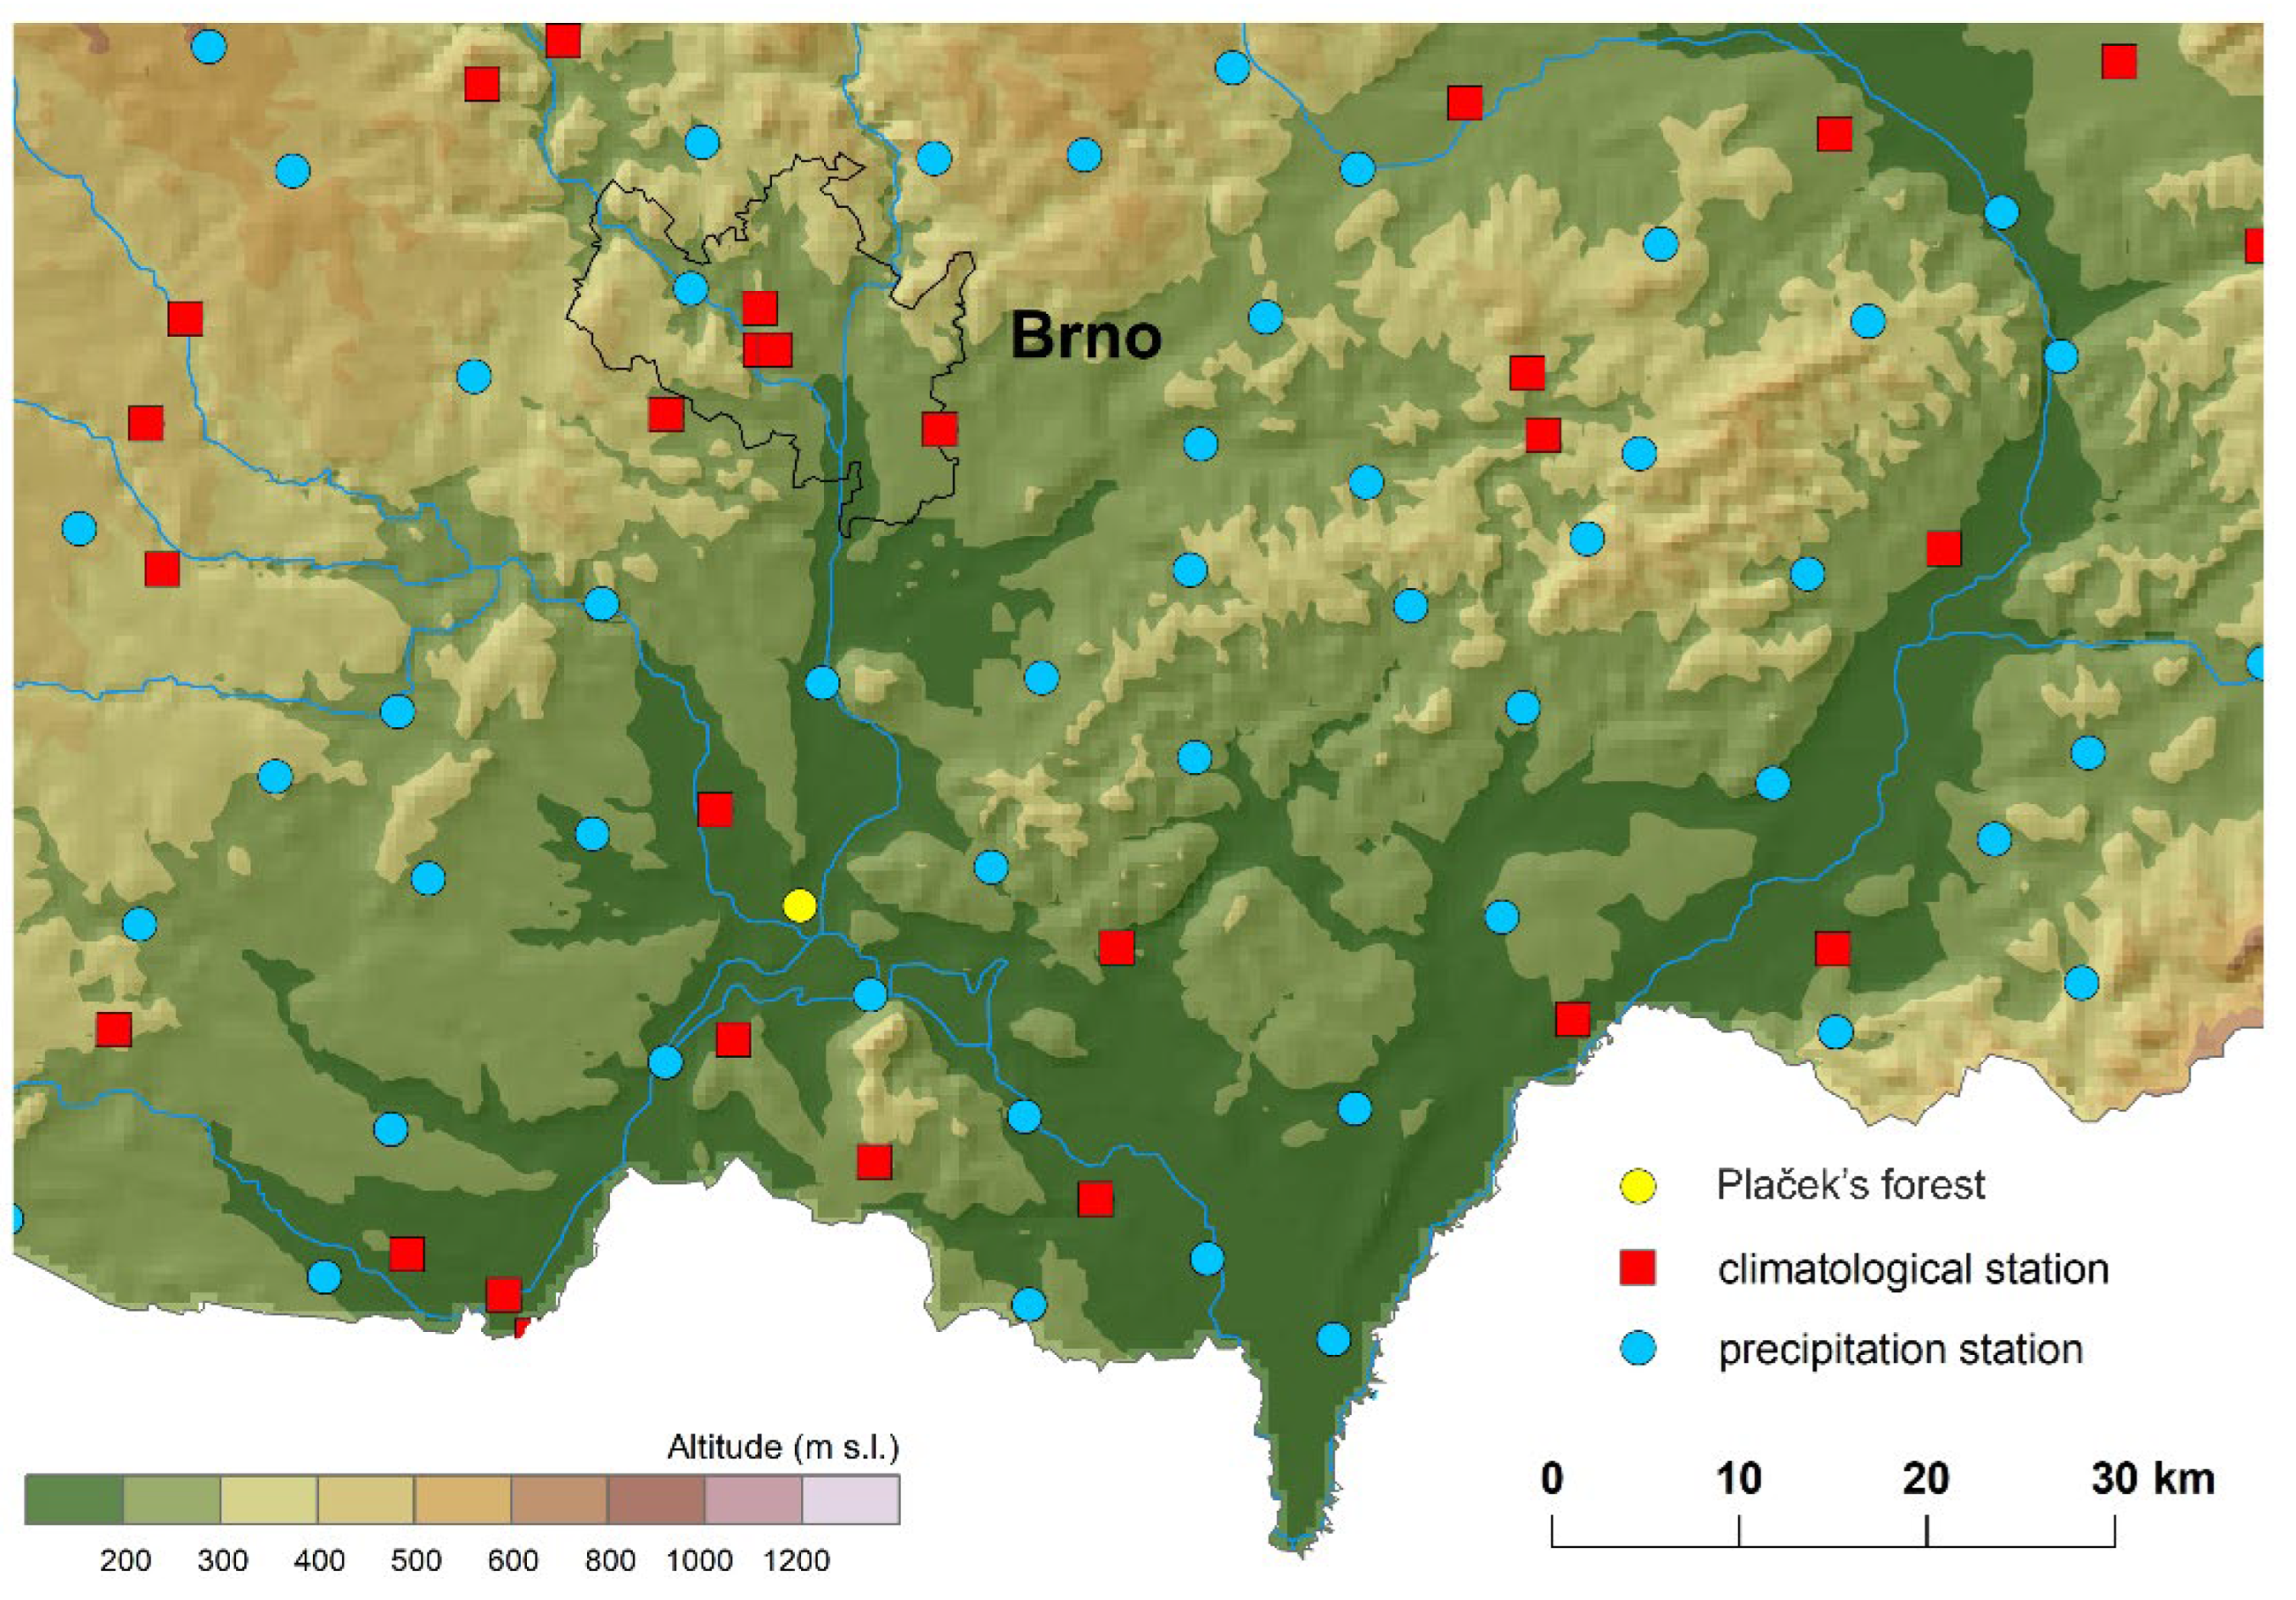
2.2. Meteorological Data
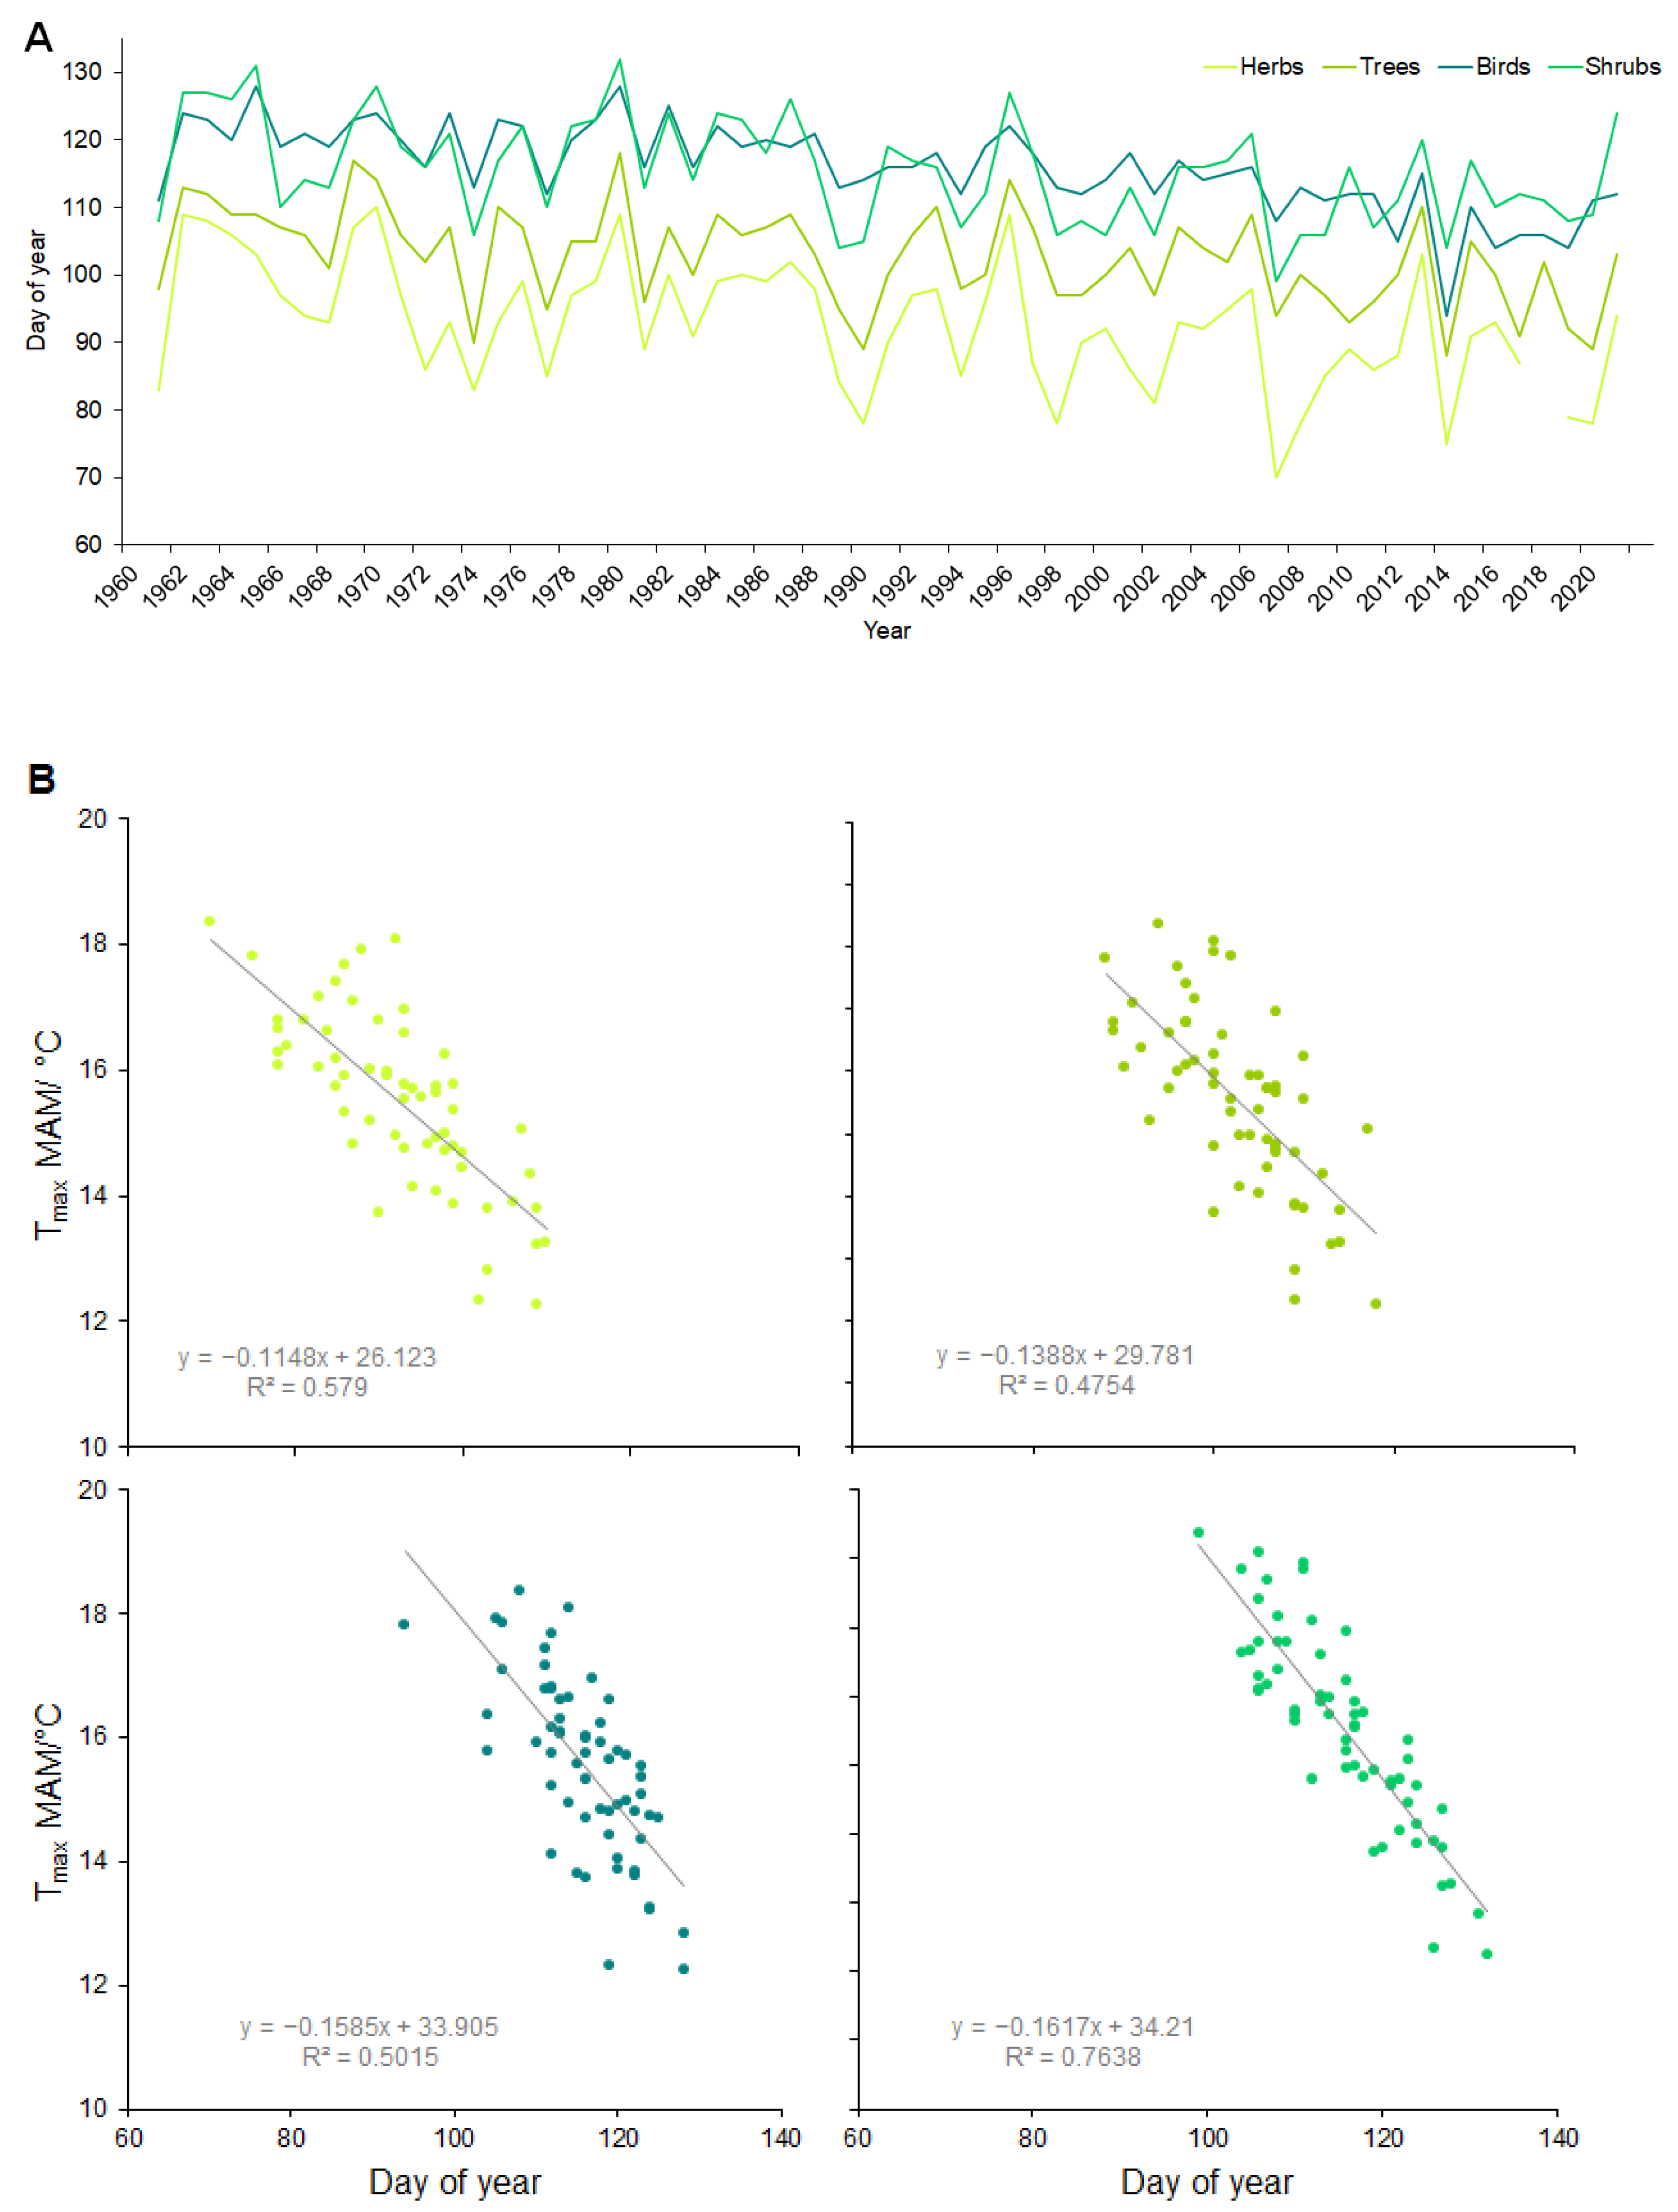
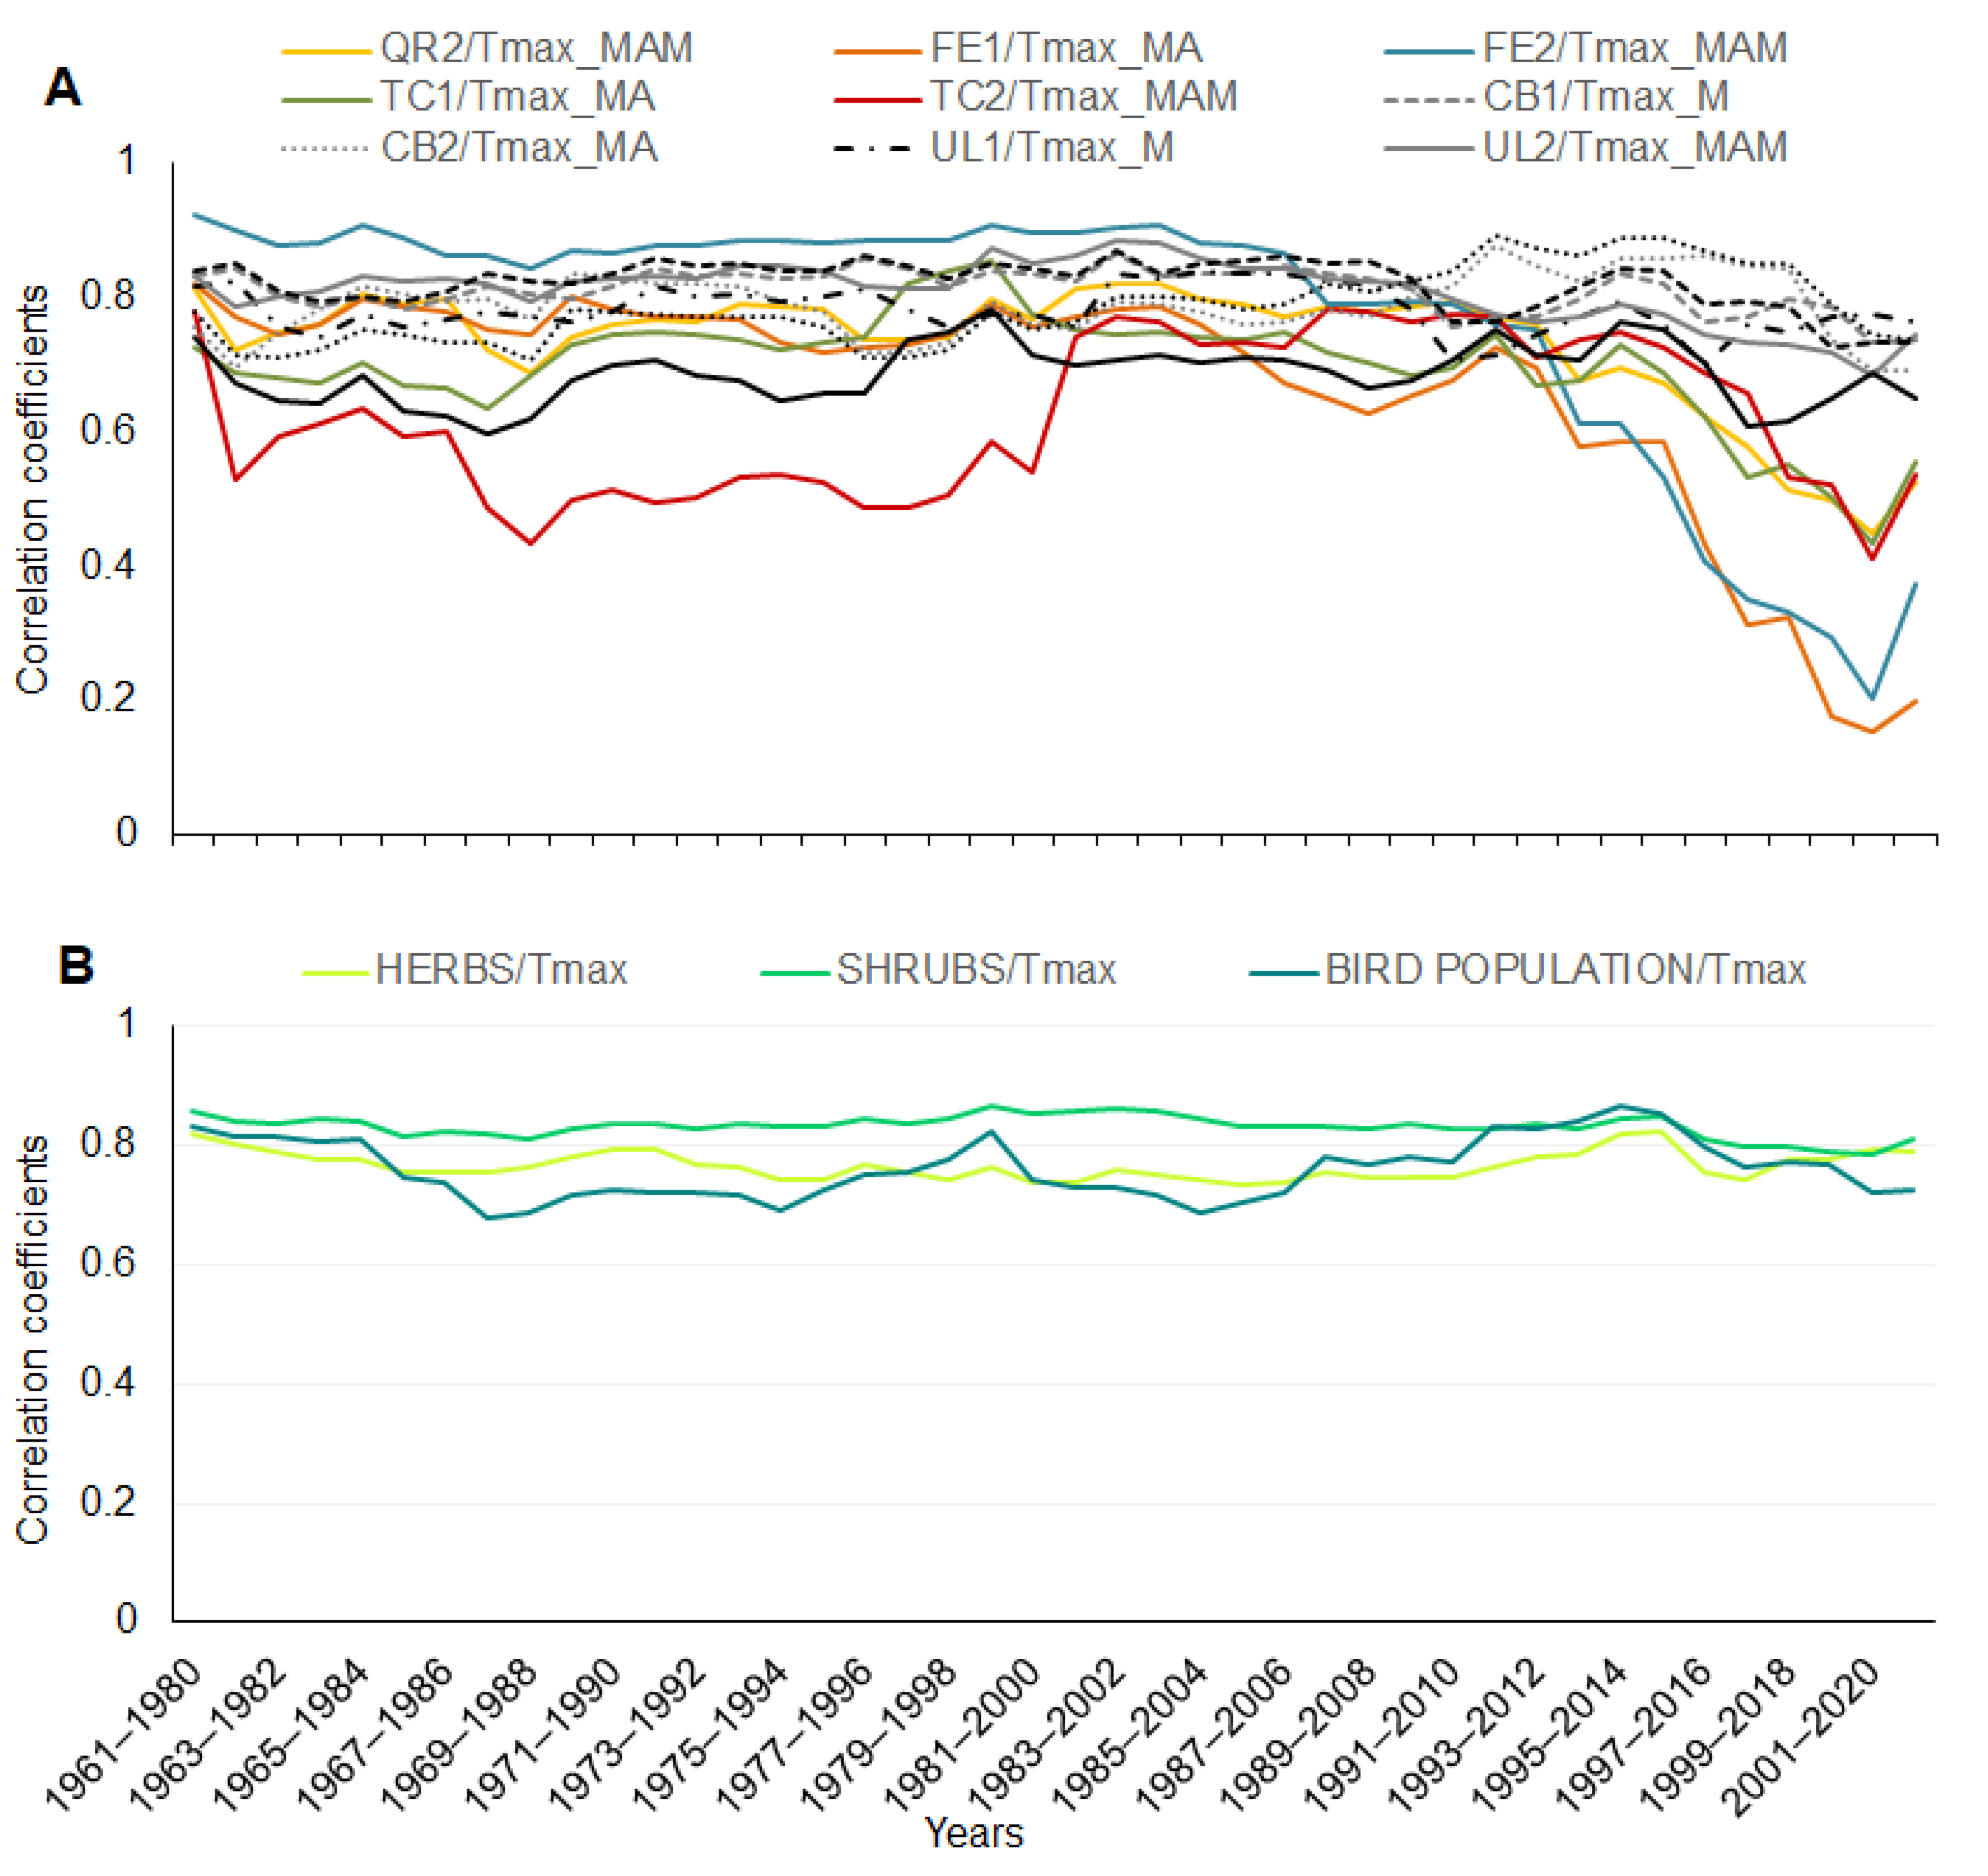
Meteorological data for the station Plaček’ forest were retrieved from maps interpolated based on 268 climatological stations and 787 precipitation stations in the Czech Republic for the period 1961–2021. From this map were extracted the necessary values for the average, maximum, and minimum air temperature and precipitation. Input climatological data were quality controlled, homogenised, and did not contain missing values [22,23,24,25], (Figure 2). The daily data were interpolated by the regression kriging method using geographical coordinates, elevation, and other terrain characteristics as predictors into gridded data with a spatial resolution of 500 m. The relationship between the predictors and a predictand was estimated for each meteorological variable and each day individually, and only predictors that were significant for the regression were used for the final estimates. For each of the cases, the best type of semi-variogram was assessed. The calculations were performed in R by applying the packages rgdal and raster. The weather variables were separated into various periods for each month; from February to May for the particular year of the given phenophase occurrence, the months were denoted by F for February, M for March, A for April, and M for May for the average values of the pairs (FM—February, March; MA—March, April; and AM—April, May) and subsequently for the longer periods (FMA—February, March, April; MAM—March, April, May). These meteorological series for the mean, maximum, and minimum temperature and precipitation were then used for statistical analysis.
Correlation coefficients (r, we used the parametric Pearson coefficient) were used as the primary indicators of the strength of the relationship between the given variables. The trend is representing the slope of the linear regression between the date of the phenological date and the year. Any significance in the observed trends (for both the climatological and phenological parameters) was assessed using a t test. Additionally, we used 20-year subsamples (e.g., 1961–1980, 1962–1981, etc.) for the calculation of the running correlation to see the variability of the correlation among the phenological dates and climate parameters (the mean, maximum, and minimum temperature and precipitation). All the tests were performed with the statistical/programming tool R 3.6.1. [26] and with AnClim software for removing potential outliers in the phenological series [27].

3. Results

The mean annual air temperature showed a significant increase of 1.45 °C for the period of 61 observational years in the experimental site Plaček’ forest. Statistically significant warming trends were observed mainly for the maximum air temperature in February, followed by March and April, and for the average values of the daily maximum temperature in the given months (Table 1). Generally, the maximum air temperature showed the most notable changes, followed by the mean air temperature (with significant warming trends in the spring period) and minimum air temperature with the lowest changes. The total precipitation showed a decrease in the data in February, April, and May but with no trend. The same lack of trend was detected for precipitation in March but with increasing values (Table 1).
The spring phenological phases of all the investigated species advanced to an earlier time and each part of the ecosystem had different responses to climate change. The largest shifts were in the herbs (which had advanced their terms of the phenological phases by 14 days on average since 1961), followed by the shrubs (13 days on average) and trees (9 days on average), and the lowest rate of shifting was exhibited by the bird species (8 days on average) (Figure 3A). A correlation analysis among the phenological phases and climate parameters showed the strongest relationship with the maximum temperature (r = 0.7–0.9, p = 0.000) (followed by the mean and minimum temperature and with a weak relationship with the precipitation) for various months (Table 2). Early herbs and shrubs with average phenological dates in March showed the strongest relationship with the maximum temperature in the months of February and March (r = 0.8–0.9, p = 0.000). The majority of the phenophases of the observed species proceeded during April, and the strongest relationship was again identified for the maximum air temperature in the preceding and current months (r = 0.7–0.8, p = 0.000). The latest phenophases were observed in May and all of them were correlated with the maximum air temperature (r = 0.7–0.9, p = 0.000) in the preceding months (the average of the months March, April, and May) (Figure 3B).
A running correlation (a 20-year moving window) among the tree phenophases and the maximum temperature (in specific months) showed variability in time, specifically for the phenophases of Tilia cordata, Quercus robur, and Fraxinus excelsior. The correlation decreased from 1993–2012 (Figure 4A). Correlations for the 20-year periods for the herb, shrub, and bird species with the maximum temperature (in specific months) were stable, significant, and with no changes during the whole time of observations (Figure 4B); the average values of the correlation coefficients for all the phenophases of the herb, shrub, and bird species represent a significant correlation for each phenophase.
The tree phenophases also showed a higher variability for the running correlation among each phenophase of the observed tree species. Only three species (Carpinus betulus, Acer campestre, and Ulmus laevis) and their phenophase bud breaking showed high and stable correlations during all 61 years. The other six tree species showed a high and stable running correlation only until the period 1980–1999; since that period, the correlation became weaker, especially for species with the phenophases of ash (Fraxinus excelsior). The remaining five species showed variable correlations during the whole observational period; the correlation increased until 1982–2001, after which it decreased (Figure 5C).
The running correlation among all the shrub phenophases was stable and did not change specifically; only the phenophases of the early shrubs (Cornus mas—CM1 and Prunus spinosa—PS1) with the late phenophase of Cornus sanguinea (CS1) showed a low correlation but for the whole time of observations (Figure 5B). The running correlation for the herb phenophases showed a stable and fixed connection among the early herbs (Pulmonaria officinalis, Gagea lutea, Corydalis cava, and Anemone ranunculoides) for the whole period; the same phenophases of the early herbs were similarly and highly correlated with the late phenophases of Paris quadrifolia until 1974–1993 and since the correlation decreased (Figure 5A). The running correlation for pairs of all the species (the average terms of the herb, shrub, tree, and bird phenophases) of the observed ecosystem showed a stable correlation from 1960 to 1981–2000. Since 1982–2001, the correlation became weaker and had higher variability. During the last 10 periods (from 1991–2010 until now), the decline in the correlation coefficients was intensive, and the correlation declined mainly between the herbs and bird species and the shrubs with trees (Figure 5D).
The analysis of the overlapping phenophases of the chosen species showed that the length of the overlap was significantly longer in ten cases and significantly shorter in seven cases from the total number of 62 studied overlaps. The statistically significant lengthening of the phenophase overlaps was detected for the early blossoming herbs with other early herbs and one shrub and was moving in the range of 5–12 days (Figure A1). Next, significant lengthening was calculated for the trees (between each other) and for the trees with shrubs. On the other hand, the situation when the length of the overlaps was getting significantly shorter arose for the overlaying of the phenophases of the herbs (between each other) and for the herbs with trees (Figure A1). The remaining overlaps (41) of all the phenological stages among various species was getting shorter or longer (from −5 to +5 days) but with no significance; the last five overlaps did not show change.
The overlap index showed higher variability in the first half of the observed period (Figure 6). The lowest overlap index was calculated for the years 1969 and 1986 when the number of overlap days was low, which means that the phenological stages and overlapping time were short. Conversely, a high index was calculated for 1981, 1990, and 1991 (and 2016) when the phenological stages were long. Nevertheless, the overlap index did not show any significant trend for all the observed species. However, interactions mainly among the herbs and trees, for which stages the overlap significantly changed, are clear. Years with a high overlap index (and with a high number of overlapping days) were years with average or subnormal temperature conditions and phenological stages that were long. On the other hand, a low overlap index (years with a small number of overlapping days) indicates years with temperatures above normal and short phenological stages.

4. Discussion

The main goal of this study was to verify whether long-term (61 years of in situ observations) phenological data covering 17 species from floodplain forest ecosystems show phenological (a)synchrony among all observed species and if there are any changes in correlation in time between phenological onset and climate (mainly temperature) parameters and if there are any changes in overlap among phenological stages.
The timing of the phenological phases (e.g., terms of the given phenophases) moved to an earlier time, and each part of the studied group of species (herbs, shrubs, trees, and bird species) moved with different intensities. The largest shifts were observed for the herbs and shrubs (13–14 days on average for all the observed species) and the lowest rate of shifting was detected for the tree and bird species (8–9 days on average). Similar outputs were also published [2] about expressive shifts of herbs in the United Kingdom. The authors mentioned that the herbs showed the most significant lifeform-specific phenological shift (by 32 days during 1753–2019) compared to the shrubs and trees. Nevertheless, we conclude that these differences among the given group of species of the observed ecosystem should not be generalised because some species responded specifically. The most expressive shift was observed for the herb Yellow Star-of-Bethlehem (Gagea lutea) by almost 21 days (for the phenophase first flower in population), which was higher than the rest of the herbs; e.g., Herb Paris (Paris quadrifolia), who advanced its phenophases by 10–11 days, or the full flowering of the Common Lungwort (Pulmonaria officinalis), which shifted by only 8 days during the whole period (61 years). Similarly, the lowest rate of shifting was observed for the field maple tree (Acer campestre) and small-leaved lime (Tilia cordata) with a change of 5.9–6.2 days for bud breaking, which was again lower than the other shifts of all the observed trees. In general, the shifting of the phenological phases to earlier times was published and observed by many authors earlier [28,29] and also in recent publications [2,3]. The reason for the most intensive phenological shift of the herbs in our study could be described by temperature trends. Linear trends in 1961–2021 showed the most significant changes in the mean and maximum air temperatures in February and March (see Table 2). The average date of the first three phenophases of the herbs (the first flower of Pulmonaria officinalis, Gagea lutea, and Corydalis cava) was at the end of March (see Table 1), which means that these species had to face the warming with the highest trend (for the maximum and mean temperature). Regardless, the phenophases of the shrub Cornus mas were occurring midway and at the end of March and the shifting was not as intensive as for the herbs (only by 11.5 and 9 days for the first and full flowers). This means that each species may have different sensitivities to climate conditions and need different heat sums (the sum of the daily mean temperatures above a set basic temperature, [30]). Overall, there is a concern if plants continue to flower earlier, and if the frequency, intensity, and duration of climatic extremes increase further, the functioning and productivity of biological, ecological, and agricultural systems will be at an unprecedented risk [2]. The different timing (mostly earlier timing) of the phenological phases of plants can affect not only the plant itself and its species-specific chilling requirements, the likelihood of frost injury, and the demands on energy and water balance [4]. Additionally, other species could be influenced, e.g., the timing of plant flowering can affect their pollination, especially when insect pollinators are themselves seasonal and determine the timing of seed ripening and dispersal [2]. Plant flowering also influences animals for which pollen, nectar, fruits, and seeds are important resources, and earlier flowering implies earlier activity in leaf expansion, root growth, and nutrient uptake [4,31]. According to our results and the conditions of flood plain forest ecosystems, there should also be a positive impact on trees because an earlier and more vigorous start of the growing season (during the warm spring of 2018) caused a significant increase in the growth (gross primary production) of the investigated species (oaks, ashes, and hornbeams—Quercus, Fraxinus, and Carpinus) in the flood plain forest in the vicinity of our experimental site [32].
A running correlation showed three key outputs. First, herb, shrub, and bird species were correlated with the maximum temperature during the whole time of observations. The correlation was stable and high with no specific decline or increase. Next, some of the tree phenophases showed a decreasing correlation with temperature since a specific time. According to the first output, we conclude that it is the temperature (in our case the maximum temperature) that influences the timing of phenophases the most, which is in agreement with results by other authors; e.g., [3] states that the phenological advancing trends still could be attributed to warming and that temperature is still considered to be the fundamental prerequisite of climate change detection and attribution for phenological changes [7,33]. However, there is also evidence that spring phenological development is partially influenced by the fulfilment of winter chilling and by the photoperiod [34]. The temperature sensitivity (for four dominant tree species in Europe) of the leafing phenology decreased during 1981–2013 and it was because the accumulation of the chilling units was reduced [35]. Additionally, other researchers [36,37] have stated that there are different changes in temperature sensitivity and that species-specific increases in temperature requirements are mainly caused by a decrease in chilling [36]. In our case, the running correlation for three trees and the temperature (same results for the maximum, mean, and minimum temperature) also showed decreasing temperature sensitivity in the last decades. It was not the aim of our paper to also incorporate chilling units within the analyses but it needs to be performed in future studies to see the possible reason for the decreasing temperature sensitivity of trees. Others state that plants must respond not only to temperature and warming but also to soil water availability [38]. Nevertheless, we did not assess soil water availability in this study; in the case of floodplain forests, the groundwater level is high year-round and precipitation is not as important for the development of plants. The Plaček’ forest hydrological ratio is specific and exceptional. The water regime is mainly driven by the river Svratka and also by the brook Šatava (which runs in the National Reserve). Until the seventies (when regulation of the river Svratka was done), the period of flooding was common and huge [39]. During this time, there were some remnants of water diversions and thanks to gravel sand subsoil, the level of groundwater is still connected with the river Svratka; nevertheless, the flooding is not as huge as it was before stream regulations in the seventies [40]. However, the rate of flooding and the water regime in the forest is also driven by precipitation, which is not saturated on a loess that is on the hillside northward from Plaček’ forest and brings more water in the hydrological ratio [39]. However, it must be stressed that although observations took place in the floodplain forest, drying oaks have been observed not only at the experimental site but also in other areas of the floodplain forest in the last 10 years. During the last 30-year period (1991–2020), the mean maximum temperatures in March, April, and May (MAM) experienced a statistically significant warming trend according to 1961–2020. Additionally, the MAM temperature from 1501 to 2020 exhibited the highest temperature in the last 30-year period. Two drought indices (SPEI—the standard precipitation evapotranspiration index, PDSI—the Palmer Drought Severity Index) agreed on the driest 30-year interval of 1990–2019 for the spring period (months MAM) since 1500 [41,42].
Finally, the running correlation analysis among the phenophases of all the species showed that the given tree and herb phenophases correlated well until a specific time after that, in which the correlation decreased. The decreasing running correlation was also noted for the average phenological terms of the herbs, shrubs, trees, and birds. This means that there were changes in the phenological timing and that the phenophases that were synchronised during the first decades of observations changed the onset date, which resulted in higher variability in synchrony and lower values of the correlation coefficients during the last decades. At the same time, the phenological overlap analysis confirmed that significant phenological shifts to the earlier time of herbs contributed to the lengthening and shortening of the overlaps among the given phenophases of mainly the herbs and trees. Mismatched species should respond differently to environmental cues relevant to climate change, not only air temperature but also winter chilling or photoperiod as was mentioned earlier. Different responses can lead to different multi annual trajectories (in traits linked to climate such as leaf-out times, caterpillar emergence, or egg laying) in species’ phenophases because the relative importance of each environmental cue might differ among species—e.g., one species relying more on day length and thus responding less to temperature increases than the other—and because, even if species are solely driven by temperature, species might rely on different temperature ranges and/or time intervals to time their phenophases [31]. In our case, the results showed that temperature (specifically the maximum and mean temperature) is the predictor for the timing of phenophases. However, two major backup systems to prevent a premature spring development (chilling and photoperiod) may influence the timing also [3]. Specifically, the photoperiod may play an important role for early herbs and shrubs (although the required heat sum is reached for the onset of the phenophase, the short photoperiod stops its onset). Additionally, as was mentioned earlier, for trees that showed a lower temperature sensitivity in the last years, chilling may be another decelerating mechanism [35].
Nevertheless, there are published articles describing an asynchrony or mismatch among the observed species with negative impacts on these interactions and the food chain among those species [8,43,44]; there are also a few clear cases of mismatch due to the ongoing rapid climate change [45,46,47]. Asynchrony in phenological timing should not always have a negative impact; changes in the onsets could have a neutral [48] or, in some cases, a positive impact [49]. Our results showed fast and largest reactions by the herbs and shrubs, resulting in a lower correlation among the other species in the ecosystem. Additionally, because early herbs or shrubs are not trophically connected with trees or bird species, the changes in the onsets may have a neutral impact. However, if the growing season starts earlier, plants take moisture from the soil for a longer period and can negatively affect the species that come later. Still, the knowledge about phenological interactions or plasticity in wild nature can serve as a test baseline and show us the natural reactions of plants to changing climate conditions. Plasticity plays a key role, which has an important impact on phenotypic change and is a crucial strategy for coping with temporal and spatial heterogeneity [39]. Plasticity and microevolution are the most important for trophically linked populations and variations among individuals can indicate what can be expected in upcoming climate conditions [2]. The most expressive shifts of herbs suggests that directional selection and adaptive evolution can be faster in short-lived plants that exhibit faster turnover rates, while phenotypic plasticity is more important for long-lived trees and shrubs [2]. Our phenological dataset of species is not robust enough to make conclusions about adaptive evolution but still brings information about the phenological reactions of plants and bird species on the specific location of flood plain forest and showed a decreasing temperature sensitivity for trees and also a decreasing synchrony in phenological timing among the observed species.

5. Conclusions

The principal finding of this study was that the correlation among the given observed species of the ecosystem became weaker over time, mainly since 1982–2001. Long-term phenological data of the flood plain forest ecosystem from 1961 to 2021 showed that there were changes in the timing of all the observed species from the flood plain forest ecosystem. Herbs, followed by shrubs, exhibited the most expressive shifts compared to the tree and bird species, and these changes also caused lengthening or shortening in the phenological overlaps among specific phenological phases. The running correlation of all the phenophases showed a decline in correlation from 1991–2010 for the pairs of herbs with birds and shrubs with trees. The data also showed a decline in correlation among specific tree and herb phenophases from the period of the 1970s to the 1990s. The most significant changes in phenological timing were detected for herbs, in which the phenophases started in the second half of March and were the most correlated with the maximum temperature in the preceding months (February and March).

Author Contributions

Conceptualization, L.B. and M.T.; methodology, L.B., M.F. and M.T.; software, J.B. (Jan Balek); validation, P.Š. and P.Z.; formal analysis, L.B. and P.D.; investigation, J.B. (Jana Bauerová); resources, M.T. and Z.Ž.; data curation, L.H. and M.M.; writing—original draft preparation, L.B.; writing—review and editing, L.B.; visualization, M.B.; supervision, M.F., M.T. and Z.Ž.; project administration, M.T. and Z.Ž.; funding acquisition, M.T. and Z.Ž. All authors have read and agreed to the published version of the manuscript.

Funding

This research was funded by Ministry of Education, Youth and Sports of the Czech Republic the project SustES—Adaptation strategies for the sustainability of ecosystem services and food security in adverse natural conditions (CZ.02.1.01/0.0/0.0/16_019/0000797).

Data Availability Statement

Not applicable.

Acknowledgments

L.B., P.D., M.F., J.B. (Jan Balek), M.B., P.Z., P.Š., Z.Ž. and M.T. were supported by the project SustES—Adaptation strategies for sustainable ecosystem services and food security under adverse environmental conditions (CZ.02.1.01/0.0/0.0/16_019/0000797). In loving memory of our colleague Zdeněk Bauer (*1931 2016) who found the experiment and made 80% of all the phenological observations and together with his wife J.B. (Jana Bauerová) prepared a significant part of the data from the period 1961–2010. At the same time, he actively participated in the data analysis until 2016 and significantly contributed to the preparation of the concept of the whole study; its first part was published 12 years ago. The Global Change Research Institution CAS has permission to use the historical data.

Conflicts of Interest

The authors declare no conflict of interest.

Appendix A

Figure A1. Trend in the length of overlap (days) among 62 phenological stages in total. Asterisks indicate a significant lengthening of overlaps; points indicate significant shortening of overlaps. The green colour indicates the lengthening of overlaps, and the red colour indicates the shortening of overlaps. Positive values indicate the number of days by which the overlaps were extended. Negative values indicate the number of days by which the overlaps were shortened.
Atmosphere 13 00978 g0a1

References

  1. Beard, K.H.; Kelsey, K.C.; Leffler, A.J.; Welker, J.M. The Missing Angle: Ecosystem Consequences of Phenological Mismatch. Trends Ecol. Evol. 2019, 34, 885–888. [Google Scholar] [CrossRef] [PubMed]
  2. Büntgen, U.; Piermattei, A.; Krusic, P.J.; Esper, J.; Sparks, T.; Crivellaro, A. Plants in the UK flower a month earlier under recent warming. Proc. R. Soc. B 2022, 289, 20212456. [Google Scholar] [CrossRef] [PubMed]
  3. Menzel, A.; Yuan, Y.; Matiu, M.; Sparks, T.; Scheifinger, H.; Gehrig, R.; Estrella, N. Climate change fingerprints in recent European plant phenology. Glob Chang. Biol. 2020, 26, 2599–2612. [Google Scholar] [CrossRef] [PubMed] [Green Version]
  4. Piao, S.; Liu, Q.; Chen, A.; Janssens, I.A.; Fu, Y.; Dai, J.; Liu, L.; Lian, X.; Shen, M.; Zhu, X. Plant phenology and global climate change: Current progresses and challenges. Glob. Chang. Biol. 2019, 25, 1922–1940. [Google Scholar] [CrossRef]
  5. Wolkovich, E.M.; Cook, B.I.; Allen, J.M.; Crimmins, T.M.; Betancourt, J.L.; Travers, S.E.; Pau, S.; Regetz, J.; Davies, T.J.; Kraft, N.J.B.; et al. Warming experiments underpredict plant phenological responses to climate change. Nature 2012, 485, 494–497. [Google Scholar] [CrossRef]
  6. Cohen, J.M.; Lajeunesse, M.J.; Rohr, J.R. A global synthesis of animal phenological responses to climate change. Nat. Clim. Chang. 2018, 8, 224–228. [Google Scholar] [CrossRef]
  7. Thackeray, S.J.; Henrys, P.A.; Hemming, D.; Bell, J.R.; Botham, M.S.; Burthe, S.; Helaouët, P.; Johns, D.G.; Jones, I.D.; Leech, D.I.; et al. Phenological sensitivity to climate across taxa and trophic levels. Nature 2016, 535, 241–245. [Google Scholar] [CrossRef] [Green Version]
  8. Both, C.; Van Asch, M.; Bijlsma, R.G.; Van Den Burg, A.B.; Visser, M.E. Climate change and unequal phenological changes across four trophic levels: Constraints or adaptations? J. Anim. Ecol. 2009, 78, 73–83. [Google Scholar] [CrossRef] [Green Version]
  9. Reed, T.E.; Jenouvrier, S.; Visser, M.E. Phenological mismatch strongly affects individual fitness but not population demography in a woodland passerine. J. Anim. Ecol. 2012, 82, 131–144. [Google Scholar] [CrossRef]
  10. Wu, C.; Houb, X.; Penga, D.; Gonsamoc, A.; Xua, S. Land surface phenology of China’s temperate ecosystems over 1999–2013: Spatial–temporal patterns, interaction effects, covariation with climate and implications for productivity. Agric. For. Meteorol. 2016, 216, 177–187. [Google Scholar] [CrossRef]
  11. Meng, F.; Cui, S.; Wang, S.; Duan, J.; Jiang, L.; Zhang, Z.; Luo, C.; Wang, Q.; Zhou, Y.; Li, X.; et al. Changes in phenological sequences of alpine communities across a natural elevation gradient. Agric. For. Meteorol. 2016, 224, 11–16. [Google Scholar] [CrossRef] [Green Version]
  12. Visser, M.E.; Both, C.; Lambrechts, M.M. Global climate change leads to mistimed avian reproduction. Adv. Ecol. Res. 2004, 35, 89–110. [Google Scholar]
  13. Cleland, E.E.; Chuine, I.; Menzel, A.; Mooney, H.A.; Schwartz, M.D. Shifting plant phenology in response to global change. Trends Ecol. Evol. 2007, 22, 357–365. [Google Scholar] [CrossRef] [PubMed]
  14. Memmott, J.; Craze, P.G.; Waser, N.M.; Price, M.V. Global warming and the disruption of plant-pollinator interactions. Ecol. Lett. 2007, 10, 710–717. [Google Scholar] [CrossRef] [PubMed]
  15. Bauer, Z.; Bartosova, L.; Bauerova, J.; Trnka, M.; Stepanek, P.; Mozny, M.; Dubrovsky, M.; Nyklova, E.; Zalud, Z. Observed Phenological Response of Ecosystems to the Climate: Part I. Flood-Plain Forest; Global Change Research Centre, Academy of Sciences of the Czech Republic: Staré Město, Czech Republic, 2014; ISBN 978-80-87902-00-4. [Google Scholar]
  16. Durant, J.M.; Hjermann, D.; Ottersen, G.; Stenseth, N.C. Climate and the match or mismatch between predator requirements and resource availability. Clim. Res. 2007, 33, 271–283. [Google Scholar] [CrossRef] [Green Version]
  17. Visser, M.; Both, C. Shifts in phenology due to global climate change: The need for a yardstick. Proc. R. Soc. B 2005, 272, 2561–2569. [Google Scholar] [CrossRef] [PubMed]
  18. Thackeray, S.J.; Sparks, T.H.; Frederiksen, M.; Burthe, S.; Bacon, P.J.; Bell, J.R.; Botham, M.S.; Brereton, T.M.; Bright, P.W.; Carvalho, L.; et al. Trophic level asynchrony in rates of phenological change for marine, freshwater and terrestrial environments. Glob. Chang. Biol. 2010, 16, 3304–3313. [Google Scholar] [CrossRef] [Green Version]
  19. Stenseth, N.C.; Mysterud, A. Climate, changing phenology, and other life history traits: Nonlinearity and match-mismatch to the environment. Proc. Natl. Acad. Sci. USA 2002, 99, 13379–13381. [Google Scholar] [CrossRef] [Green Version]
  20. Walther, R.G. Community and ecosystem responses to recent climate change. Philos. Trans. R. Soc. B Biol. Sci. 2010, 365, 2019–2024. [Google Scholar] [CrossRef]
  21. Valter, J.; Reitschläger, J.D. Operation Guideline for Phenological Stations, Methodic Instruction No. 10, Wood Plants, 2nd ed.; Czech Hydrometeorological Institute: Prague, Czech Republic, 2009. [Google Scholar]
  22. Štěpánek, P.; Zahradníček, P.; Brázdil, R.; Tolasz, R. Metodologie Kontroly a Homogenizace Časových řad v Klimatologii (Methodology of Data Quality Kontrol and Homogenization of Time Series in Climatology); ČHMÚ: Prague, Czech Republic, 2011; p. 118. ISBN 978-80-86690-97-1. [Google Scholar]
  23. Štěpánek, P.; Zahradníček, P.; Huth, R. Interpolation Techniques Used for Data Quality Control and Calculation of Technical Series: An Example of Central European Daily Time Series. Időjárás 2011, 115, 87–98. [Google Scholar]
  24. Štěpánek, P.; Zahradníček, P.; Farda, A. Experiences with data quality control and homogenization of daily records of various meteorological elements in the Czech Republic in the period 1961–2010. Időjárás 2013, 117, 123–141. [Google Scholar]
  25. Squintu, A.A.; Schrier, G.; Štěpánek, P.; Zahradníček, P.; Klein Tank, A. Comparison of homogenization methods for daily temperature series against an observation-based benchmark dataset. Arch. Meteorol. Geophys. Bioclimatol. Ser. B 2020, 140, 285–301. [Google Scholar] [CrossRef] [Green Version]
  26. R: A Language and Environment for Statistical Computing; R Foundation for Statistical Computing: Vienna, Austria. Available online: https://www.R-project.org/ (accessed on 1 April 2022).
  27. Stepanek, P. An Clim—Software for Time Series Analysis. Department of Geography, Faculty of Natural Sciences, MU, Brno, 1.47 MB. 2008. Available online: http://www.climahom.eu/AnClim.html (accessed on 1 April 2022).
  28. Parmesan, C.; Yohe, G. A globally coherent fingerprint of climate change impacts across natural systems. Nature 2003, 421, 37–42. [Google Scholar] [CrossRef] [PubMed]
  29. Root, T.L.; Price, J.T.; Hall, K.R.; Schneider, S.H.; Rosenzweig, C.; Pounds, J.A. Fingerprints of global warming on wild animals and plants. Nature 2003, 421, 57–60. [Google Scholar] [CrossRef]
  30. Ladányi, M.; Persely, S.; Szabó, T.; Soltész, M.; Nyéki, J.; Szabó, Z. The application of A HEAT SUM MODEL for the budburst of sour cherry varieties grown at Újfehértó. Int. J. Hortic. Sci. 2009, 15, 105–112. [Google Scholar] [CrossRef]
  31. Renner, S.S.; Zohner, C.M. Climate Change and Phenological Mismatch in Trophic Interactions among Plants, Insects, and Vertebrates. Annu. Rev. Ecol. Evol. Syst. 2018, 49, 165–182. [Google Scholar] [CrossRef]
  32. Kowalska, N.; Šigut, L.; Stojanović, M.; Fischer, M.; Kyselova, I.; Pavelka, M. Analysis of floodplain forest sensitivity to drought. Phil. Trans. R. Soc. B 2020, 375, 20190518. [Google Scholar] [CrossRef]
  33. Cook, B.I.; Wolkovich, E.M.; Davies, T.J.; Ault, T.R.; Betancourt, J.L.; Allen, J.; Bolmgren, K.; Cleland, E.E.; Crimmins, T.M.; Kraft, N.J.B.; et al. Sensitivity of spring phenology to warming across temporal and spatial climate gradients in two independent databases. Ecosystems 2012, 15, 1283–1294. [Google Scholar] [CrossRef]
  34. Tang, J.; Körner, C.; Muraoka, H.; Piao, S.; Shen, M.; Thackeray, S.J.; Yang, X.I. Emerging opportunities and challenges in phenology: A review. Ecosphere 2016, 7, e01436. [Google Scholar] [CrossRef] [Green Version]
  35. Chen, L.; Huang, J.G.; Ma, Q.; Hänninen, H.; Tremblay, F.; Bergeron, Y. Long-term changes in the impacts of global warming on leaf phenology of four temperate tree species. Glob. Chang. Biol. 2019, 25, 997–1004. [Google Scholar] [CrossRef]
  36. Fu, Y.; Piao, S.; Vitasse, Y.; Zhao, H.; De Boeck, H.J.; Liu, Q.; Yang, H.; Weber, U.; Hänninen, H.; Janssens, I. Increased heat requirement for leaf flushing in temperate woody species over 1980–2012: Effects of chilling, precipitation and insolation. Glob. Chang. Biol. 2015, 21, 2687–2697. [Google Scholar] [CrossRef]
  37. Fu, Y.; Zhao, H.; Piao, S.; Peaucelle, M.; Peng, S.; Zhou, G.; Ciais, P.; Huang, M.; Menzel, A.; Penuelas, J.; et al. Declining global warming effects on the phenology of spring leaf unfolding. Nature 2015, 526, 104–107. [Google Scholar] [CrossRef] [PubMed] [Green Version]
  38. Anderson, J.T.; Inouye, D.W.; McKinney, A.M.; Colautti, R.I.; Mitchell-Olds, T. Phenotypic plasticity and adaptive evolution contribute to advancing flowering phenology in response to climate change. Proc. R. Soc. B 2012, 279, 3843–3852. [Google Scholar] [CrossRef] [PubMed] [Green Version]
  39. Chalupa, J. Geobiocenologické Podklady Pro Návrh Péče O Přírodní Rezervaci Plačkův Les a říčKa ŠAtava. Bachelor’s Thesis, Mendel University in Brno, Brno, Czech Republic, 2007; 46p. [Google Scholar]
  40. Horák, J. Jihomoravské Lužní Lesy (Flood Plain Forests of South MORAVIA); Typological Study; Mendel University in Brno: Brno, Czech Republic, 1961; 247p. [Google Scholar]
  41. Brázdil, R.; Zahradnícek, P.; Dobrovolný, P.; Štěpánek, P.; Trnka, M. Observed changes in precipitation during recent warming: The Czech Republic, 1961–2019. Int. J. Climatol. 2021, 41, 3881–3902. [Google Scholar] [CrossRef]
  42. Brázdil, R.; Dobrovolný, P.; Mikšovský, J.; Pišoft, P.; Trnka, M.; Možný, M.; Balek, J. Documentary-based climate reconstructions in the Czech Lands 1501–2020 CE and their European context. Clim. Past 2022, 18, 935–959. [Google Scholar] [CrossRef]
  43. Rims, R.A.; Henden, J.A.; Killengreen, S.T. Collapsing population cycles. Trends Ecol. Evol. 2008, 23, 79–86. [Google Scholar]
  44. Peňuelas, J.; Rico, L.; Ogaya, R.; Jump, A.S.; Terradas, J. Summer season and long-term drought increase the richness of bacteria and fungi in the foliar phyllosphere of Quercus ilex in a mixed Mediterranean forest. Plant Biol. 2012, 14, 565–575. [Google Scholar] [CrossRef]
  45. Reneerkens, J.; Schmidt, N.M.; Gilg, O.; Hansen, J.; Hansen, L.H.; Moreau, J.; Piersma, T. Effects of food abundance and early clutch predation on reproductive timing in a high Arctic shorebird exposed to advancements in arthropod abundance. Ecol. Evol. 2016, 6, 7375–7386. [Google Scholar] [CrossRef]
  46. Mayor, S.J.; Guralnick, R.P.; Tingley, M.W.; Otegui, J.; Withey, J.C.; Elmendorf, S.; Andrew, M.; Leyk, S.; Pearse, I.S.; Schneider, D.C. Increasing phenological asynchrony between spring green-up and arrival of migratory birds. Sci. Rep. 2017, 7, 1902. [Google Scholar] [CrossRef] [Green Version]
  47. Ross, M.V.; Alisauskas, E.T.; Douglas, D.C.; Kellett, D.K. Decadal declines in avian herbivore reproduction: Density-dependent nutrition and phenological mismatch in the Arctic. Ecology 2017, 98, 1869–1883. [Google Scholar] [CrossRef]
  48. Illán, J.G.; Gutierrez, D.; Diez, S.B.; Wilson, R.J. Elevational trends in butterfly phenology: Implications for species responses to climate change. Ecol. Entomol. 2012, 37, 134–144. [Google Scholar] [CrossRef]
  49. Hansen, B.B.; Grøtan, V.; Aanes, R.; Sæther, B.E.; Stien, A.; Fuglei, E.; Ims, R.A.; Yoccoz, N.G.; Pedersen, Å.Ø. Climate events synchronize the dynamics of a resident vertebrate community in the high Arctic. Science 2013, 339, 313–315. [Google Scholar] [CrossRef] [PubMed] [Green Version]
Figure 1. Location of the experimental site (Plaček’ forest National Reserve) in the Czech Republic (upper part) and the table in the lower part with all species and mean dates of two phenological phases for each species. The hatching in the boxes indicates the phenological episodes that overlap among all others. FLD indicates the date when the first clutch in a given year was initiated at a given site. MLD indicates the mean initiation date of all first clutches in the population at each site in a given year.
Atmosphere 13 00978 g001
Figure 2. Location of climatological and precipitation stations series used for interpolation.
Atmosphere 13 00978 g002
Figure 3. (A) Average terms of phenological phases for herbs, shrubs, trees, and birds for the period of 1961–2021. (B) Relationship between daily air maximum temperature in MAM (March, April, May) and the terms of phenophases for average values of herbs, shrubs, trees, and birds.
Atmosphere 13 00978 g003
Figure 4. Running correlation for tree phenophases with maximum temperature in the 20-year periods (A). Abbreviations for species and temperature are explained in Table 2. Correlation in the 20-year periods for average values of phenophases for herbs, shrubs, and bird species of an ecosystem with maximal temperature in March and April (B).
Atmosphere 13 00978 g004
Figure 5. Running correlations for terms of phenological phases among all herbs (A), shrubs (B), and trees (C) and averaged terms of phenophases for herbs, shrubs, trees, and bird species (D). Abbreviations for each species: PO1—Pulmonaria officinalis; GL1—Gagea lutea; CC1—Corydalis cava; AR1—Anemone ranunculoides; PQ1—Paris quadrifolia; CM1—Cornus mas; PS1—Prunus spinosa; CO1—Crataegus oxyacantha; CMo1—Crataegus monogyna; CS1—Cornus sanguinea; CB1—Carpinus betulus; UL1—Ulmus laevis; QR1—Quercus robur; FE1—Fraxinus excelsior; AC1—Acer campestre; TC1—Tilia cordata; and PM1—Parus major.
Atmosphere 13 00978 g005
Figure 6. Overlap index for all observed overlaps of the studied phenological stages of herbs, shrubs, trees, and bird species in 1961–2021. The blue colour indicates years with a high number of overlapping days, and the red colour indicates years with a low number of overlapping days.
Atmosphere 13 00978 g006
Table 1. Average mean air temperature and the sum of precipitation for the experimental site and linear trends during 1961–2021 for mean, maximum and minimum temperature, and the sum of total precipitation. FM indicates the average for months February and March; MA for March and April; AM for April and May; FMA for February, March, and April; MAM for March, April, and May; and FMAM for February, March, April, and May.
Nature ReserveAltitude/mLatitudeLongitude
VranovicePlačkek’ forest17048°56′54″16°35′50″
Average values
FebruaryMarchAprilMayFMMAAMFMAMAMFMAMYear
Mean daily air temperature (°C)0.8510.214.82.97.612.55.3107.79.8
Maximum daily air temperature (°C)4.49.81620.87.112.918.410.115.512.814.7
Minimum daily air temperature (°C)−2.90.34.38.9−1.32.36.60.64.52.75.0
Precipitation (mm)2326305549568578111134473
Linear trends in 1961–2021
FebruaryMarchAprilMayFMMAAMFMAMAMFMAMYear
Mean daily air temperature (°C)1.691.51.051.051.591.27 *1.05 *1.42 *1.2 **1.32 **1.45 ***
Maximum daily air temperature (°C)2.5 *2.74 *2.35 **1.242.62 *2.55 ***1.8 **2.53 ***2.11 ***2.21 ***1.89 ***
Minimum daily air temperature (°C)0.890.25−0.240.860.570.050.310.30.290.441.0 **
Total precipitation (mm)−3.134.18−10.73−6.231.05−6.55−16.96−9.68−12.78−15.916.32
* Significant at α= 0.05; ** significant at α = 0.01; *** significant at α = 0.001%.
Table 2. Linear trends for observed phenological terms (slope of the linear regression line). P1 indicates phenophase ‘first flower’ for herbs and shrubs; bud breaking for trees and FLD (first laying date) for bird species. P2 indicates phenophase ‘full flowering’ for herbs and shrubs; full foliage for trees and MLD (mean laying date) for bird species. Correlation with maximum air temperature (Tmax) was detected for averaged values of months: FM (av. temperature for February and March), M (av. temp. for March), MA (av. temp. for March and April), FMA (av. temp. for February, March, and April) and MAM (average temperature for March, April, and May). The value “r” (correlation coefficient) describes the relationship among terms of phenophases and Tmax (all coefficients are significant at α = 0.05).
SpeciesPhenophasesAbbreviationDays/1961–2021
(Days/Decade)
Temperature
Correlation
r
HerbsCommon Lungwort
(Pulmonaria officinalis, L.)
P1PO112.5 * (2.1)Tmax/FM0.81
P2PO27.8 * (1.3)Tmax/M0.79
Yellow Starof-Bethlehem
(Gagea lutea, L.)
P1GL120.7 *** (3.5)Tmax/FM0.77
P2GL219.6 *** (3.3)Tmax/M0.75
Bulbous Corydalis
(Corydalis cava, L.)
P1CC115.1 ** (2.6)Tmax/M0.79
P2CC214.0 *** (2.4)Tmax/MA0.74
Yellow Wood Anemone
(Anemone ranunculoides, L)
P1AR113.7 ** (2.3)Tmax/FM0.82
P2AR211.1 ** (1.9)Tmax/MA0.78
Herb Paris
(Paris quadrifolia, L.)
P1PQ110.4 ** (1.8)Tmax/MA0.81
P2PQ210.8 *** (1.8)Tmax/MA0.81
ShrubsEuropean Cornel
(Cornus mas, L.)
P1CM111.5 (1.9)Tmax/FM0.91
P2CM29 (1.5)Tmax/FM0.85
Blackthorn
(Prunus spinosa, L.)
P1PS110.07 ** (1.7)Tmax/FMA0.85
P2PS210.1 ** (1.7)Tmax/FMA0.83
English Hawthorn
(Crataegus oxyacantha, L.)
P1CO115.4 *** (2.6)Tmax/MAM0.86
P2CO215.4 *** (2.6)Tmax/MAM0.89
Common hawthorn
(Crataegus monogyna, Jacq.)
P1CMo113.4 *** (2.3)Tmax/MAM0.88
P2CMo213.0 *** (2.2)Tmax/MAM0.91
Common Dogwood
(Cornus sanguinea, L.)
P1CS115.4 *** (2.6)Tmax/MAM0.85
P2CS215.7 *** (2.7)Tmax/AM0.86
TreesCommon Hornbeam
(Carpinus betulus, L.)
P1CB19.2 ** (1.6)Tmax/M0.82
P2CB27.1 * (1.2)Tmax/MA0.81
European White Elm
(Ulmus laevis, P.)
P1UL18.8 * (1.5)Tmax/M0.78
P2UL210.7 *** (1.8)Tmax/MAM0.85
English Oak
(Quercus robur, L.)
P1QR111.9 *** (2.0)Tmax/MA0.75
P2QR210.4 *** (1.8)Tmax/MAM0.82
European ash
(Fraxinus excelsior, L.)
P1FE110.3 *** (1.7)Tmax/MA0.79
P2FE28.6 ** (1.4)Tmax/MAM0.88
Field maple
(Acer campestre, L.)
P1AC15.9 (1.0)Tmax/M0.83
P2AC27.5 * (1.0)Tmax/MA0.81
Small-leaved lime
(Tilia cordata, Mill.)
P1TC16.2 (1.0)Tmax/MA0.76
P2TC26.4 * (1.1)Tmax/MAM0.72
BirdsGreat Tit
(Parus major, L.)
P1PM17.8 ** (1.3)Tmax/MA0.75
P2PM28.5 *** (1.4)Tmax/MA0.82
* Significant at α= 0.05; ** significant at α = 0.01; *** significant at α = 0.001%.
Publisher’s Note: MDPI stays neutral with regard to jurisdictional claims in published maps and institutional affiliations.

