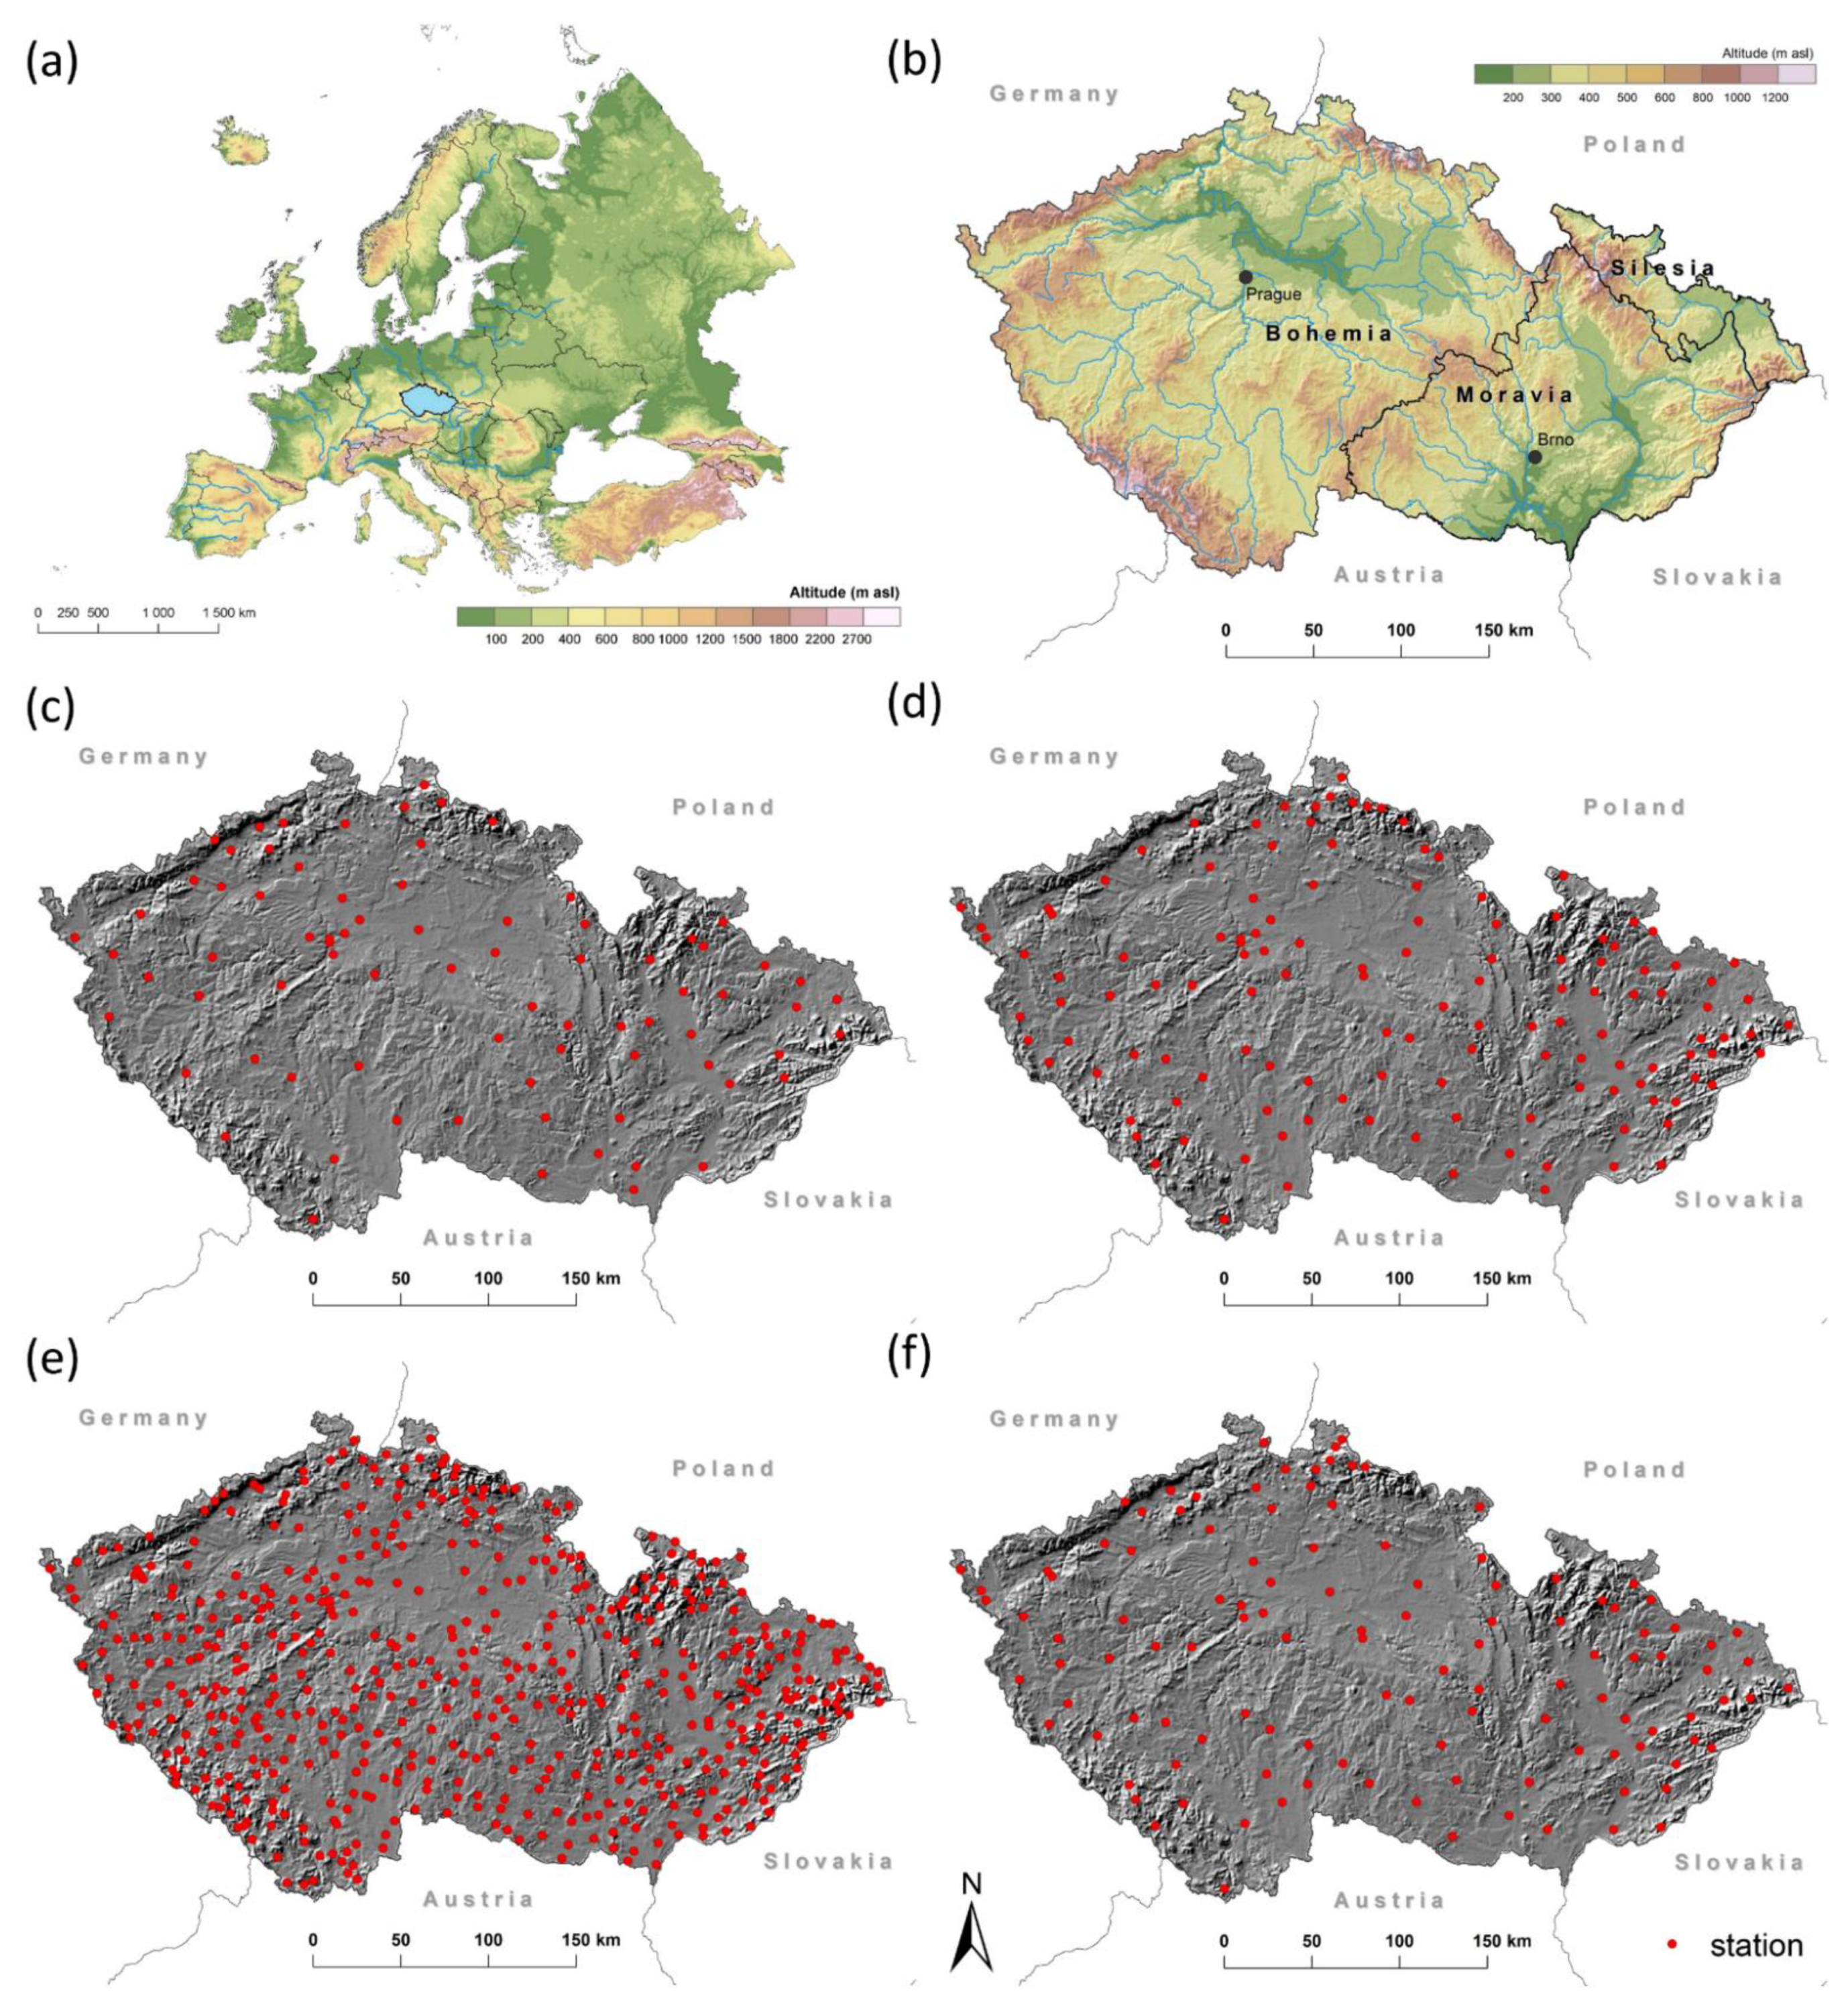
Figure 1.
(a) The location of the Czech Republic in Europe, (b) the physical geographical map of the Czech Republic, and the network of meteorological stations of the Czech Hydrometeorological Institute used for the calculation of (c) sunshine duration, (d) temperatures and relative humidity, (e) precipitation totals, and (f) wind speed.
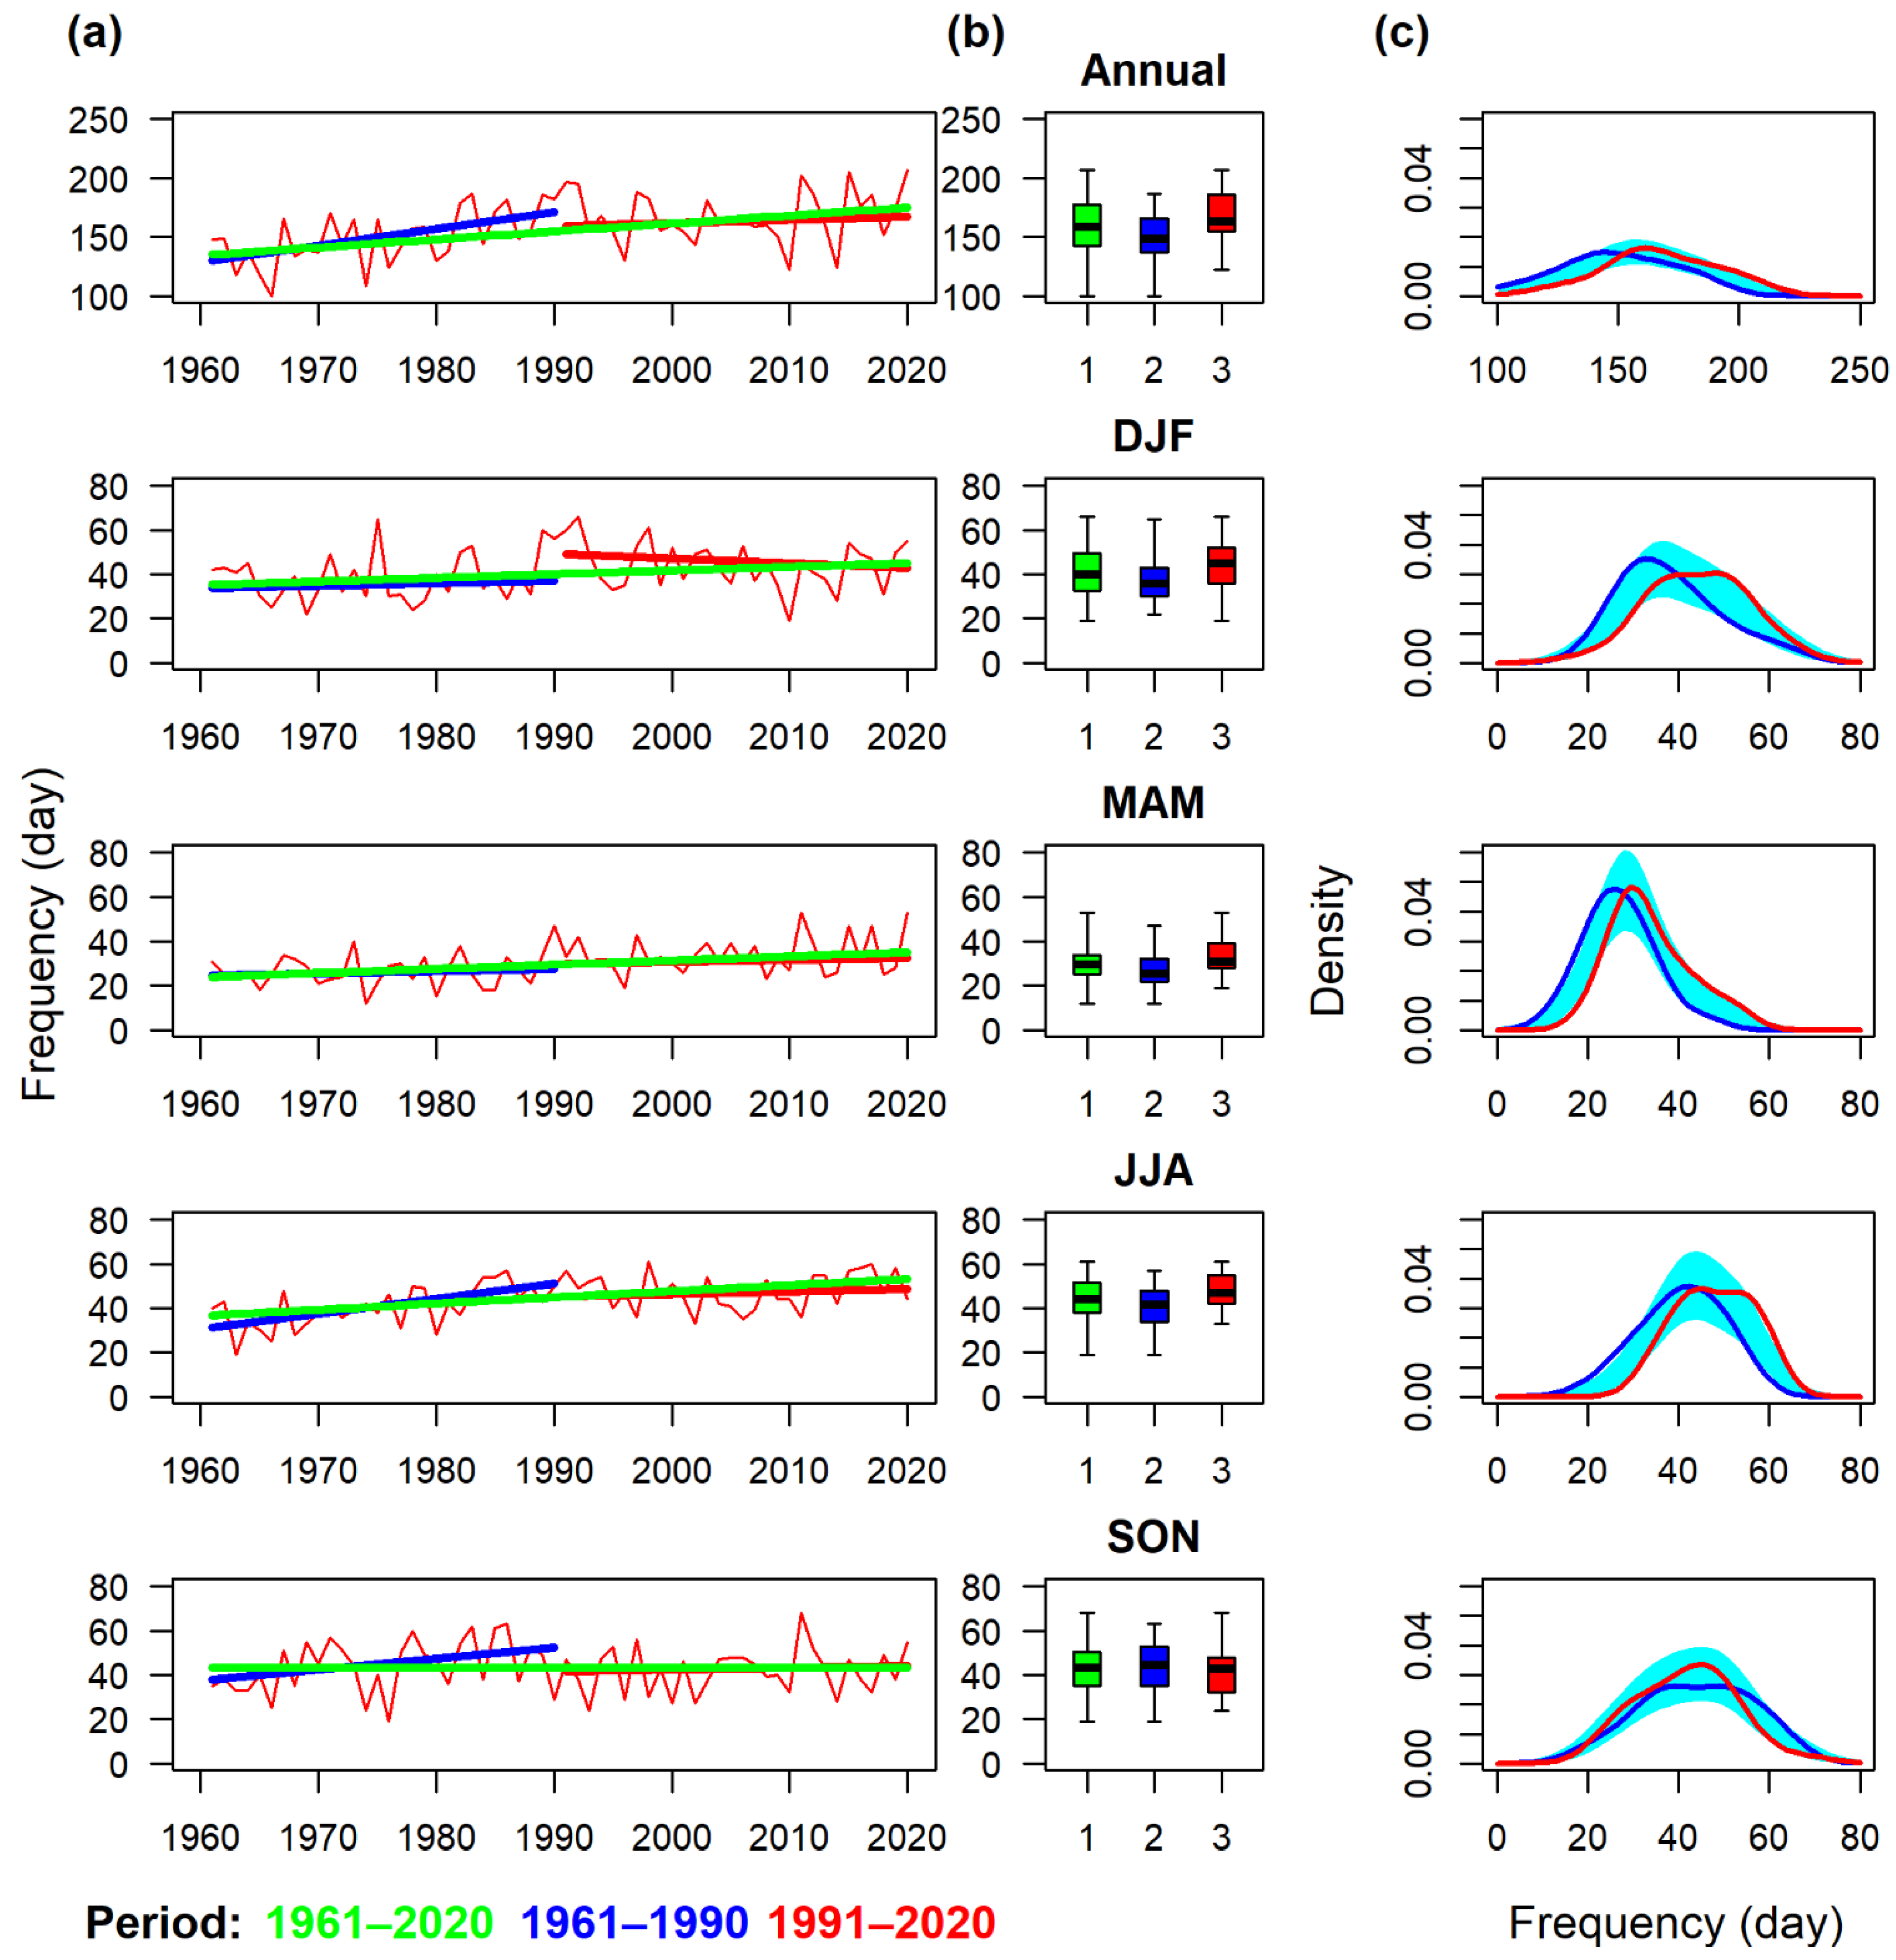
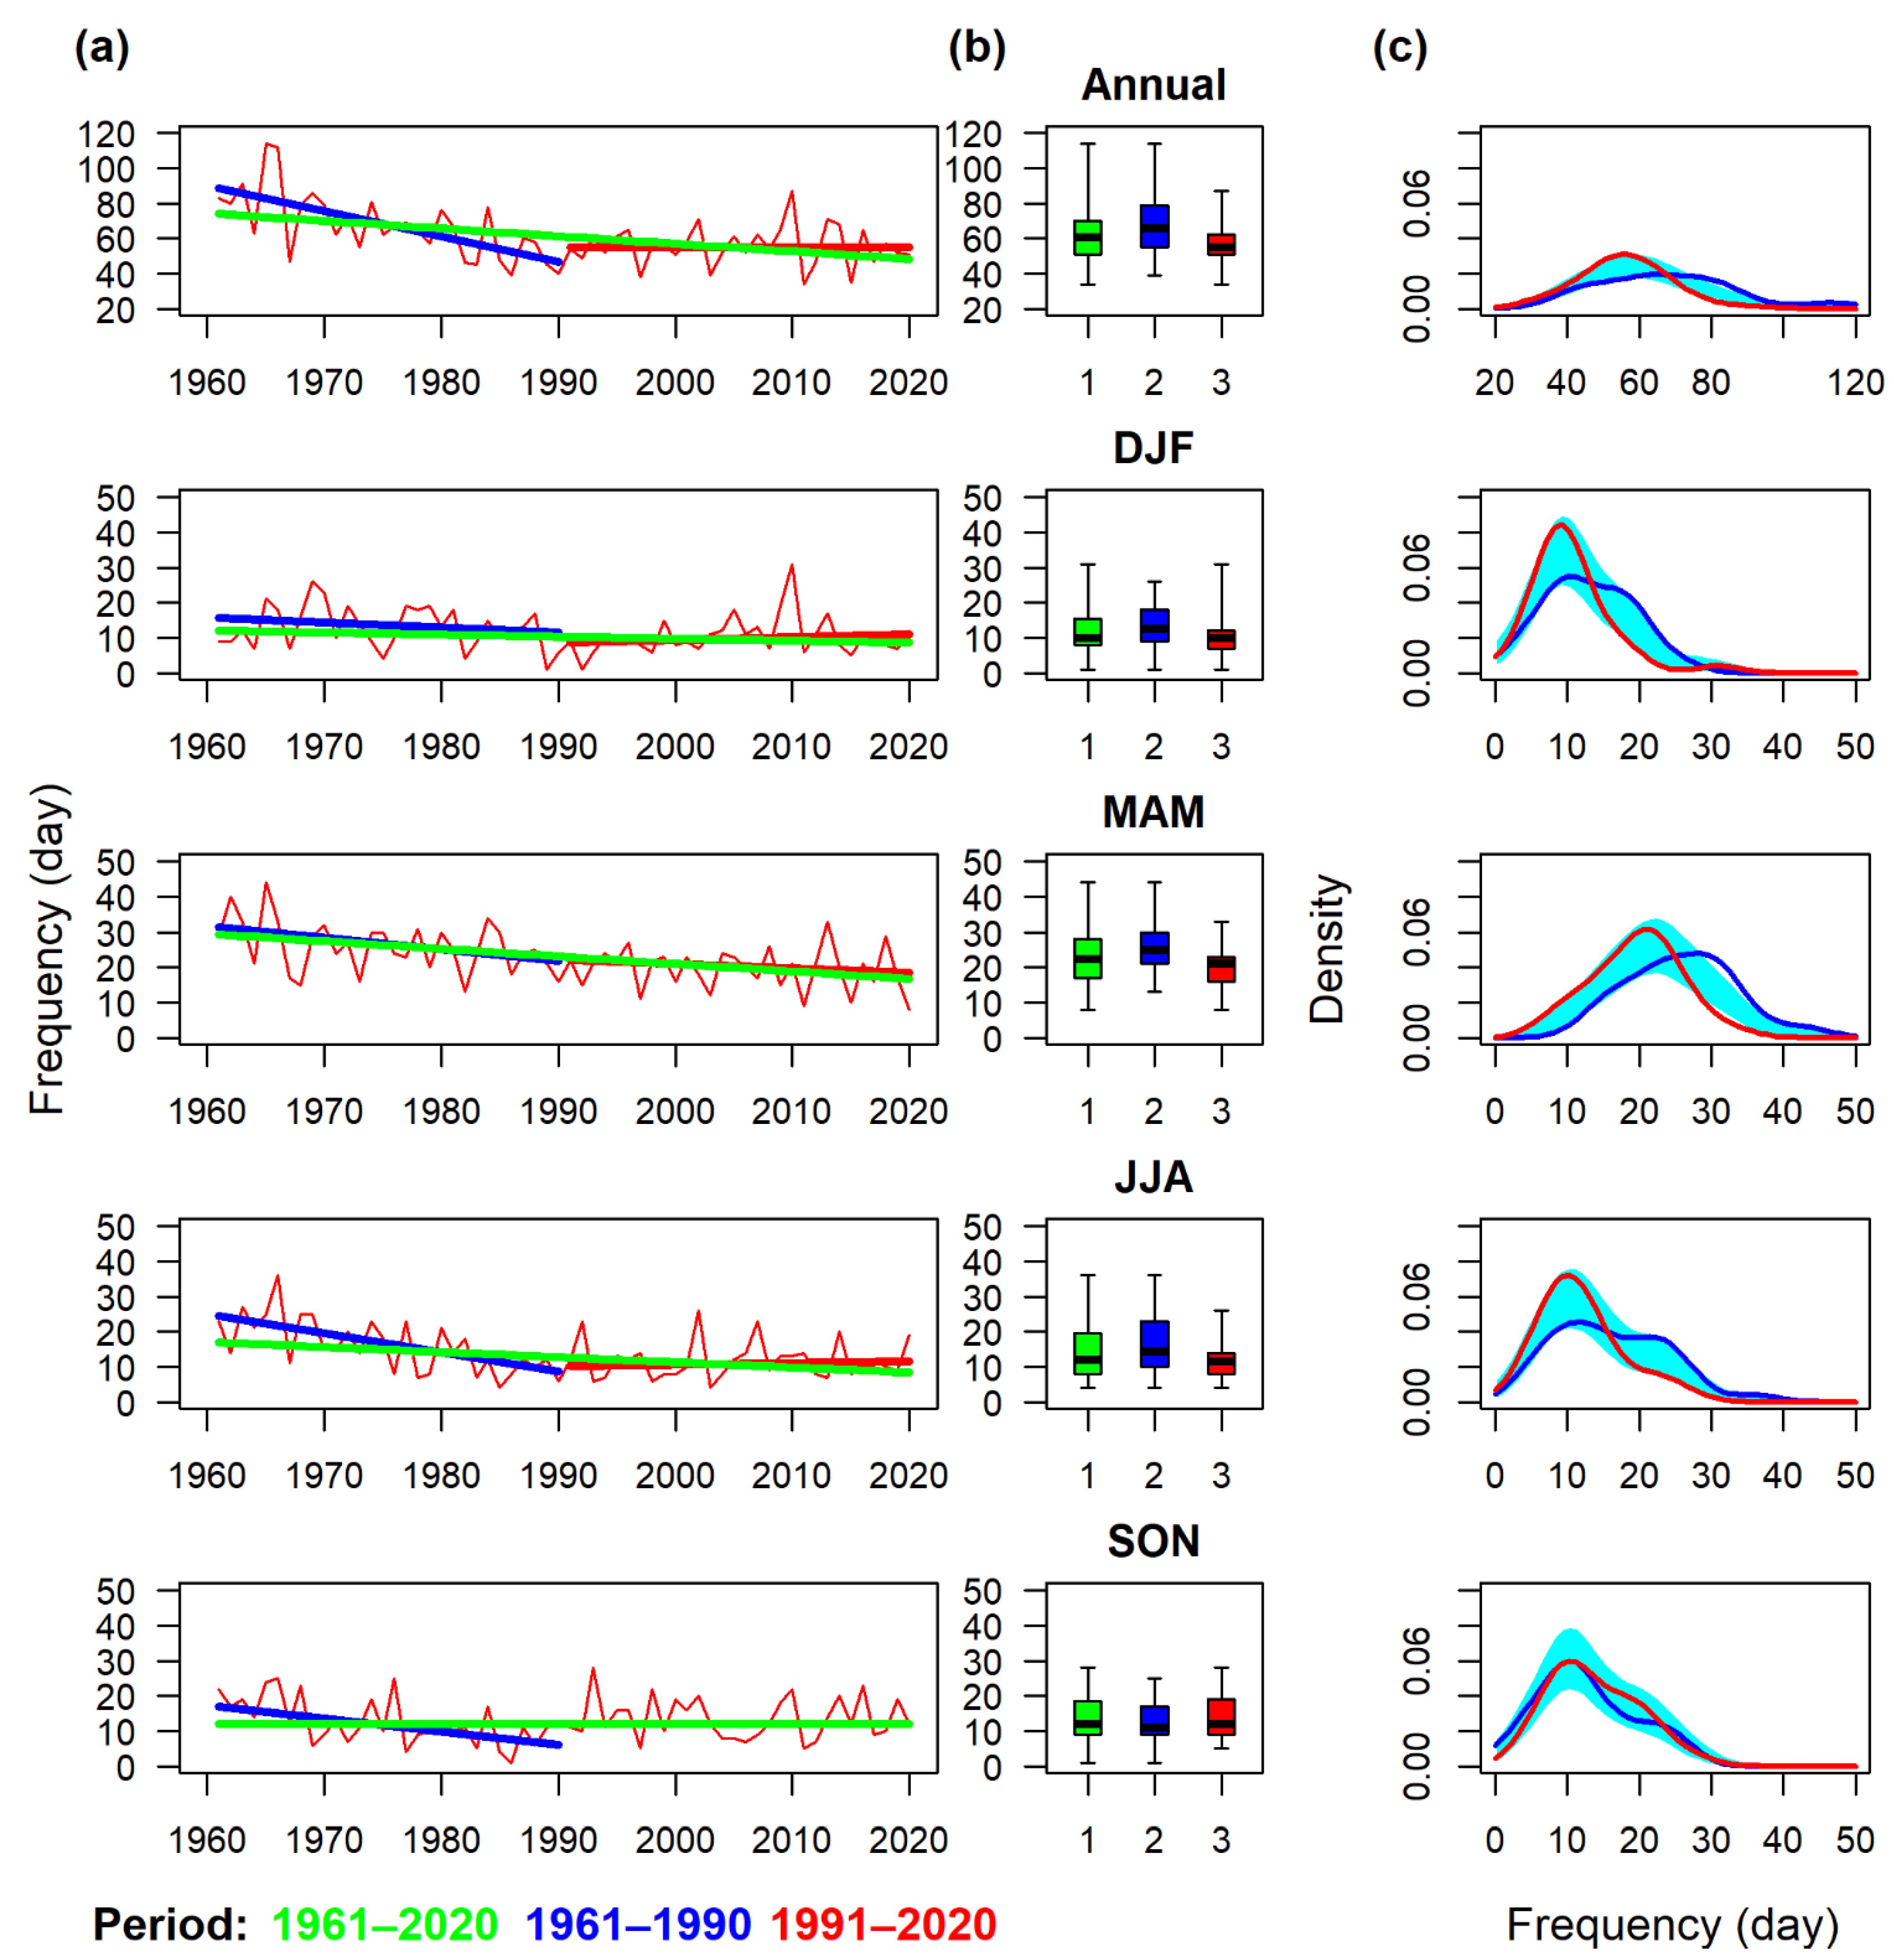
Figure 2.
Annual and seasonal frequencies of days with anticyclonic circulation types according to the objective classification for the territory of the Czech Republic in the 1961–2020 period: (a) fluctuations with linear trends in the entire period, 1961–1990 and 1991–2020; (b) box plots (median, lower and upper quartile, minimum, and maximum) for 1961–2020 (1), 1961–1990 (2), and 1991–2020 (3); (c) the density distribution of the series in 1961–1990 and 1991–2020. The density curves outside the reference band (green–blue) indicate a significant difference in the two distributions (and vice versa).
Figure 3.
Annual and seasonal frequencies of days with cyclonic circulation types according to the objective classification for the territory of the Czech Republic in the 1961–2020 period: (a) fluctuations with linear trends in the entire period, 1961–1990 and 1991–2020; (b) box plots (median, lower and upper quartile, minimum, and maximum) for 1961–2020 (1), 1961–1990 (2), and 1991–2020 (3); (c) the density distribution of the series in 1961–1990 and 1991–2020. The density curves outside the reference band (green–blue) indicate a significant difference in the two distributions (and vice versa).
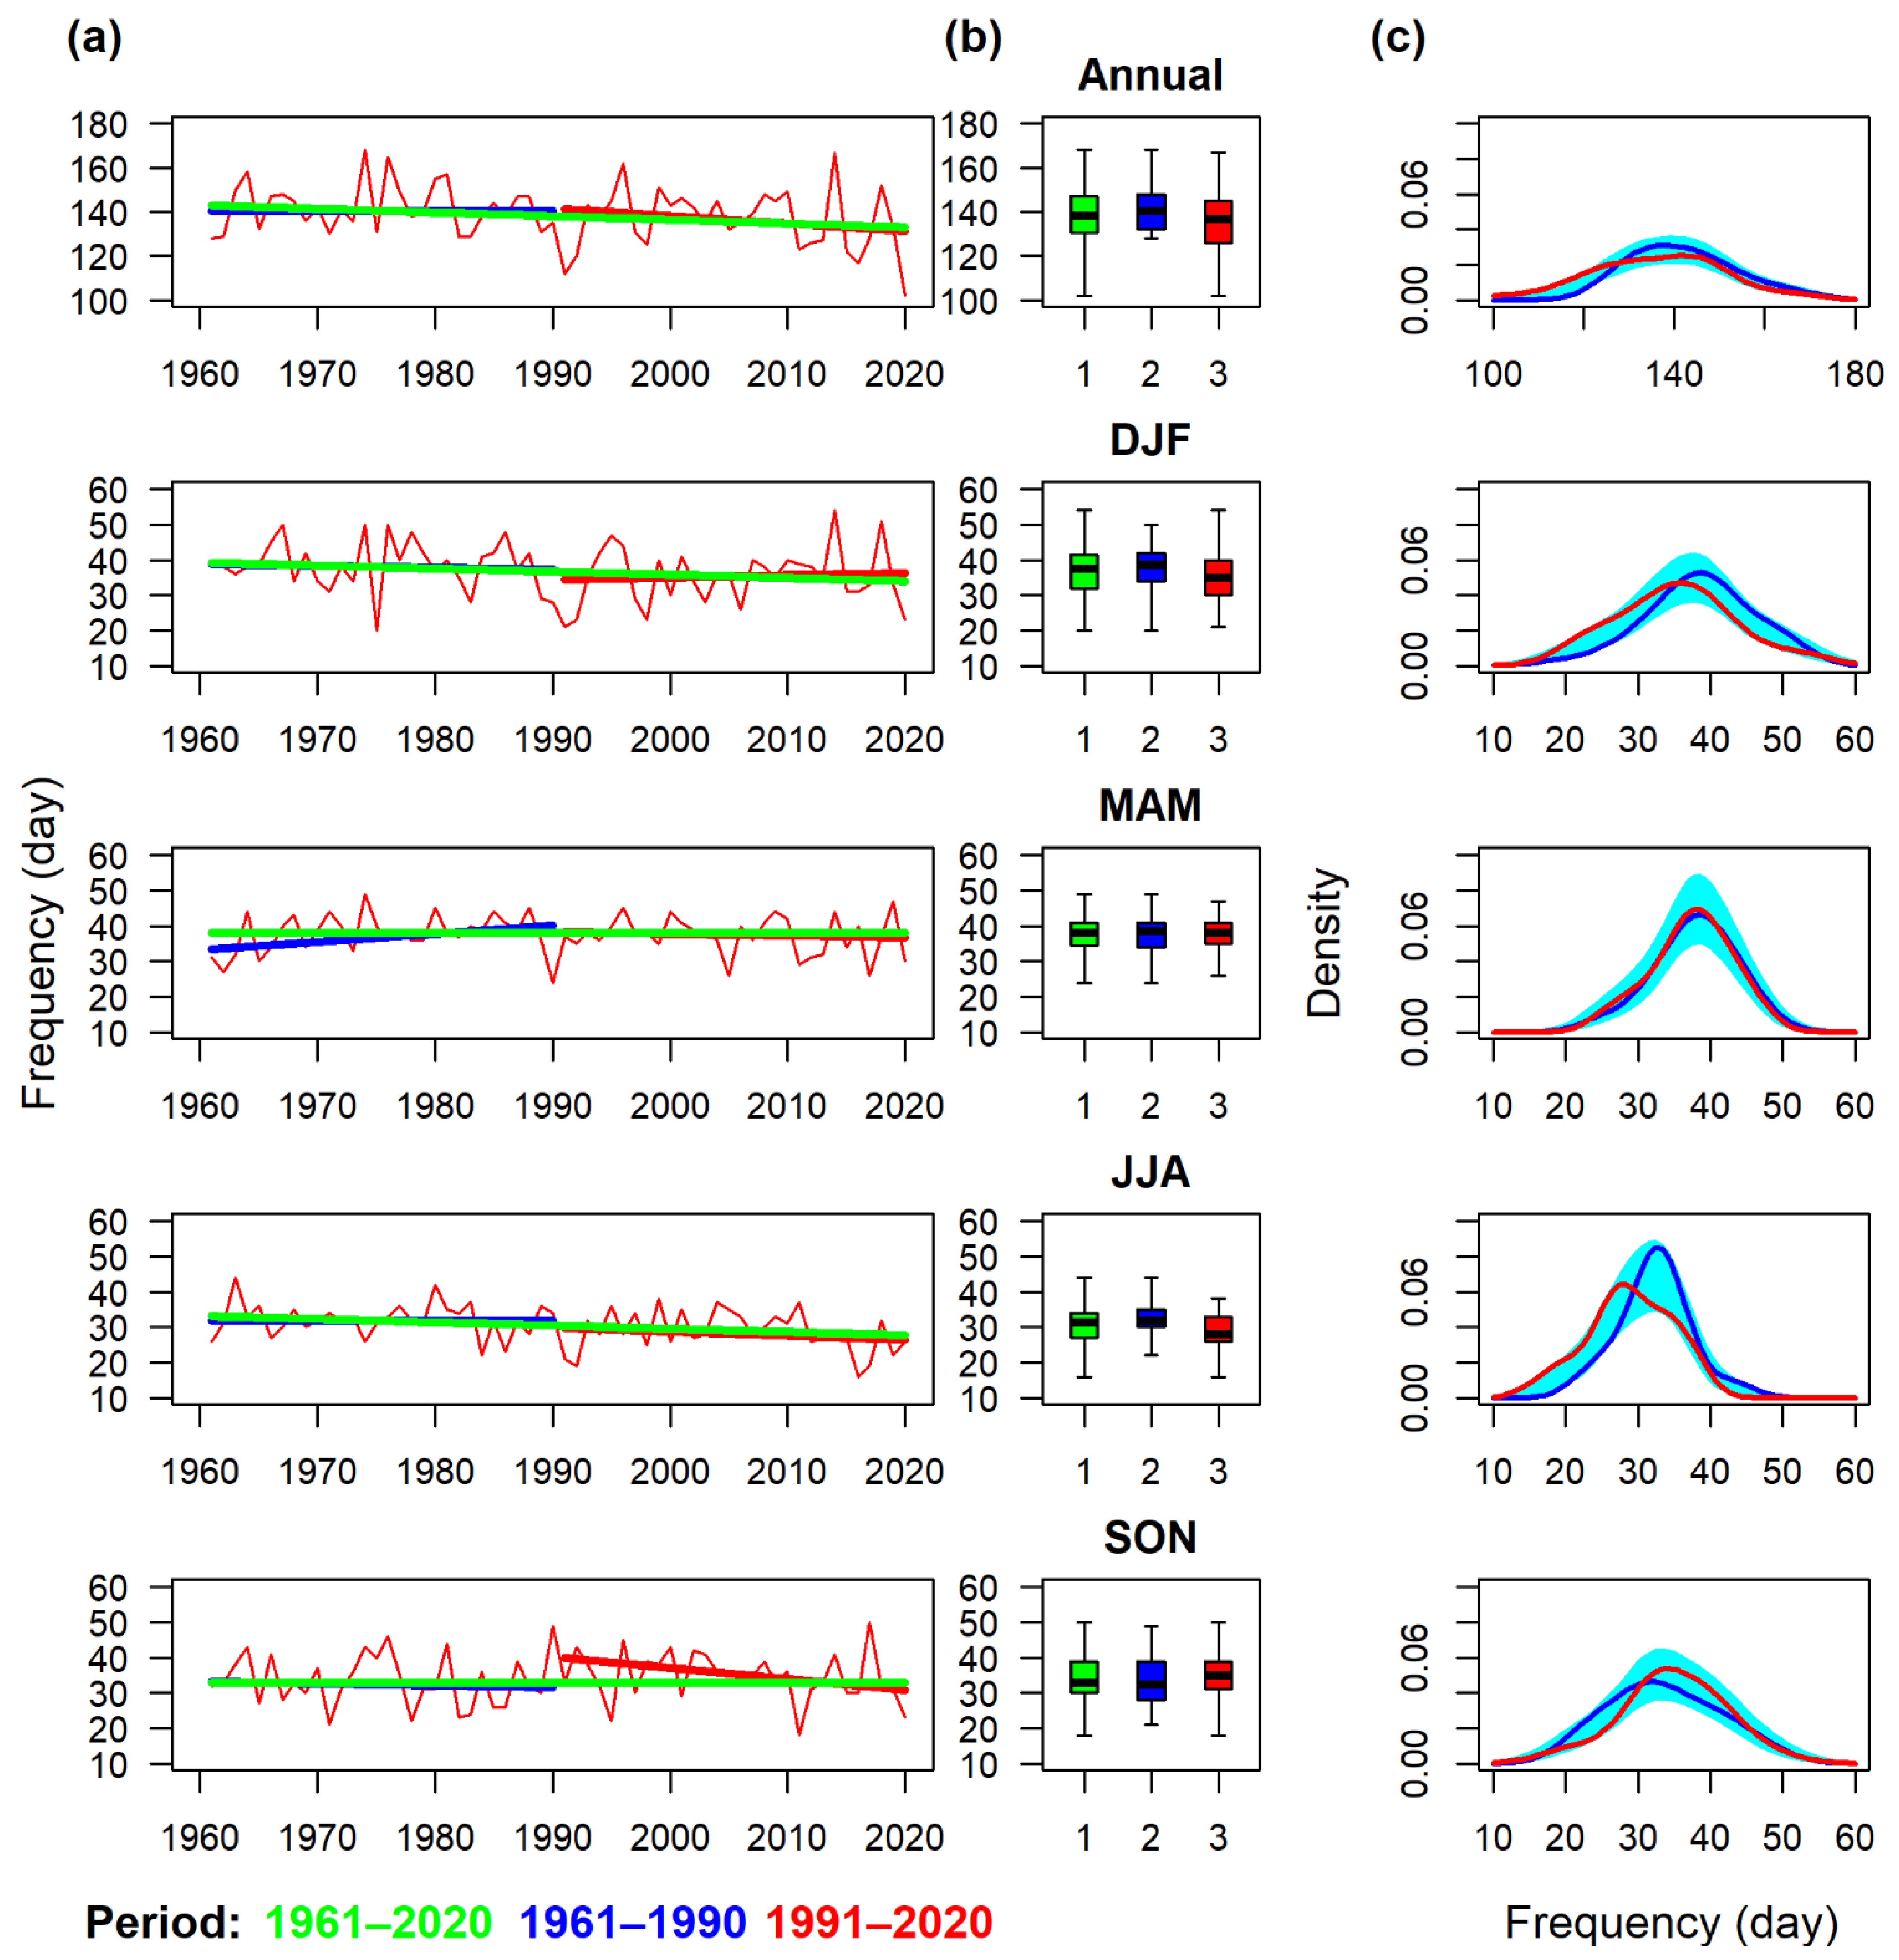
Figure 4.
Annual and seasonal frequencies of days with directional circulation types according to the objective classification for the territory of the Czech Republic in the 1961–2020 period: (a) fluctuations with linear trends in the entire period, 1961–1990 and 1991–2020; (b) box plots (median, lower and upper quartile, minimum, and maximum) for 1961–2020 (1), 1961–1990 (2), and 1991–2020 (3); (c) the density distribution of the series in 1961–1990 and 1991–2020. The density curves outside the reference band (green–blue) indicate a significant difference in the two distributions (and vice versa).
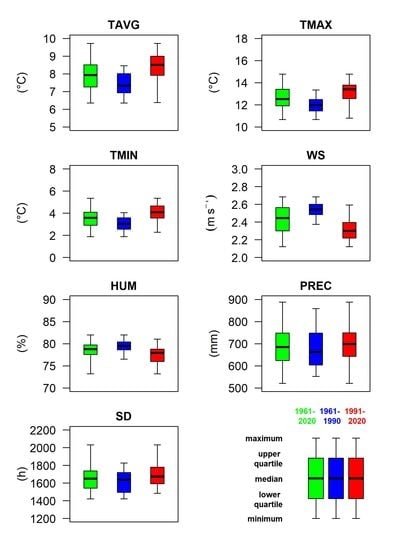
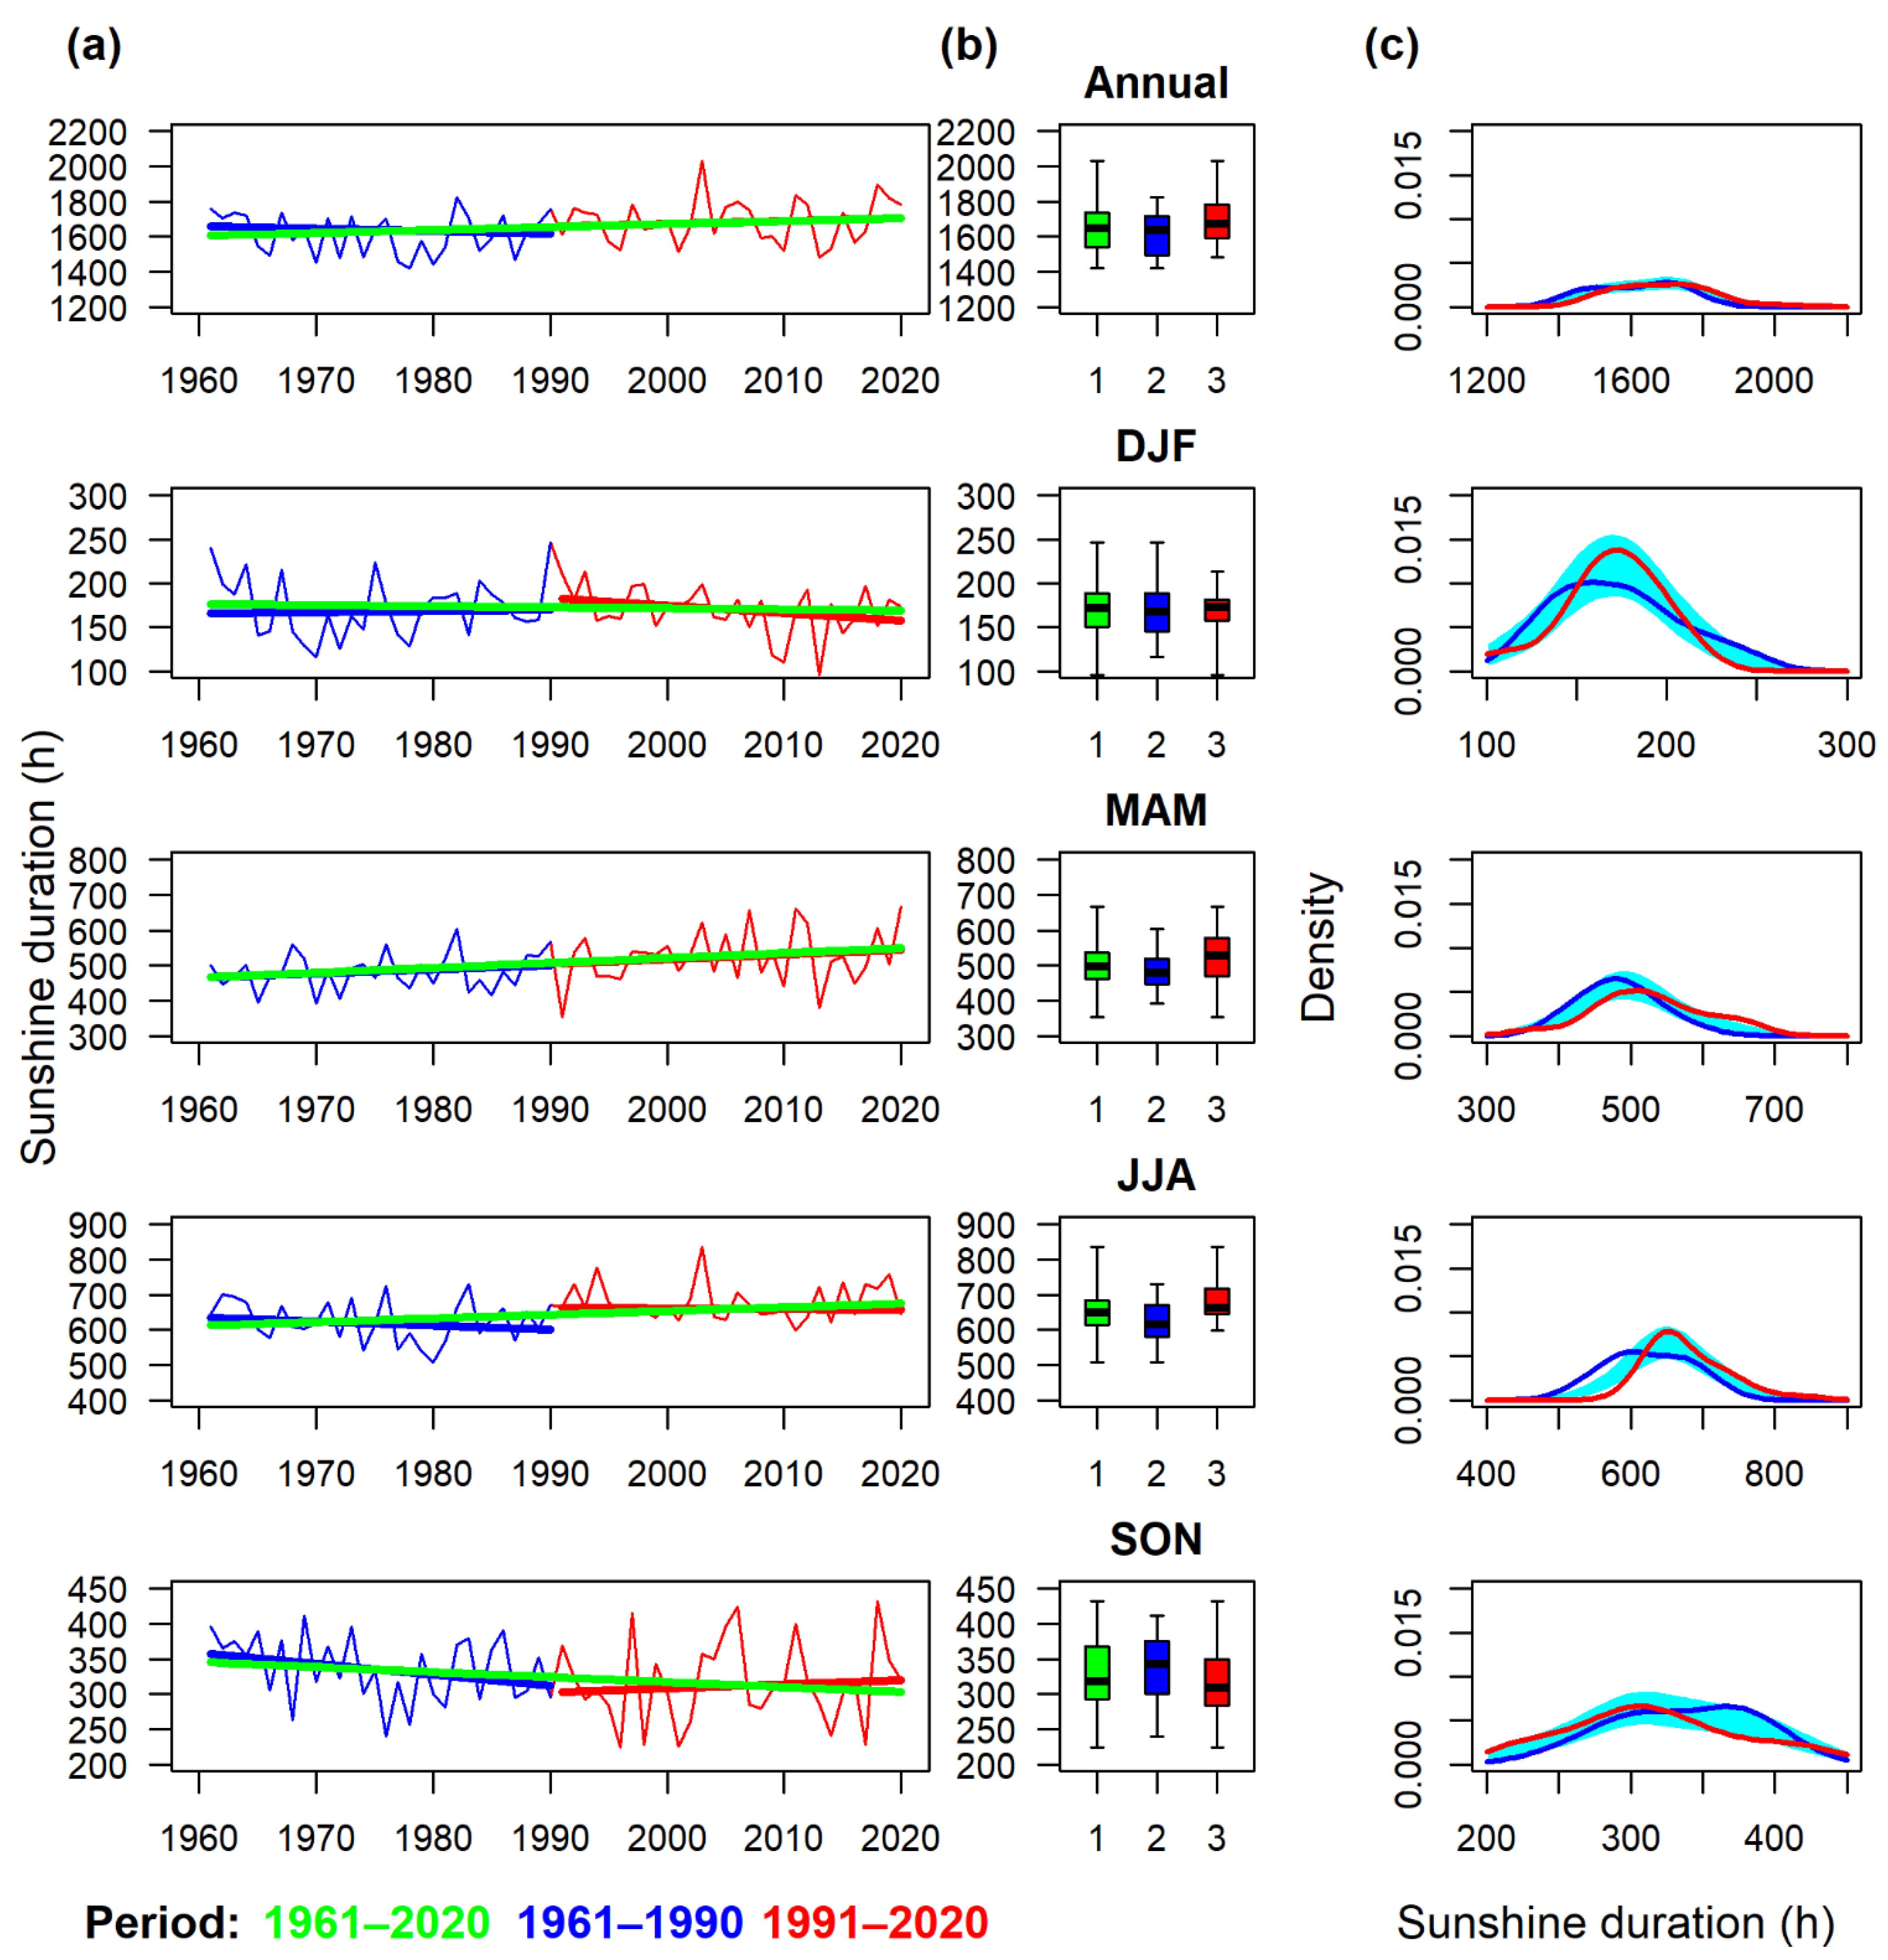
Figure 5.
Mean annual and seasonal series of sunshine duration for the territory of the Czech Republic in the 1961–2020 period: (a) fluctuations with linear trends in the entire period, 1961–1990 and 1991–2020; (b) box plots (median, lower and upper quartile, minimum, and maximum) for 1961–2020 (1), 1961–1990 (2), and 1991–2020 (3); (c) the density distribution of the series in 1961–1990 and 1991–2020. The density curves outside the reference band (green–blue) indicate a significant difference in the two distributions (and vice versa).
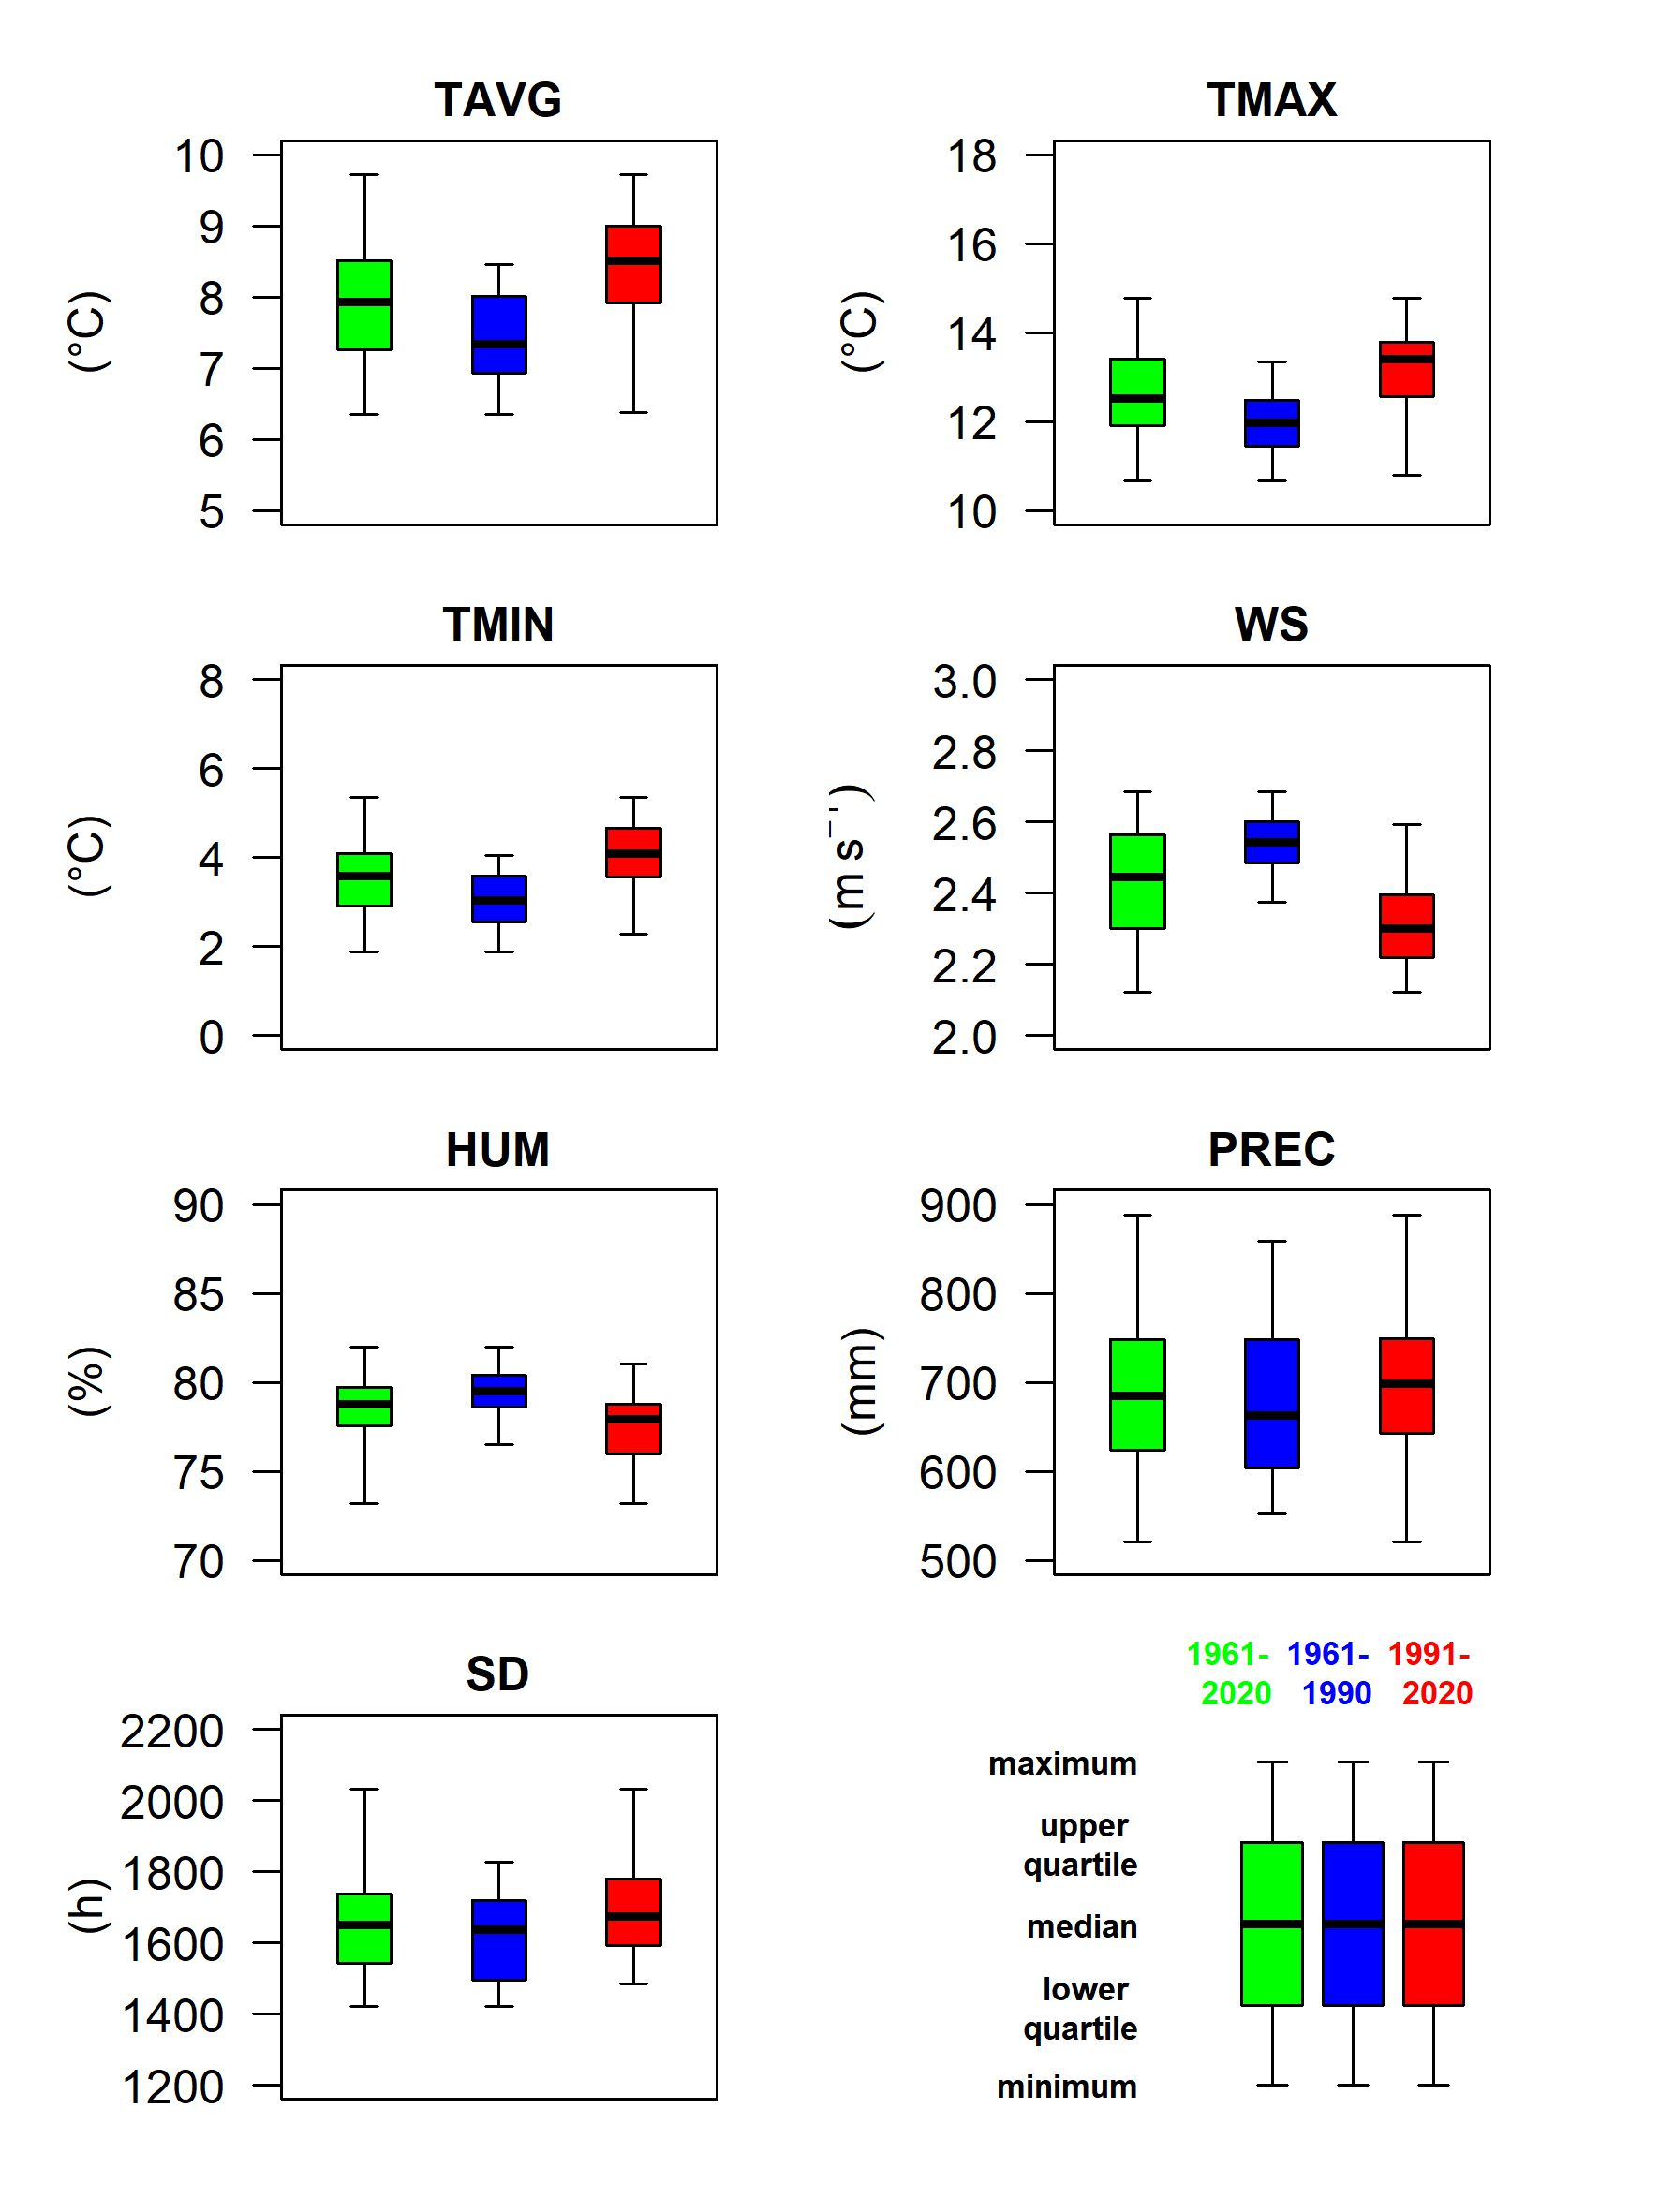
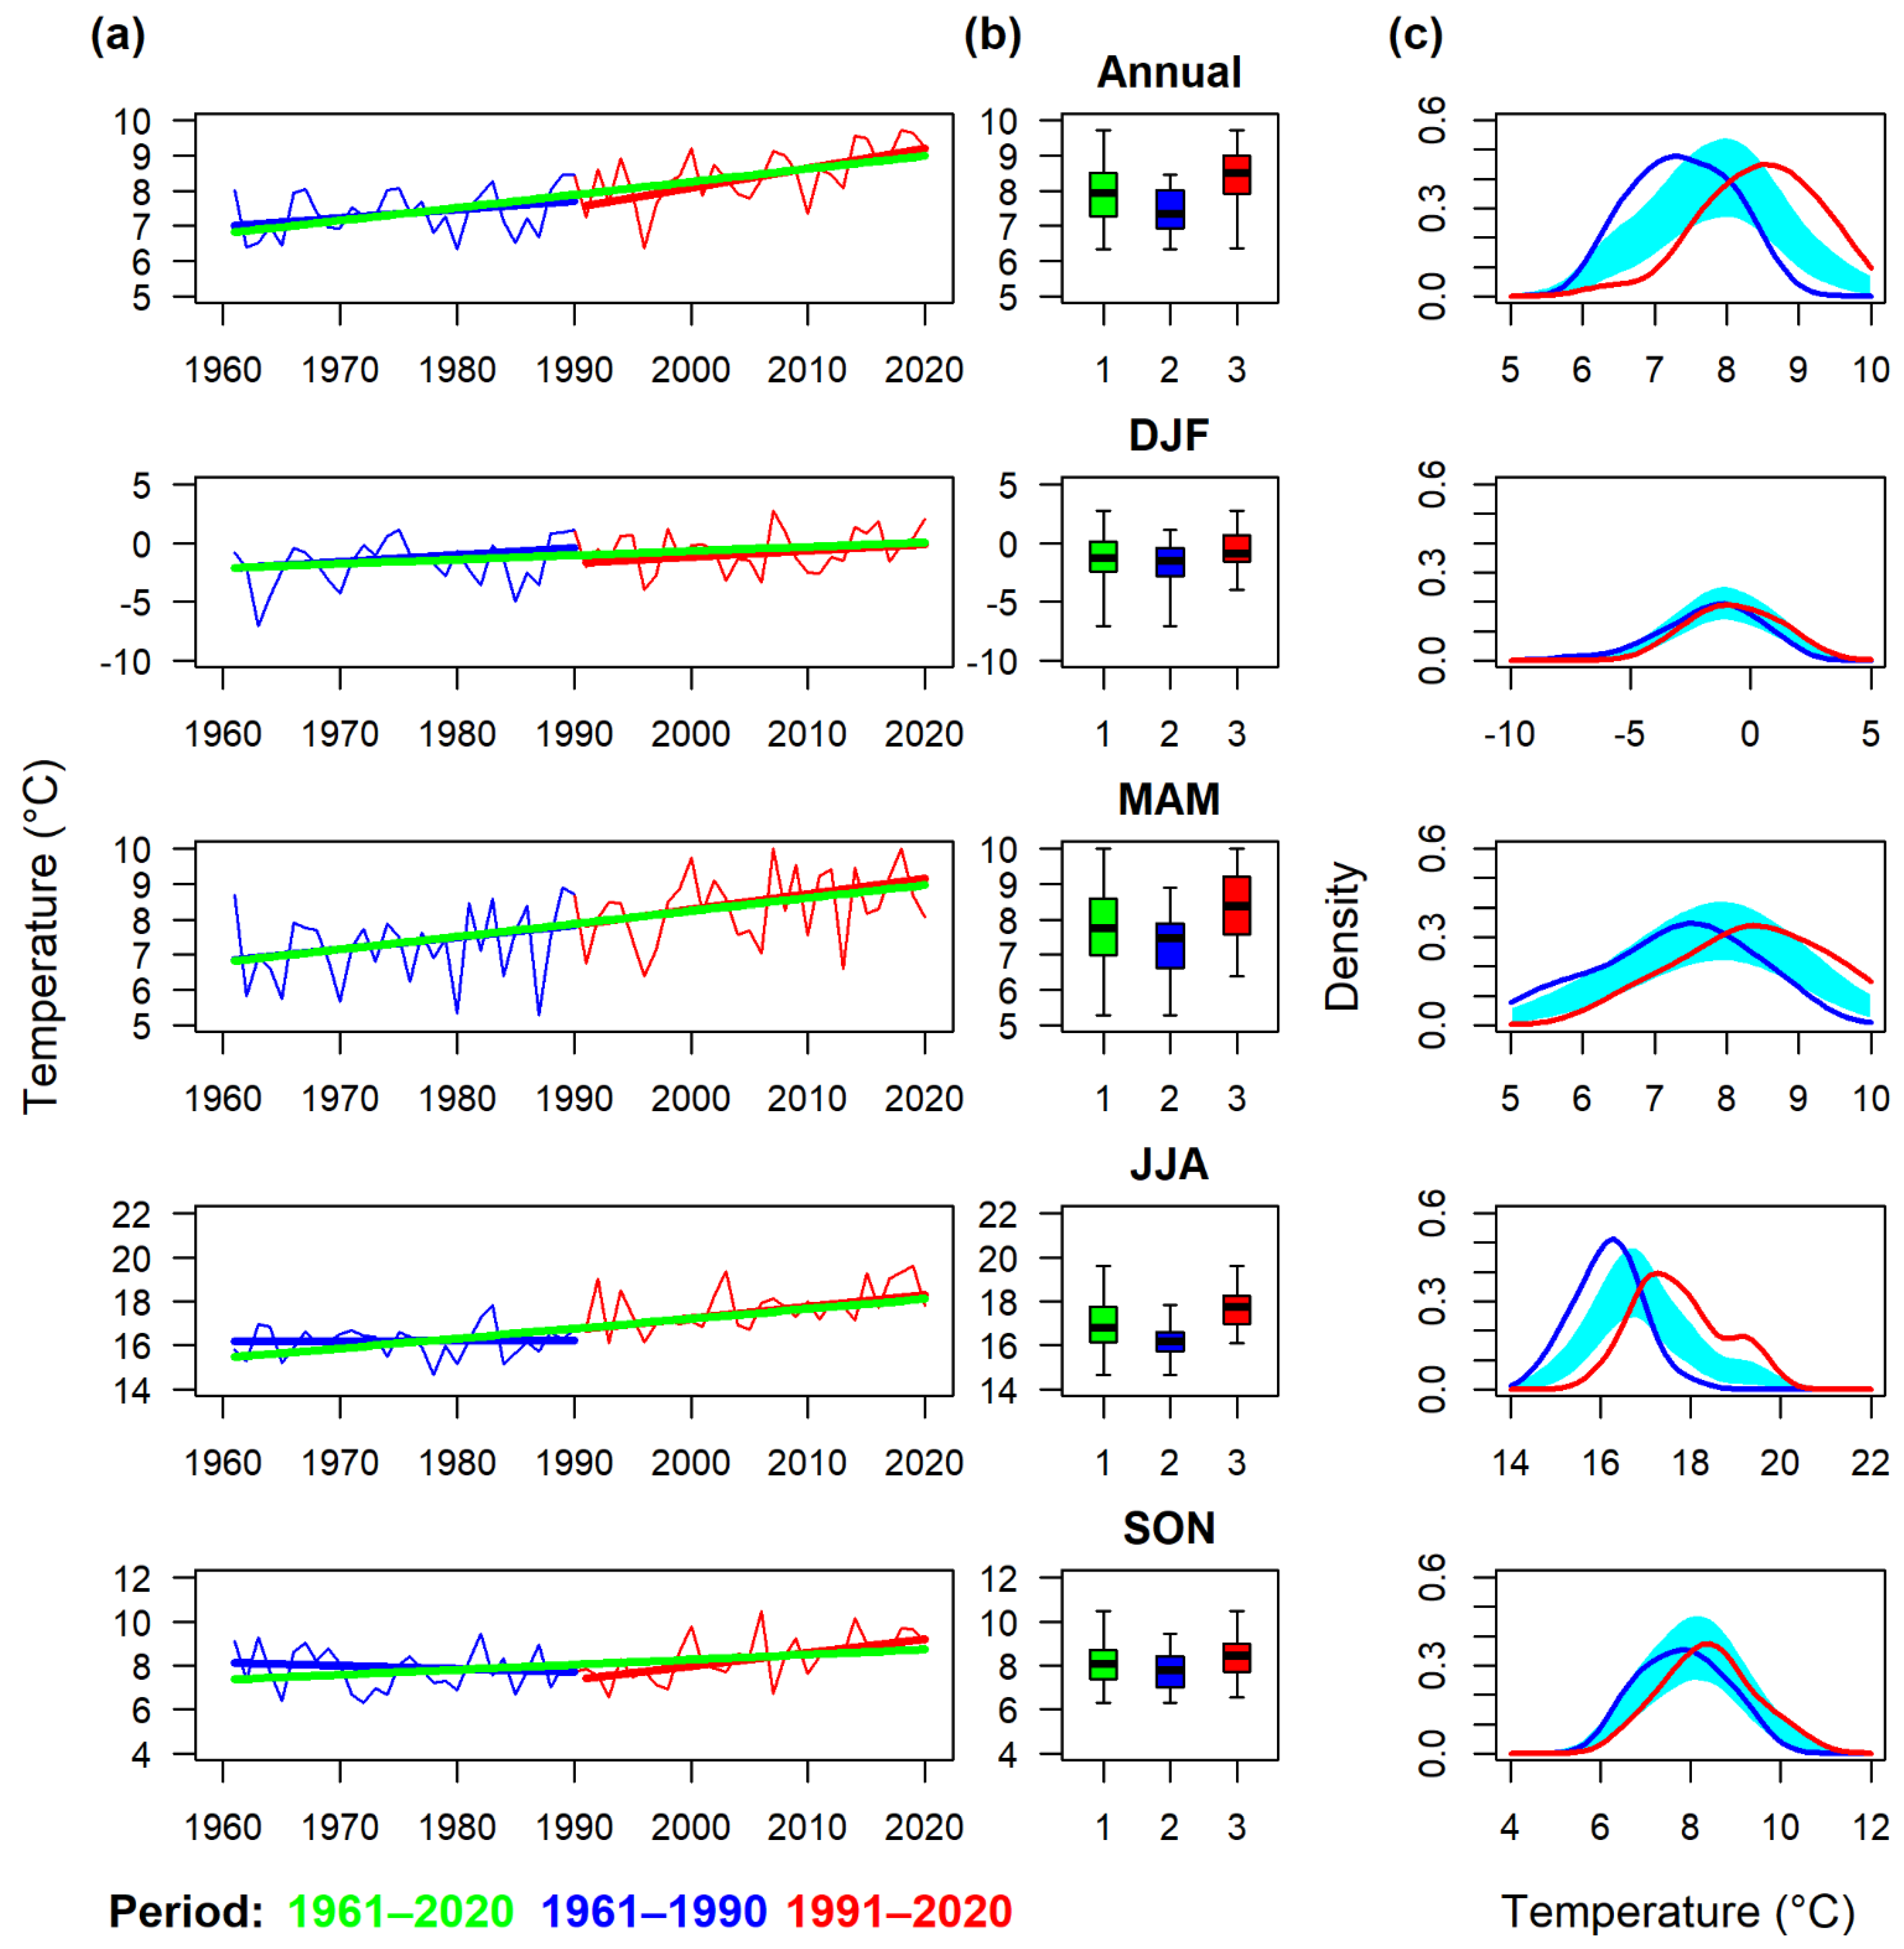
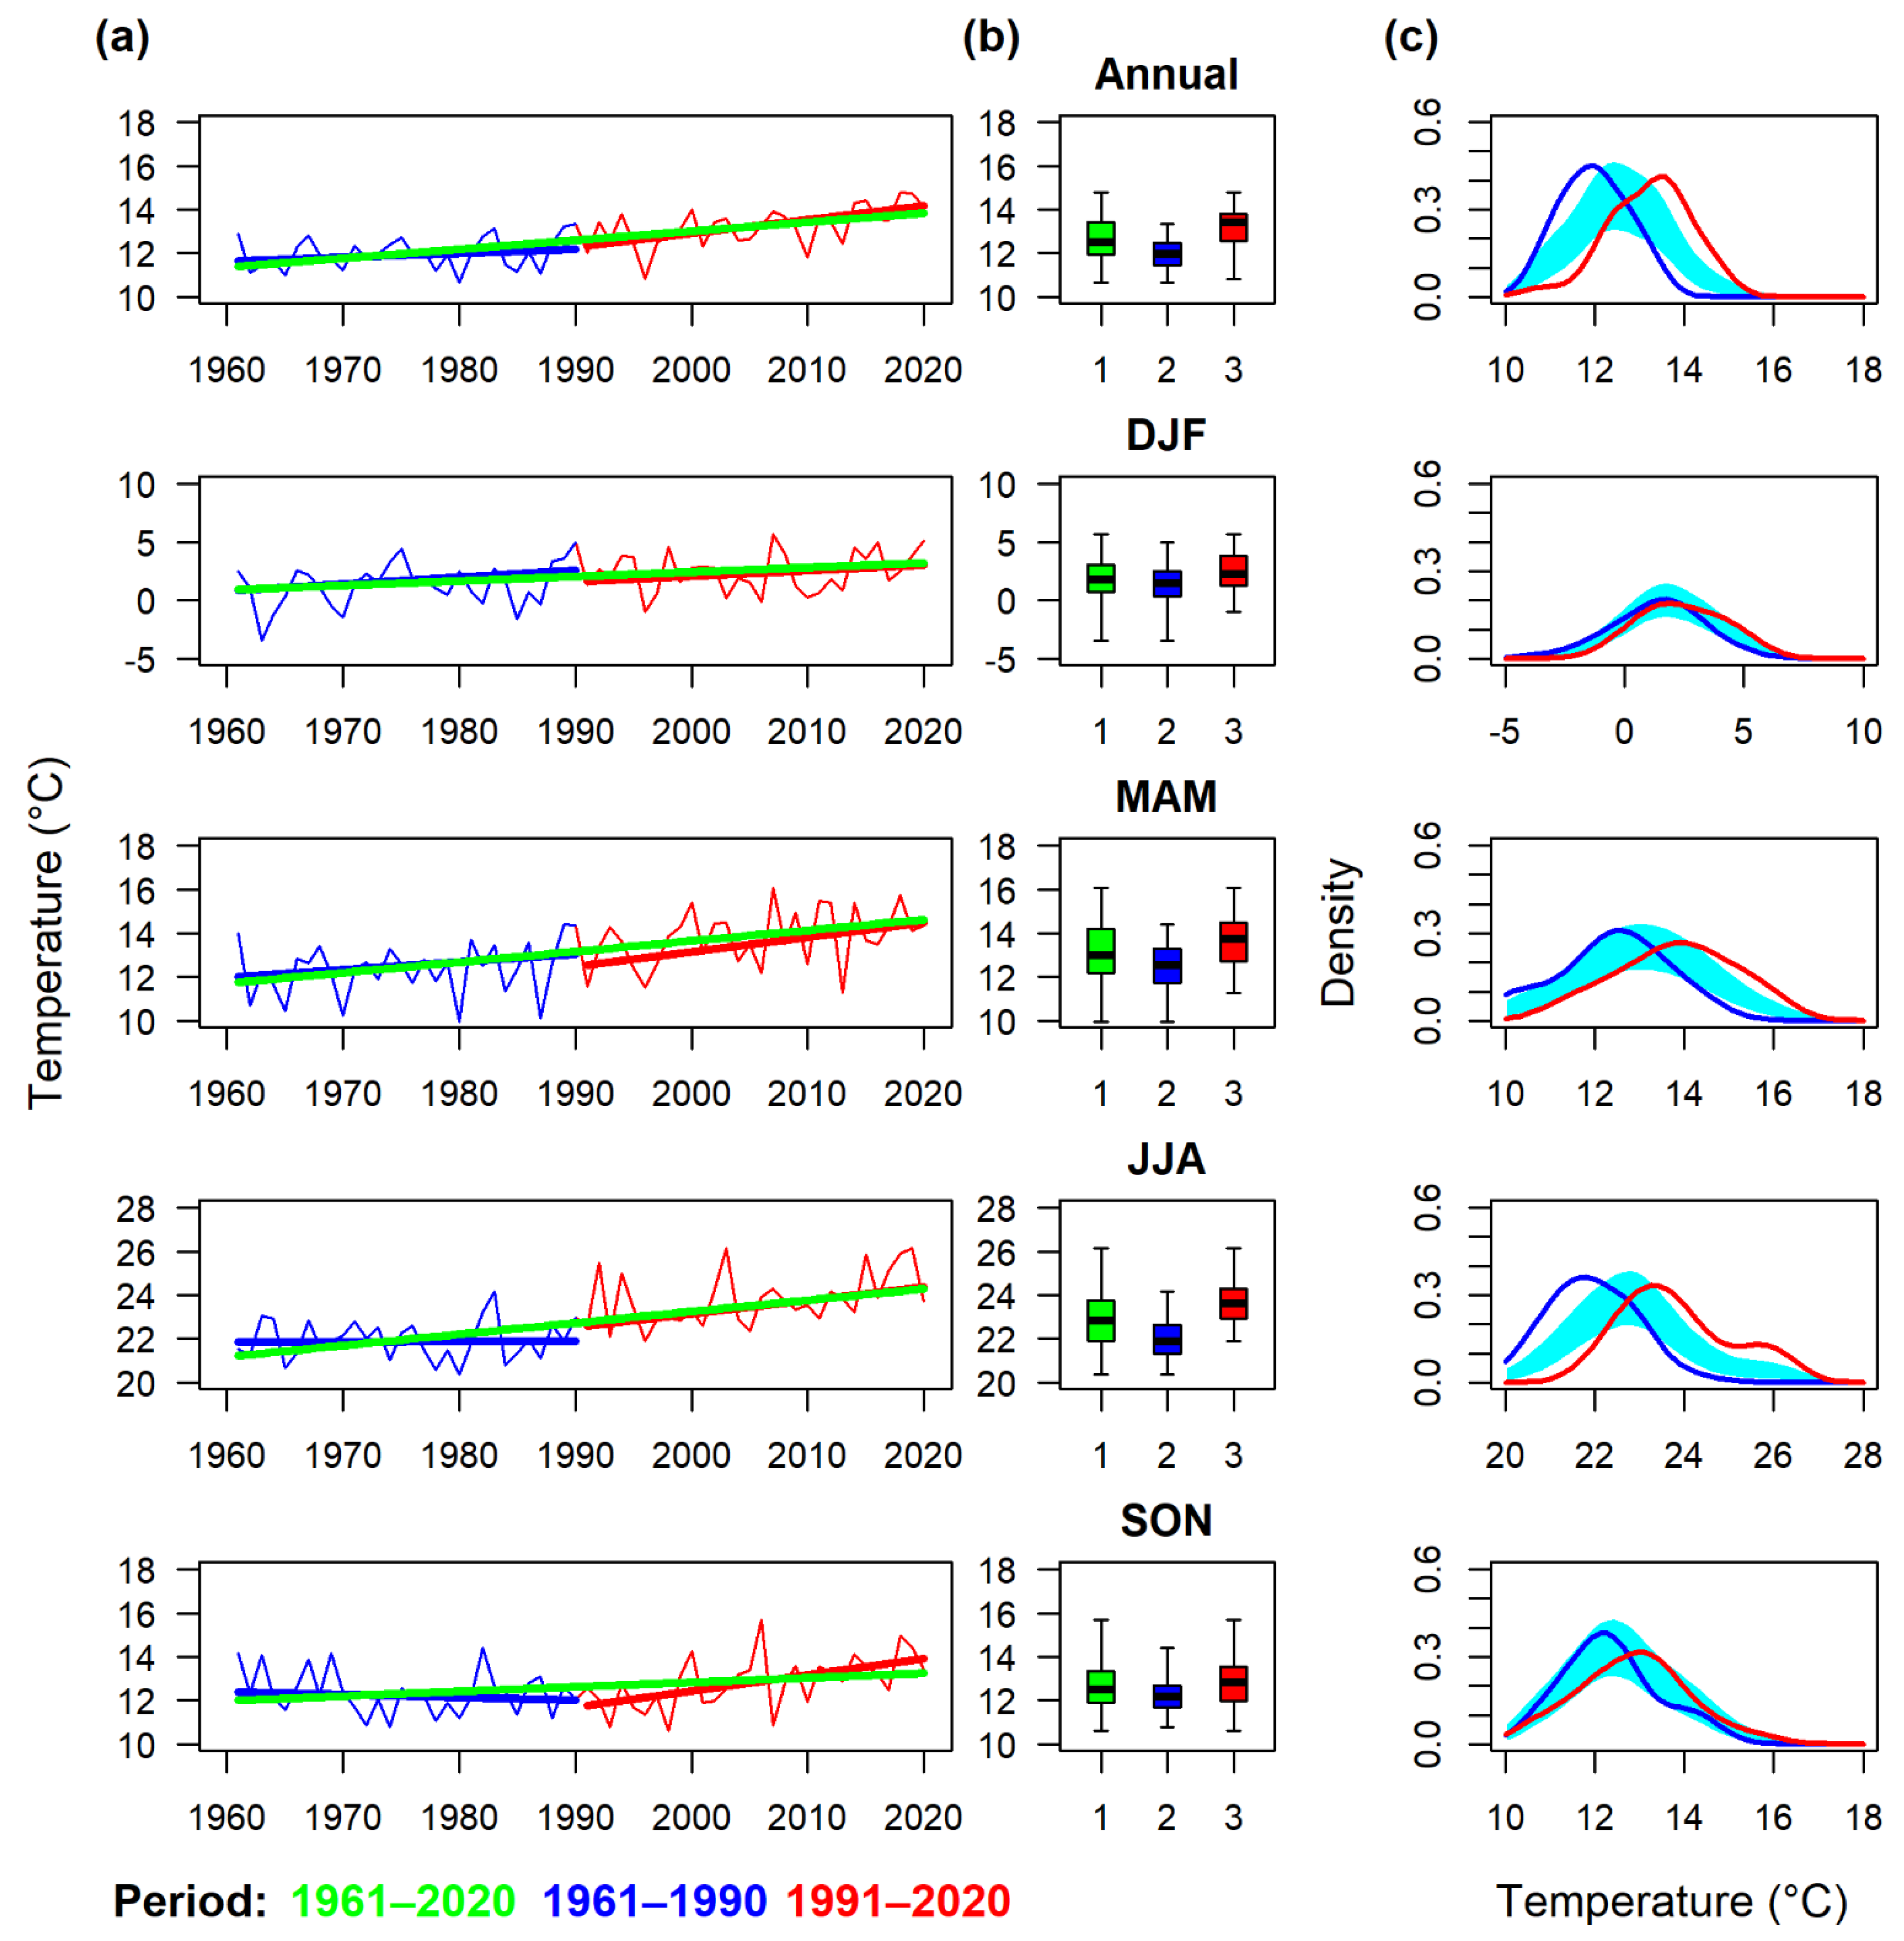
Figure 6.
Mean annual and seasonal temperature series for the territory of the Czech Republic in the 1961–2020 period: (a) fluctuations with linear trends in the entire period, 1961–1990 and 1991–2020; (b) box plots (median, lower and upper quartile, minimum, and maximum) for 1961–2020 (1), 1961–1990 (2), and 1991–2020 (3); (c) the density distribution of the series in 1961–1990 and 1991–2020. The density curves outside the reference band (green–blue) indicate a significant difference in the two distributions (and vice versa).
Figure 7.
Annual and seasonal mean maximum temperature series for the territory of the Czech Republic in the 1961–2020 period: (a) fluctuations with linear trends in the entire period, 1961–1990 and 1991–2020; (b) box plots (median, lower and upper quartile, minimum, and maximum) for 1961–2020 (1), 1961–1990 (2), and 1991–2020 (3); (c) the density distribution of the series in 1961–1990 and 1991–2020. The density curves outside the reference band (green–blue) indicate a significant difference in the two distributions (and vice versa).
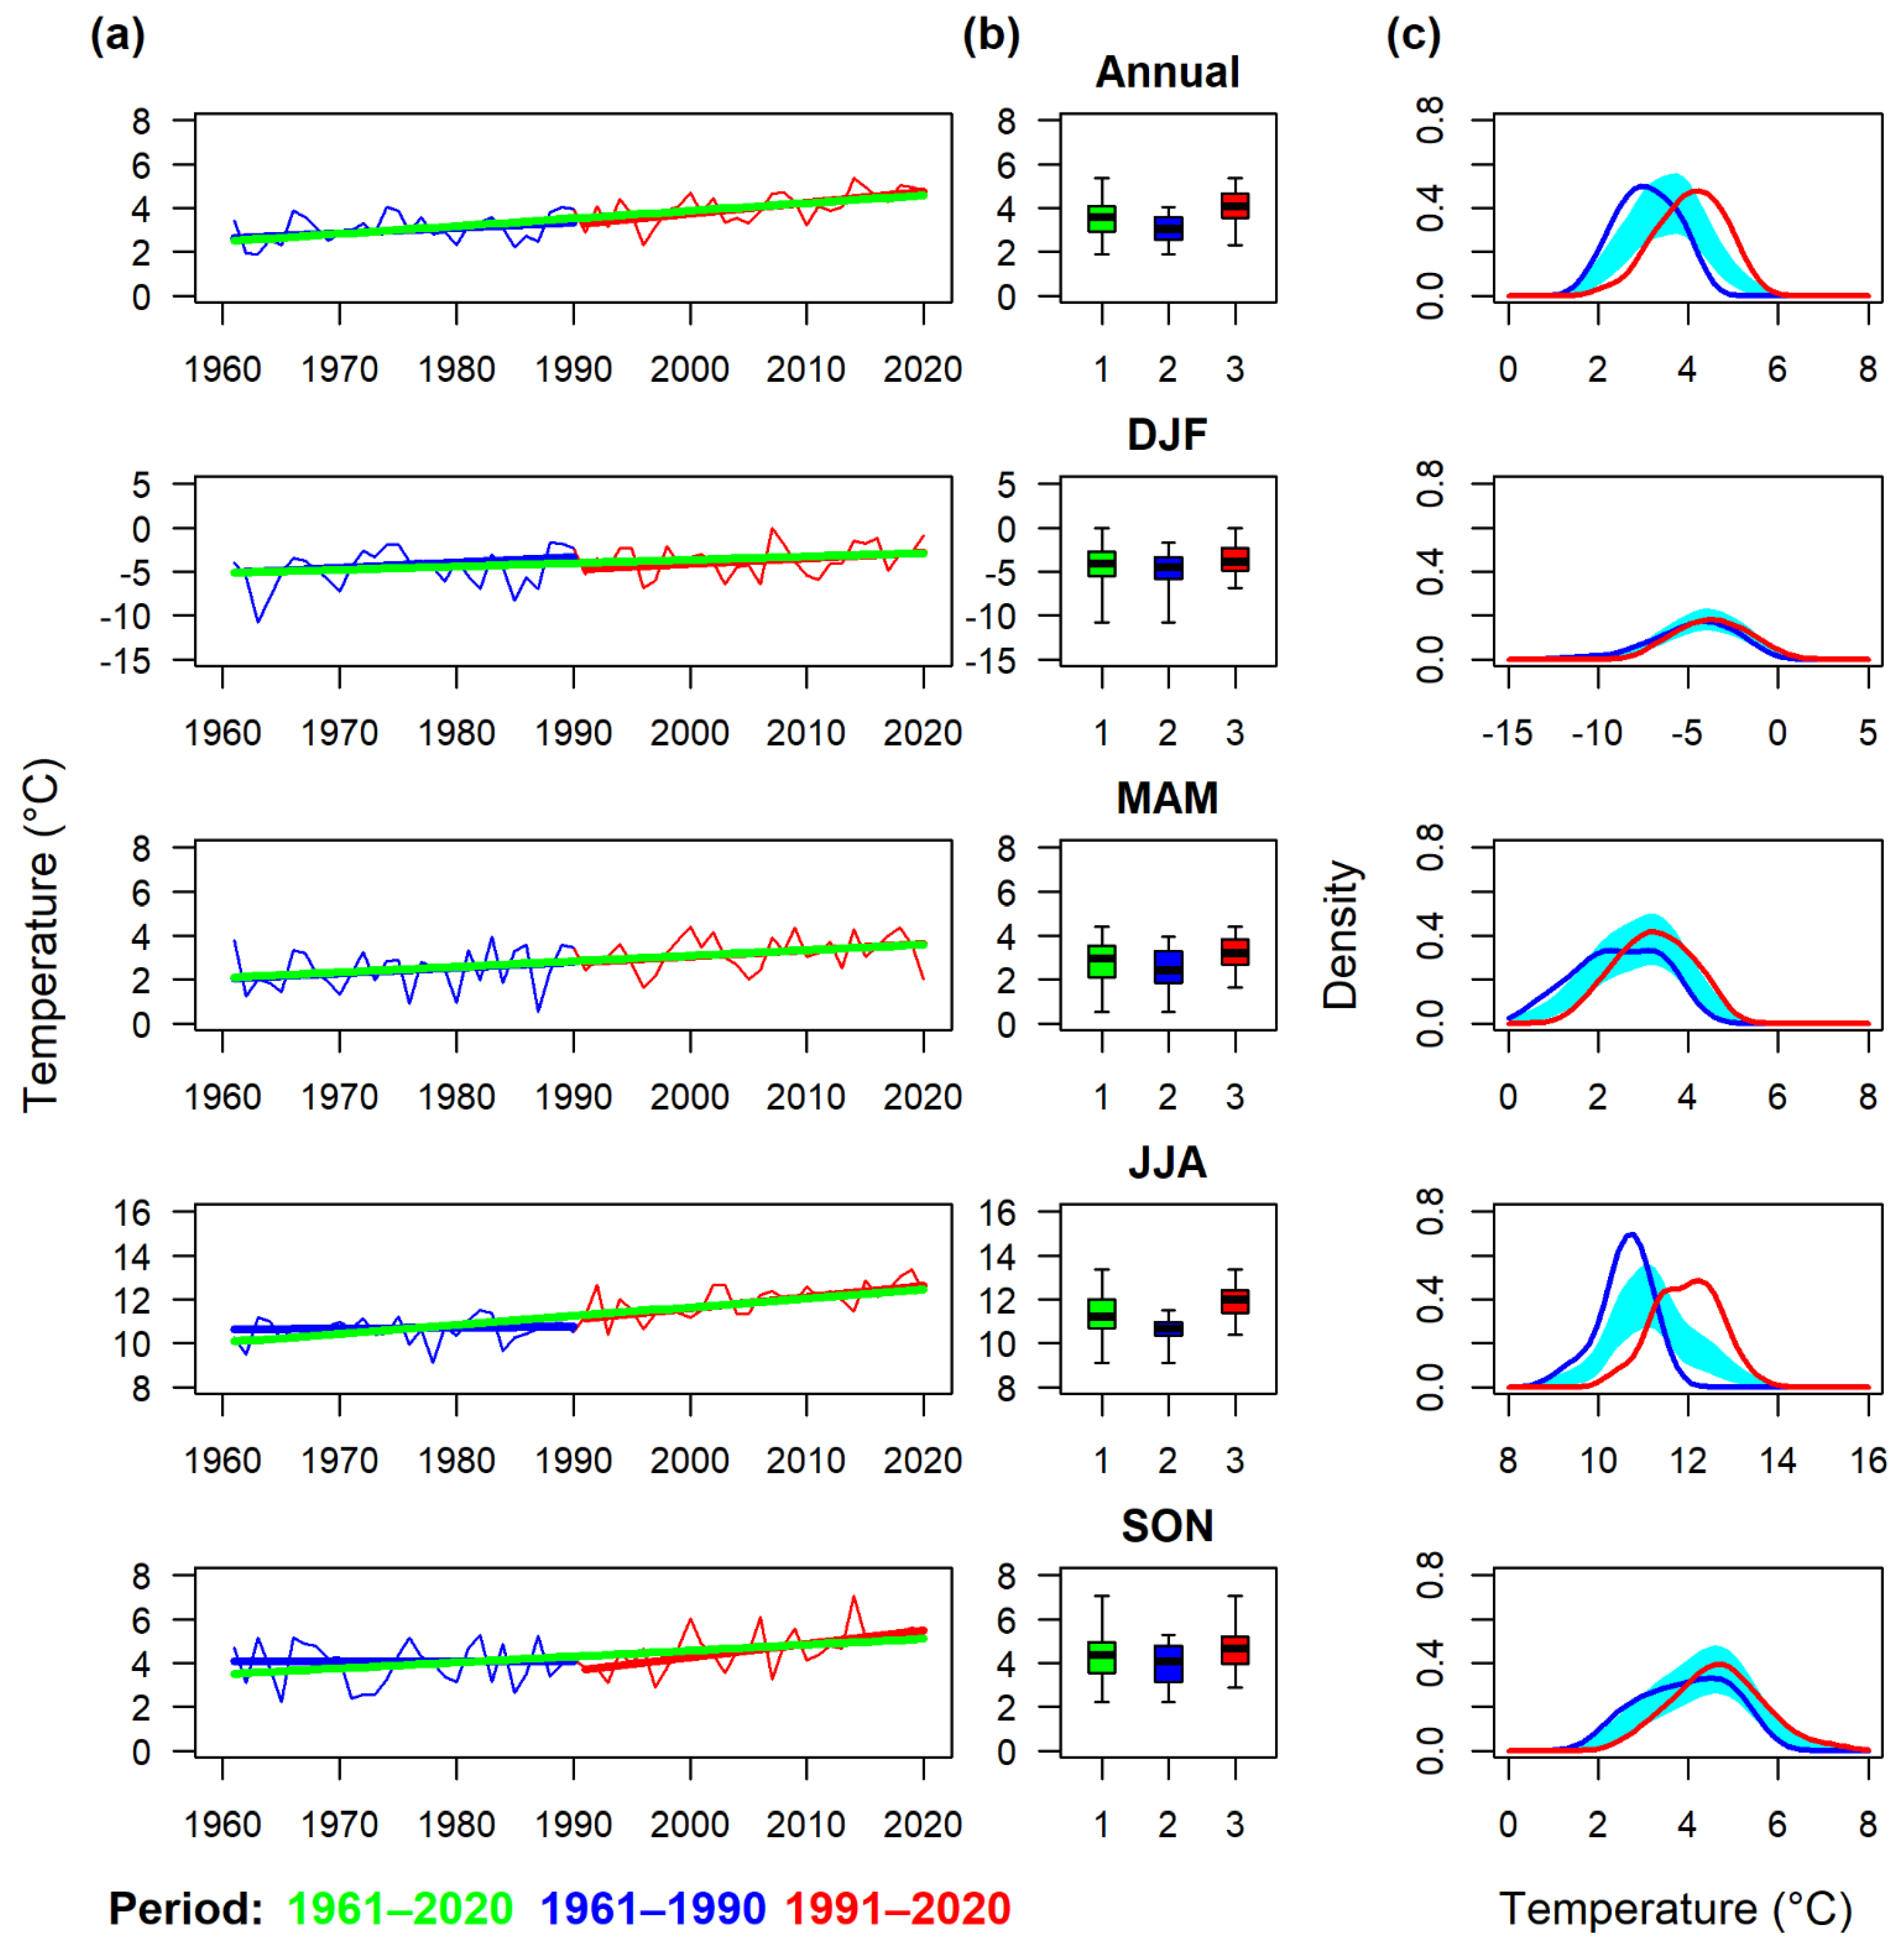
Figure 8.
Annual and seasonal mean minimum temperature series for the territory of the Czech Republic in the 1961–2020 period: (a) fluctuations with linear trends in the entire period, 1961–1990 and 1991–2020; (b) box plots (median, lower and upper quartile, minimum, and maximum) for 1961–2020 (1), 1961–1990 (2), and 1991–2020 (3); (c) the density distribution of the series in 1961–1990 and 1991–2020. The density curves outside the reference band (green–blue) indicate a significant difference in the two distributions (and vice versa).
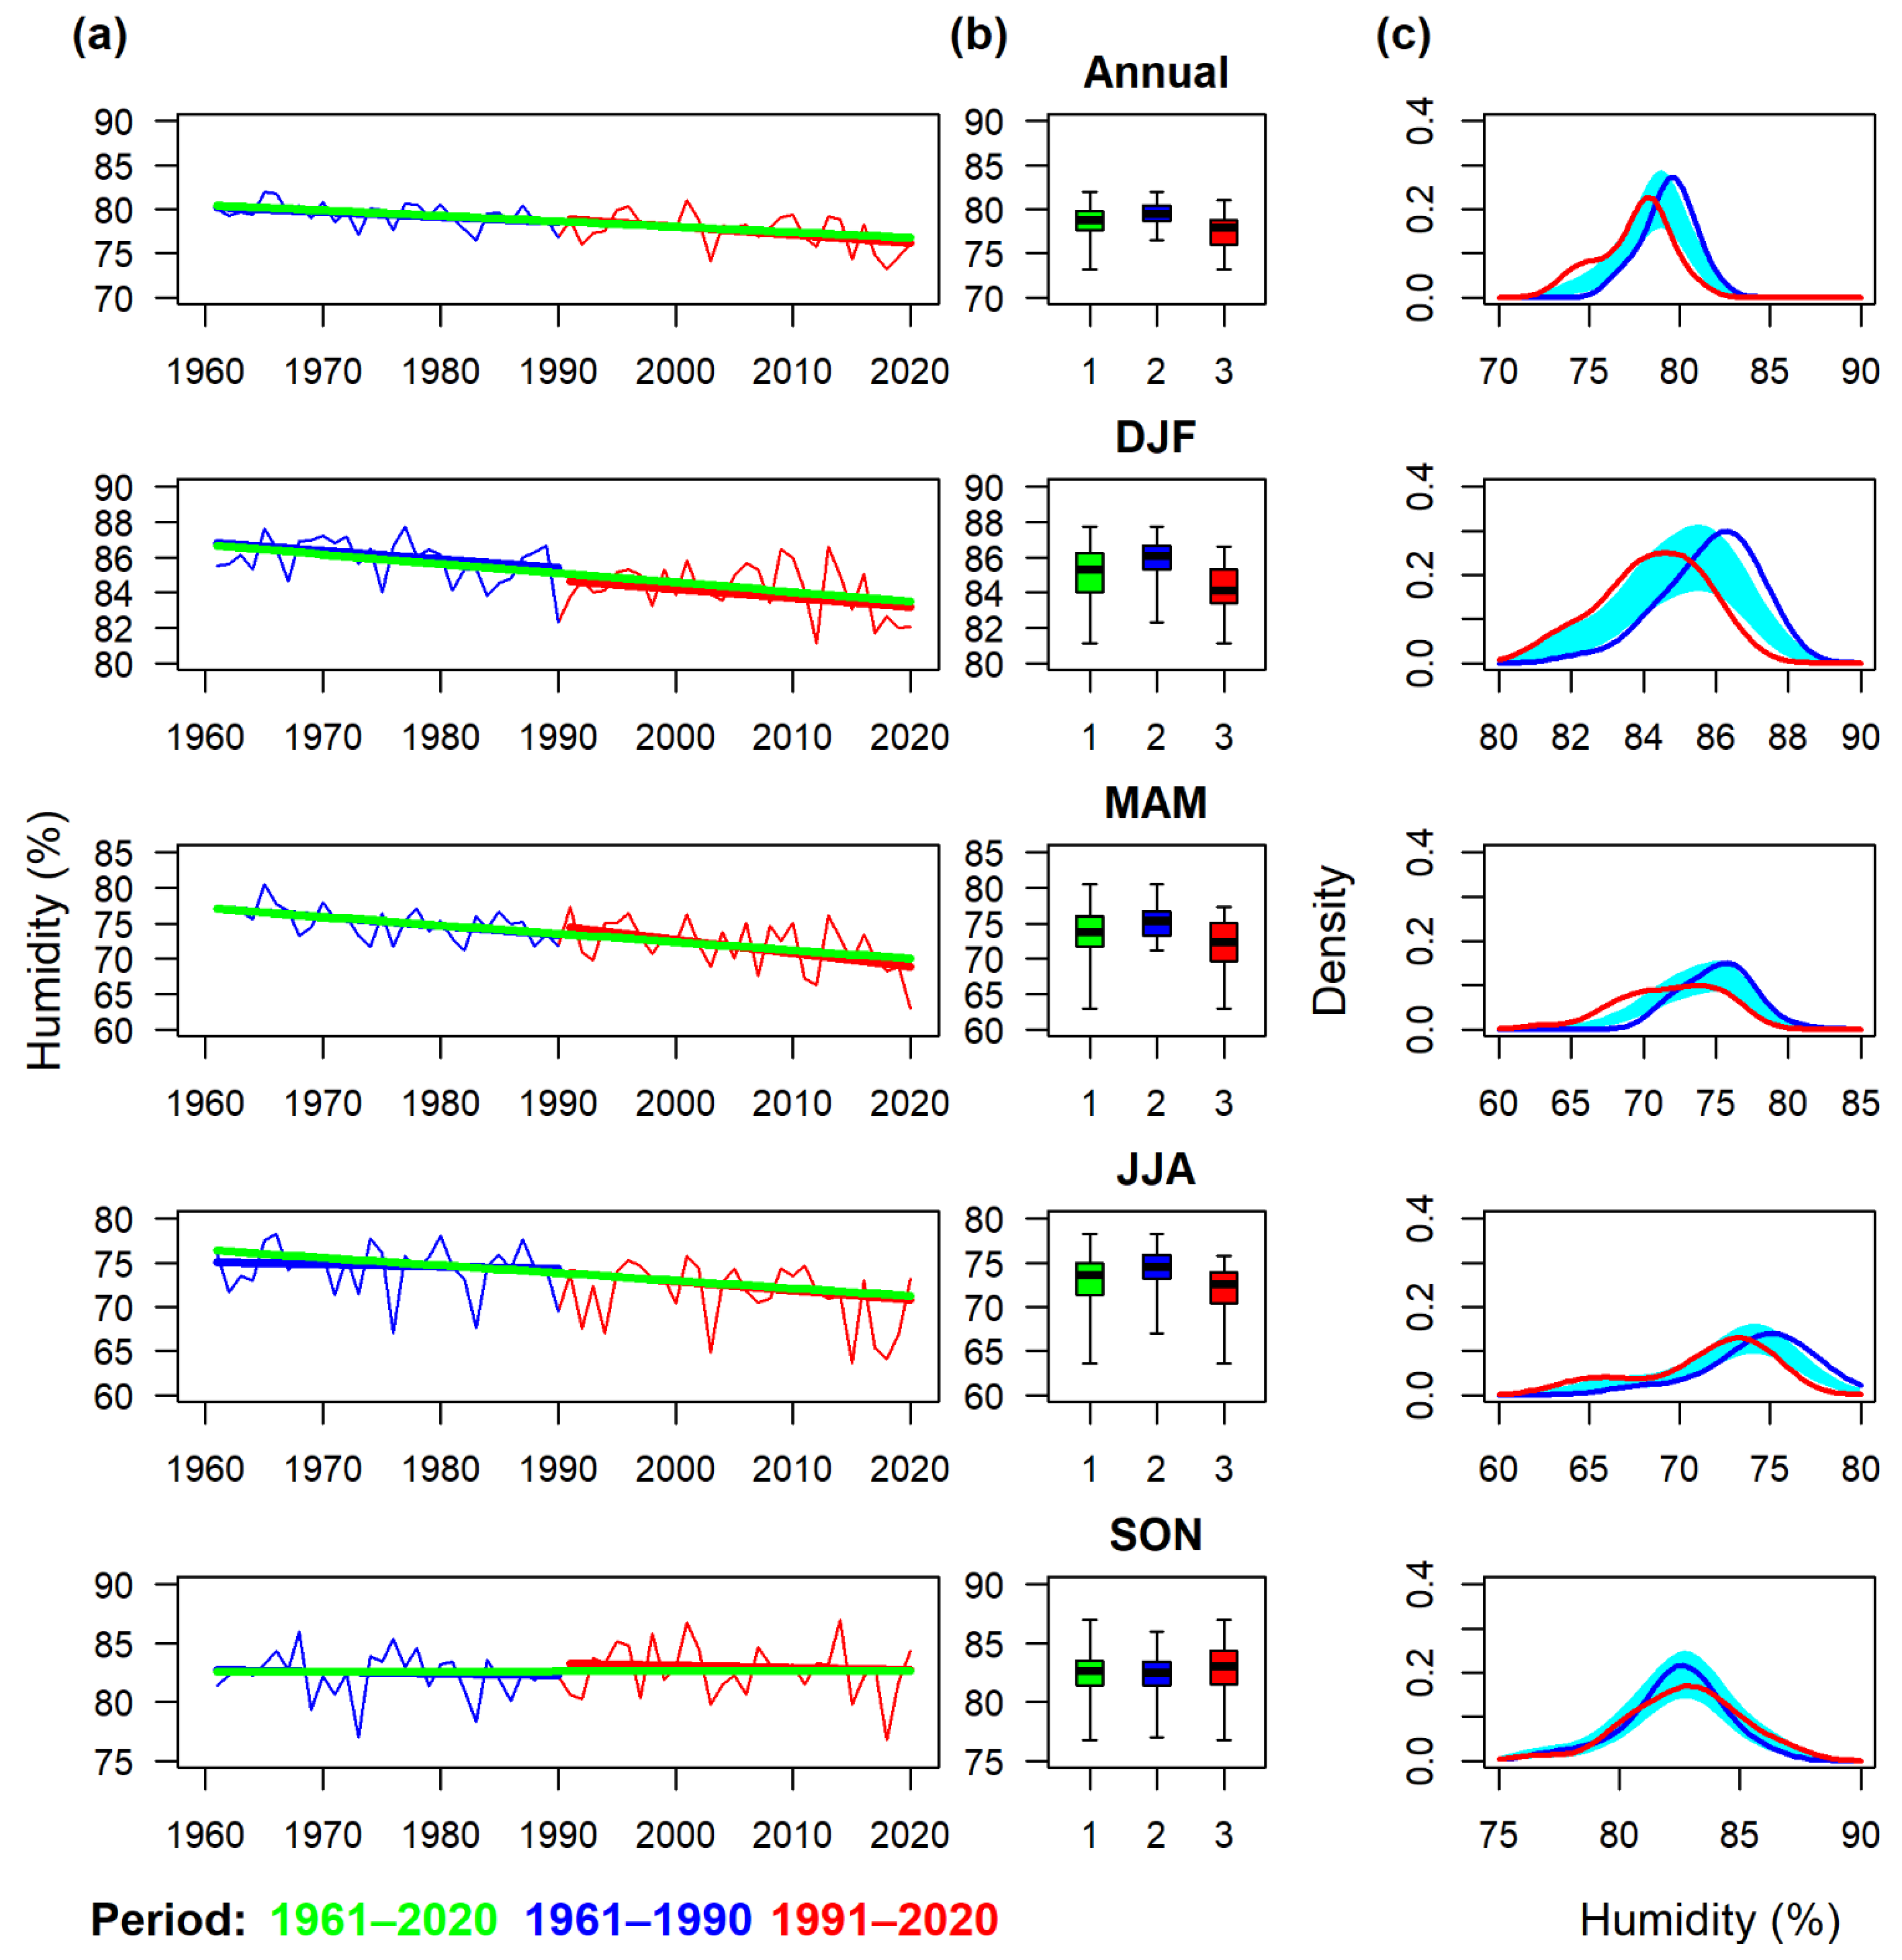
Figure 9.
Annual and seasonal mean relative humidity series for the territory of the Czech Republic in the 1961–2020 period: (a) fluctuations with linear trends in the entire period, 1961–1990 and 1991–2020; (b) box plots (median, lower and upper quartile, minimum, and maximum) for 1961–2020 (1), 1961–1990 (2), and 1991–2020 (3); (c) the density distribution of the series in 1961–1990 and 1991–2020. The density curves outside the reference band (green–blue) indicate a significant difference in the two distributions (and vice versa).
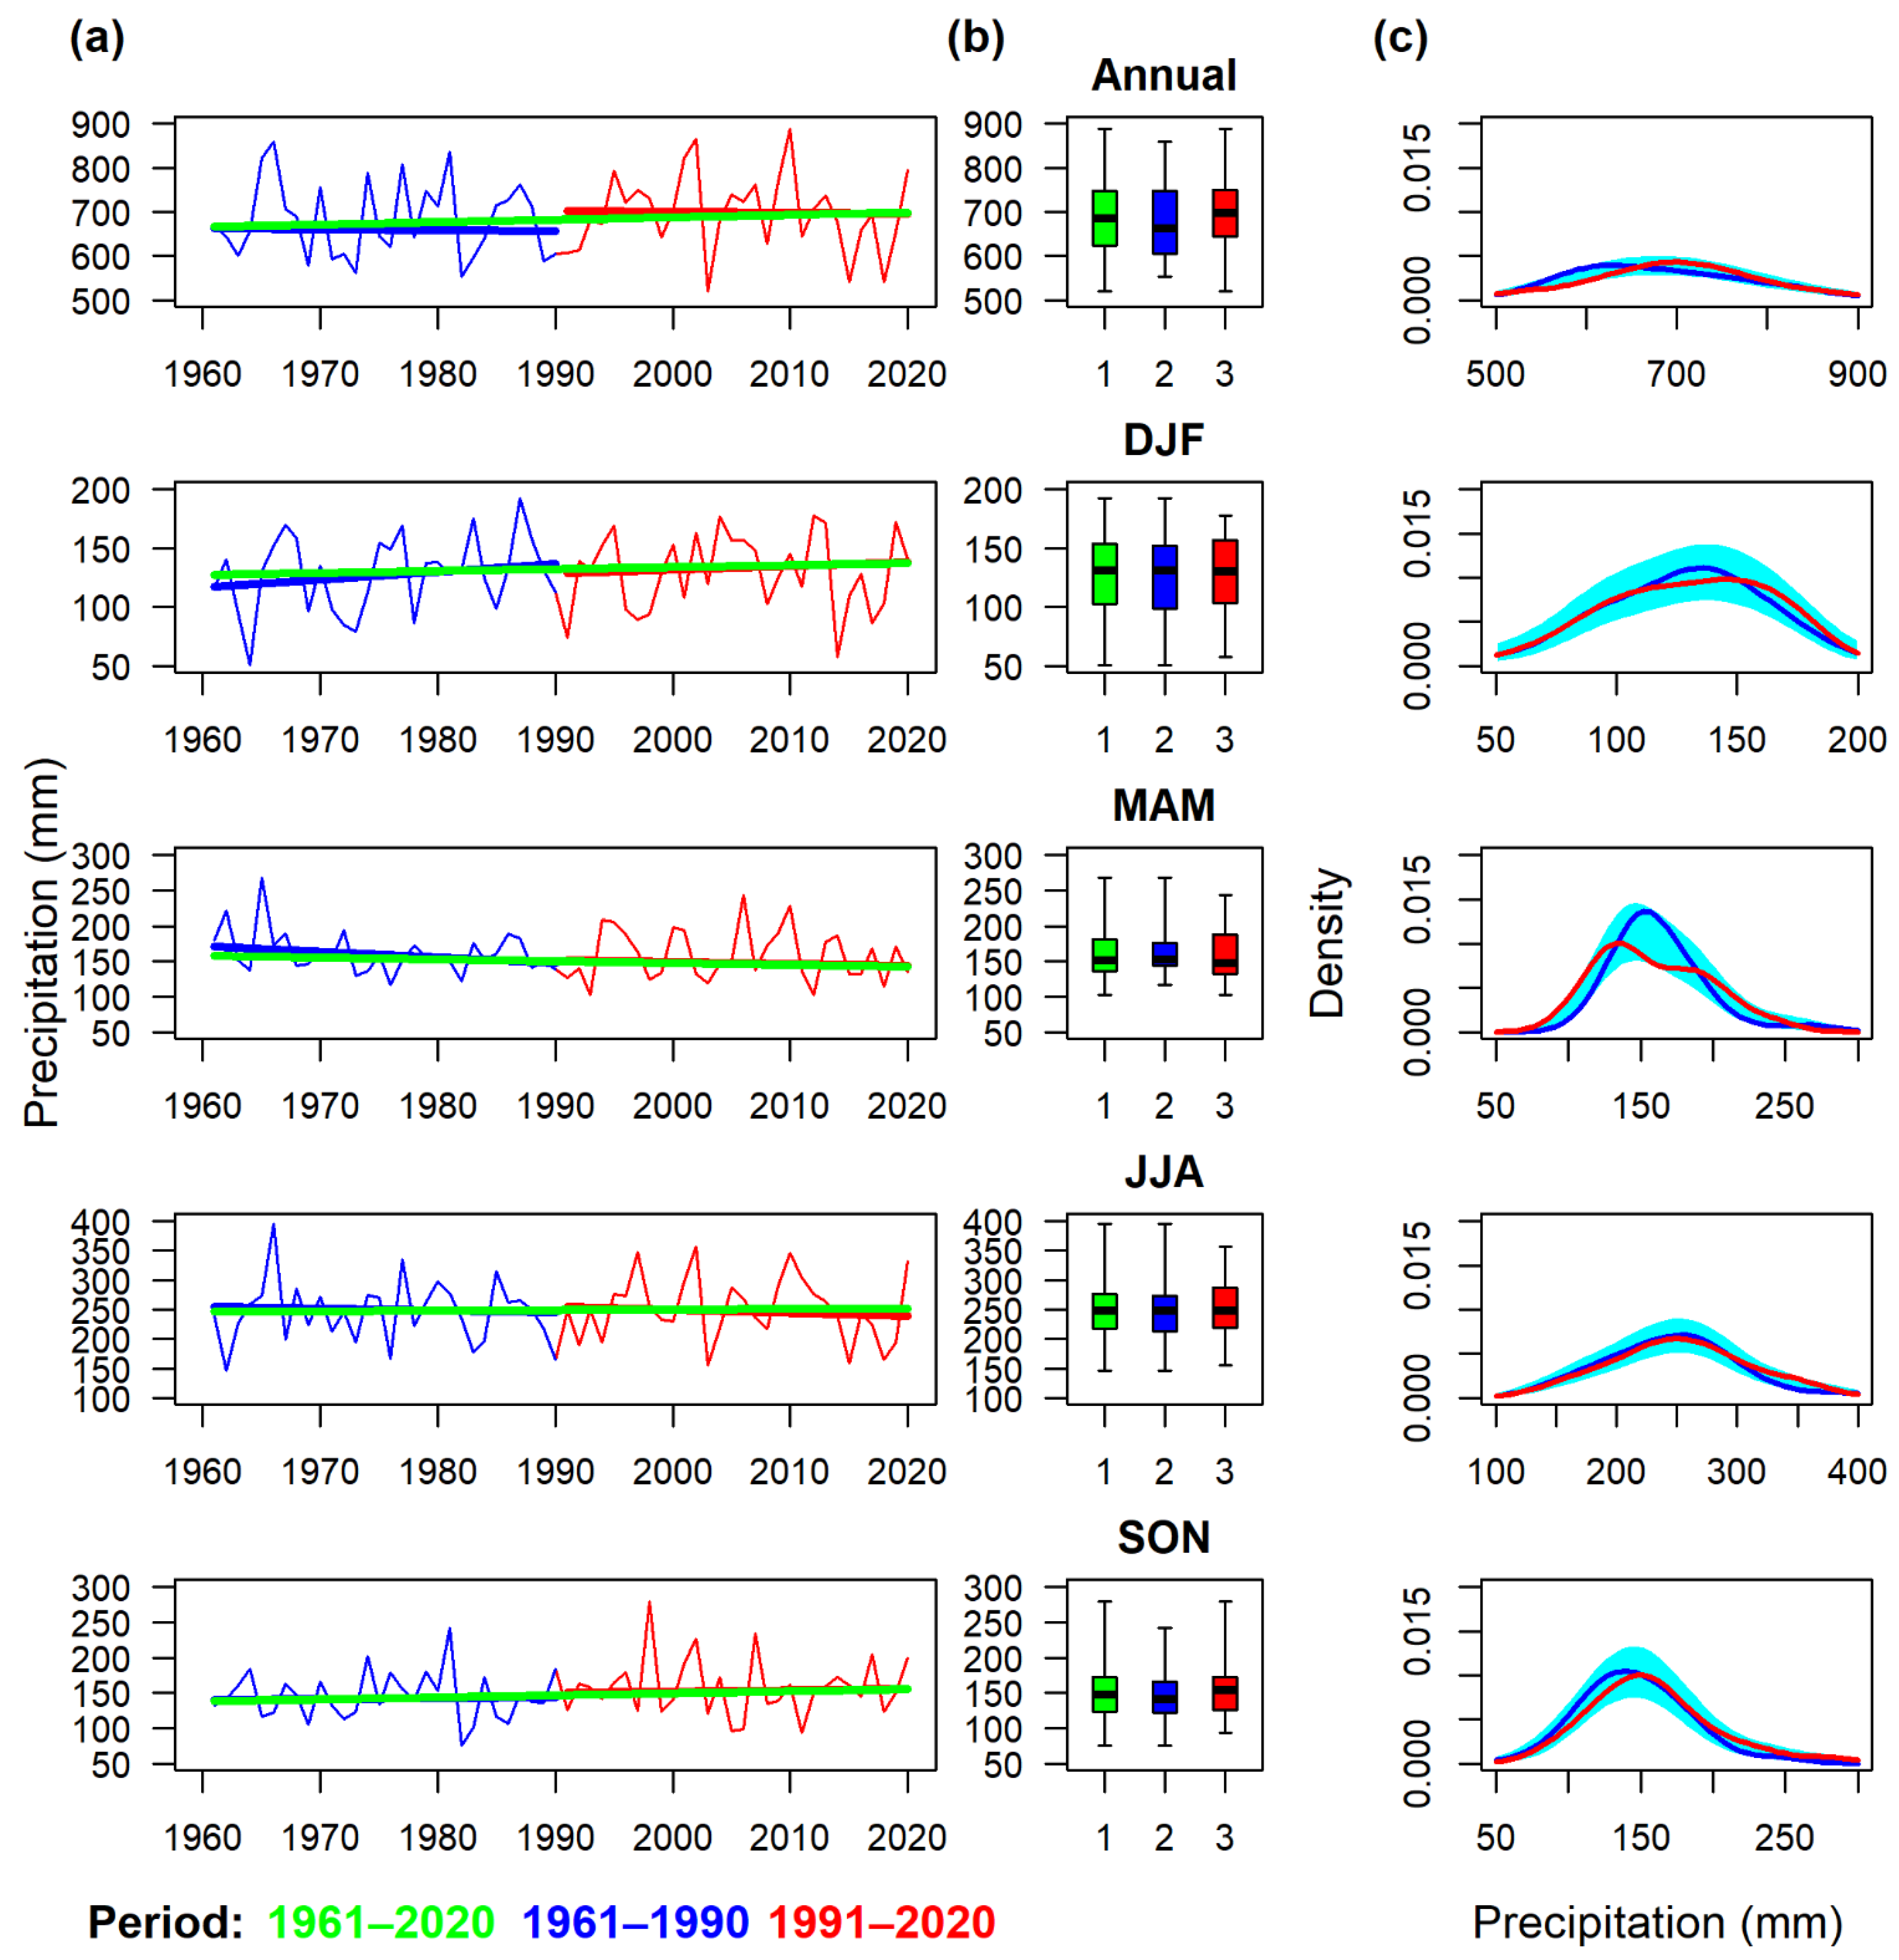
Figure 10.
Annual and seasonal series of mean precipitation totals for the territory of the Czech Republic in the 1961–2020 period: (a) fluctuations with linear trends in the entire period, 1961–1990 and 1991–2020; (b) box plots (median, lower and upper quartile, minimum, and maximum) for 1961–2020 (1), 1961–1990 (2), and 1991–2020 (3); (c) the density distribution of the series in 1961–1990 and 1991–2020. The density curves outside the reference band (green–blue) indicate a significant difference in the two distributions (and vice versa).
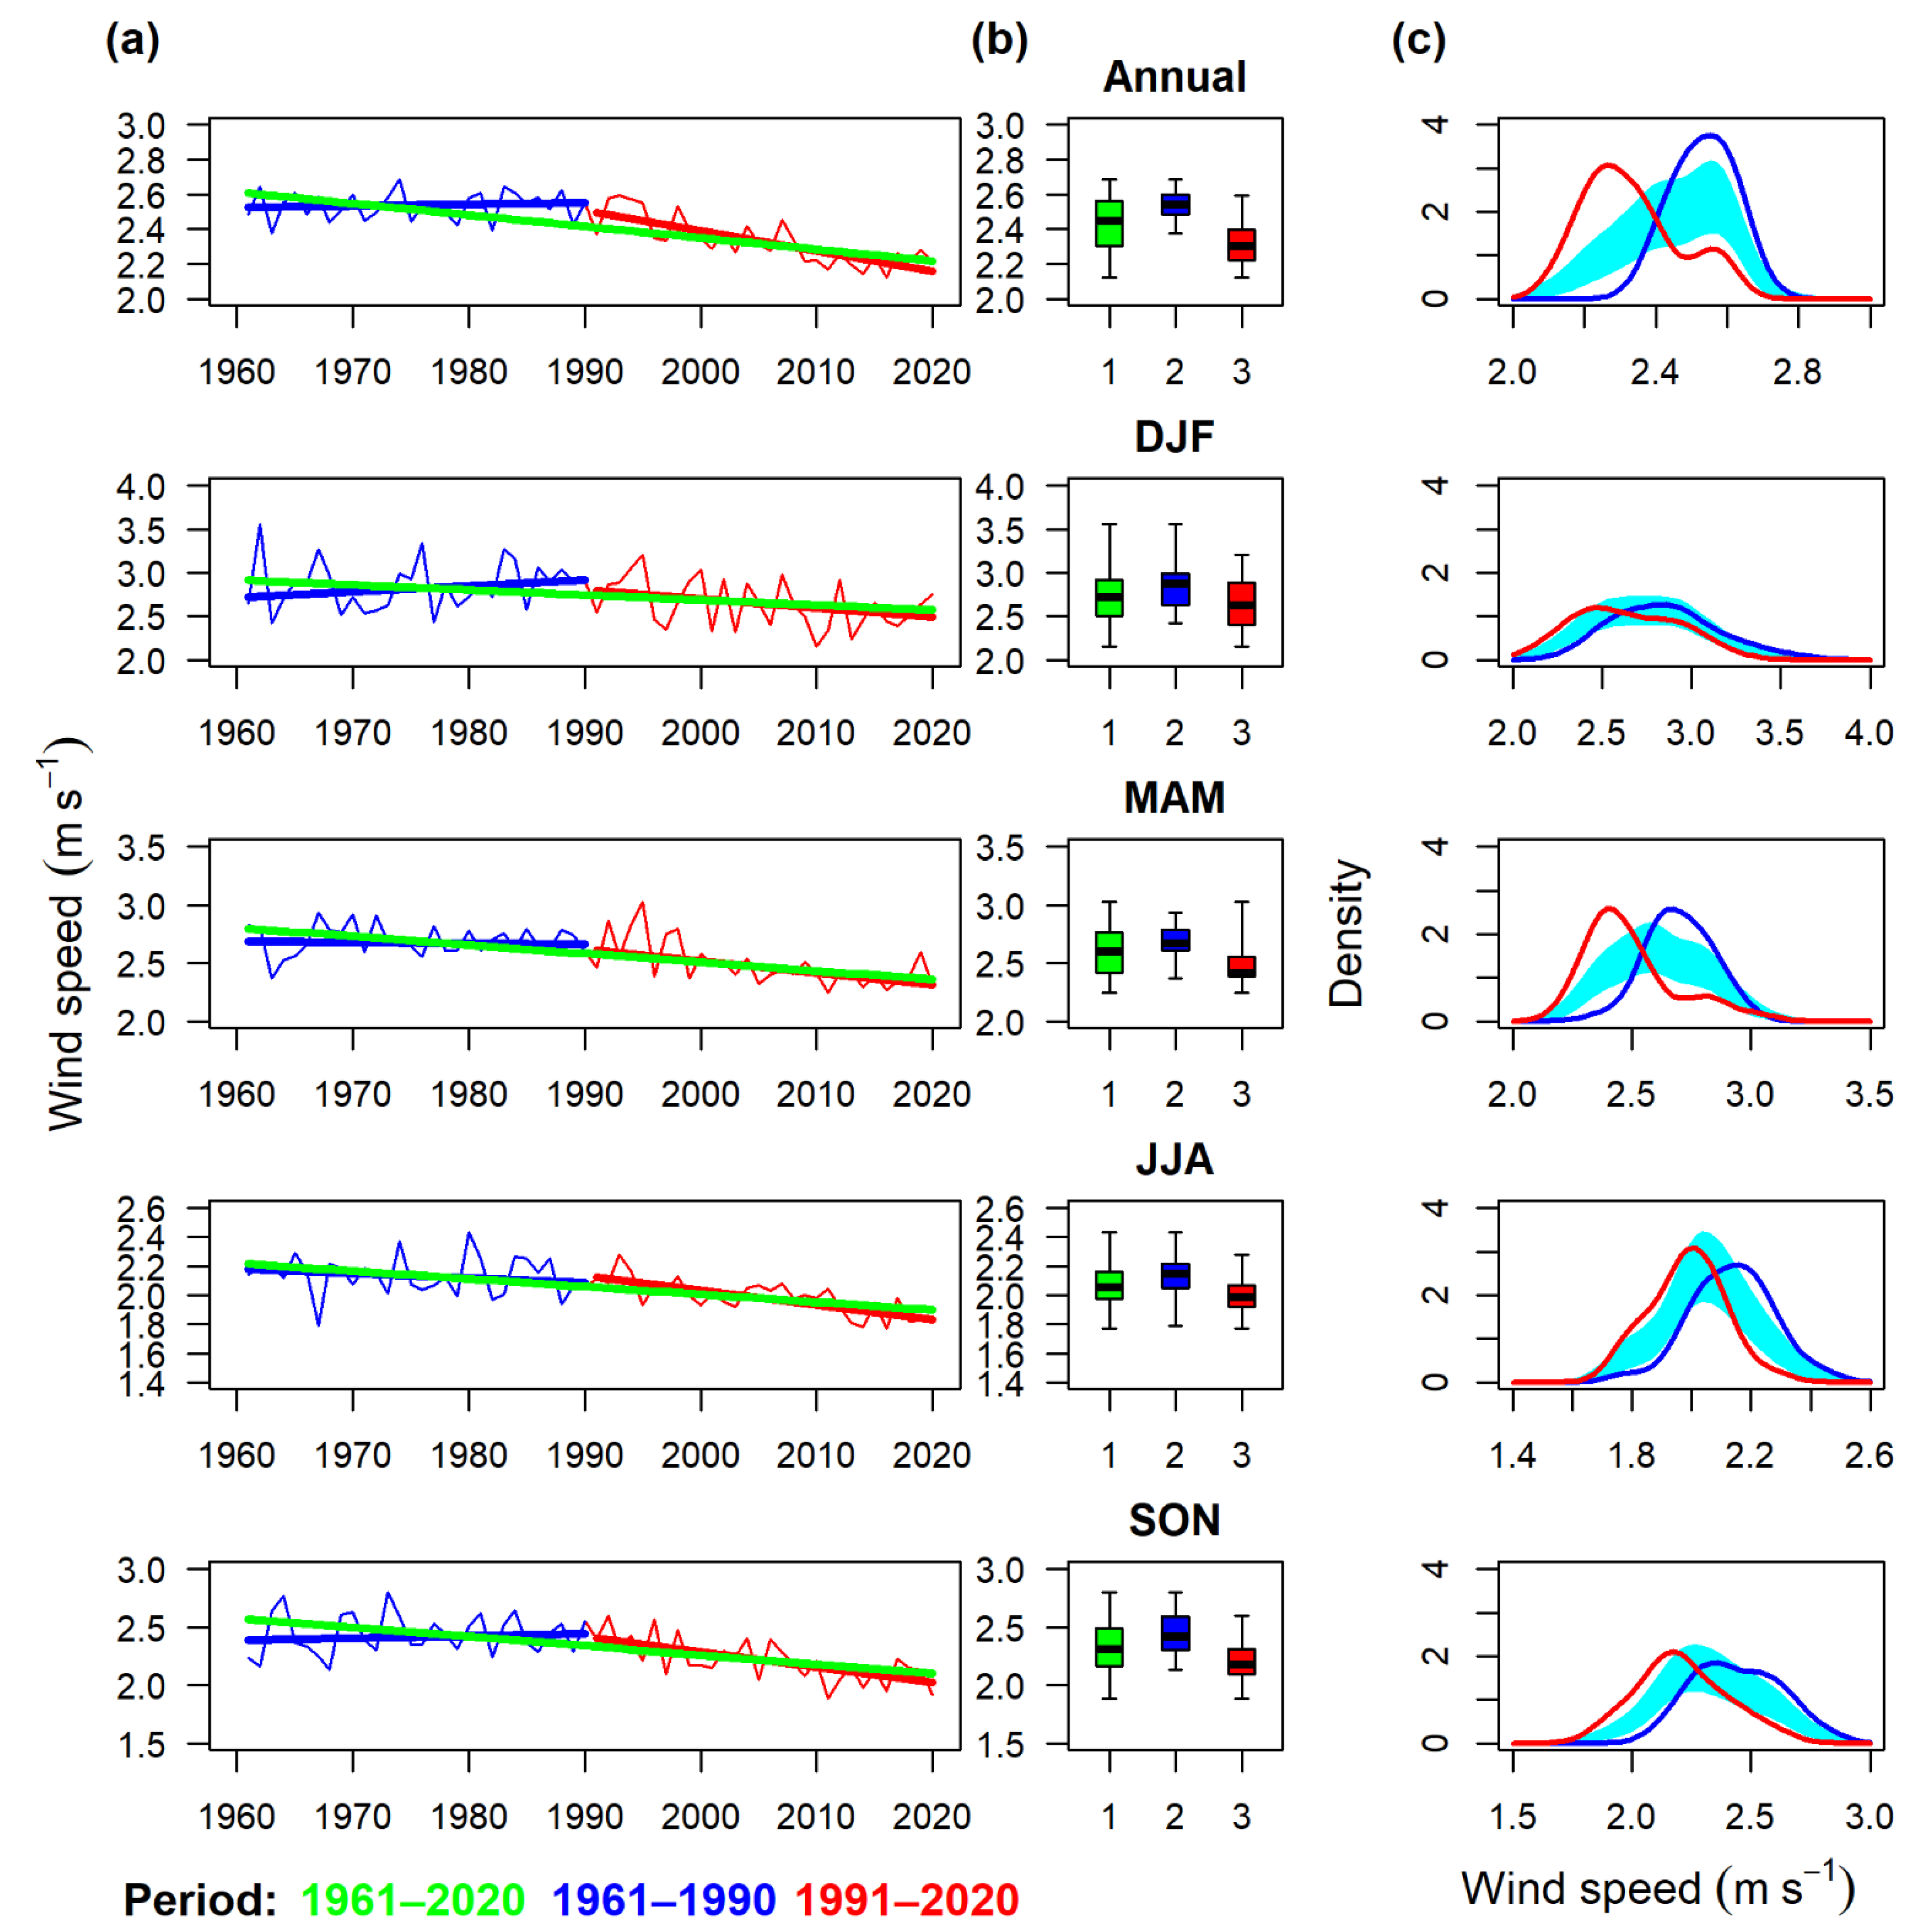
Figure 11.
Annual and seasonal series of mean wind speed for the territory of the Czech Republic in the 1961–2020 period: (a) fluctuations with linear trends in the entire period, 1961–1990 and 1991–2020; (b) box plots (median, lower and upper quartile, minimum, and maximum) for 1961–2020 (1), 1961–1990 (2) and 1991–2020 (3); (c) the density distribution of the series in 1961–1990 and 1991–2020. The density curves outside the reference band (green–blue) indicate a significant difference in the two distributions (and vice versa).
Figure 12.
Spatial distribution of differences between the 1991–2020 and 1961–1990 periods over the territory of the Czech Republic for the annual series of selected climate variables: (
a) sunshine duration, (
b) mean temperature, (
c) maximum temperature, (
d) minimum temperature, (
e) relative humidity, (
f) precipitation total, and (
g) wind speed. The individual maps were created based on the number of stations specified in
Section 2.2.
Table 1.
Selected statistical characteristics of annual (Ann) and seasonal (DJF, MAM, JJA, and SON) frequencies of days with anticyclonic, cyclonic, and directional circulation types according to the objective classification for the territory of the Czech Republic during the 1961–1990 (A) and 1991–2020 (B) periods: means are in days, variation coefficients (CV) in %, and linear trends in days/10 years (in bold statistically significant at the 0.05 significance level). An asterisk * indicates statistically significant differences of a given characteristic between two 30-year periods.
| Season | Period | Mean | | CV | Skewness | | Kurtosis | | Slope |
|---|
| Anticyclonic circulation types |
| Ann | A | 149.4 | * | 15.5 | −0.18 | | −0.57 | | 14.2 |
| | B | 167.4 | * | 13.5 | −0.09 | | −0.40 | | 2.5 |
| DJF | A | 38.2 | * | 28.2 | 0.80 | | 0.11 | | 1.2 |
| | B | 44.2 | * | 24.1 | −0.11 | | −0.17 | | −2.1 |
| MAM | A | 26.9 | * | 28.4 | 0.46 | | 0.55 | | 0.9 |
| | B | 33.7 | * | 25.6 | 0.76 | | 0.02 | | 0.9 |
| JJA | A | 40.6 | * | 22.9 | −0.34 | | −0.36 | | 6.8 |
| | B | 47.8 | * | 17.0 | −0.10 | | −1.12 | | 1.2 |
| SON | A | 43.8 | | 27.2 | −0.18 | | −0.77 | | 5.0 |
| | B | 41.8 | | 24.7 | 0.23 | | −0.03 | | 0.9 |
| Cyclonic circulation types |
| Ann | A | 67.6 | * | 28.1 | 0.66 | | 0.42 | | −14.4 |
| | B | 55.7 | * | 20.5 | 0.28 | | 0.94 | | 0.0 |
| DJF | A | 12.9 | | 46.9 | 0.12 | * | −0.54 | * | −1.4 |
| | B | 10.5 | | 52.2 | 1.92 | * | 6.00 | * | 0.8 |
| MAM | A | 25.9 | * | 28.4 | 0.32 | | 0.02 | | −3.3 |
| | B | 19.5 | * | 30.3 | −0.10 | | −0.06 | | −1.2 |
| JJA | A | 16.1 | * | 47.7 | 0.51 | | −0.15 | | −5.4 |
| | B | 12.0 | * | 45.5 | 1.10 | | 0.74 | | 0.5 |
| SON | A | 12.6 | | 52.4 | 0.46 | | −0.59 | | −3.8 |
| | B | 13.7 | | 43.2 | 0.55 | | −0.46 | | 0.0 |
| Directional circulation types |
| Ann | A | 142.1 | | 7.7 | 0.69 | | −0.14 | | 0.0 |
| | B | 136.1 | | 10.6 | −0.14 | | 0.12 | | −3.3 |
| DJF | A | 38.5 | | 18.5 | −0.36 | | 0.37 | | −0.5 |
| | B | 35.2 | | 23.0 | 0.27 | | 0.01 | | 0.6 |
| MAM | A | 37.8 | | 14.9 | −0.42 | | 0.23 | | 2.4 |
| | B | 37.3 | | 14.4 | −0.42 | | −0.16 | | −0.5 |
| JJA | A | 32.2 | * | 14.7 | 0.10 | | 1.00 | | 0.0 |
| | B | 28.8 | * | 19.9 | −0.36 | | −0.38 | | −1.1 |
| SON | A | 33.6 | | 22.0 | 0.22 | | −0.67 | | −0.5 |
| | B | 34.8 | | 20.0 | −0.27 | | 0.46 | | −3.2 |
Table 2.
Selected statistical characteristics of mean annual (Ann) and seasonal (DJF, MAM, JJA, and SON) sunshine duration series in the Czech Republic during the 1961–1990 (A) and 1991–2020 (B) periods: means are in hours, coefficients of variation (CV) in %, linear trends in hours/10 years (none statistically significant at the 0.05 significance level). An asterisk * indicates statistically significant differences of a given characteristic between two 30-year periods.
| Season | Period | Mean | | CV | Skewness | | Kurtosis | Slope |
|---|
| Ann | A | 1613.9 | * | 7.3 | −0.14 | | −1.33 | −15.4 |
| | B | 1687.1 | * | 7.6 | 0.50 | | 0.22 | 15.3 |
| DJF | A | 164.4 | | 19.2 | 0.47 | * | −0.34 | 1.5 |
| | B | 168.7 | | 16.4 | −0.84 | * | 0.94 | −8.5 |
| MAM | A | 482.5 | * | 10.8 | 0.28 | | −0.20 | 11.6 |
| | B | 524.9 | * | 14.8 | 0.01 | | −0.10 | 13.6 |
| JJA | A | 624.8 | * | 9.3 | −0.04 | | −0.81 | −11.9 |
| | B | 677.8 | * | 7.8 | 1.18 | | 1.40 | –2.2 |
| SON | A | 335.7 | | 13.9 | −0.26 | | −0.98 | −15.8 |
| | B | 315.9 | | 18.8 | 0.29 | | −0.52 | 5.8 |
Table 3.
Selected statistical characteristics of mean annual (Ann) and seasonal (DJF, MAM, JJA, and SON) temperature series in the Czech Republic in the 1961–1990 (A) and 1991–2020 (B) periods: means and standard deviations (SD) are in °C, linear trends in °C/10 years (in bold statistically significant at the 0.05 significance level). An asterisk * indicates statistically significant differences of a given characteristic between two 30-year periods.
| Season | Period | Mean | | SD | Skewness | Kurtosis | | Slope | |
|---|
| Ann | A | 7.4 | * | 0.6 | 0.01 | −1.08 | * | 0.25 | |
| | B | 8.5 | * | 0.8 | −0.48 | 0.23 | * | 0.56 | |
| DJF | A | −1.7 | * | 2.0 | −0.66 | 0.45 | | 0.59 | |
| | B | −0.7 | * | 1.7 | 0.05 | −0.67 | | 0.53 | |
| MAM | A | 7.3 | * | 1.0 | −0.34 | −0.68 | | 0.34 | |
| | B | 8.4 | * | 1.0 | −0.18 | −0.71 | | 0.44 | |
| JJA | A | 16.2 | * | 0.7 | 0.02 | 0.26 | | 0.02 | |
| | B | 17.7 | * | 1.0 | 0.41 | −0.66 | | 0.53 | |
| SON | A | 7.8 | * | 0.9 | 0.09 | −0.96 | | −0.14 | * |
| | B | 8.4 | * | 1.0 | 0.18 | −0.30 | | 0.62 | * |
Table 4.
Selected statistical characteristics of annual (Ann) and seasonal (DJF, MAM, JJA, and SON) mean maximum temperature series in the Czech Republic in the 1961–1990 (A) and 1991–2020 (B) periods: means and standard deviations (SD) are in °C, linear trends in °C/10 years (in bold statistically significant at the 0.05 significance level). An asterisk * indicates statistically significant differences of a given characteristic between two 30-year periods.
| Season | Period | Mean | | SD | Skewness | Kurtosis | Slope | |
|---|
| Ann | A | 12.0 | * | 0.7 | 0.14 | −0.80 | 0.20 | |
| | B | 13.2 | * | 0.9 | −0.46 | 0.43 | 0.63 | |
| DJF | A | 1.3 | * | 1.9 | −0.34 | 0.29 | 0.58 | |
| | B | 2.4 | * | 1.7 | 0.08 | −0.78 | 0.50 | |
| MAM | A | 12.4 | * | 1.2 | −0.37 | −0.38 | 0.36 | |
| | B | 13.8 | * | 1.3 | −0.20 | −0.65 | 0.67 | |
| JJA | A | 21.9 | * | 0.9 | 0.32 | −0.19 | 0.02 | |
| | B | 23.8 | * | 1.2 | 0.59 | −0.54 | 0.62 | |
| SON | A | 12.4 | | 1.0 | 0.54 | −0.22 | –0.14 | * |
| | B | 12.8 | | 1.2 | 0.16 | 0.03 | 0.74 | * |
Table 5.
Selected statistical characteristics of annual (Ann) and seasonal (DJF, MAM, JJA, and SON) mean minimum temperature series in the Czech Republic in the 1961–1990 (A) and 1991–2020 (B) periods: means and standard deviations (SD) are in °C, linear trends in °C/10 years (in bold statistically significant at the 0.05 significance level). An asterisk * indicates statistically significant differences of a given characteristic between two 30-year periods.
| Season | Period | Mean | | SD | Skewness | Kurtosis | Slope | |
|---|
| Ann | A | 3.1 | * | 0.6 | −0.10 | −0.91 | 0.24 | |
| | B | 4.0 | * | 0.7 | −0.37 | −0.22 | 0.51 | |
| DJF | A | −4.7 | | 2.2 | −0.73 | 0.49 | 0.59 | |
| | B | −3.7 | | 1.8 | 0.05 | −0.71 | 0.64 | |
| MAM | A | 2.4 | * | 0.9 | −0.28 | −0.85 | 0.24 | |
| | B | 3.2 | * | 0.8 | −0.15 | −0.80 | 0.29 | |
| JJA | A | 10.6 | * | 0.6 | −0.88 | 0.95 | 0.05 | * |
| | B | 12.0 | * | 0.7 | −0.17 | −0.27 | 0.51 | * |
| SON | A | 3.9 | * | 1.0 | −0.24 | −1.15 | 0.00 | * |
| | B | 4.6 | * | 0.9 | 0.28 | 0.30 | 0.62 | * |
Table 6.
Selected statistical characteristics of annual (Ann) and seasonal (DJF, MAM, JJA, and SON) mean relative humidity series in the Czech Republic in the 1961–1990 (A) and 1991–2020 (B) periods: means and standard deviations (SD) are in %, linear trends in %/10 years (in bold statistically significant at the 0.05 significance level). The asterisk * indicates statistically significant differences of a given characteristic between two 30-year periods.
| Season | Period | Mean | | SD | | Skewness | Kurtosis | Slope |
|---|
| Ann | A | 79 | * | 1.3 | * | −0.35 | 0.11 | −0.6 |
| | B | 78 | * | 1.9 | * | −0.55 | −0.21 | −1.0 |
| DJF | A | 86 | * | 1.3 | | –0.84 | 0.75 | –0.5 |
| | B | 84 | * | 1.4 | | −0.43 | −0.35 | −0.5 |
| MAM | A | 75 | * | 2.2 | * | 0.06 | −0.16 | −1.3 |
| | B | 72 | * | 3.5 | * | −0.52 | −0.10 | −1.9 |
| JJA | A | 74 | * | 2.8 | | −1.02 | 0.96 | −0.2 |
| | B | 71 | * | 3.5 | | −0.96 | −0.24 | −1.0 |
| SON | A | 82 | | 1.9 | | −0.79 | 1.43 | −0.2 |
| | B | 83 | | 2.2 | | −0.31 | 0.58 | −0.2 |
Table 7.
Selected statistical characteristics of annual (Ann) and seasonal (DJF, MAM, JJA, and SON) series of mean precipitation totals in the Czech Republic in the 1961–1990 (A) and 1991–2020 (B) periods: means are in mm, coefficients of variation (CV) in %, linear trends in mm/10 years (none statistically significant at the 0.05 significance level). An asterisk * indicates statistically significant differences of a given characteristic between two 30-year periods.
| Season | Period | Mean | CV | Skewness | Kurtosis | | Slope |
|---|
| Ann | A | 681 | 12.8 | 0.44 | –0.84 | | −2.4 |
| | B | 699 | 12.7 | 0.01 | 0.06 | | −1.7 |
| DJF | A | 128 | 25.6 | −0.31 | –0.16 | | 6.8 |
| | B | 130 | 25.0 | −0.33 | –0.74 | | 3.2 |
| MAM | A | 162 | 18.7 | 1.60 | 4.09 | * | −8.1 |
| | B | 159 | 23.3 | 0.50 | –0.55 | * | −3.0 |
| JJA | A | 245 | 21.8 | 0.48 | 0.97 | | −3.0 |
| | B | 252 | 21.6 | 0.12 | –0.42 | | −5.5 |
| SON | A | 146 | 23.5 | 0.56 | 0.95 | | 1.4 |
| | B | 158 | 26.5 | 0.94 | 1.37 | | 1.8 |
Table 8.
Selected statistical characteristics of mean annual (Ann) and seasonal (DJF, MAM, JJA, and SON) wind speed series in the Czech Republic in the 1961–1990 (A) and 1991–2020 (B) periods: means are in m s−1, coefficients of variation (CV) in %, linear trends in m s−1/10 years (in bold statistically significant at the 0.05 significance level). An asterisk * indicates statistically significant differences of a given characteristic between two 30-year periods.
| Season | Period | Mean | | CV | | Skewness | | Kurtosis | Slope | |
|---|
| Ann | A | 2.5 | * | 3.2 | * | −0.15 | * | −0.83 | 0.01 | * |
| | B | 2.3 | * | 5.7 | * | 0.62 | * | −0.46 | −0.12 | * |
| DJF | A | 2.9 | * | 9.7 | | 0.52 | | −0.02 | 0.07 | |
| | B | 2.6 | * | 10.4 | | 0.22 | | −0.95 | −0.10 | |
| MAM | A | 2.7 | * | 4.7 | * | −0.13 | * | 0.20 | −0.01 | * |
| | B | 2.5 | * | 7.6 | * | 1.26 | * | 1.17 | −0.10 | * |
| JJA | A | 2.1 | * | 6.3 | | −0.17 | | 0.63 | −0.03 | * |
| | B | 2.0 | * | 6.0 | | 0.07 | | 0.06 | −0.10 | * |
| SON | A | 2.4 | * | 7.1 | | 0.22 | | −0.76 | 0.02 | * |
| | B | 2.2 | * | 8.2 | | 0.32 | | −0.22 | −0.13 | * |
Table 9.
Pearson correlation coefficients of annual (Ann) and seasonal (DJF, MAM, JJA, and SON) series between sunshine duration (SD) and mean maximum temperatures (TMAX) and between mean air temperature (TAVG) and relative humidity (RH) in the CR during the 1961–2020, 1991–1990, and 1991–2020 periods. Statistically significant correlation coefficients at the 0.05 significance level are in bold.
| Period | Ann | DJF | MAM | JJA | SON |
|---|
| SD versus TMAX |
| 1961–2020 | 0.58 | 0.11 | 0.70 | 0.80 | 0.46 |
| 1961–1990 | 0.55 | 0.18 | 0.51 | 0.75 | 0.47 |
| 1991–2020 | 0.52 | 0.08 | 0.78 | 0.80 | 0.55 |
| TAVG versus RH |
| 1961–2020 | −0.67 | −0.28 | −0.57 | −0.77 | −0.04 |
| 1961–1990 | −0.39 | −0.12 | −0.27 | −0.54 | 0.11 |
| 1991–2020 | −0.62 | −0.22 | −0.58 | −0.84 | −0.22 |
Table 10.
Linear trends of selected annual (Ann) and seasonal (DJF, MAM, JJA, and SON) series of circulation types and climatic variables (Var.) in 1961–2020 (a) in comparison with signs of linear trends (+ positive, − negative, 0 no trend) in two 30-year normal periods, 1961–1990 and 1991–2020 (b): ACT—anticyclonic circulation types (days/10 years), CCT—cyclonic circulation types (days/10 years), DCT—directional circulation types (days/10 years), SD—sunshine duration (hours/10 years), TAVG—mean temperature (°C/10 years), TMAX—mean maximum temperature (°C/10 years), TMIN—mean minimum temperature (°C/10 years), RH—relative humidity (%/10 years), P—precipitation (mm/10 years), WS—wind speed (m s−1/10 years). Bold figures and signs with an asterisk * indicate statistically significant trends at the 0.05 significance level.
| Var. | Ann | DJF | MAM | JJA | SON |
|---|
| a | b | a | b | a | b | a | b | a | b |
|---|
| ACT | 6.8 | + */+ | 1.7 | +/− | 1.9 | +/+ | 2.8 | + */+ | 0.0 | +/+ |
| CCT | −4.3 | − */0 | −0.6 | −/+ | −2.1 | −/− | −1.4 | − */+ | 0.0 | −/0 |
| DCT | −1.7 | 0/− | −0.9 | −/+ | 0.0 | +/− | −0.9 | 0/− | 0.0 | −/− |
| SD | 16.8 | −/+ | −1.2 | +/− | 14.0 | +/+ | 10.5 | −/− | −7.1 | −/+ |
| TAVG | 0.37 | +/+ * | 0.36 | +/+ | 0.36 | +/+ | 0.45 | +/+ * | 0.23 | −/+ * |
| TMAX | 0.42 | +/+ * | 0.39 | +/+ | 0.49 | +/+ * | 0.52 | +/+ * | 0.21 | −/+ * |
| TMIN | 0.35 | +/+ * | 0.38 | +/+ | 0.25 | +/+ | 0.40 | +/+ * | 0.27 | 0/+ * |
| RH | −0.6 | −/− * | −0.5 | −/− | −1.2 | − */− * | −0.9 | −/− | 0.0 | −/− |
| P | 5.5 | −/− | 1.6 | +/+ | −2.6 | −/− | 1.0 | −/− | 2.8 | +/+ |
| WS | −0.07 | +/− * | −0.06 | +/− | −0.07 | −/− * | −0.05 | −/− * | −0.08 | +/− * |


 ,
, 


