Regulation of Microtubule Nucleation in Mouse Bone Marrow-Derived Mast Cells by Protein Tyrosine Phosphatase SHP-1

 , and
, and 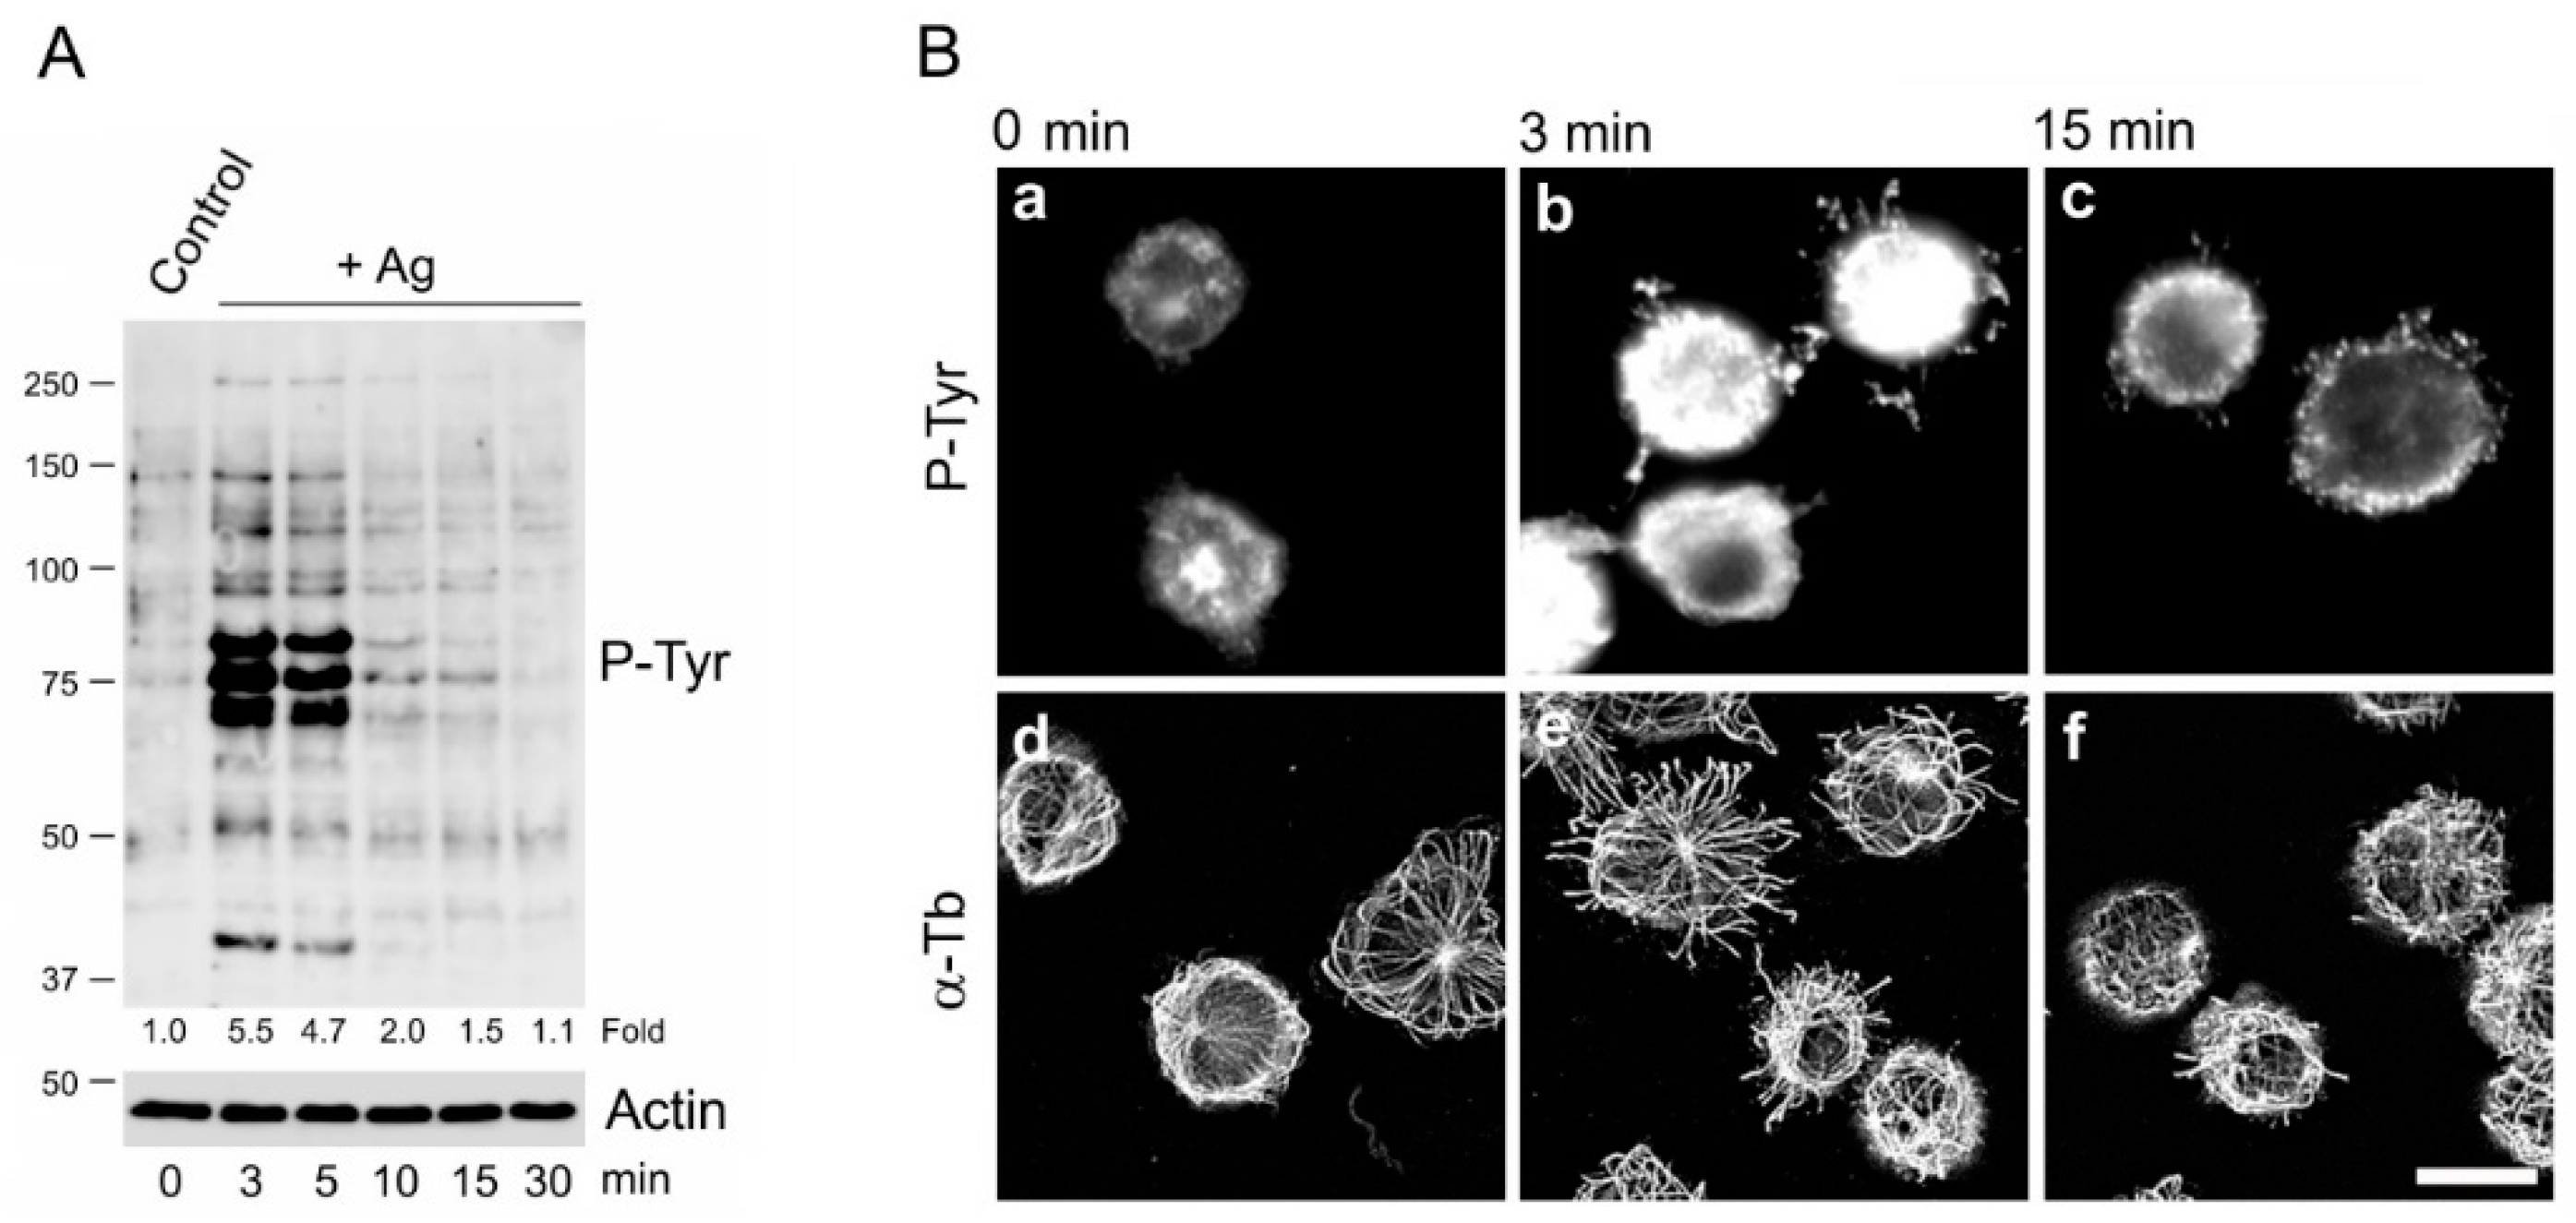
Abstract
:1. Introduction
2. Materials and Methods
2.1. Reagents
2.2. Antibodies
2.3. Cell Cultures and Transfection
2.4. DNA Constructs
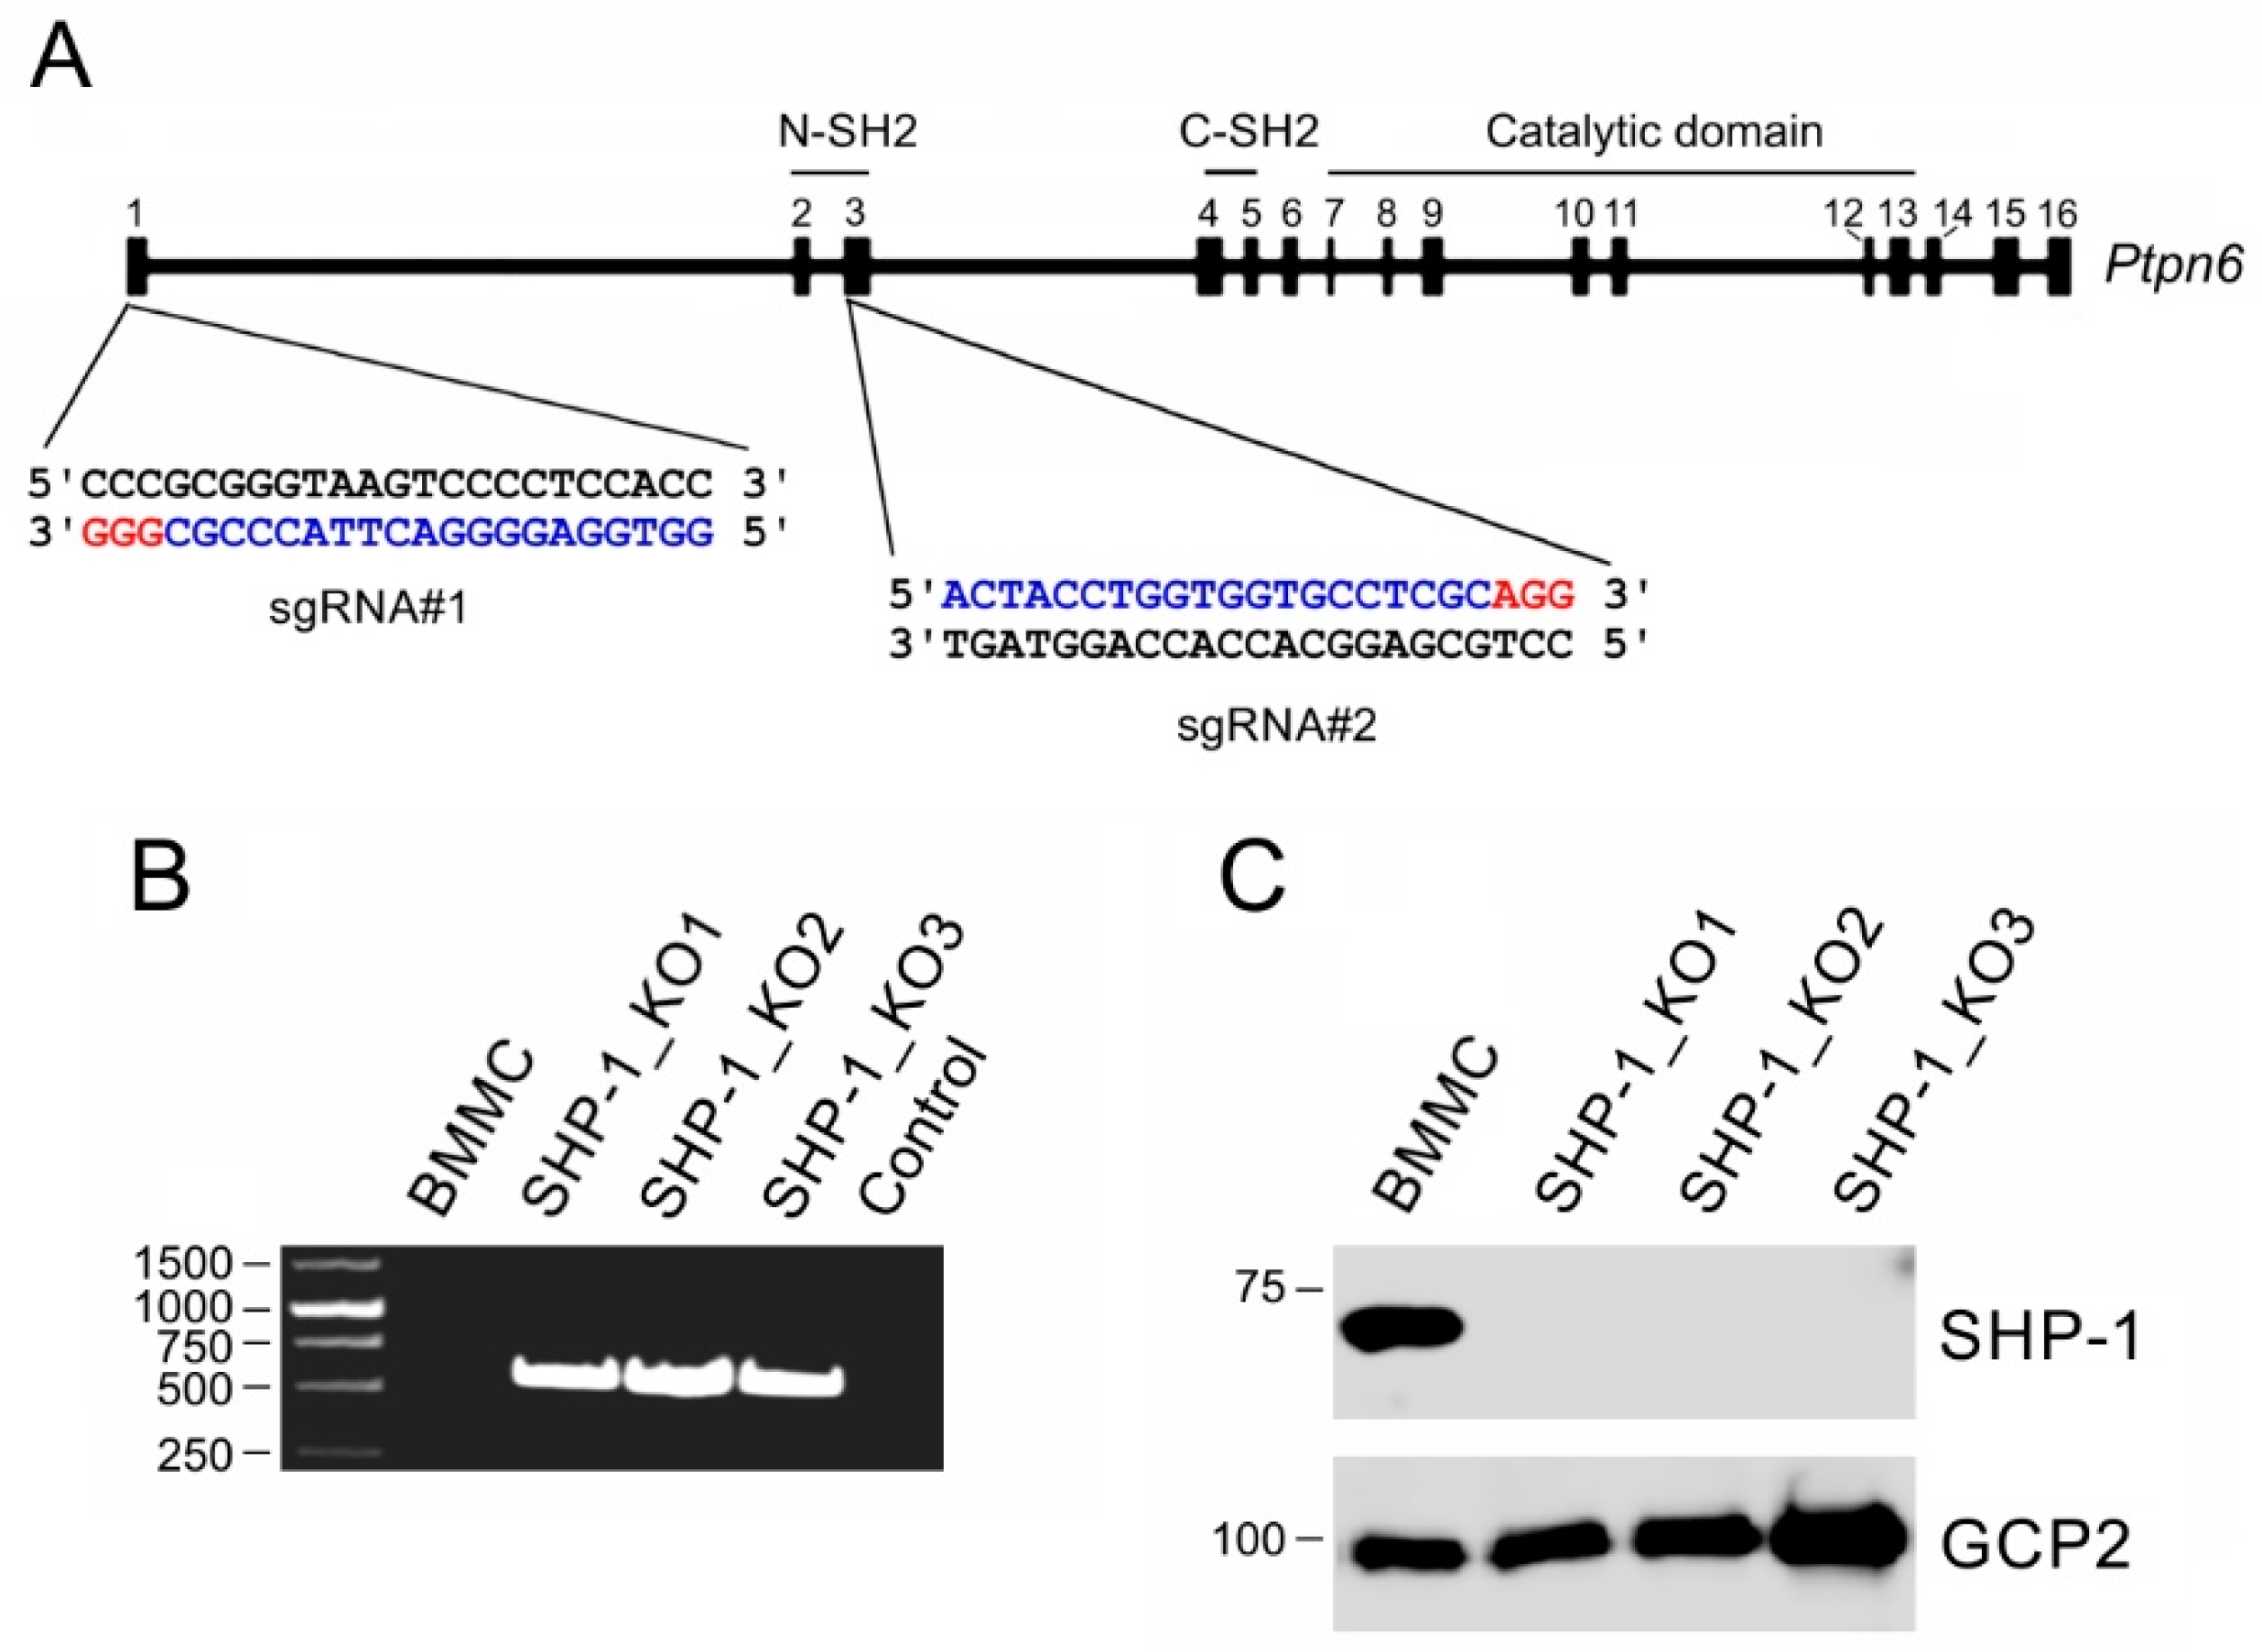
2.5. Generation of SHP-1 Deficient Cell Lines
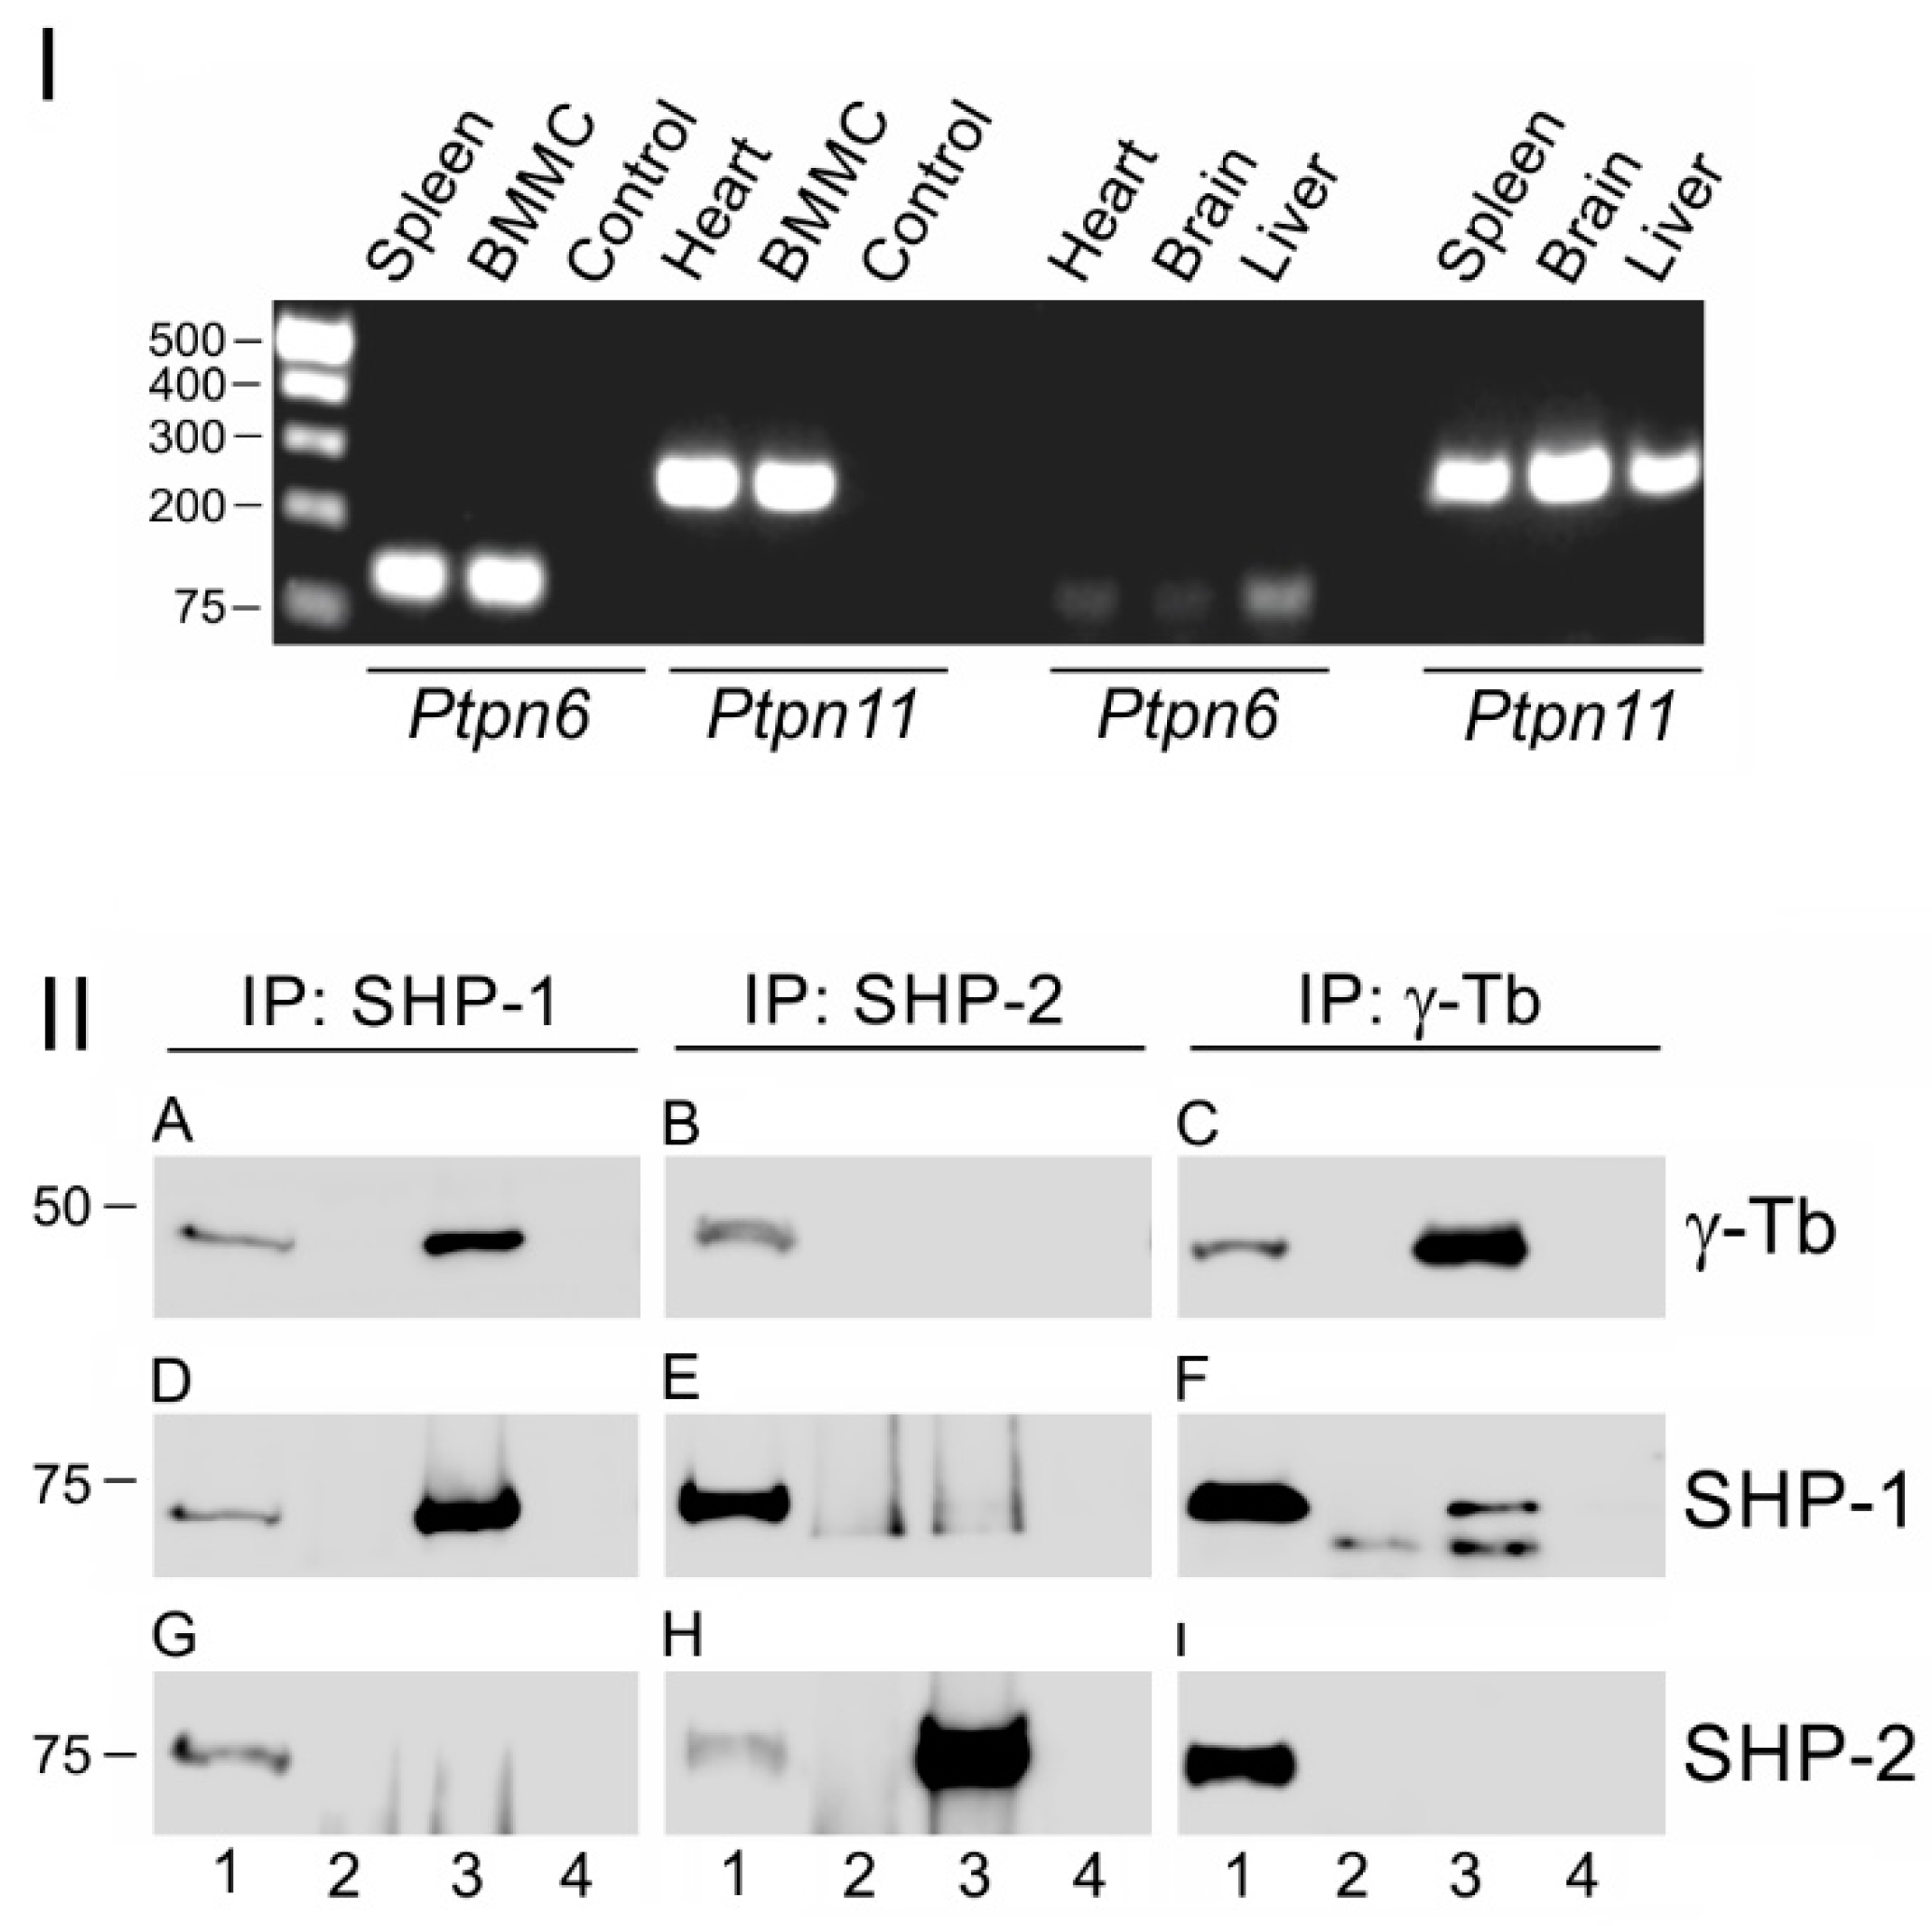
2.6. Reverse Transcription PCR (RT-PCR)
2.7. Real-Time qRT-PCR
2.8. Lentiviral Infection
2.9. Cell Activation
2.10. Degranulation Assay and Determination of Intracellular Ca2+ Concentration
2.11. Evaluation of Cell Growth
2.12. Preparation of Cell Extracts
2.13. Immunoprecipitation, Kinase Assay, GST Pull-Down Assay, Gel Electrophoresis, and Immunoblotting
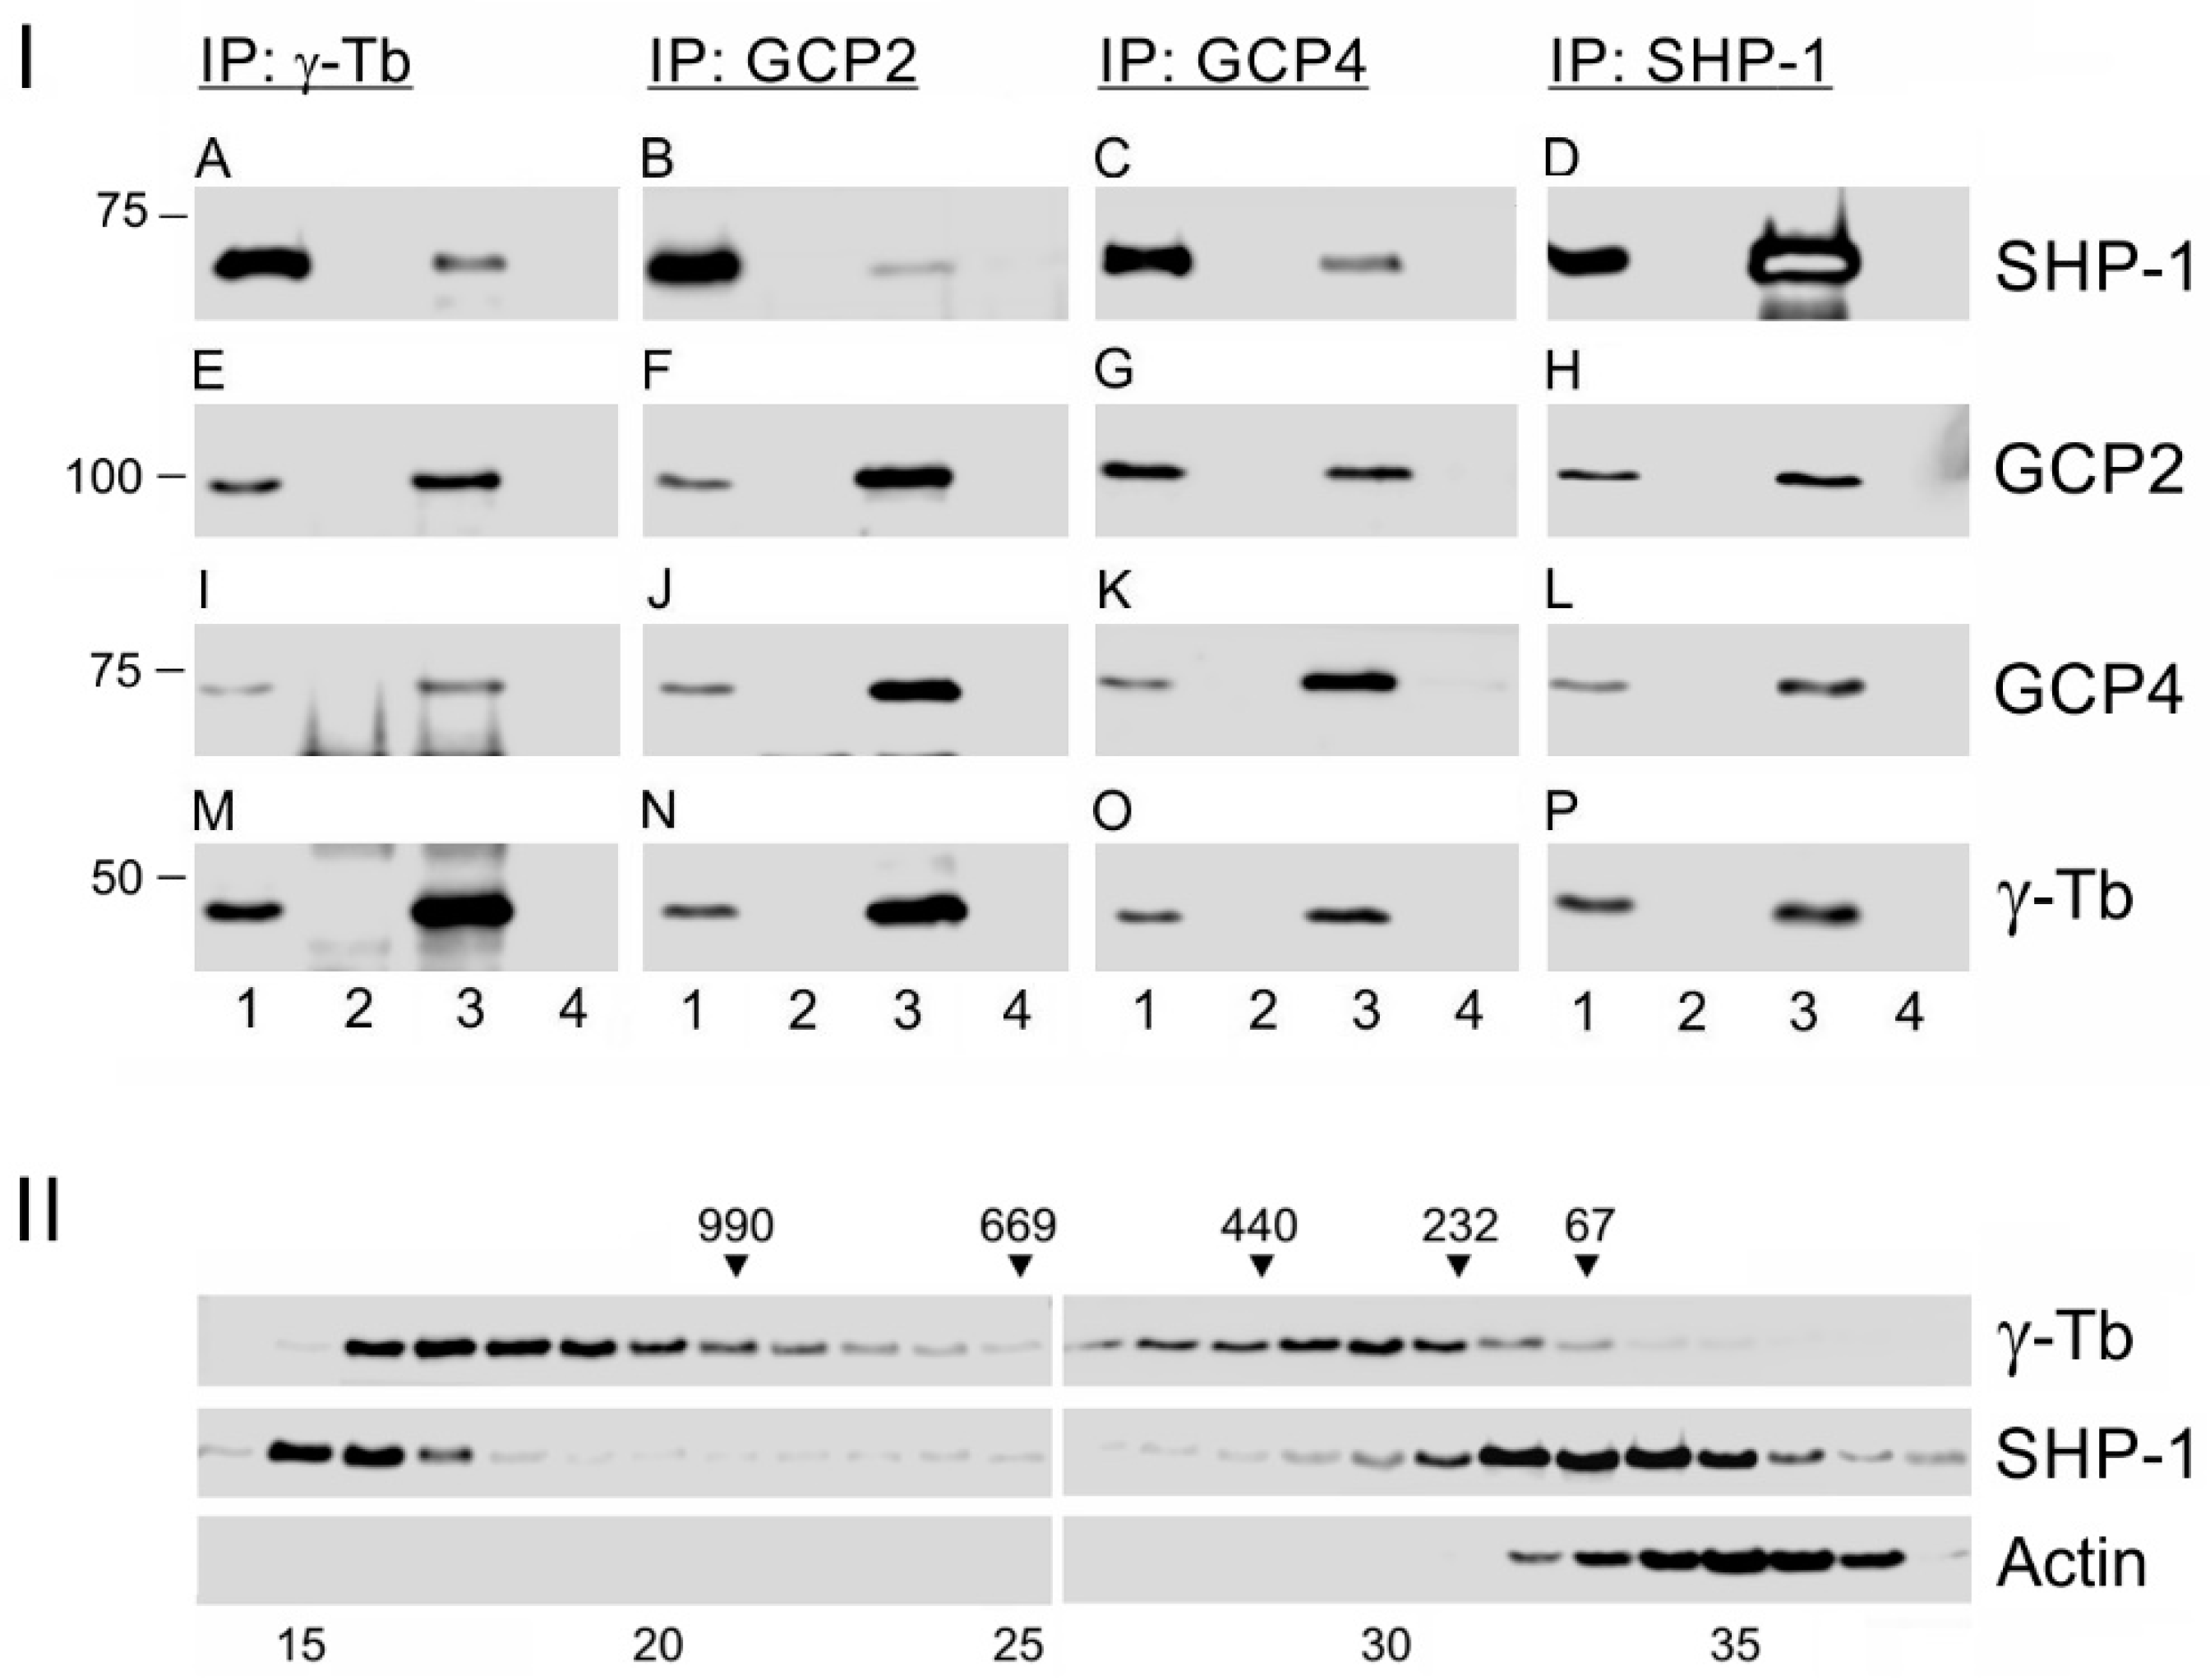
2.14. Gel Filtration Chromatography
2.15. Microtubule Regrowth
2.16. Immunofluorescence Microscopy
2.17. Statistical Analysis
3. Results
3.1. Protein Tyrosine Phosphatase SHP-1 Interacts with Proteins of γ-Tubulin Complexes
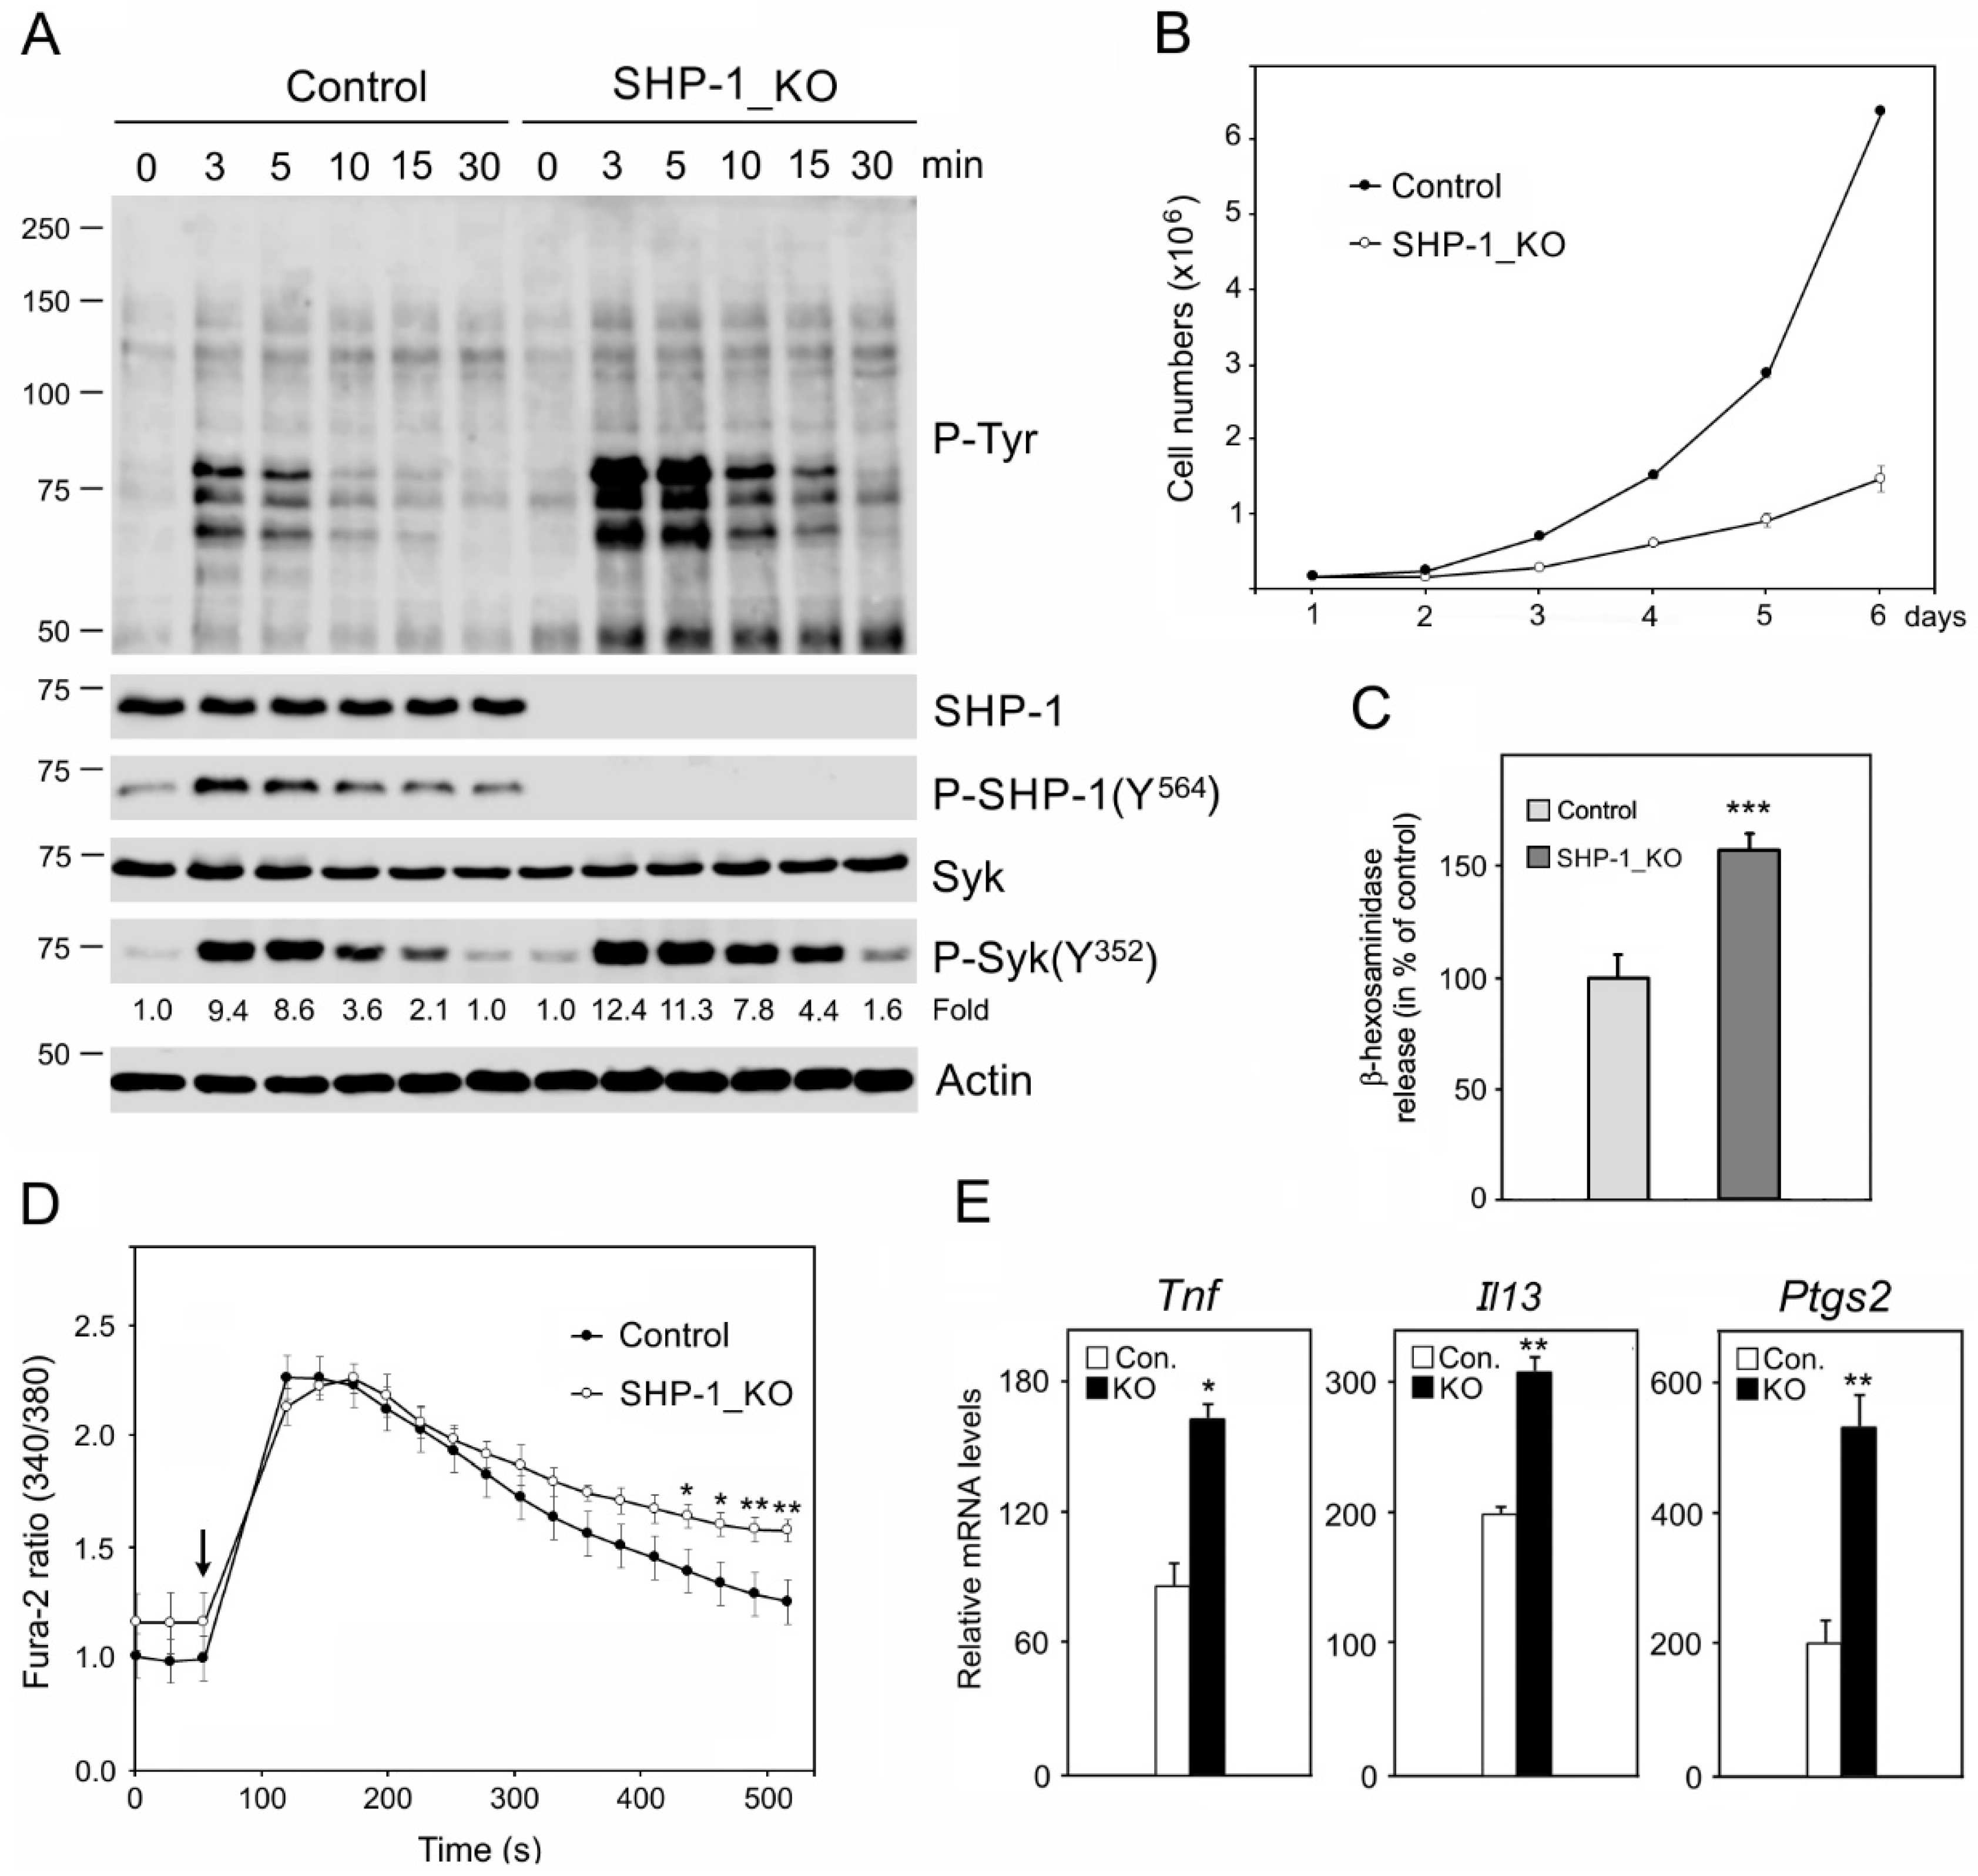
3.2. Characterization of BMMCs Deficient in SHP-1
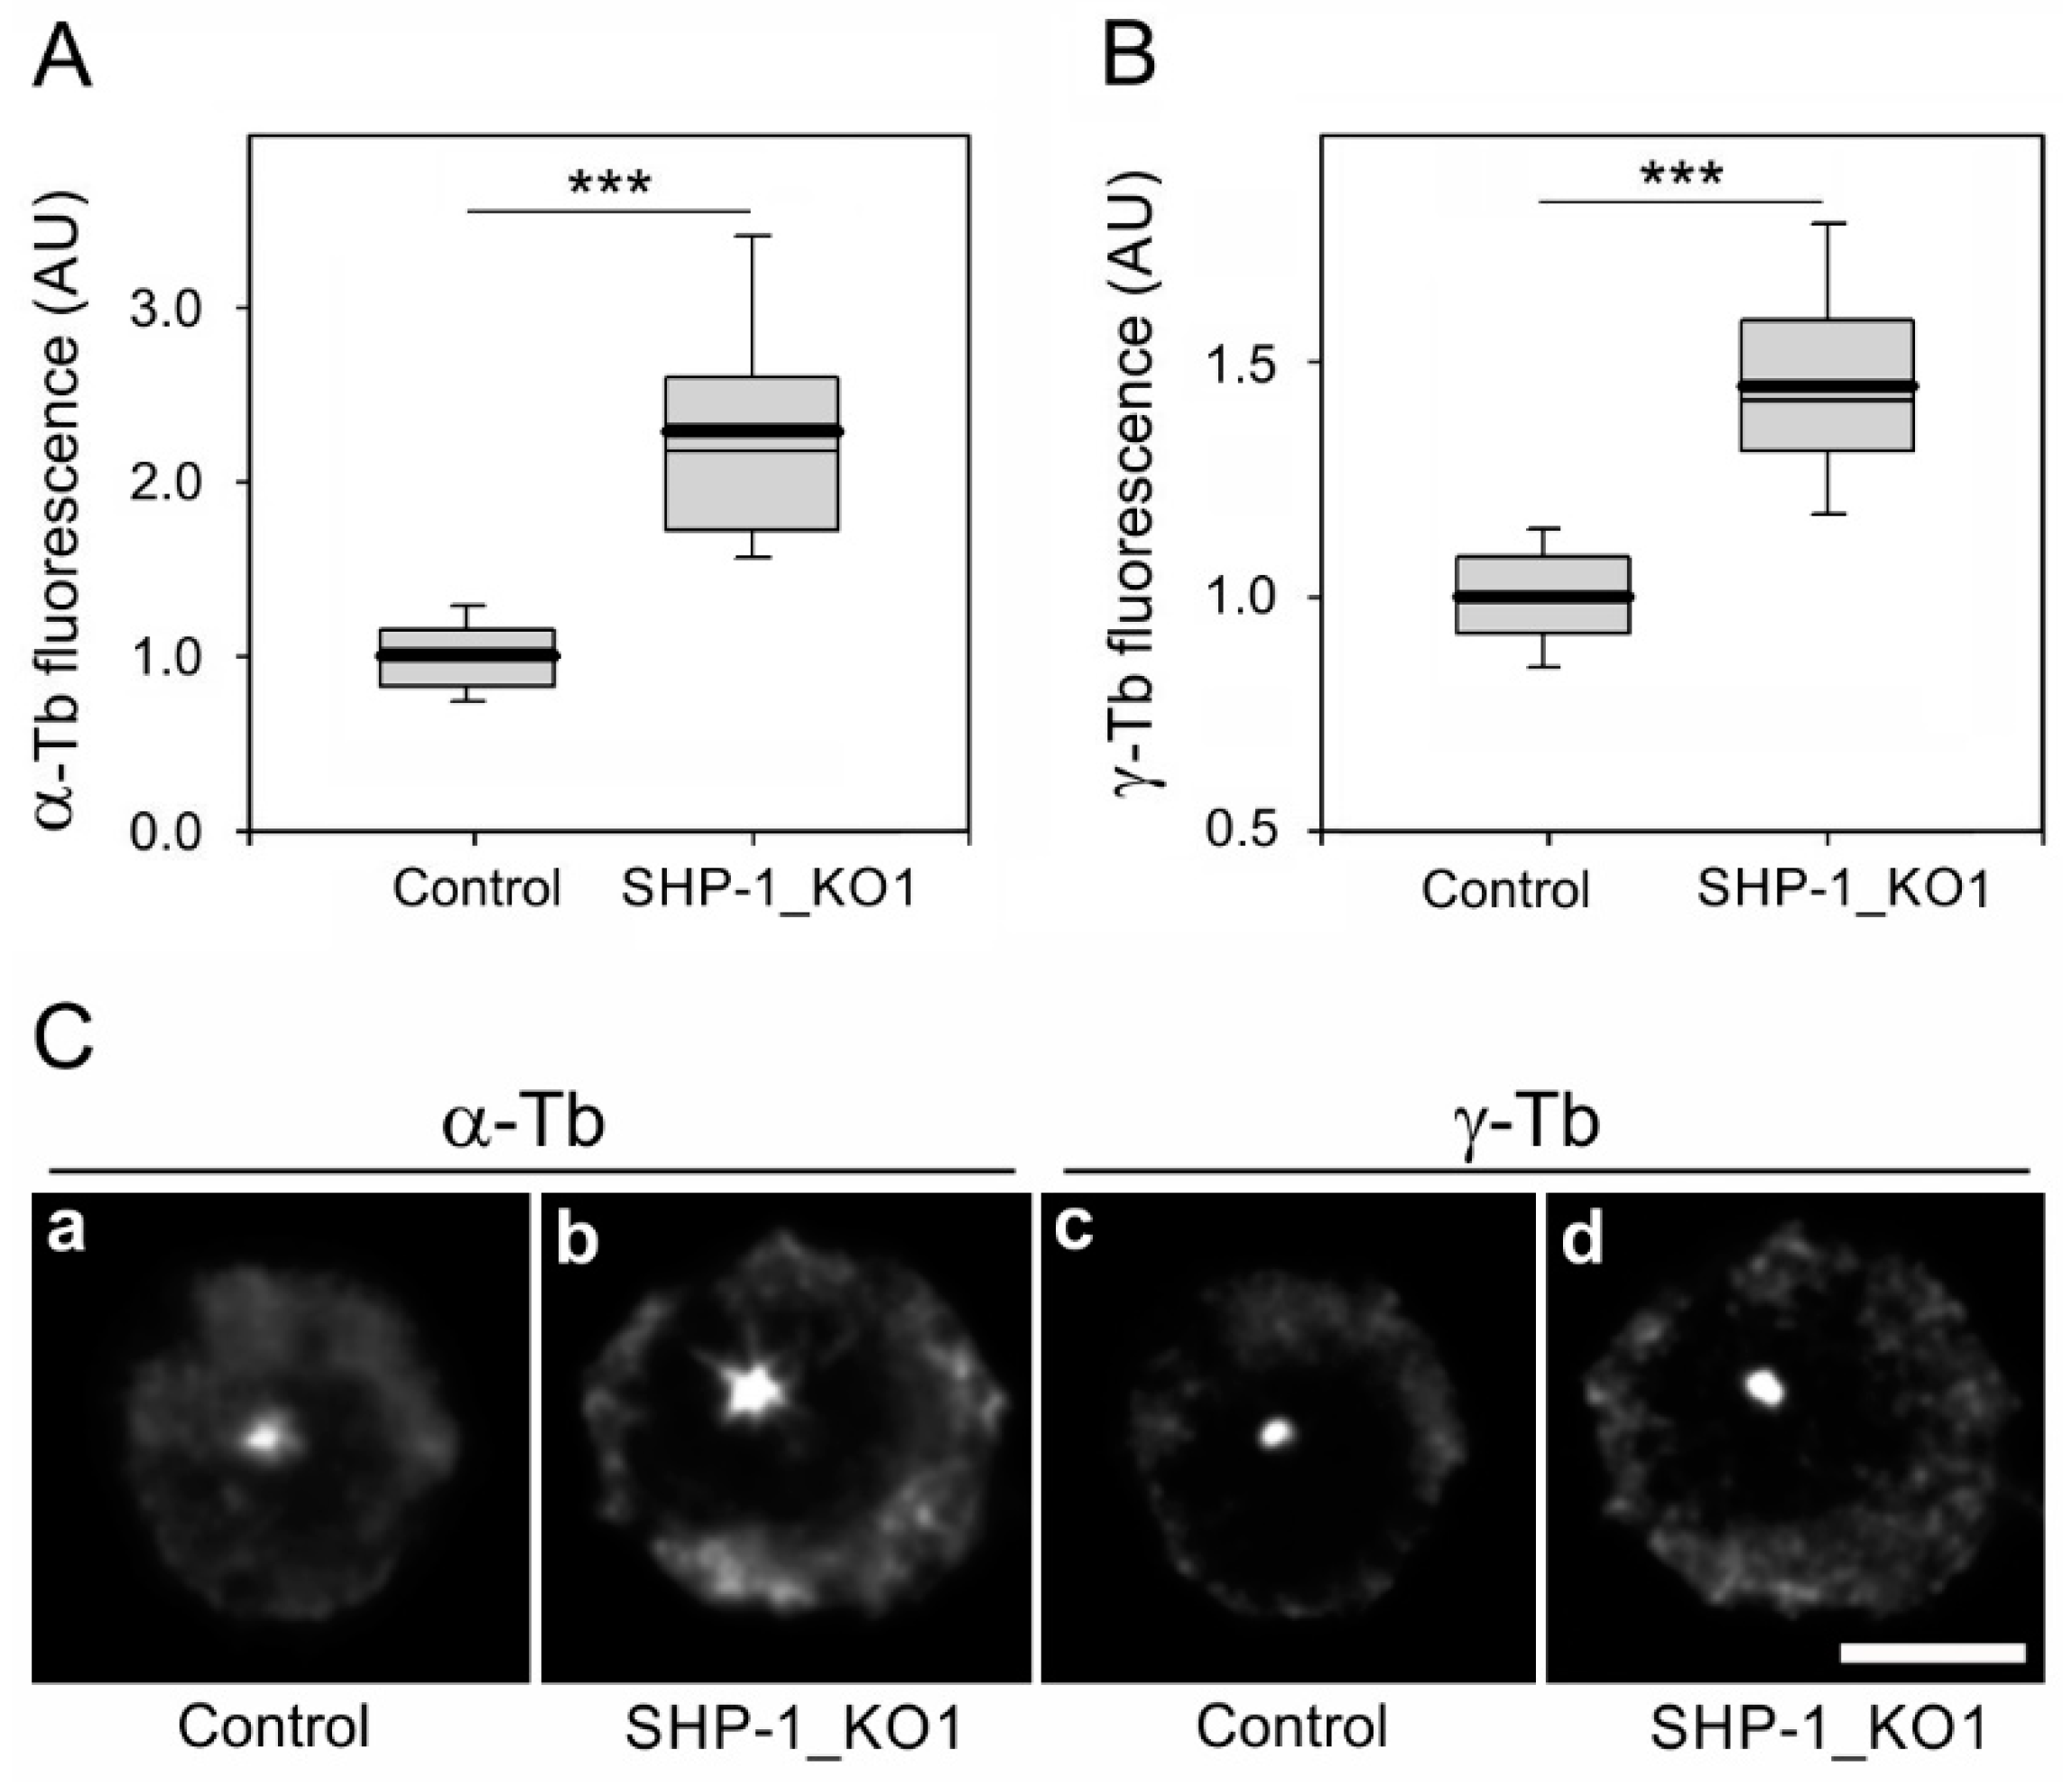
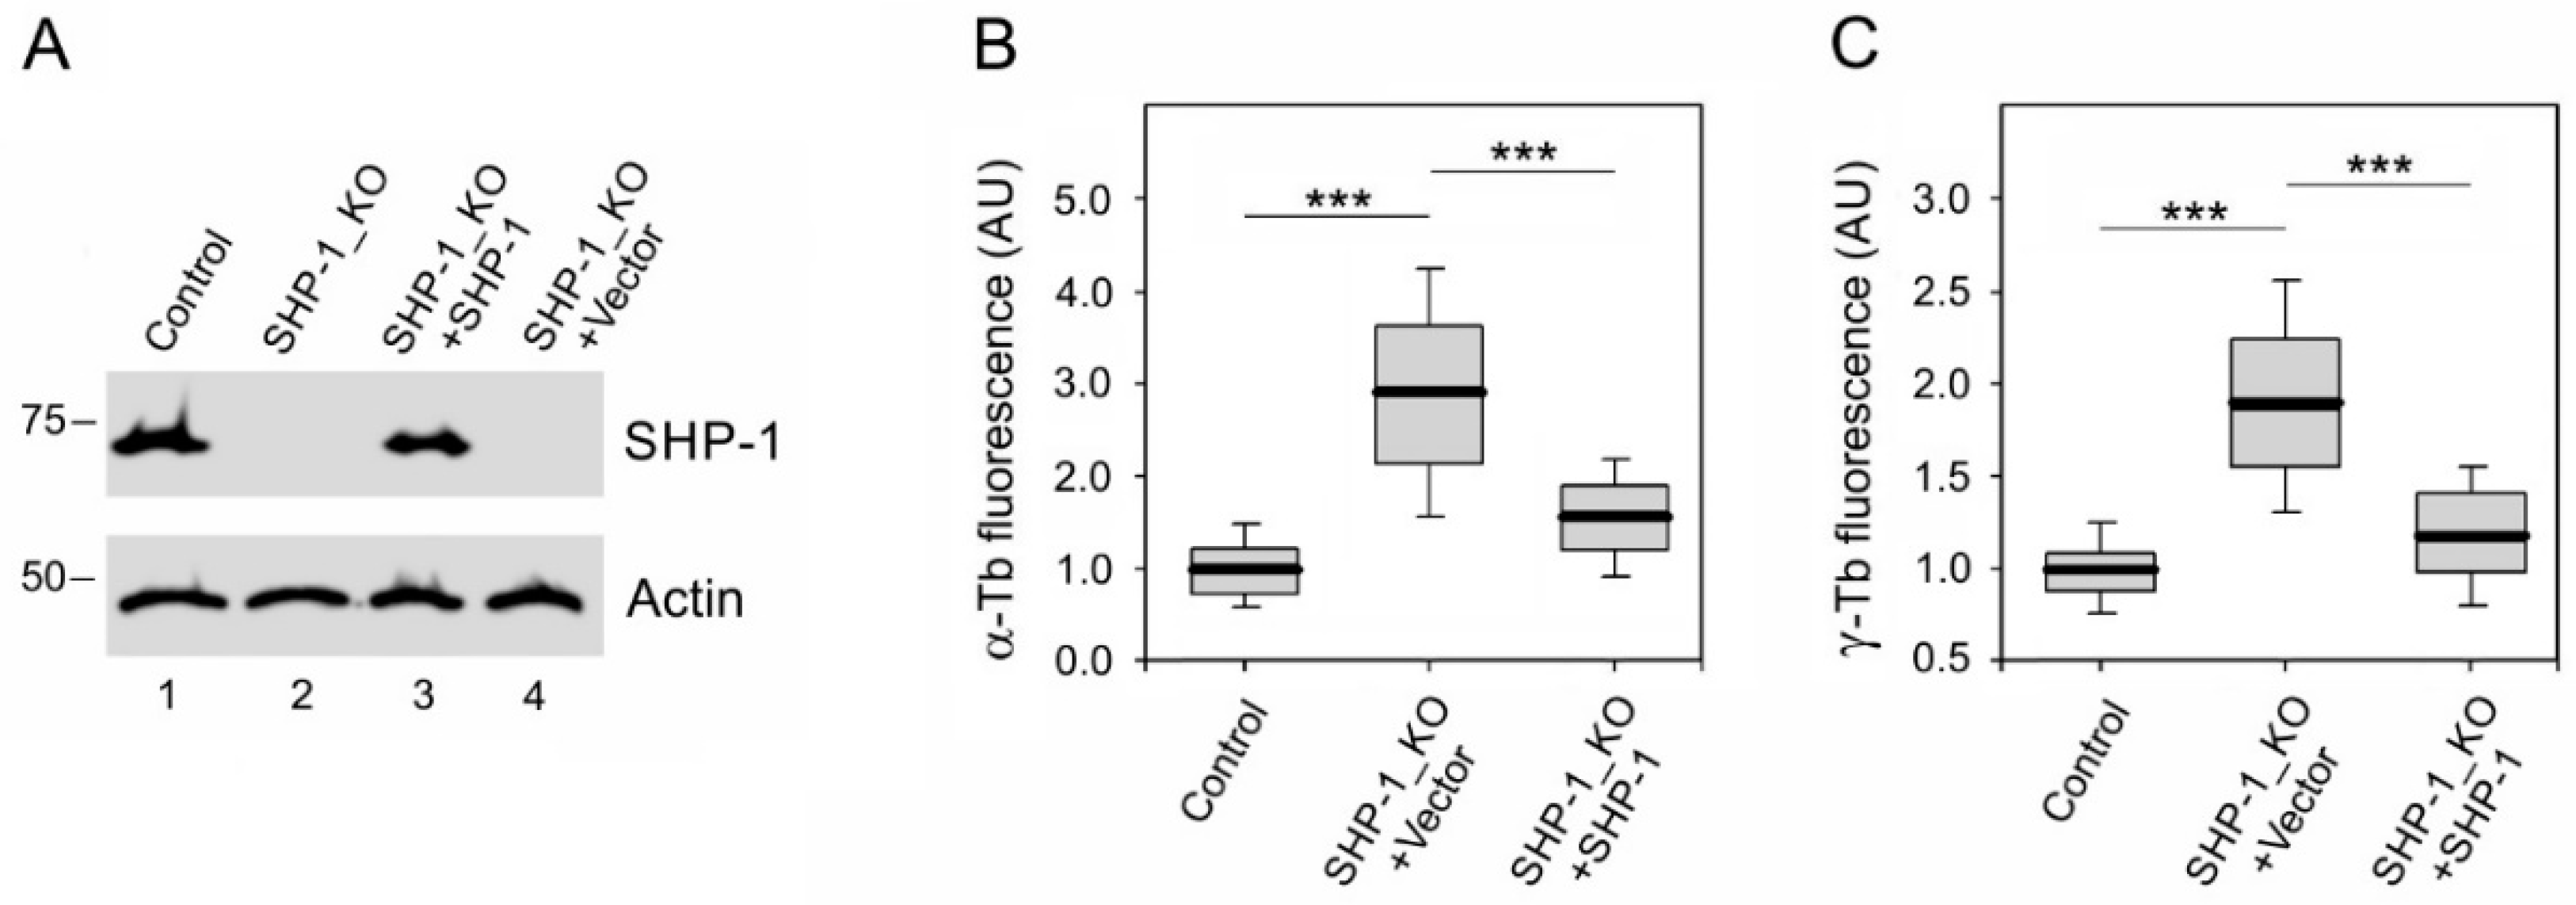
3.3. The Absence of SHP-1 Affects Microtubule Regrowth
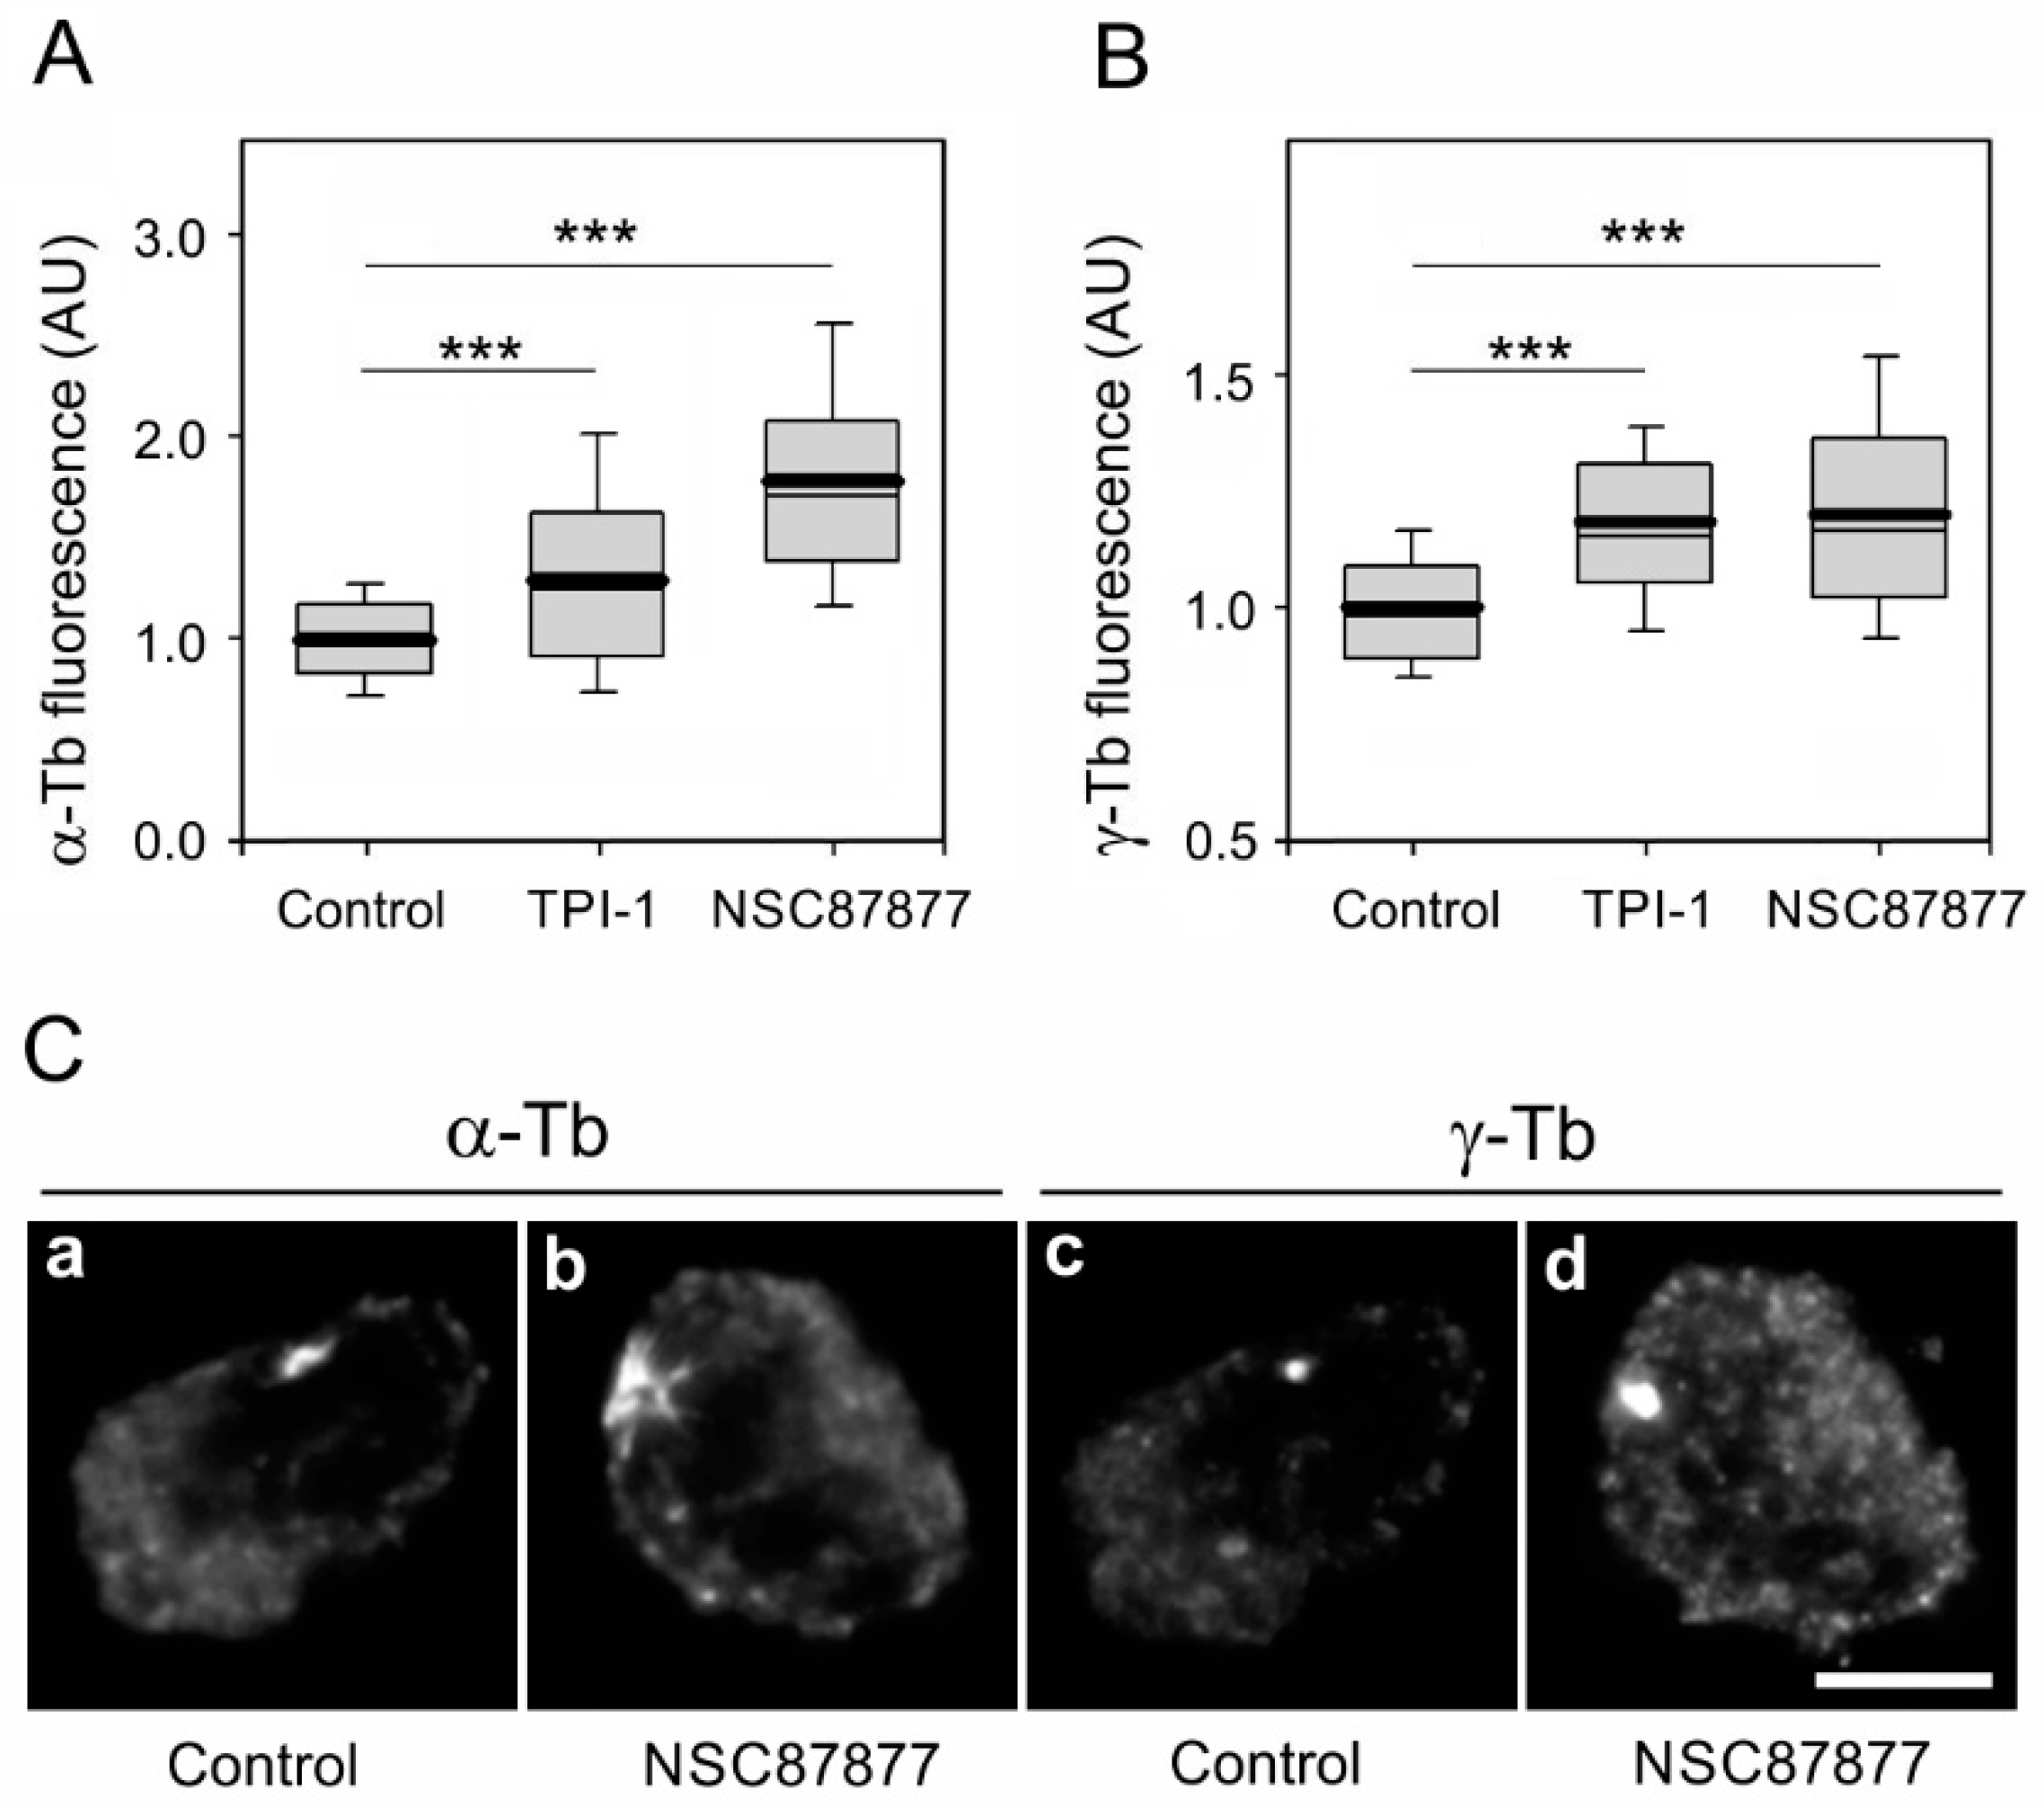
3.4. Inhibition of Enzymatic Activity of SHP-1 Modulates Microtubule Regrowth
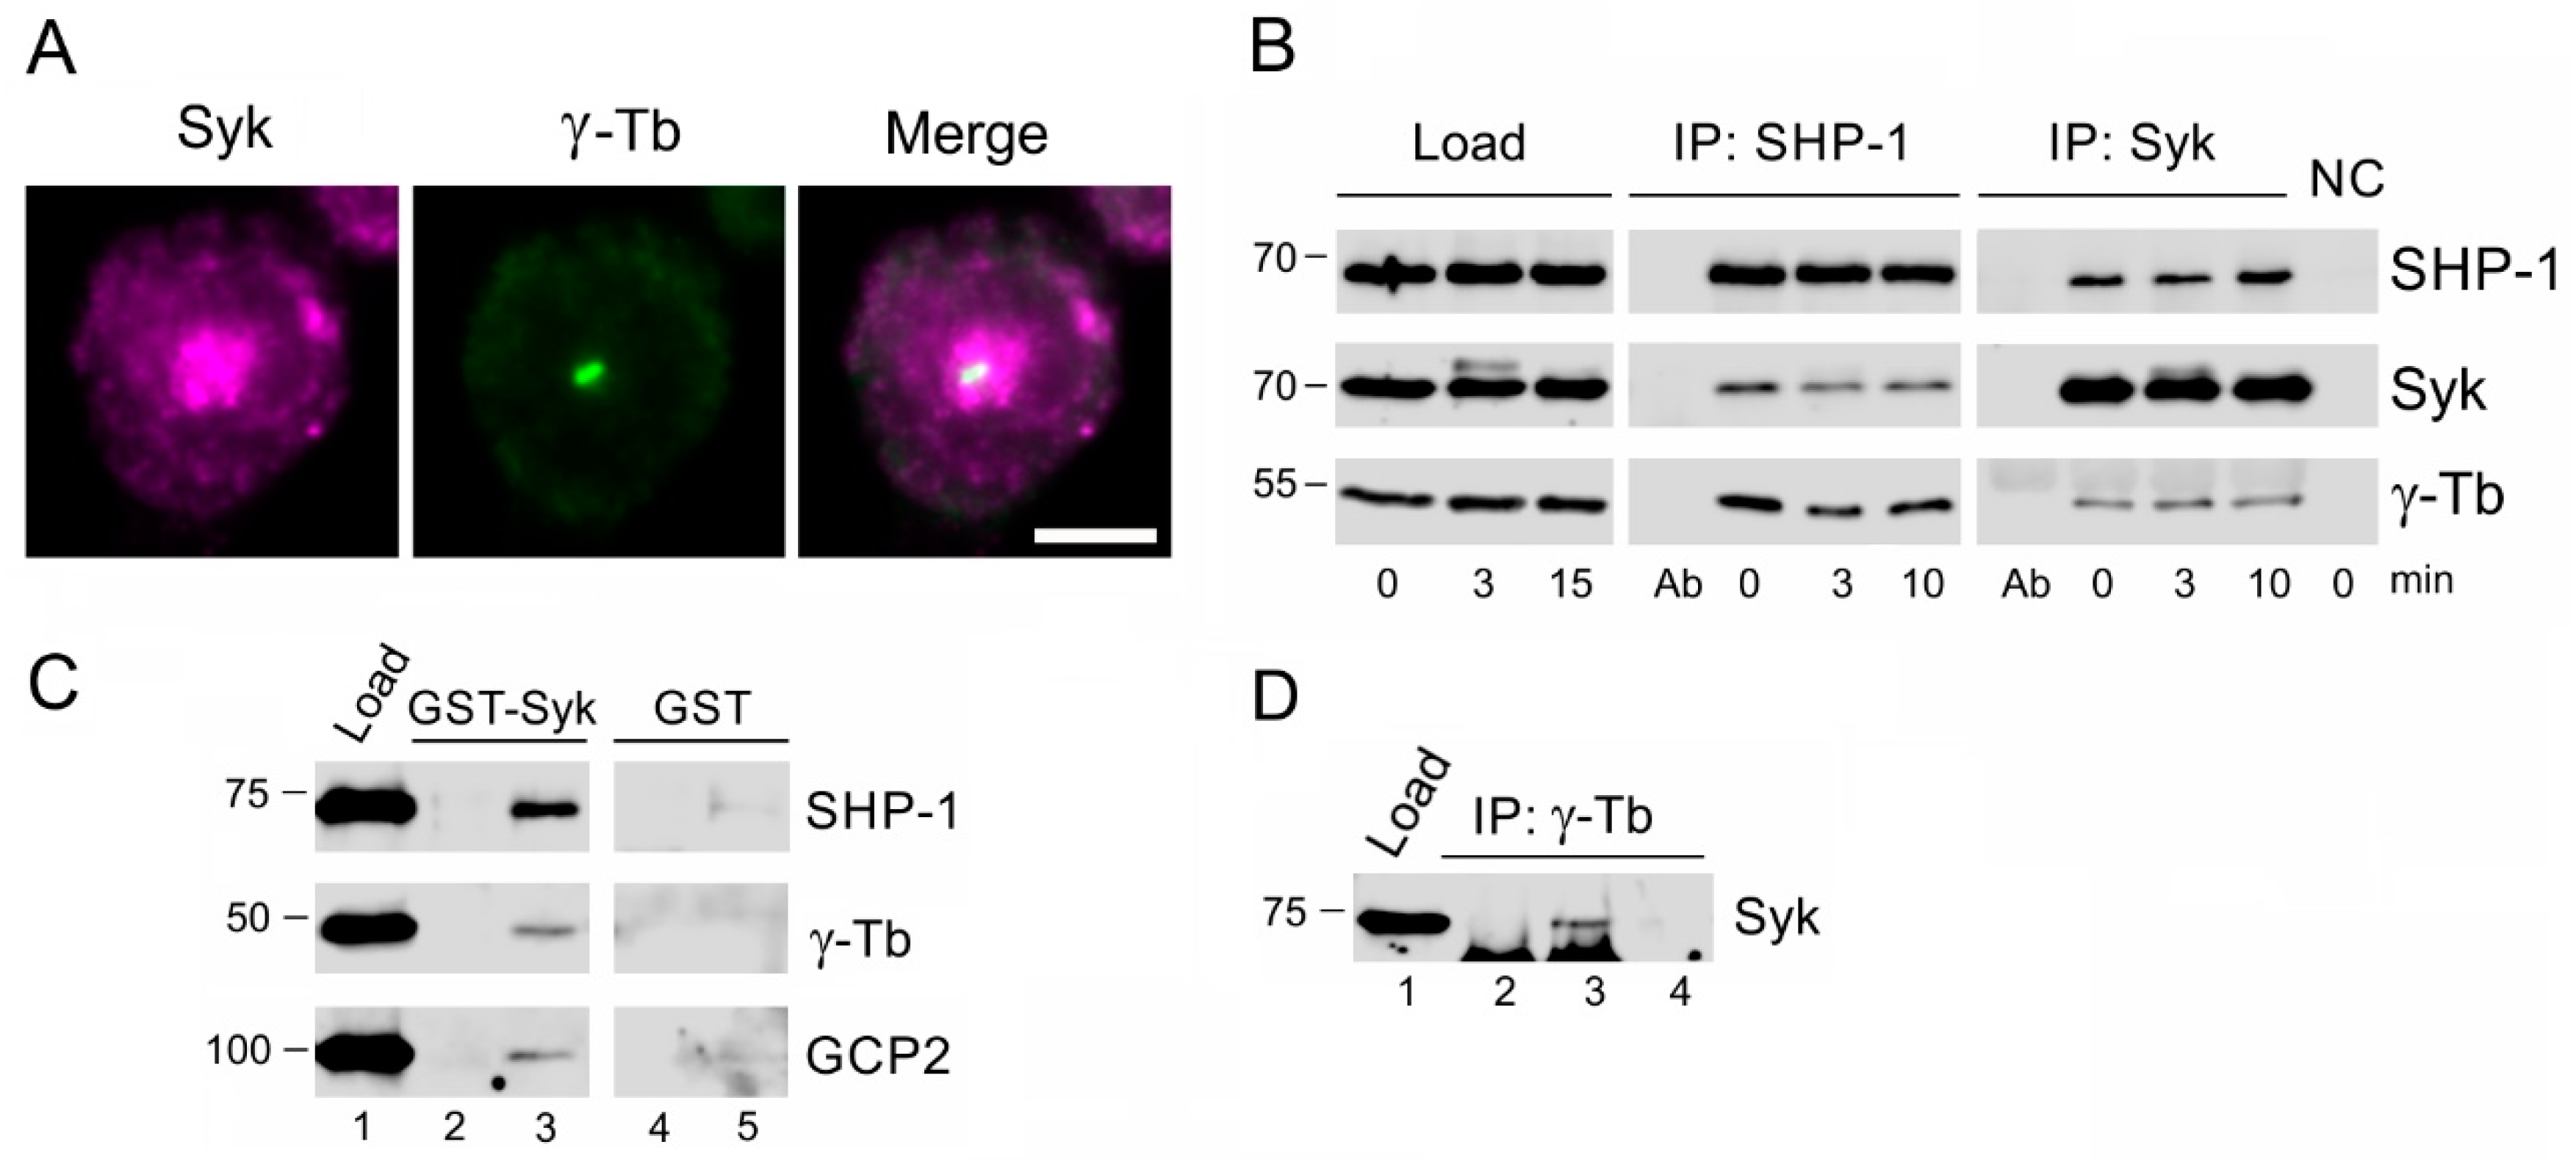
3.5. SHP-1 Interacts with Syk Protein Tyrosine Kinase Associating with γ-Tubulin Complex Proteins
4. Discussion
Supplementary Materials
Author Contributions
Funding
Acknowledgments
Conflicts of Interest
Abbreviations
| Ab(s) | Antibody(ies) |
| Ag | Antigen |
| BMMC(s) | Bone marrow-derived mast cell(s) |
| GCP | γ-tubulin complex protein |
| mAb | Monoclonal antibody |
| P-Tyr | Phosphotyrosine |
| ROI | Region of interest |
| γTuRC | γ-tubulin ring complex |
| γTuSC | γ-tubulin small complex |
References
- Kalesnikoff, J.; Galli, S.J. New developments in mast cell biology. Nat. Immunol. 2008, 9, 1215–1223. [Google Scholar] [CrossRef]
- Blank, U.; Rivera, J. The ins and outs of IgE-dependent mast-cell exocytosis. Trends Immunol. 2004, 25, 266–273. [Google Scholar] [CrossRef]
- Gilfillan, A.M.; Rivera, J. The tyrosine kinase network regulating mast cell activation. Immunol. Rev. 2009, 228, 149–169. [Google Scholar] [CrossRef]
- Smith, A.J.; Pfeiffer, J.R.; Zhang, J.; Martinez, A.M.; Griffiths, G.M.; Wilson, B.S. Microtubule-dependent transport of secretory vesicles in RBL-2H3 cells. Traffic 2003, 4, 302–312. [Google Scholar] [CrossRef]
- Nishida, K.; Yamasaki, S.; Ito, Y.; Kabu, K.; Hattori, K.; Tezuka, T.; Nishizumi, H.; Kitamura, D.; Goitsuka, R.; Geha, R.S.; et al. FcεRI-mediated mast cell degranulation requires calcium-independent microtubule-dependent translocation of granules to the plasma membrane. J. Cell Biol. 2005, 170, 115–126. [Google Scholar] [CrossRef]
- Sulimenko, V.; Dráberová, E.; Sulimenko, T.; Macurek, L.; Richterová, V.; Dráber, P.; Dráber, P. Regulation of microtubule formation in activated mast cells by complexes of γ-tubulin with Fyn and Syk kinases. J. Immunol. 2006, 176, 7243–7253. [Google Scholar] [CrossRef]
- Hájková, Z.; Bugajev, V.; Dráberová, E.; Vinopal, S.; Dráberová, L.; Janáček, J.; Dráber, P.; Dráber, P. STIM1-directed reorganization of microtubules in activated cells. J. Immunol. 2011, 186, 913–923. [Google Scholar] [CrossRef]
- Munoz, I.; Danelli, L.; Claver, J.; Goudin, N.; Kurowska, M.; Madera-Salcedo, I.K.; Huang, J.D.; Fischer, A.; Gonzalez-Espinosa, C.; de Saint, B.G.; et al. Kinesin-1 controls mast cell degranulation and anaphylaxis through PI3K-dependent recruitment to the granular Slp3/Rab27b complex. J. Cell Biol. 2016, 215, 203–216. [Google Scholar] [CrossRef]
- Cruse, G.; Beaven, M.A.; Ashmole, I.; Bradding, P.; Gilfillan, A.M.; Metcalfe, D.D. A truncated splice-variant of the FcεRIβ receptor subunit is critical for microtubule formation and degranulation in mast cells. Immunity 2013, 38, 906–917. [Google Scholar] [CrossRef]
- Efergan, A.; Azouz, N.P.; Klein, O.; Noguchi, K.; Rothenberg, M.E.; Fukuda, M.; Sagi-Eisenberg, R. Rab12 regulates retrograde transport of mast cell secretory granules by interacting with the RILP-dynein complex. J. Immunol. 2016, 196, 1091–1101. [Google Scholar] [CrossRef]
- Oakley, C.E.; Oakley, B.R. Identification of γ-tubulin, a new member of the tubulin superfamily encoded by mipa gene of Aspergillus nidulans. Nature 1989, 338, 662–664. [Google Scholar] [CrossRef] [PubMed]
- Oegema, K.; Wiese, C.; Martin, O.C.; Milligan, R.A.; Iwamatsu, A.; Mitchison, T.J.; Zheng, Y. Characterization of two related Drosophila γ-tubulin complexes that differ in their ability to nucleate microtubules. J. Cell Biol. 1999, 144, 721–733. [Google Scholar] [CrossRef] [PubMed]
- Oakley, B.R.; Paolillo, V.; Zheng, Y. γ-Tubulin complexes in microtubule nucleation and beyond. Mol. Biol. Cell 2015, 26, 2957–2962. [Google Scholar] [CrossRef]
- Vogel, J.; Drapkin, B.; Oomen, J.; Beach, D.; Bloom, K.; Snyder, M. Phosphorylation of γ-tubulin regulates microtubule organization in budding yeast. Dev. Cell 2001, 1, 621–631. [Google Scholar] [CrossRef]
- Keck, J.M.; Jones, M.H.; Wong, C.C.; Binkley, J.; Chen, D.; Jaspersen, S.L.; Holinger, E.P.; Xu, T.; Niepel, M.; Rout, M.P.; et al. A cell cycle phosphoproteome of the yeast centrosome. Science 2011, 332, 1557–1561. [Google Scholar] [CrossRef]
- Colello, D.; Reverte, C.G.; Ward, R.; Jones, C.W.; Magidson, V.; Khodjakov, A.; LaFlamme, S.E. Androgen and Src signaling regulate centrosome activity. J. Cell Sci. 2010, 123, 2094–2102. [Google Scholar] [CrossRef]
- Colello, D.; Mathew, S.; Ward, R.; Pumiglia, K.; LaFlamme, S.E. Integrins regulate microtubule nucleating activity of centrosome through mitogen-activated protein kinase/extracellular signal-regulated kinase kinase/extracellular signal-regulated kinase (MEK/ERK) signaling. J. Biol. Chem. 2012, 287, 2520–2530. [Google Scholar] [CrossRef]
- Sulimenko, V.; Hájková, Z.; Černohorská, M.; Sulimenko, T.; Sládková, V.; Dráberová, L.; Vinopal, S.; Dráberová, E.; Dráber, P. Microtubule nucleation in mouse bone marrow-derived mast cells is regulated by the concerted action of GIT1/βPIX proteins and calcium. J. Immunol. 2015, 194, 4099–4111. [Google Scholar] [CrossRef]
- Nováková, M.; Dráberová, E.; Schürmann, W.; Czihak, G.; Viklický, V.; Dráber, P. γ-Tubulin redistribution in taxol-treated mitotic cells probed by monoclonal antibodies. Cell Motil. Cytoskel. 1996, 33, 38–51. [Google Scholar] [CrossRef]
- Dráberová, E.; Sulimenko, V.; Vinopal, S.; Sulimenko, T.; Sládková, V.; D’Agostino, L.; Sobol, M.; Hozák, P.; Křen, L.; Katsetos, C.D.; et al. Differential expression of human γ-tubulin isotypes during neuronal development and oxidative stress points to a γ-tubulin-2 prosurvival function. FASEB J. 2017, 31, 1828–1846. [Google Scholar] [CrossRef]
- Dráberová, E.; D’Agostino, L.; Caracciolo, V.; Sládková, V.; Sulimenko, T.; Sulimenko, V.; Sobol, M.; Maounis, N.F.; Tzelepis, E.; Mahera, E.; et al. Overexpression and nucleolar localization of γ-tubulin small complex proteins GCP2 and GCP3 in glioblastoma. J. Neuropathol. Exp. Neurol. 2015, 74, 723–742. [Google Scholar] [CrossRef]
- Dráberová, E.; Sulimenko, V.; Kukharskyy, V.; Dráber, P. Monoclonal antibody NF-09 specific for neurofilament protein NF-M. Folia Biol. 1999, 45, 163–165. [Google Scholar]
- Tolar, P.; Dráberová, L.; Dráber, P. Protein tyrosine kinase Syk is involved in Thy-1 signaling in rat basophilic leukemia cells. Eur. J. Immunol. 1997, 27, 3389–3397. [Google Scholar] [CrossRef]
- Amoui, M.; Dráberová, L.; Tolar, P.; Dráber, P. Direct interaction of Syk and Lyn protein tyrosine kinases in rat basophilic leukemia cells activated via type I Fcεreceptors. Eur. J. Immunol. 1997, 27, 321–328. [Google Scholar] [CrossRef]
- Hibbs, M.L.; Tarlinton, D.M.; Armes, J.; Grail, D.; Hodgson, G.; Maglitto, R.; Stacker, S.A.; Dunn, A.R.R. Multiple defects in the immune-system of Lyn-deficient mice, culminating in autoimmune-disease. Cell 1995, 83, 301–311. [Google Scholar] [CrossRef]
- Sander, J.D.; Joung, J.K. CRISPR-Cas systems for editing, regulating and targeting genomes. Nature Biotechnol. 2014, 32, 347–355. [Google Scholar] [CrossRef] [PubMed]
- Flemr, M.; Buhler, M. Single-step generation of conditional knockout mouse embryonic stem cells. Cell Rep. 2015, 12, 709–716. [Google Scholar] [CrossRef]
- Green, M.R.; Sambrook, J. Molecular Cloning; A Laboratory Manual, 4th ed.; Cold Spring Harbor Laboratory Press: Cold Spring Harbor, NY, USA, 2012; pp. 1378–1380. ISBN 978-1-936113-42-2. [Google Scholar]
- Blume, Y.; Yemets, A.; Sulimenko, V.; Sulimenko, T.; Chan, J.; Lloyd, C.; Dráber, P. Tyrosine phosphorylation of plant tubulin. Planta 2008, 229, 143–150. [Google Scholar] [CrossRef]
- Kukharskyy, V.; Sulimenko, V.; Macurek, L.; Sulimenko, T.; Dráberová, E.; Dráber, P. Complexes of γ-tubulin with non-receptor protein tyrosine kinases Src and Fyn in differentiating p19 embryonal carcinoma cells. Exp. Cell Res. 2004, 298, 218–228. [Google Scholar] [CrossRef]
- Dráber, P.; Lagunowich, L.A.; Dráberová, E.; Viklický, V.; Damjanov, I. Heterogeneity of tubulin epitopes in mouse fetal tissues. Histochemistry 1988, 89, 485–492. [Google Scholar] [CrossRef]
- Hořejší, B.; Vinopal, S.; Sládková, V.; Dráberová, E.; Sulimenko, V.; Sulimenko, T.; Vosecká, V.; Philimonenko, A.; Hozák, P.; Katsetos, C.D.; et al. Nuclear γ-tubulin associates with nucleoli and interacts with tumor suppressor protein C53. J. Cell Physiol. 2012, 227, 367–382. [Google Scholar] [CrossRef]
- Černohorská, M.; Sulimenko, V.; Hájková, Z.; Sulimenko, T.; Sládková, V.; Vinopal, S.; Dráberová, E.; Dráber, P. GIT1/βPIX signaling proteins and PAK1 kinase regulate microtubule nucleation. BBA Mol. Cell. Res. 2016, 1863, 1282–1297. [Google Scholar] [CrossRef] [PubMed]
- Dráberová, E.; Dráber, P. A microtubule-interacting protein involved in coalignment of vimentin intermediate filaments with microtubules. J. Cell Sci. 1993, 106, 1263–1273. [Google Scholar] [PubMed]
- Schindelin, J.; Arganda-Carreras, I.; Frise, E.; Kaynig, V.; Longair, M.; Pietzsch, T.; Preibisch, S.; Rueden, C.; Saalfeld, S.; Schmid, B.; et al. Fiji: An open-source platform for biological-image analysis. Nat. Methods 2012, 9, 676–682. [Google Scholar] [CrossRef]
- Rivera, J.; Fierro, N.A.; Olivera, A.; Suzuki, R. New insights on mast cell activation via the high affinity receptor for IgE. Adv. Immunol. 2008, 98, 85–120. [Google Scholar] [CrossRef]
- Ruschmann, J.; Antignano, F.; Lam, V.; Snyder, K.; Kim, C.; Essak, M.; Zhang, A.; Lin, A.H.; Mali, R.S.; Kapur, R.; et al. The role of SHIP in the development and activation of mouse mucosal and connective tissue mast cells. J. Immunol. 2012, 188, 3839–3850. [Google Scholar] [CrossRef] [PubMed]
- Lorenz, U. SHP-1 and SHP-2 in T cells: Two phosphatases functioning at many levels. Immunol. Rev. 2009, 228, 342–359. [Google Scholar] [CrossRef]
- Xiao, W.; Ando, T.; Wang, H.Y.; Kawakami, Y.; Kawakami, T. Lyn- and PLC-β3-dependent regulation of SHP-1 phosphorylation controls Stat5 activity and myelomonocytic leukemia-like disease. Blood 2010, 116, 6003–6013. [Google Scholar] [CrossRef] [PubMed]
- Bohnenberger, H.; Oellerich, T.; Engelke, M.; Hsiao, H.H.; Urlaub, H.; Wienands, J. Complex phosphorylation dynamics control the composition of the Syk interactome in B cells. Eur. J. Immunol. 2011, 41, 1550–1562. [Google Scholar] [CrossRef] [PubMed]
- Kulathu, Y.; Grothe, G.; Reth, M. Autoinhibition and adapter function of Syk. Immunol. Rev. 2009, 232, 286–299. [Google Scholar] [CrossRef]
- Komarova, Y.A.; Vorobjev, I.A.; Borisy, G.G. Life cycle of MTts: Persistent growth in the cell interior, asymmetric transition frequencies and effects of the cell boundary. J. Cell Sci. 2002, 115, 3527–3539. [Google Scholar]
- Sulimenko, V.; Hájková, Z.; Klebanovych, A.; Dráber, P. Regulation of microtubule nucleation mediated by γ-tubulin complexes. Protoplasma 2017, 254, 1187–1199. [Google Scholar] [CrossRef] [PubMed]
- Kundu, S.; Fan, K.; Cao, M.; Lindner, D.J.; Zhao, Z.J.; Borden, E.; Yi, T. Novel SHP-1 inhibitors tyrosine phosphatase inhibitor-1 and analogs with preclinical anti-tumor activities as tolerated oral agents. J. Immunol. 2010, 184, 6529–6536. [Google Scholar] [CrossRef] [PubMed]
- Chen, L.; Sung, S.S.; Yip, M.L.; Lawrence, H.R.; Ren, Y.; Guida, W.C.; Sebti, S.M.; Lawrence, N.J.; Wu, J. Discovery of a novel SHP2 protein tyrosine phosphatase inhibitor. Mol. Pharmacol. 2006, 70, 562–570. [Google Scholar] [CrossRef] [PubMed]
- Zyss, D.; Montcourrier, P.; Vidal, B.; Anguille, C.; Merezegue, F.; Sahuquet, A.; Mangeat, P.H.; Coopman, P.J. The Syk tyrosine kinase localizes to the centrosomes and negatively affects mitotic progression. Cancer Res. 2005, 65, 10872–10880. [Google Scholar] [CrossRef]
- Fargier, G.; Favard, C.; Parmeggiani, A.; Sahuquet, A.; Merezegue, F.; Morel, A.; Denis, M.; Molinari, N.; Mangeat, P.H.; Coopman, P.J.; et al. Centrosomal targeting of Syk kinase is controlled by its catalytic activity and depends on microtubules and the dynein motor. FASEB J. 2013, 27, 109–122. [Google Scholar] [CrossRef] [PubMed]
- Martin-Verdeaux, S.; Pombo, I.; Iannascoli, B.; Roa, M.; Varin-Blank, N.; Rivera, J.; Blank, U. Evidence of a role for Munc18-2 and microtubules in mast cell granule exocytosis. J. Cell Sci. 2003, 116, 325–334. [Google Scholar] [CrossRef] [PubMed]
- Dráberová, L.; Dráberová, E.; Surviladze, Z.; Dráber, P.; Dráber, P. Protein tyrosine kinase p53/p56lyn form complexes with γ-tubulin in rat basophilic leukemia cells. Int. Immunol. 1999, 11, 1829–1839. [Google Scholar] [CrossRef] [PubMed]
- Rubíková, Z.; Sulimenko, V.; Paulenda, T.; Dráber, P. Mast cell activation and microtubule organization are modulated by miltefosine through protein kinase C inhibition. Front. Immunol. 2018, 9. [Google Scholar] [CrossRef]
- Linhartová, I.; Dráber, P.; Dráberová, E.; Viklický, V. Immunological discrimination of β-tubulin isoforms in developing mouse brain. Posttranslational modification of non-class III β-tubulins. Biochem. J. 1992, 288, 919–924. [Google Scholar] [CrossRef] [PubMed]
- Janke, C.; Bulinski, J.C. Post-translational regulation of the microtubule cytoskeleton: Mechanisms and functions. Nat. Rev. Mol. Cell Biol. 2011, 12, 773–786. [Google Scholar] [CrossRef] [PubMed]
- Katsetos, C.D.; Dráberová, E.; Legido, A.; Dráber, P. Tubulin targets in the pathobiology and therapy of glioblastoma multiforme. II. γ-Tubulin. J. Cell Physiol 2009, 221, 514–520. [Google Scholar] [CrossRef] [PubMed]
- Harris, J.; Shadrina, M.; Oliver, C.; Vogel, J.; Mittermaier, A. Concerted millisecond timescale dynamics in the intrinsically disordered carboxyl terminus of γ-tubulin induced by mutation of a conserved tyrosine residue. Protein Sci. 2018, 27, 531–545. [Google Scholar] [CrossRef] [PubMed]
- Teixidó-Travesa, N.; Roig, J.; Lüders, J. The where, when and how of microtubule nucleation - one ring to rule them all. J. Cell Sci. 2012, 125, 4445–4456. [Google Scholar] [CrossRef]
- Kollman, J.M.; Merdes, A.; Mourey, L.; Agard, D.A. Microtubule nucleation by γ-tubulin complexes. Nat. Rev. Mol. Cell Biol. 2011, 12, 709–721. [Google Scholar] [CrossRef]
- Katagiri, K.; Katagiri, T.; Kajiyama, K.; Yamamoto, T.; Yoshida, T. Tyrosine-phosphorylation of tubulin during monocytic differentiation of HL-60 cells. J. Immunol. 1993, 150, 585–593. [Google Scholar] [PubMed]
- Ley, S.C.; Marsh, M.; Bebbington, C.R.; Proudfoot, K.; Jordan, P. Distinct intracellular-localization of Lck and Fyn protein-tyrosine kinases in human T-lymphocytes. J. Cell Biol. 1994, 125, 639–649. [Google Scholar] [CrossRef]
- Jay, J.; Hammer, A.; Nestor-Kalinoski, A.; Diakonova, M. JAK2 tyrosine kinase phosphorylates and is negatively regulated by centrosomal protein ninein. Mol. Cell Biol. 2015, 35, 111–131. [Google Scholar] [CrossRef]
- Macurek, L.; Dráberová, E.; Richterová, V.; Sulimenko, V.; Sulimenko, T.; Dráberová, L.; Marková, V.; Dráber, P. Regulation of microtubule nucleation from membranes by complexes of membrane-bound γ-tubulin with Fyn kinase and phosphoinositide 3-kinase. Biochem. J. 2008, 416, 421–430. [Google Scholar] [CrossRef]
- Herrmann, L.; Dittmar, T.; Erdmann, K.S. The protein tyrosine phosphatase PTP-BL associates with the midbody and is involved in the regulation of cytokinesis. Mol. Biol. Cell 2003, 14, 230–240. [Google Scholar] [CrossRef]
- Wang, J.; Kirby, C.E.; Herbst, R. The tyrosine phosphatase PRL-1 localizes to the endoplasmic reticulum and the mitotic spindle and is required for normal mitosis. J. Biol. Chem. 2002, 277, 46659–46668. [Google Scholar] [CrossRef] [PubMed]
- Boutros, R.; Lobjois, V.; Ducommun, B. CDC25B involvement in the centrosome duplication cycle and in microtubule nucleation. Cancer Res. 2007, 67, 11557–11564. [Google Scholar] [CrossRef]
- Webb, D.J.; Mayhew, M.W.; Kovalenko, M.; Schroeder, M.J.; Jeffery, E.D.; Whitmore, L.; Shabanowitz, J.; Hunt, D.F.; Horwitz, A.F. Identification of phosphorylation sites in GIT1. J. Cell Sci. 2006, 119, 2847–2850. [Google Scholar] [CrossRef]
- Manser, E.; Loo, T.H.; Koh, C.G.; Zhao, Z.S.; Chen, X.Q.; Tan, L.; Tan, I.; Leung, T.; Lim, L. PAK kinases are directly coupled to the PIX family of nucleotide exchange factors. Mol. Cell 1998, 1, 183–192. [Google Scholar] [CrossRef]
- Zhao, Z.S.; Lim, J.P.; Ng, Y.W.; Lim, L.; Manser, E. The GITt-associated kinase PAK targets to the centrosome and regulates Aurora-A. Mol. Cell 2005, 20, 237–249. [Google Scholar] [CrossRef] [PubMed]
- Bagrodia, S.; Bailey, D.; Lenard, Z.; Hart, M.; Guan, J.L.; Premont, R.T.; Taylor, S.J.; Cerione, R.A. A tyrosine-phosphorylated protein that binds to an important regulatory region on the cool family of p21-activated kinase-binding proteins. J. Biol. Chem. 1999, 274, 22393–22400. [Google Scholar] [CrossRef]
- Totaro, A.; Astro, V.; Tonoli, D.; de Curtis, I. Identification of two tyrosine residues required for the intramolecular mechanism implicated in GIT1 activation. PLoS ONE 2014, 9, e93199. [Google Scholar] [CrossRef]
- Feng, Q.; Baird, D.; Yoo, S.; Antonyak, M.; Cerione, R.A. Phosphorylation of the cool-1/β-Pix protein serves as a regulatory signal for the migration and invasive activity of Src-transformed cells. J. Biol. Chem. 2010, 285, 18806–18816. [Google Scholar] [CrossRef] [PubMed]
- Hornbeck, P.V.; Chabra, I.; Kornhauser, J.M.; Skrzypek, E.; Zhang, B. Phosphosite: A bioinformatics resource dedicated to physiological protein phosphorylation. Proteomics 2004, 4, 1551–1561. [Google Scholar] [CrossRef] [PubMed]
- Zhang, L.; Oh, S.Y.; Wu, X.; Oh, M.H.; Wu, F.; Schroeder, J.T.; Takemoto, C.M.; Zheng, T.; Zhu, Z. SHP-1 deficient mast cells are hyperresponsive to stimulation and critical in initiating allergic inflammation in the lung. J. Immunol. 2010, 184, 1180–1190. [Google Scholar] [CrossRef]
- Nakata, K.; Yoshimaru, T.; Suzuki, Y.; Inoue, T.; Ra, C.; Yakura, H.; Mizuno, K. Positive and negative regulation of high affinity IgE receptor signaling by Src homology region 2 domain-containing phosphatase 1. J. Immunol 2008, 181, 5414–5424. [Google Scholar] [CrossRef] [PubMed]


© 2019 by the authors. Licensee MDPI, Basel, Switzerland. This article is an open access article distributed under the terms and conditions of the Creative Commons Attribution (CC BY) license (http://creativecommons.org/licenses/by/4.0/).
Share and Cite
Klebanovych, A.; Sládková, V.; Sulimenko, T.; Vosecká, V.; Rubíková, Z.; Čapek, M.; Dráberová, E.; Dráber, P.; Sulimenko, V. Regulation of Microtubule Nucleation in Mouse Bone Marrow-Derived Mast Cells by Protein Tyrosine Phosphatase SHP-1. Cells 2019, 8, 345. https://doi.org/10.3390/cells8040345
Klebanovych A, Sládková V, Sulimenko T, Vosecká V, Rubíková Z, Čapek M, Dráberová E, Dráber P, Sulimenko V. Regulation of Microtubule Nucleation in Mouse Bone Marrow-Derived Mast Cells by Protein Tyrosine Phosphatase SHP-1. Cells. 2019; 8(4):345. https://doi.org/10.3390/cells8040345
Chicago/Turabian StyleKlebanovych, Anastasiya, Vladimíra Sládková, Tetyana Sulimenko, Věra Vosecká, Zuzana Rubíková, Martin Čapek, Eduarda Dráberová, Pavel Dráber, and Vadym Sulimenko. 2019. "Regulation of Microtubule Nucleation in Mouse Bone Marrow-Derived Mast Cells by Protein Tyrosine Phosphatase SHP-1" Cells 8, no. 4: 345. https://doi.org/10.3390/cells8040345