
Assessment of Carrot Production System Using Biologically Active Compounds and Metabolomic Fingerprints


1
Department of Food Analysis and Nutrition, University of Chemistry and Technology, Faculty of Food and Biochemical Technology Prague, Technická 5, 166 28 Prague, Czech Republic
2
Department of Horticulture, Czech University of Life Sciences, Faculty of Agrobiology, Food and Natural Resources, Kamycka 129, 165 21 Prague, Czech Republic
3
Institute of Microbiology of the Czech Academy of Sciences, Videnska 1083, 142 20 Prague, Czech Republic
*
Author to whom correspondence should be addressed.
Agronomy 2022, 12(8), 1770; https://doi.org/10.3390/agronomy12081770
Submission received: 28 June 2022
/
Revised: 19 July 2022
/
Accepted: 22 July 2022
/
Published: 28 July 2022
(This article belongs to the Special Issue Bioactive Substances with Antioxidant Properties in Agricultural Products)
Abstract
:Carrot is the most important root vegetable plant produced worldwide, consumed as a food source rich in bioactive compounds. The purpose was to investigate the effect of different farming conditions on the content of those compounds in the roots of Afalon and Cortina carrot cv. and to use metabolomic fingerprinting for the authentication of the carrots. Carotenoids and ascorbic acid (AA) were detected and quantified using the LC method. The characterization and classification of carrot samples according to the production system, variety and plant density were performed using UHPLC-Q-TOF-MS. The metabolomic fingerprints/profiles were measured in positive and negative ionization mode on a reversed-phase analytical column, and the data were processed using the relevant statistical tools. The respective AA levels in Afalon and Cortina were 217–291 and 318–514 mg.kg−1 dry biomass. The main carotenes were β- and α-carotene whose ratio in Afalon and Cortina was 1.3 and 1.2, respectively. A set of 19 compounds detected by UHPLC-Q-TOF-MS, selected on the basis of their importance for statistical distribution into individual groups representing a farming system, cultivar, or seeding density, was established and used for the authentication of the carrot samples. These compounds included various saccharides, phenolics, and lipids with antioxidant, anti-inflammatory, anticancer, and antibiotic activities. The metabolomic data obtained were used for the verification of the farming system in which the carrots were grown.
1. Introduction
Carrot (Daucus carota L.) is a root vegetable widely produced in the world that serves as an important source of dietary fiber and common nutrients, such as sugars and minerals, and of various bioactive compounds, including ascorbic acid (AA), carotenes, phenolics, and polyacetylenes, for the human diet [1]. In the Czech Republic, the carrot belongs to the main vegetable products, representing more than 7% of the total vegetable sowing surface [2]. A number of review papers on carrot have covered the effect of various preharvest factors, such as genetic background, soil and climatic conditions, farming conditions, nitrogen level, fertilization, pest attacks, etc., that influence the quality characteristic of the vegetable [3,4].
The demand for organically grown vegetables has recently increased on the market and this trend will probably continue as organic products are believed to be of better quality and taste, containing high amounts of health-beneficial compounds, smaller levels of nitrite, and no residues of pesticides [3,5,6,7]. On the contrary, conventional production aims at maximal crop yields and economic efficiency, using industrial fertilizers and pesticides [8]. Regarding carrots, it was found that the amount of nitrite was greatly decreased in organic production, while the content of AA was only slightly decreased, and the differences between the levels of β-carotene, polyacetylenes, and phenolics in organically and conventionally grown carrots were not significant [9,10,11,12]. In this work, the integrated farming system was also designed to produce high-quality vegetables using available ecological methods that sought to minimize the supply of agrochemicals [13].
AA, carotenoids, and phenolics belong to compounds with health-promoting effects due to their antioxidant activity [14]. Different carrot cultivars show broad ranges of AA, carotenoid, and phenolic contents varying between about 20–800 mg.kg−1 DW biomass, 150–400 mg.kg−1 FW biomass, and 160–1020 mg.kg−1 FW biomass, respectively [15,16,17,18,19,20]. The contents of β- and α-carotenes were reported to be highly cultivar-dependent [21,22]. Generally, high rates of nitrogen fertilization were shown to have adverse effects on the content of AA but increased the levels of carotenoids in carrot [3,23,24,25]. The amount of phenolics in carrots was found to vary broadly depending on the cultivar but was quite stable in different farming systems [22,26]. Carrot contains mainly hydroxycinnamic acids and their derivatives, of which chlorogenic acid as a major component represents 42–62% of the total phenolic compounds [14].
Other biologically active compounds present in carrot that improve human health comprise polyacetylenes exhibiting antitumor, anti-inflammatory, antibacterial, and antifungal effects. Falcarinol, falcarindiol, and falcarindiol-3-acetate are the main polyacetylenes found in carrot roots [4,27,28,29]. The amount of polyacetylenes was found to be cultivar-dependent. Their content was affected by the chemical composition of soil, namely by low concentrations of P, Mg, and Ca, but the differences between the organic and conventional carrots were not significant [26,30,31,32]. The carrot was reported to also be a source of ferulic acid that exhibits antimicrobial and health-beneficial properties [33,34]. 6-methoxymellein (6-MM), a biologically active phytoalexin, is accumulated in carrot roots and leaves in response to a fungal infection and is also considered to have anticancer properties [35,36,37]. Its presence has been associated with abiotic stress [38,39].
The quality control and the authenticity of food has become an urgent matter. An objective assessment of a product quality based on good scientific knowledge is needed. The advantage of using metabolomics for food authentication consists of its untargeted nature that enables us to detect changes in a typical metabolic profile resulting from inappropriate production practices [40]. Metabolite fingerprinting approaches have been repeatedly used to investigate differences in crops produced in organic and conventional farming systems, including various cereals, vegetables, or fruits [41,42,43,44,45]. The results were inconclusive as in some studies only small differences were detected [44], whereas in others, significant differences were found, e.g., [41,42]. Major influences of the crop year and cultivar on the metabolic profile were reported [44,46]. In the case of carrot, the production year was the most important source of variation in the crop metabolome [47]. The results indicated that the farming system had a systematic influence on the metabolome of carrots. Using the Orthogonal Partial Least Squares Discriminant Analysis (OPLS-DA) based on LC-MS detection, the carrot samples could be classified according to the farming system and the origin of unknown samples could be predicted. The method was able to classify unknown samples harvested within each crop year, achieving 100% correctness [47].
The aim of our study was to investigate the influence of farming conditions on the levels of bioactive compounds in carrots. Two carrot varieties, Afalon and Cortina, were grown under organic, integrated, and conventional conditions in one locality, using two different planting densities of 6 × 10⁵ and 9 × 10⁵ seeds per hectare. Biologically active compounds such as carotenoids and ascorbic acid were quantified using LC-based techniques and expressed as the dry matter content. The study focused on assessing the utilization of metabolomic fingerprinting/profiling for the authentication of carrots. The characterization and classification of the carrot samples according to their production system, variety, and plant density were carried out using Ultra-High-Performance Liquid Chromatography coupled to a Quadrupole–Time-of-flight Mass Spectrometer (UHPLC-Q-TOF-MS). The metabolomic fingerprints/profiles were measured in positive and negative ionization mode on a reversed-phase analytical column. To calculate the statistical models, the obtained data were processed using the relevant statistical tools (PCA, PLS-DA, and OPLS-DA models).
2. Materials and Methods
2.1. Biological Material
In the study, two carrot (Daucus carota subsp. sativus) cultivars (cvs.), Afalon and Cortina, were used. Afalon F1 is a semi-late hybrid cv. of the transition type, suitable for mechanized harvest, whose vegetation time is 115–120 days. Cortina F1 is a late hybrid cv. of the Flakkee type, suitable for mechanized harvest, whose vegetation time is 150–160 days. Both cvs. are widely used for commercial production of carrot in the Czech Republic and wider eastern Europe.
2.2. Farming Conditions
The experiments were conducted in the experimental station of the Czech University of Life Sciences in Prague-Troja (Czech Republic). The locality has an altitude of 195 m above sea level and is characterized by dry, medium-warm climatic conditions with a soil classified as modal fluvisol (pH 6.9).
The conventional system (conv) used the following fertilization conditions: 180 kg of nitrogen per ha (urea before seeding 80%, ammonium nitrate with limestone after sprouting 20% (LAV, Agro CS, Říkov, Czech Republic)). Chemical protection was (per ha): STOMP—pendimethalin (BASF AG, Agricultural Products, Ludwigshafen/Rhein, Germany), 2 L; GARLAND FORTE—propaquizafop (Dow AgroSciences, Prague, Czech Republic), 1 L; ORTIVA—azoxystrobin (Syngenta Limited, Cambridge, UK), 1 L; FUNGURAN—OH 50 WP (Spiess Urania Chemicals GmbH, Hamburg, Germany); PIRIMOR 50 WG—pirimicarb (Syngenta Supply AG, Basel, Switzerland), 1 kg.
The integrated system (int) used the following fertilization conditions: 120 kg nitrogen per ha (urea before seeding 80%, ammonium nitrate with limestone after sprouting 20% (LAV, Agro CS, Říkov, Czech Republic)). Chemical protection was (per ha): STOMP (BASF AG, Agricultural Products, Ludwigshafen/Rhein, Germany), 3.5 L; ORTIVA—azoxystrobin (Syngenta Limited, Cambridge, UK), 1 L; and PIRIMOR 50 WG—pirimicarb, 0.5 kg.
The organic system (org) used no chemical protection, and the fertilization conditions included the use of 42 kg nitrogen per ha in the form of Organica (LAV, Agro CS, Říkov, Czech Republic) organic fertilizer.
In the experimental plots, the sowing densities were 6 × 10⁵ (LD) and 9 × 10⁵ (HD) seeds ha−1. The latter density is commonly used for commercial production, whereas the former was used for comparison to achieve better light conditions and a reduced level of natural humidity in the plant cover. Each cultivar in every crop system was grown in four replicates. The size of the experimental plot for each replicate was 9 m2. From each replicate, three carrot roots were collected, which made (per variant) 3 roots × 4 replicates = 12 roots. This was applied for each cultivar and each crop system.
2.3. Chemical Analyses
2.3.1. AA Analysis
The AA content in biomass was measured using a modified method of [48]. An amount of 30 g of fresh carrot biomass was extracted with 60 mL of metaphosphoric acid (Fluka, Germany) (3%; w/w) by homogenization in a laboratory blender (Ultra-Turrax IKA-T10 basic, IKA, Staufen, Germany) at laboratory temperature. The homogenate was filtered, adjusted to a volume of 100 mL, and filtered again (5 μm membrane filter, Chromservis, Prague, Czech Republic) into vials. AA was detected using HPLC with UV detector (liquid chromatograph HP 1200 with DAD detector, Agilent Technologies, Santa Clara, CA, USA). LiChroCART, LiChrospher 100 RP-18 (Merck, Darmstadt, Germany) chromatographic column (125 × 4 mm; particle size 5 μm) with guard column (4 × 4 mm; particle size 5 μm) was used with a mobile phase containing 5% methanol (gradient grade, Sigma-Aldrich, Taufkirchen, Germany) (V/V), pH = 3 (ortho-phosphoric acid, Lachner, Neratovice, Czech Republic), and deionized water (18 MΩ cm, Milli-Q system, Millipore, Darmstadt, Germany). The other conditions were: flow rate 0.8 mL min−1, temperature 35 °C, injection volume 5 μL. The UV detection was carried out at 244 nm.
The identification of AA in the samples was carried out by comparing the retention time with that of the standard (L-ascorbic acid, Sigma Aldrich, Steinheim, Germany, purity ≥ 99%). For quantification, an external calibration curve was used. The characteristics of the method were the following: repeatability expressed as RSD 5%, recovery 95%, and LOQ 0.15 mg kg−1 dry weight (DW).
Dry carrot biomass was determined by drying at 105 °C for 5 h and used to express the AA and carotene contents per g dry mass.
2.3.2. Carotene Analysis
The α- and β-carotene content was analyzed in fresh carrot samples using a modified method of Bhave et al. [49]. Carotenes were extracted by an ethanol/hexane mixture (1:1; v/v) containing 0.2% BHT and annealed sodium sulfate (Lachner, Neratovice, Czech Republic) (3 g per 1 g of biomass) under shaking (30 min) followed by centrifugation (10,000 rpm, 5 min). Ethanol and n-hexane were purchased from Merck, Darmstadt, Germany, and BHT was purchased from Sigma-Aldrich, Taufkirchen, Germany. The upper hexane layer was removed and the ethanolic portion was re-extracted with hexane three times. The combined hexane extracts were evaporated at 30 °C (Büchi Labortechnik AC, Nettetal, Germany) and the dry residue dissolved in an acetone/ethanol (4:6; v/v) mixture containing 0.2% BHT and subsequently filtered (0.22 μm centrifugation PTFE microfilters, Chromservis, Prague, Czech Republic) into a vial. The samples were protected against light during extraction, stored in dark vials, and analyzed immediately after extraction.
An Agilent Technologies 1200 HPLC with DAD detector (liquid chromatograph HP 1200, Agilent Technologies, Santa Clara CA, USA) device equipped with a visible-light photodiode-array detector was used to analyze the samples. The chromatographic separation was carried out using an analytical column Poroshell 120 EC-C18 100 × 2.1 mm; particle size 2.7 µm at a column temperature of 30 °C. The mobile phases were (A) water and (B) methanol (MeOH) with gradient elution and a flow rate of 0.5 mL.min−1. The DAD measurements were recorded in the UV and visible regions (190 to 800 nm), with the quantification at 450 nm for α- and β-carotene and 444 nm for lutein.
The β-carotene (purity ≥ 99%, Sigma-Aldrich, Taufkirchen, Germany) and lutein (purity ≥ 95%, Labicom, Czech Republic) standards were prepared by dissolving an amount of 4–5 mg in 25 mL of an acetone/ethanol (4:6, v/v) mixture containing 0.2% BHT and the solution was used for preparation of a calibration curve in the range of 0.2–20 μg.mL−1. The LOQ was 1.5 mg.kg−1. The method was validated, and the repeatability expressed as the relative standard deviation (RSD was 5% for α- and β-carotene, 3% for lutein, calculated from 6 parallel measurements). Due to the instability of carotenoids, a fresh standard was prepared prior to each measurement and protected against light. The α-carotene content was quantified using the β-carotene standard.
2.3.3. Metabolomic Fingerprinting
An amount of 5 g of the homogenized sample was extracted with 5 mL of a solvent (methanol for polar compounds and ethylacetate for less polar compounds extraction (both were from Sigma-Aldrich, Prague, Czech Republic)) under vigorous shaking for 2 min and subsequently centrifuged (10,000 per min, 5 min, 5 °C; Rotina 38R, Hettich Zentrifugen, Tuttlingen, Germany). The upper layer was filtered through a 0.22 µm PTFE microfilter prior to LC-MS analysis.
The UHPLC–Q-TOF-MS analyses were performed using an Acquity Ultra-Performance LC system coupled to a Synapt G2 HD spectrometer (Waters, Milford, MA, USA). The LC separation was performed by an Acquity UPLC® BEH C18 column (100 × 2.1 mm; particle size 1.7 µm; Waters, Milford, MA, USA). The mobile phase consisted of A) 10 mM ammonium formate in Milli-Q water and B) 10 mM ammonium formate in methanol. The gradient started at 95% A and linearly changed to 95% B in 8 min and was held for the next 4 min, and the initial conditions were set for the last 3 min to allow column reconditioning. The flow rate was 0.4 mL.min−1 and 3 µL were injected into the system.
The Synapt G2 HD instrument was operated in both negative and positive electrospray ionization (ESI) mode. The parameters settings used during the measurements were as follows: capillary voltage (±700 V), cone voltage (±25 V), source temperature (120 °C), and desolvation temperature (350 °C). Nitrogen was used as both desolvation and cone gas at a flow rate of 800 and 10 L.h−1, respectively. The data were acquired in MSE acquisition mode, both the full MS and MS/MS fragmentation mass spectra were acquired in the range m/z 100–1200. In order to diminish any possible time-dependent changes in the UHPLC-MS chromatographic fingerprints, the sequence of the samples was randomized, and one sample was chosen as a quality control sample, which was injected after every set of 24 samples. A processing blank was prepared together with samples and analyzed for the exclusion of the co-extracted compounds during sample preparation (e.g., plasticizers from plastic cuvettes, etc.). MassLynx 4.1 software (Waters, USA) was used for data acquisition and its application manager MarkerLynx was used for data mining and pre-processing.
2.3.4. Chemometric Analysis
From the UHPLC-MS data, markers were chosen automatically by the MarkerLynx software. The raw data in the form of absolute peak intensities (heights) were normalized using the constant row sum, i.e., each variable was divided by the sum of all variables for each sample. This procedure transformed all the data to a uniform range of variability.
The SIMCA v. 16.0.1. software (Sartorius, Goettingen, Germany) was then used for multivariate data analysis. Pareto scaling (square root of the standard deviation is used as the scaling factor) was applied prior to the analysis.
The Principal Component Analysis (PCA) was employed as an unsupervised chemometric technique for the first view into data structure; Partial Least Squares Discriminant Analysis (PLS-DA) and Orthogonal Partial Least Squares Discriminant Analysis (OPLS-DA) were used as a supervised technique for the classification of samples according to their classes (variety, farming system, and seeding density). Variables important for separation were selected and a tentative identification was suggested. The model performance was expressed by the R2(X) parameter, known as ‘goodness of fit’, and by the Q2, the predictive ability parameter. Both parameters were calculated using a 7-fold internal cross-validation by SIMCA software.
3. Results and Discussion
3.1. Content of AA and Carotenoids
The organic, integrated, and conventional farming systems were used at one locality to avoid different climate and soil conditions. The systems differed in the amounts of nitrogen used and in the application of pesticides (see Section 2.2). The respective values of dry biomass of Cortina and Afalon cv. grown in the three farming systems fluctuated between 11.1 and 13.0% (w/w), with a higher average content in Cortina (12.5%) in comparison with Afalon (11.8%). The data are comparable with our previous study [50] and also with the study by [51] where the dry matter content of fresh carrots in two consecutive years was around 12% (w/w). Bioactive compounds in carrots were detected and their amounts measured using LC-based techniques with DAD detection and expressed as dry matter content.
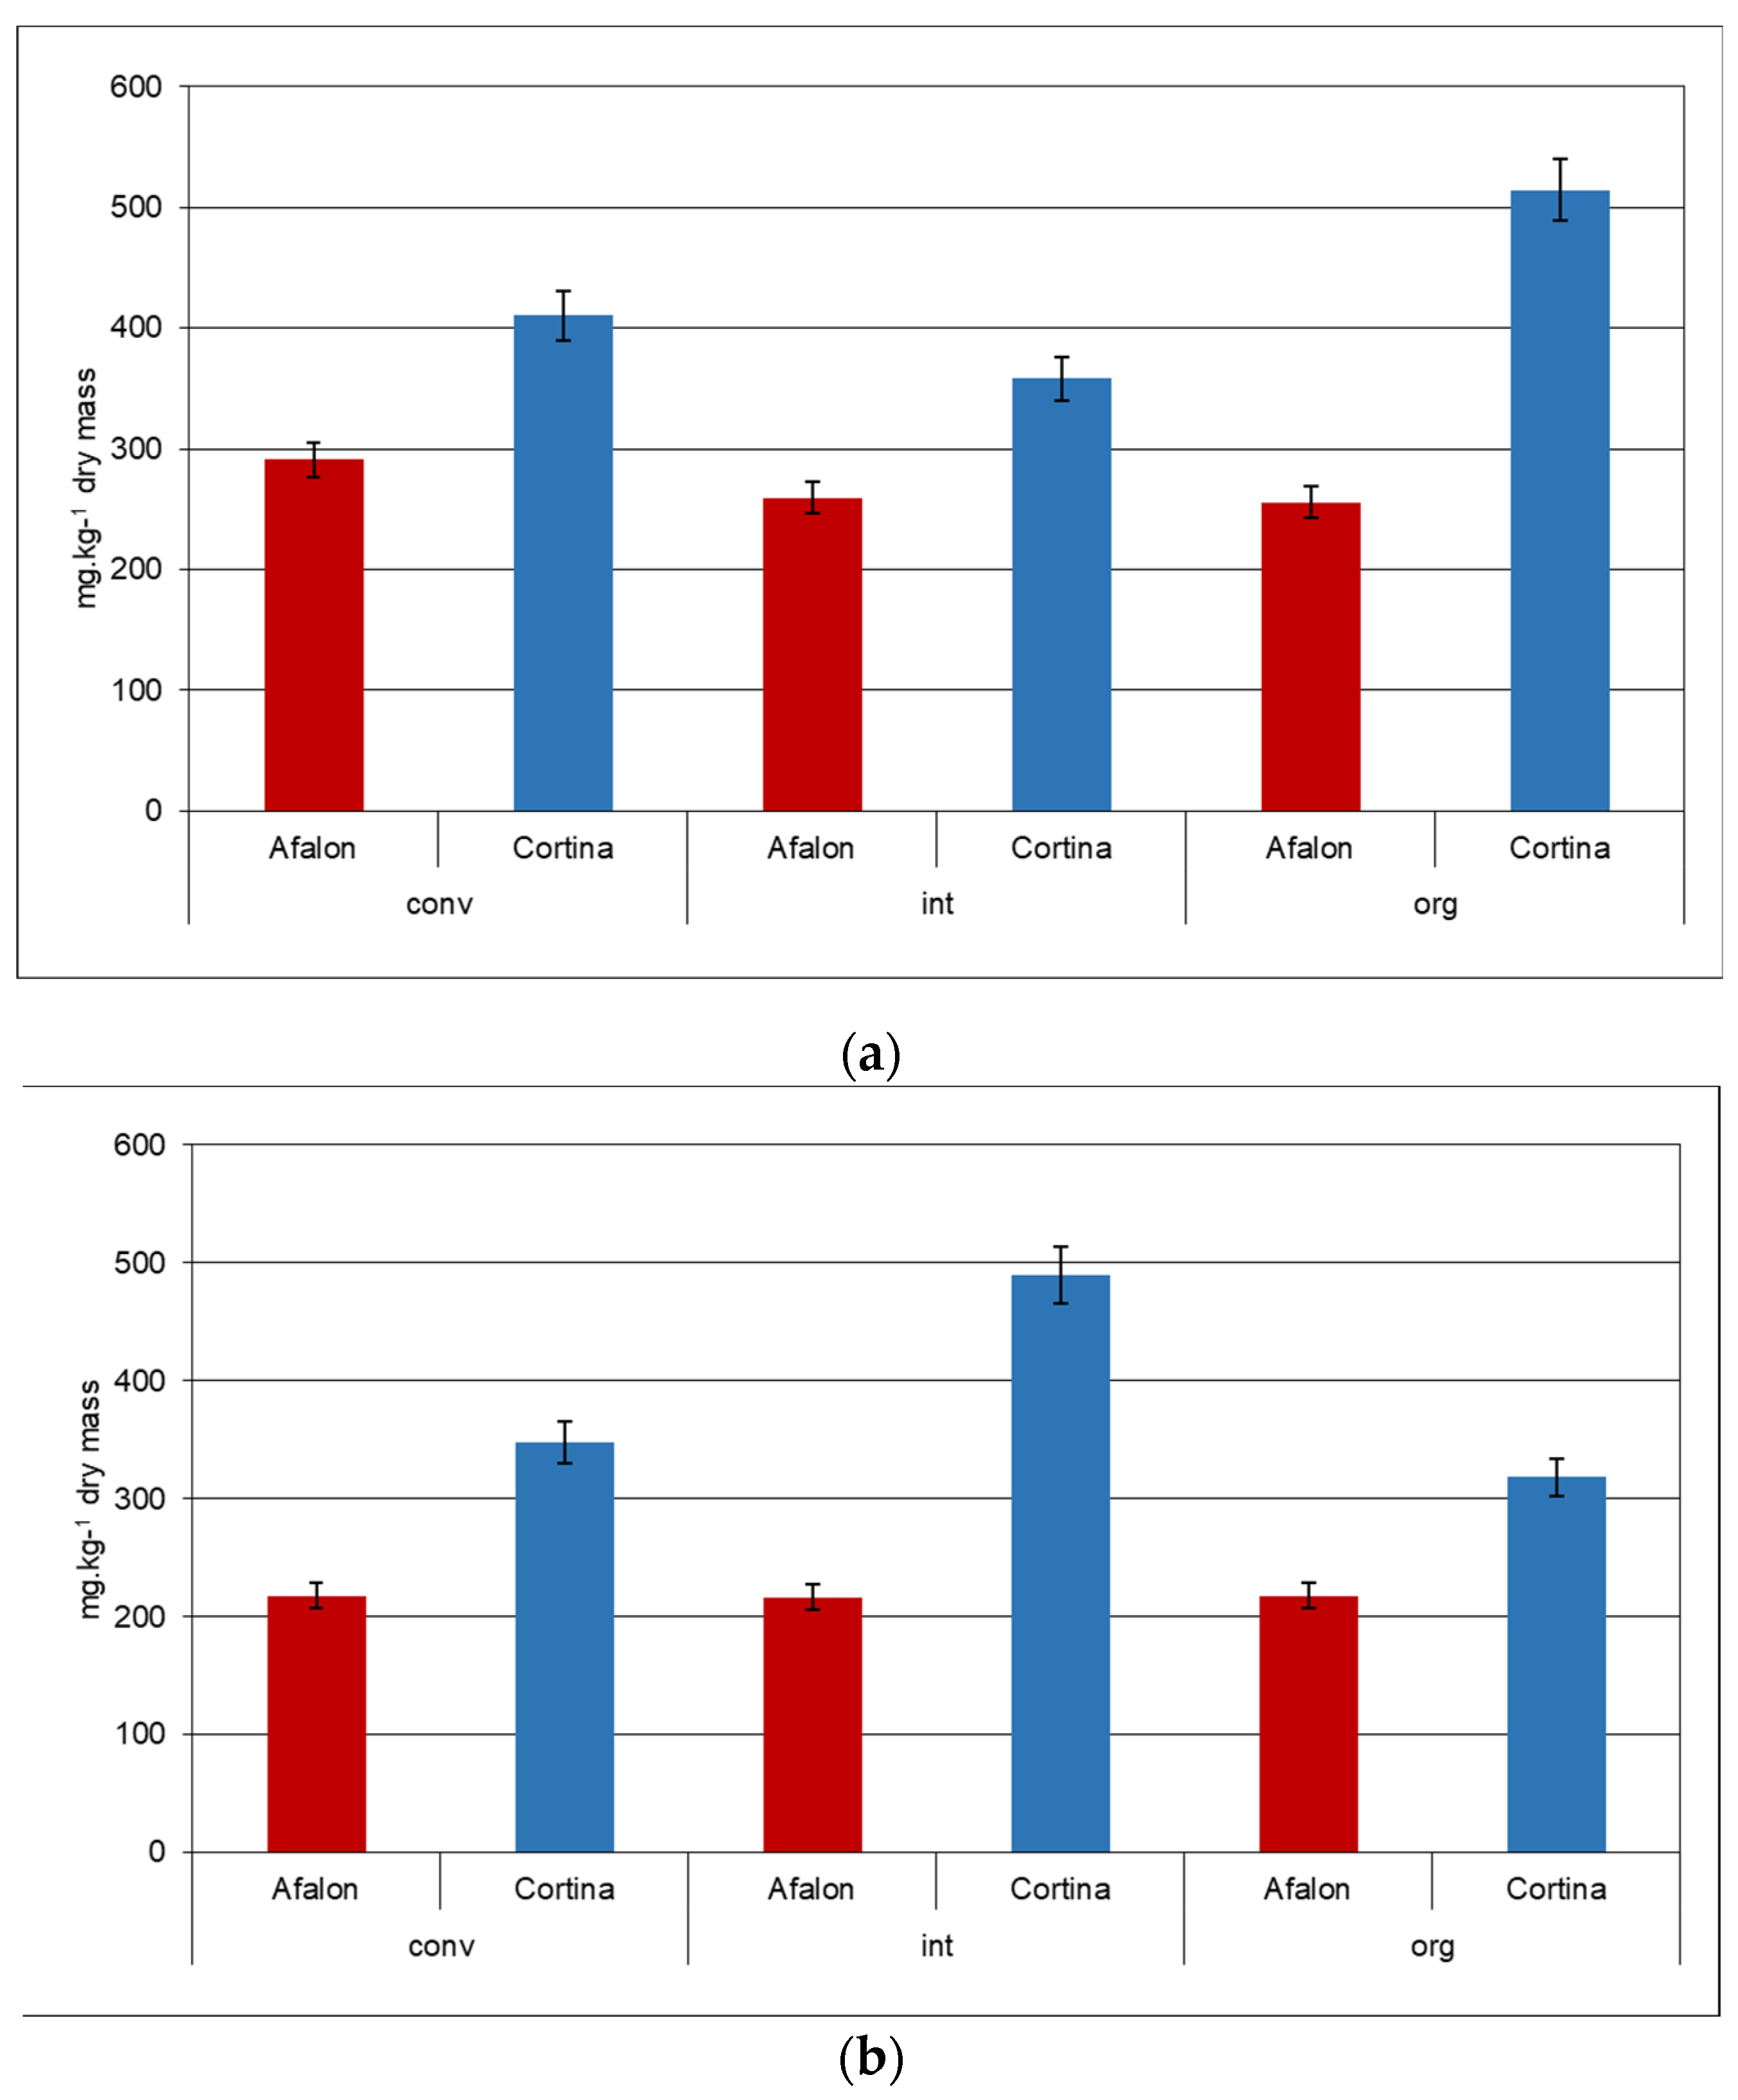
The AA content was highly cultivar-dependent; higher AA levels were found in Cortina compared to Afalon cv., regardless of the farming system and the seed density applied (Figure 1a,b). On average, a higher content of AA was determined in the former cultivar by up to 40%, and the differences between the cultivars were statistically significant (α = 0.05). The AA levels were similar to the values reported by Alasalvar et al. [22] (444 mg/kg DW) and Gamboa-Santos et al. [52] (356 mg/kg DW). Nitrogen fertilization used at a high rate has repeatedly been reported to decrease the AA amounts in vegetables, such as carrot, tomatoes, broccoli, and cauliflower [23,25,53]. In our case, where N concentrations ranged between 42 and 180 kg.ha−1, no adverse effect of a high N concentration on the AA content was observed in either cultivar. Generally, a slightly higher AA content was recorded in the samples grown at a lower planting density (Figure 1a,b). A low variability of AA levels between various farming systems was observed in Afalon. The highest AA levels of about 514 mg.kg−1 DW were measured in the Cortina samples in the organically produced carrot grown at 6 × 10⁵ seed density and in the integrated system-produced carrot grown at 9 × 10⁵ seed density (Figure 1a,b).
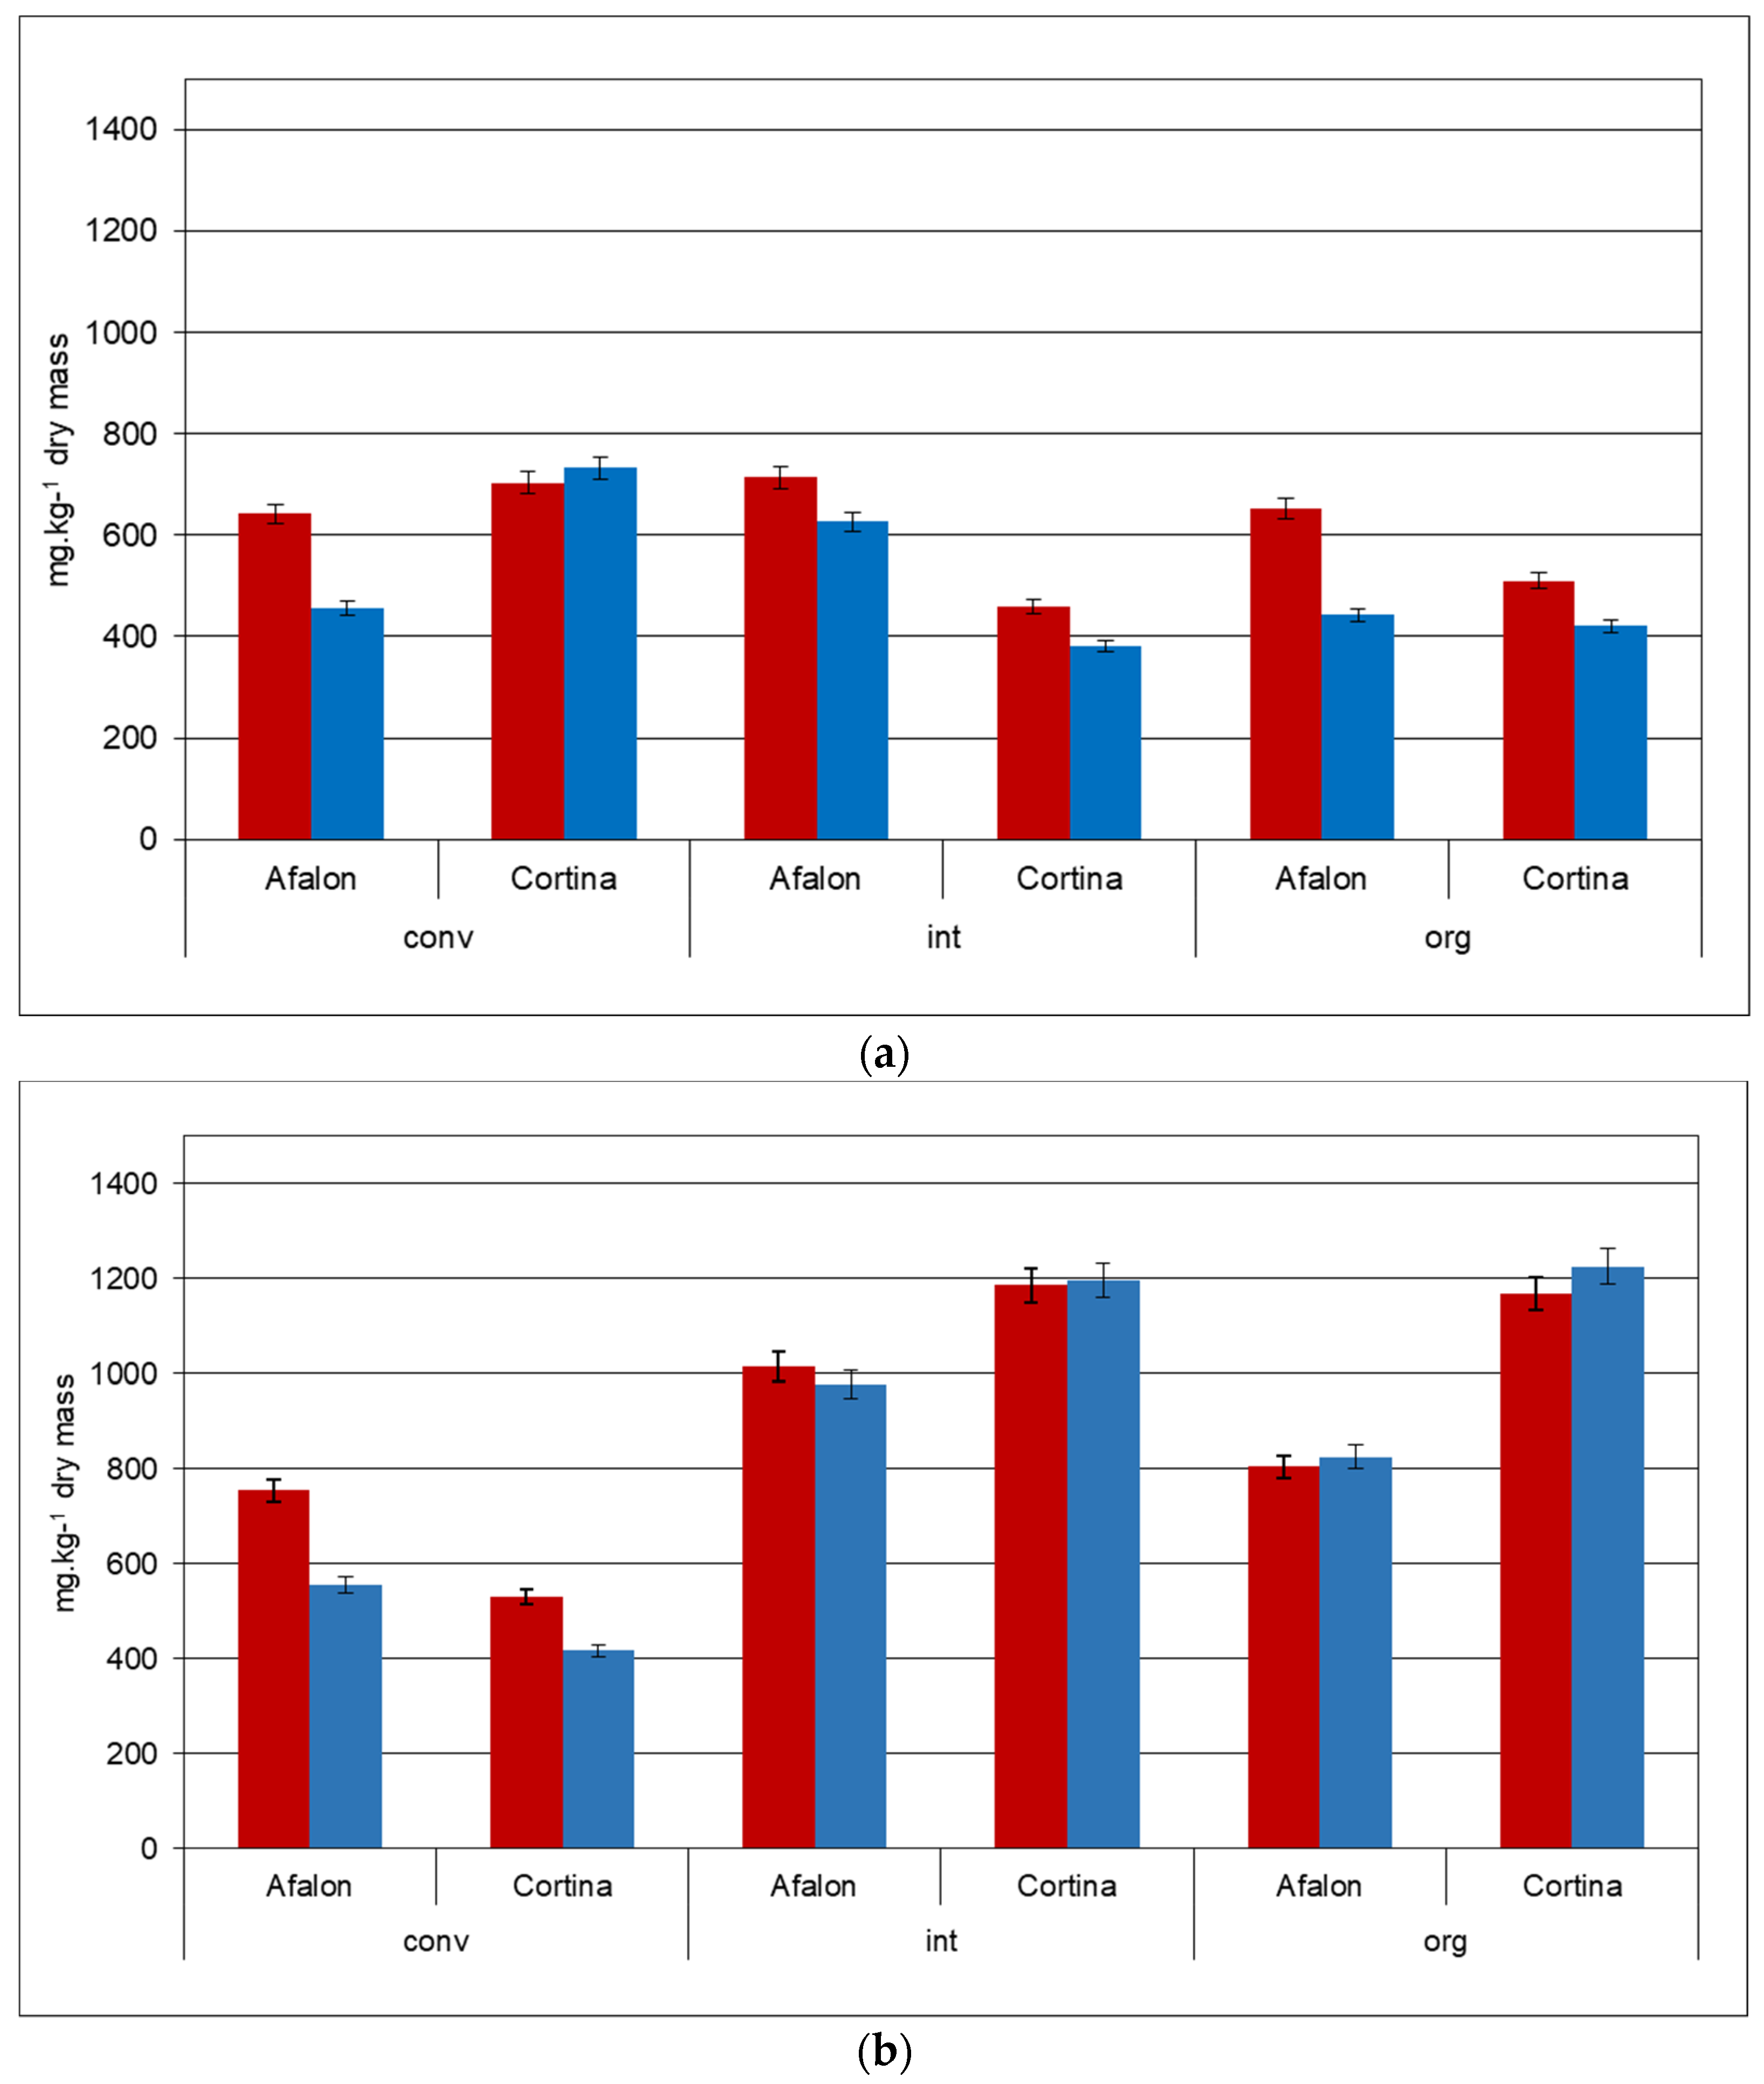
The main carotenoids measured in the carrot samples of both cultivars were β-carotene (469–714 mg.kg−1 DW) and α-carotene (382–733 mg.kg−1 DW); only low levels of lutein (4.8–8.0 mg.kg−1 DW) were detected. The ratios of β- to α-carotene in Afalon and Cortina cv. were in the range of 1.3 and 1.2, respectively (Figure 2a,b). Some previous studies showed that increased rates of nitrogen fertilization in the range of 0 to 640 kg N.ha−1 had a positive effect on the carotene levels in carrot [54,55]. On the contrary, Smoleň and Sady [17], working with the Kazan F1 carrot cv. and using nitrate or ammonia N-sources, documented that an increase in the range of 70–140 and 70–210 kg N.ha−1, respectively, resulted in a negligible effect on the total carotene levels monitored in the crop year period of 2003–2005. Boskovic-Rakocevic et al. [25] reported an increase of 1.2- and 1.3-fold in Nantes carrot cv. in crop years 2005 and 2006, when the N-fertilization rate was increased from 0 to 180 kg N.ha−1. They concluded that an increase in carotene content was linked with the increasing N-fertilization.
In our study, such an effect was observed in Afalon cv., where the carotene content was raised 1.3-fold when comparing the carrot grown in the organic (42 kg N.ha−1) and integrated (120 kg N.ha−1) farming systems at both seeding densities. In Cortina cv., this trend was observed only at a seeding density of 6 × 10⁵ where the carotene content increased 1.6-fold, when comparing the carotene contents obtained in the organic (42 kg N.ha−1) and conventional (180 kg N.ha−1) farming systems (Figure 2a). In the integrated farming system using 120 kg N.ha−1, the carotene level of Cortina cv. remained at a low level observed in the organically grown carrot (Figure 2a).
When the seeding density of 9 × 10⁵ seeds.ha−1 was used, the production of total carotene in the conventional system was reduced compared to the other two farming systems in both cultivars (Figure 2b). Thus, the results demonstrated the effect of both the cultivar and seeding density on the carotene synthesis and accumulation.
3.2. Metabolomic Fingerprinting
The carrot samples were characterized and classified according to their production system, variety, and plant density by untargeted metabolomics using UHPLC–Q-TOF-MS with data-independent acquisition. This method of data acquisition, the so-called MSE, provides exact-mass precursor and fragment mass spectra for every detectable component in the sample extract, and this is very useful for compound identification. Furthermore, a retention time obtained by the reversed-phase chromatographic separation gave additional information about the hydrophobicity of the detected compounds.
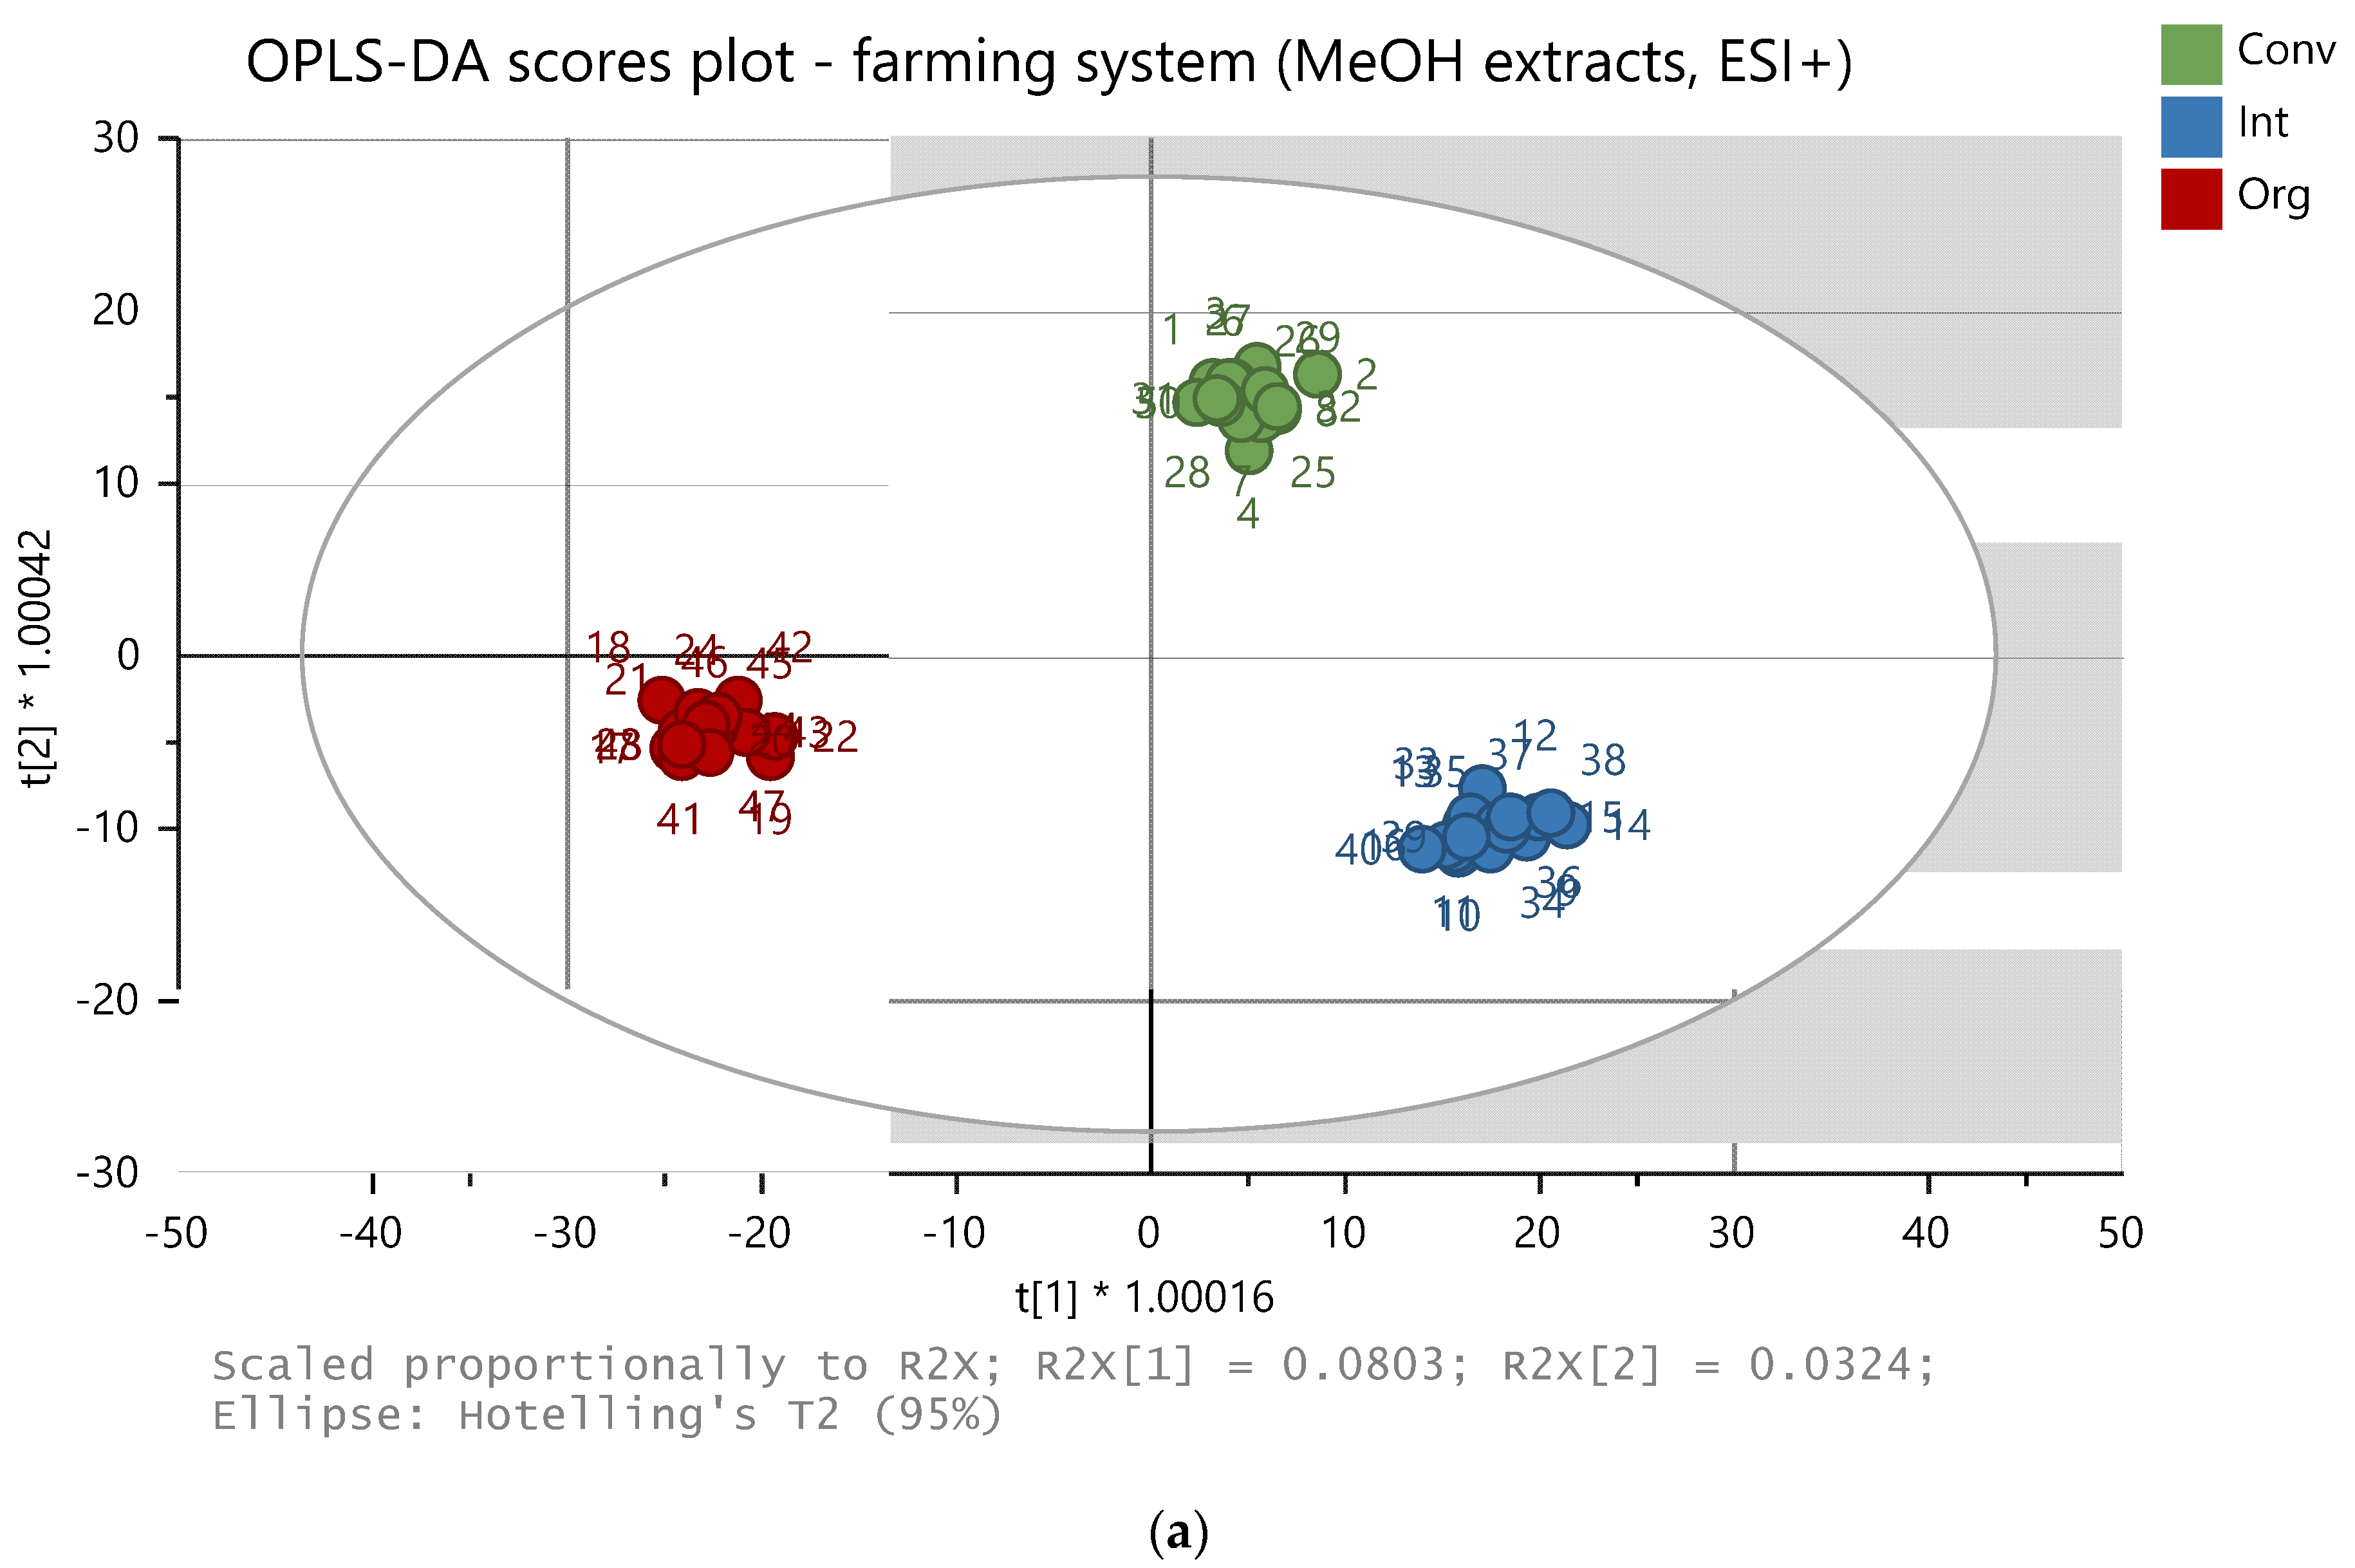
For the methanolic extract, 216 and 38 features (ions defined by their exact mass and retention time) were chosen as variables for the data processing in positive and negative mode, respectively. For the ethylacetate extracts, 1274 and 125 features were chosen in the positive and negative mode, respectively. The carrot samples were successfully differentiated according to the farming system, cultivar, and the seeding density used by the application of a non-target analysis using the statistical models PLS-DA and OPLS-DA. Examples of the OPLS-DA plots are presented in Figure 3a–c for the farming system, variety, and planting density, respectively. The model performance parameters are listed in Table 1; a better classification of the samples was observed for the methanolic extracts in the positive ionization mode. The metabolomic profiles were mostly influenced by variety.
Identification of Important Ions
The identification of the characteristic ions was suggested according to their exact mass, isotopic profile, and fragmentation spectra obtained by the acquisition in MSE mode, which were compared with those included in the databases Metlin, PubChem, and mzCloud. The compounds were selected on the basis of their importance for the (O)PLS-DA distribution into the individual groups, representing the farming system, the cultivar, or the seeding density (Variable Importance for the Projection; VIP), and were used for the authentication of carrot samples. The identified compounds are listed in Table 2 and Table 3 for methanolic and ethylacetate extracts, respectively. Most of them were important for the sample discrimination; the importance of the markers for the individual above-mentioned groups is summarized in the last column, referred to as ’Importance for Group’, i.e., the marker showing a higher intensity in the respective group. The identification was revealed based on the literature [29,56,57] and on the results obtained in our previous study [50]. The compounds included various saccharides, polyphenolic compounds, and lipids. Many of them were compounds with important biological activities, e.g., antioxidants (chlorogenic acid and ferulic acid), anti-inflammatory and anticancer activity (chlorogenic acid, ferulic acid, falcarinol/falcarindiol, and apiole), antibiotic activity (ferulic acid, octadecanoic acid, falcarinol/falcarindiol and apiole), and pesticide activity (falcarinol/falcarindiol), or were found to contribute to the plant resistance to fungal pathogens (linolenic acid) [37,58,59,60,61,62].
The effect of the farming system on the synthesis and accumulation of biologically active compounds included in the metabolomic fingerprinting was best demonstrated on the levels of 6-MM and apiole, metabolites with antimicrobial properties [1,36,37], whose amounts were characteristically increased in Afalon cv. in the integrated production system, compared to the organic and conventional system levels. In Cortina cv., the amounts accumulated in the carrot roots also differed between the individual production systems but were strongly affected by the seeding density.
The most important compounds that differentiated the two cultivars studied were falcarinol (RT = 8.70; m/z = 245.1901 [M + H]+; higher in Cortina), trihydroxyoctadecenoic acid (RT = 5.77; m/z = 353.2300 [M + Na]+/329.2322 [M − H]−; higher in Afalon), and the compound with the formula C18H24O12 (RT = 2.17; m/z = 433.1343 [M + H]+/431.1201 [M − H]−; higher in Cortina). This compound was identified as Licoagroside B, although it was not previously identified in carrot. However, the fragment spectra match those in the PubChem database and in the literature [63,64]. Chevalier et al. [65] also reported this compound as a discriminating factor for carrot varieties; however, the authors reported only the molecular formula without further identification. In Cortina, the effect of the seeding density was rather low, but it was much more pronounced in the Afalon, where higher levels of Licoagroside B were detected at the higher seeding density.
The effect of seeding density was clearly demonstrated for the falcarinol levels in both cultivars. The levels of eremofrullanolide and ferulic acid were also strongly affected by the seeding density in both cultivars and in all the farming systems used. The amount of the former compound was cultivar-dependent, being higher in Cortina cv. in all the farming systems. Interestingly, in terms of the level of eremofrullanolide in both cultivars, the effect of the seeding density was different in the conventional system compared to the integrated and organic systems. In the conventional system, the higher density of 9 × 10⁵ resulted in higher amounts of eremofrullanolide in contrast to the other two farming systems, where the trend was the opposite. The effect of the seeding density on the levels of ferulic acid was similar in both cultivars in the integrated and organic farming systems; the lower seeding density increased the level of ferulic acid in the integrated system but suppressed it in the organic system.
4. Conclusions
The effect of various farming conditions on the quality of carrots using two carrot varieties was investigated in organic, integrated, and conventional farming systems. The AA content was highly cultivar-dependent, regardless of the farming system and the seeding density. An increase in carotene content with increasing N-fertilization was observed; however, the synthesis and accumulation of carotenes were strongly affected by both the cultivar and seeding density used. The metabolomic fingerprinting/profiling method was used to assess the authenticity of the carrots. The UHPLC-QTOFMS method followed by a multivariate data analysis enabled us to differentiate between organic, integrated, and conventionally produced carrots, as well as the carrot varieties or the seeding density applied. A set of compounds, including saccharides, phenolics, and lipids with antioxidant, anti-inflammatory, anticancer, and antibiotic activities, selected according to their importance for statistical distribution into individual groups representing farming system, cultivar, or seeding density was established and used for carrot authentication. The metabolome was mainly influenced by the cultivar used; however, the effect of the farming conditions was also documented. Metabolomic data were used for the verification of the farming system where the carrots were grown.
Author Contributions
Conceptualization, M.K., V.S. and C.N.; methodology, V.S., H.C. and M.K.; software, V.S. and H.C.; validation, V.S. and H.C.; investigation, V.S. and M.K.; resources, M.K. and V.S.; data curation, V.S., H.C. and M.K.; writing—original draft preparation, V.S., C.N. and M.K.; writing—review and editing, V.S., H.C., M.K. and C.N.; supervision, V.S., M.K. and J.H.; project administration, V.S., J.H. and M.K.; funding acquisition, J.H., V.S. and M.K. All authors have read and agreed to the published version of the manuscript.
Funding
This research was funded by the Ministry of Education, Youth and Sports of the Czech Republic: projects “Operational Programme Prague–Competitiveness” (CZ.2.16/3.1.00/21537, CZ.2.16/3.1.00/24503), “National Programme of Sustainability I”-NPU I; METROFOOD-CZ research infrastructure project (MEYS Grant No: LM2018100), and specific university research A1_FPBT_2022_005; by the Ministry of Agriculture of the Czech Republic: projects QJ1210165 and QK1910235; and by the Institute of Microbiology of the Czech Academy of Sciences: project RVO 6138897. The article processing charges were funded by the Czech University of Life Sciences, Prague, and University of Chemistry and Technology, Prague.
Acknowledgments
Cortina F1 and Afalon F1 carrot cultivars (Daucus carota L.) were kindly provided by Moravoseed a.s. (Mušlov, Czech Republic) where they were selected.
Conflicts of Interest
The authors declare no conflict of interest.
References
- Sharma, K.D.; Karki, S.; Thakur, N.S.; Attri, S. Chemical composition, functional properties and processing of carrot—A review. J. Food Sci. Technol. 2012, 49, 22–32. [Google Scholar] [CrossRef] [PubMed] [Green Version]
- Němcová, V.; Buchtová, I. Situational and Development Review: Vegetables; Ministry of Agriculture of the Czech Republic; Institute of Agricultural Economics and Information: Prague, Czech Republic, 2021; Available online: https://eagri.cz/public/web/file/692977/Zelenina_2021_web.pdf (accessed on 29 March 2022).
- Seljasen, R.; Kristensen, H.L.; Lauridsen, C.; Wyss, G.S.; Kretzschmar, U.; Birlouez-Aragone, I.; Kahl, J. Quality of carrots as affected by pre- and postharvest factors and processing. J. Sci. Food Agric. 2013, 93, 2611–2626. [Google Scholar] [CrossRef] [Green Version]
- Ahmad, A.; Cawood, M.; Iqbal, Q.; Arino, A.; Batool, A.; Tariq, R.M.S.; Azam, M.; Akhtar, S. Phytochemicals in Daucus carota and their health benefits—Review article. Foods 2019, 8, 424. [Google Scholar] [CrossRef] [Green Version]
- Jensen, M.M.; Jorgensen, H.; Lauridsen, C. Comparison between conventional and organic agriculture in terms of nutritional quality of food—A critical review. CAB Rev. 2013, 8, 1–13. [Google Scholar] [CrossRef]
- Baudry, J.; Peneau, S.; Alles, B.; Touvier, M.; Hercberg, S.; Galan, P.; Amiot, M.-J.; Lairon, D.; Mejean, C. Kesse-Guyot, E. Food choice motives when purchasing in organic and conventional consumer clusters: Focus on sustainable concerns (The NutriNet-Santé Cohort Study). Nutrients 2017, 9, 88. [Google Scholar] [CrossRef]
- Denver, S.; Jensen, J.D.; Olsen, S.B.; Christensen, T. Consumer preferences for ‘localness’ and organic food production. J. Food Prod. Mark. 2019, 25, 668–689. [Google Scholar] [CrossRef]
- Oplanič, M.; Ban, D.; Boškovič, D.; Par, V.; Žnidarič, D. Ecological vegetable production and tourism—Case study for Croatia. J. Food Agric. Environ. 2009, 7, 799–803. [Google Scholar]
- Rembialkowska, E. The nutritive and sensory quality of carrots and white cabbage from organic and conventional farms. In IFOAM 2000—The World Grows Organic 2000, Proceedings of 13th International IFOAM Scientific Conference, Basel, Switzerland, 28–31 August 2000; Alfoldi, T., Lockeretz, W., Niggli, U., Eds.; Vdf Hochschulverlag: Zürich, Switzerland; IOS 2000: Amsterdam, The Netherlands, 2000; p. 297. [Google Scholar]
- Razzaq, M.; Akram, N.A.; Ashraf, M.; Naz, H.; Al-Qurainy, F. Interactive effect of drought and nitrogen on growth, some key physiological attributes and oxidative defense system in carrot (Daucus carota L.) plants. Sci. Hortic. 2017, 225, 373–379. [Google Scholar] [CrossRef]
- Soltoft, M.; Nielsen, J.; Lauren, K.H.; Husted, S.; Halekoh, U.; Knuthsen, P. Effects of organic and conventional growth systems on the content of flavonoids in onions and phenolic acids in carrots and potatoes. J. Agric. Food Chem. 2010, 58, 10323–10329. [Google Scholar] [CrossRef]
- Soltoft, M.; Bysted, A.; Madsen, K.H.; Mark, A.B.; Bugel, S.G.; Nielsen, J.; Knuthsen, P. Effects of organic and conventional growth systems on the content of carotenoids in carrot roots, and on intake and plasma status of carotenoids in humans. J. Sci. Food Agric. 2011, 91, 767–776. [Google Scholar] [CrossRef]
- Chan, G.L. Integrated farming system. Landsc. Plan. 1985, 12, 257–266. [Google Scholar] [CrossRef]
- Zhang, D.; Hamauzu, Y. Phenolics, ascorbic acid, carotenoids and antioxidant activity of broccoli and their changes during conventional and microwave cooking. Food Chem. 2004, 88, 503–509. [Google Scholar] [CrossRef]
- Nicolle, C.; Simon, G.; Rock, E.; Amouroux, P.; Remesy, C. Genetic variability influences carotenoid, vitamin, phenolic, and mineral content in white, yellow, purple, orange, and dark-orange carrot cultivars. J. Soc. Hortic. Sci. 2004, 129, 523–529. [Google Scholar] [CrossRef] [Green Version]
- Alasalvar, C.; Al-Farsi, M.; Quantick, P.; Shahidi, F.; Wiktorowicz, R. Effect of chill storage and modified atmosphere packaging (MAP) on antioxidant activity, anthocyanins, carotenoids, phenolics and sensory quality of ready-to-eat shredded orange and purple carrots. Food Chem. 2005, 89, 69–76. [Google Scholar] [CrossRef]
- Smoleň, S.; Sady, W. The effect of various nitrogen fertilization and foliar nutrition regimes on the concentrations of sugars, carotenoids and phenolic compounds in carrot (Daucus carota L.). Sci. Hortic. 2009, 120, 315–324. [Google Scholar] [CrossRef]
- Mustafa, A.; Trevino, L.M.; Turner, C. Pressurized hot ethanol extraction of carotenoids from carrot by-products. Molecules 2012, 17, 1809. [Google Scholar] [CrossRef] [PubMed] [Green Version]
- Faisal, N.A.; Chatha, S.A.S.; Hussain, A.I.; Ikram, M.; Bukhari, S.A. Liaison of phenolic acids and biological activity of escalating cultivars of Daucus carota. Int. J. Food Prop. 2017, 20, 2782–2792. [Google Scholar] [CrossRef] [Green Version]
- Pace, B.; Capotorto, I.; Cefola, M.; Minasi, P.; Montemurro, N.; Carbone, V. Evaluation of quality, phenolic and carotenoid composition of fresh-cut purple Polignano carrots stored in modified atmosphere. J. Food Compos. Anal. 2020, 86, 103363. [Google Scholar] [CrossRef]
- Baranski, R.; Allender, C.; Klimek-Chodacka, M. Towards better tasting and more nutritious carrots: Carotenoid and sugar content variation in carrot genetic resources. Food. Res. Int. 2012, 47, 182–187. [Google Scholar] [CrossRef]
- Alasalvar, C.; Grigor, J.M.; Zhang, D.; Quantick, P.C.; Shahidi, F. Comparison of volatiles, phenolics, sugars, antioxidant vitamins and sensory quality of different colored carrot varieties. J. Agric. Food Chem. 2001, 49, 1410–1416. [Google Scholar] [CrossRef] [PubMed]
- Mozafar, A. Nitrogen fertilizers and the amount of vitamins in plants: A review. J. Plant Nutr. 1994, 16, 2479–2506. [Google Scholar] [CrossRef]
- Prasad, R.; Shivay, Y.S. Agronomic biofortification of plant foods with minerals, vitamins and metabolites with chemical fertilizers and liming. J. Plant. Nutr. 2020, 43, 1534–1554. [Google Scholar] [CrossRef]
- Boskovic-Rakocevic, L.; Pavlovic, R.; Zdravkovic, J.; Zdravkovic, M.; Pavlovic, N.; Djuric, M. Effect of nitrogen fertilization on carrot quality. Afr. J. Agric. Res. 2012, 7, 2884–2900. [Google Scholar] [CrossRef] [Green Version]
- Soltoft, M.; Eriksen, M.R.; Träger, A.W.B.; Nielsen, J.; Laursen, K.H.; Husted, S.; Halekoh, U.; Knuthsen, P. Comparison of polyacetylene content in organically and conventionally grown carrots using a fast ultrasonic liquid extraction method. J. Agric. Food Chem. 2010, 58, 7673–7680. [Google Scholar] [CrossRef] [PubMed]
- Schmiech, L.; Carole, L.; Witulski, B.; Hofmann, T. Structure determination of bisacetylenic oxylipins in carrots (Daucus carota L.) and enantioselective synthesis of falcarindiol. J. Agric. Food Chem. 2009, 57, 11030–11040. [Google Scholar] [CrossRef] [PubMed]
- Dawid, C.; Dunemann, F.; Schwab, W.; Nothnagel, T.; Hofmann, T. Bioactive C 17-Polyacetylenes in carrots (Daucus carota L.): Current knowledge and future perspectives. J. Agric. Food Chem. 2015, 63, 9211–9222. [Google Scholar] [CrossRef]
- Krähmer, A.; Böttcher, C.; Rode, A.; Nothnagel, T.; Schulz, H. Quantifying biochemical quality parameters in carrots (Daucus carota L.)—FT-Raman spectroscopy as efficient tool for rapid metabolite profiling. Food Chem. 2016, 212, 495–502. [Google Scholar] [CrossRef] [PubMed]
- Kidmose, U.; Hansen, S.L.; Christensen, L.P.; Edelenbos, M.; Larsen, E.; Norbaek, R. Effects of genotype, root size, storage, and processing on bioactive compoundsin organically grown carrots (Daucus carota L.). J. Food Sci. 2004, 69, S388–S394. [Google Scholar] [CrossRef]
- Metzger, B.T.; Barnes, D.M.; Reed, J.D. Purple carrot (Daucus carota L.) polyacetylenes decrease lipopolysaccharide-induced expression of inflammatory proteins in macrophage and endothelial cells. J. Agric. Food Chem. 2008, 56, 3554–3560. [Google Scholar] [CrossRef]
- Kjellenberg, L.; Johansson, E.; Gustavsson, K.-E.; Granstedt, A.; Olsson, M.E. Correlations between polyacetylene concentrations in carrot (Daucus carota L.) and various soil parameters. Foods 2016, 5, 60. [Google Scholar] [CrossRef] [Green Version]
- Kumar, N.; Pruthi, V. Potential applications of ferulic acid from natural sources. Biotechnol. Rep. 2014, 4, 86–93. [Google Scholar] [CrossRef] [PubMed] [Green Version]
- Zduńska, K.; Kolodziejczak, A.D.A.; Rotsztejn, H. Antioxidant Properties of Ferulic Acid and Its Possible Application. Skin Pharmacol. Physiol. 2018, 31, 332–336. [Google Scholar] [CrossRef] [PubMed]
- Jayaraj, J.; Rahman, M.; Wan, A.; Punja, Z.K. Enhanced resistance to foliar fungal pathogens in carrot by application of elicitors. Ann. Appl. Biol. 2009, 155, 71–80. [Google Scholar] [CrossRef]
- Lecomte, M.; Berruyer, R.; Hamama, L.; Boedo, C.; Hudhomme, P.; Bersihand, S.; Arul, J.; N’Guyen, G.; Gatto, J.; Guilet, D.; et al. Inhibitory effects of the carrot metabolites 6-methoxymellein and falcarindiol on development of the fungal leaf blight pathogen Alternaria dauci. Physiol. Mol. Plant Pathol. 2012, 80, 58–67. [Google Scholar] [CrossRef]
- Liu, W.; Li, J.; Zhang, X.; Zu, Y.; Yang, Y.; Liu, W.; Xu, Z.; Gao, H.; Sun, X.; Jiang, X.; et al. Current advances in naturally occurring caffeoylquinic acids: Structure, bioactivity, and synthesis. J. Agric. Food Chem. 2020, 68, 10489–10516. [Google Scholar] [CrossRef]
- Mercier, J.; Roussel, D.; Charles, M.T.; Arul, J. Systemic and local responses associated with UV and pathogen induced resistance to Botrytis cinerea in stored carrot. Phytopathology 2000, 90, 981–986. [Google Scholar] [CrossRef] [Green Version]
- Fan, X.; Mattheis, J.P.; Roberts, R.G. Biosynthesis of phytoalexin in carrot root requires ethylene action. Physiol. Plant. 2000, 110, 450–454. [Google Scholar] [CrossRef]
- Cubero-Leon, E.; Penalver, R.; Maquet, A. Review on metabolomics for food authentication. Food Res. Int. 2014, 60, 95–107. [Google Scholar] [CrossRef]
- Röhlig, R.M.; Engel, K.H. Influence of the input system (conventional versus organic farming) on metabolite profiles of maize (Zea mays) kernels. J. Agric. Food Chem. 2010, 58, 3022–3030. [Google Scholar] [CrossRef]
- Chen, P.; Harnly, J.M.; Lester, G.E. Flow injection mass spectral fingerprints demonstrate Chemical Differences in Rio Red Grapefruit with Respect to Year, Harvest Time, and Conventional versus Organic Farming. J. Agric. Food Chem. 2010, 58, 4545–4553. [Google Scholar] [CrossRef] [Green Version]
- Novotna, H.; Kmiecik, O.; Galazka, M.; Krtkova, V.; Hurajova, A.; Schulzova, V.; Hallmann, E.; Rembialkowska, E.; Hajslova, J. Metabolomic fingerprinting employing DART-TOFMS for authentication of tomatoes and peppers from organic and conventional farming. Food Addit. Contam. A—Chem. Anal. Risk Assess. 2012, 29, 1335–1346. [Google Scholar] [CrossRef] [PubMed]
- Bonte, A.; Neuweger, H.; Goesmann, A.; Thonar, C.; Mader, P.; Langenkamper, G.; Niehaus, K. Metabolite profiling on wheat grain to enable a distinction of samples from organic and conventional farming systems. J. Sci. Food Agric. 2014, 94, 2605–2612. [Google Scholar] [CrossRef] [PubMed]
- Mie, A.; Laursen, K.H.; Aberg, K.M.; Forshed, J.; Lindahl, A.; Thorup-Kristensen, K.; Olsson, M.; Knuthsen, P.; Larsen, E.H.; Husted, S. Discrimination of conventional and organic white cabbage from a long-term field trial study using untargeted LC-MS-based metabolomics. Anal. Bioanal. Chem. 2014, 406, 2885–2897. [Google Scholar] [CrossRef] [PubMed] [Green Version]
- Kessler, N.; Bonte, A.; Albaum, S.P.; Mader, P.; Messmer, M.; Goesmann, A.; Niehaus, K.; Langenkamper, G.; Nattkemper, T.W. Learning to classify organic and conventional wheat—A machine learning driven approach using the MeltDB 2.0 metabolomics analysis platform. Front. Bioeng. Biotechnol. 2015, 3, 35. [Google Scholar] [CrossRef] [Green Version]
- Cubero-Leon, E.; De Rudder, O.; Maquet, A. Metabolomics for organic food authentication: Results from a long-term field study in carrots. Food Chem. 2018, 239, 760–770. [Google Scholar] [CrossRef]
- Lundegardh, B.; Botek, P.; Schulzova, V.; Hajslova, J.; Stromberg, A.; Andersson, C. Impact of different green manures on the content of S-alk(en)yl-L-cysteine sulfoxides and L-ascorbic acid in leek (Allium porrum). J. Agric. Food Chem. 2008, 56, 2102–2111. [Google Scholar] [CrossRef]
- Bhave, A.; Schulzova, V.; Chmelarova, H.; Mrnka, L.; Hajslova, J. Assessment of rosehips based on the content of their biologically active compounds. J. Food Drug Anal. 2017, 25, 681–690. [Google Scholar] [CrossRef] [Green Version]
- Koudela MSchulzova, V.; Krmela, A.; Chmelarova, H.; Hajslova, J.; Novotny, C. Effect of agroecological conditions on biologically active compounds and metabolome of carrot. Cells 2021, 10, 784. [Google Scholar] [CrossRef]
- Howard, L.A.; Wong, A.D.; Perry, A.K.; Klein, B.P. Beta-carotene and ascorbic acid retention in fresh and processed vegetables. J. Food Sci. 1999, 64, 929–936. [Google Scholar] [CrossRef]
- Gamboa-Santos, J.; Soria, A.C.; Perez-Mateos, M.; Carrasco, A.; Montilla, A.; Villamiel, A. Vitamin C content and sensorial properties of dehydrated carrots blanched conventionally or by ultrasound. Food Chem. 2013, 136, 782–788. [Google Scholar] [CrossRef] [Green Version]
- Lisiewska, Z.; Kmiecik, W. Effects of level of nitrogen fertilizer, processing conditions and period of storage of frozen broccoli and cauliflower on vitamin C retention. Food Chem. 1996, 57, 267–270. [Google Scholar] [CrossRef]
- Cserni, I.; Prohaszka, K.; Patocs, I. The effect of different N-doses on changes in the nitrate-sugar and carotene contents of carrot. Acta Agric. Hung. 1989, 38, 341–348. [Google Scholar]
- Rožek, S.; Sady, W.; Kasprzyk, A. Wplyw pozakorzeniowego dokarmiania roslin na wielkošč I jakošč plonu marchwi. Zesz. Nauk. Ak. Rol. W Krakowie 2000, 71, 159–162. [Google Scholar]
- Czepa, A.; Hoffman, T. Structural and Sensory Characterization of Compounds Contributing to the Bitter Off-Taste of Carrots (Daucus carota L.) and Carrot Puree. J. Agric. Food Chem. 2003, 51, 3865–3873. [Google Scholar] [CrossRef]
- Yang, R.-L.; Yan, Z.-H.; Lu, Y. Cytotoxic Phenylpropanoids from Carrot. J. Agric. Food Chem. 2008, 56, 3024–3027. [Google Scholar] [CrossRef]
- Bollina, V.; Kushalappa, A.C.; Choo, T.M.; Dion, Y.; Rioux, S. Identification of metabolites related to mechanisms of resistance in barley against Fusarium graminearum, based on mass spectrometry. Plant Mol. Biol. 2011, 77, 355–370. [Google Scholar] [CrossRef]
- Hinds, L.; Kenny, O.; Hossain, M.B.; Walsh, D.; Sheehy, E.; Evans, P.; Gaffney, M.; Rai, D.K. Evaluating the Antibacterial Properties of Polyacetylene and Glucosinolate Compounds with Further Identification of Their Presence within Various Carrot (Daucus carota) and Broccoli (Brassica oleracea) Cultivars Using High-Performance Liquid Chromatography with a Diode Array Detector and Ultra Performance Liquid Chromatography−Tandem Mass Spectrometry Analyses. J. Agric. Food Chem. 2017, 65, 7186–7191. [Google Scholar] [CrossRef] [PubMed]
- Adnan, M.; Chy, N.U.; Kamal, A.T.M.M.; Azad, O.K.; Paul, A.; Uddin, S.B.; Barlow, J.W.; Faruque, M.O.; Park, C.H.; Cho, D.H. Investigation of the biological activities and characterization of bioactive constituents of Opiorrhiza rugose var. prostrata (D.Don) & mondal leaves through in vivo, in vitro and in silico approaches. Molecules 2019, 24, 1367. [Google Scholar] [CrossRef] [Green Version]
- Wu, K.-H.; Lee, W.-J.; Cheng, T.-C.; Chang, H.-W.; Chen, L.-C.; Chen, C.-C.; Lien, H.-M.; Lin, T.-N.; Ho, Y.-S. Study of the antitumor mechanisms of apiole derivatives (AP-02) from Petroselinum crispum through induction of G0/G1 phase cell cycle arrest in human COLO 205 cancer cells. BMC Complement Altern Med. 2019, 19, 188. [Google Scholar] [CrossRef] [Green Version]
- Lu, H.; Tian, Z.; Cui, Y.; Liu, Z.; Ma, X. Chlorogenic acid: A comprehensive review of the dietary sources, processing effects, bioavailability, beneficial properties, mechanisms of action, and future directions. Compr. Rev. Food Sci. Food Saf. 2020, 19, 3130–3158. [Google Scholar] [CrossRef]
- Kozachok, S.; Kolodziejczyk-Czepas, J.; Marchyshyn, S.; Wojtanowski, K.K.; Zgórka, G.; Oleszek, W. Comparison of Phenolic Metabolites in Purified Extracts of Three Wild-Growing Herniaria L. Species and Their Antioxidant and Anti-Inflammatory Activities In Vitro. Molecules 2022, 27, 530. [Google Scholar] [CrossRef] [PubMed]
- Gampe, N.; Darcsi, A.; Nagyné Nedves, A.; Boldizsár, I.; Kursinszki, L.; Béni, S. Phytochemical analysis of Ononis arvensis L. by liquid chromatography coupled with mass spectrometry. J. Mass Spectrom. 2019, 54, 121–133. [Google Scholar] [CrossRef] [PubMed]
- Chevalier, W.; Moussa, S.-A.; MNOttoni, M.; Dubois-Laurent, C.; Huet, S.; Aubert, C.; Desnoues, E.; Navez, B.; Cottet, V.; Chalot, G.; et al. Multisite evaluation of phenotypic plasticity for specialized metabolites, some involved in carrot quality and disease resistance. PLoS ONE 2021, 16, e0249613. [Google Scholar] [CrossRef] [PubMed]
Figure 1.
Content of AA in Cortina and Afalon cv. produced in conventional (conv), integrated (int), and organic (org) systems: (a) seeding density 6 × 10⁵ seeds.ha−1; (b) seeding density 9 × 10⁵ seeds.ha−1. The amount of AA is expressed in mg per kg DW.
Figure 1.
Content of AA in Cortina and Afalon cv. produced in conventional (conv), integrated (int), and organic (org) systems: (a) seeding density 6 × 10⁵ seeds.ha−1; (b) seeding density 9 × 10⁵ seeds.ha−1. The amount of AA is expressed in mg per kg DW.

Figure 2.
Content of β-carotene and α-carotene in Cortina and Afalon cv. Produced in conventional (conv), integrated (int), and organic (org) systems: (a) seeding density 6 × 10⁵ seeds.ha−1; (b) seeding density 9 × 10⁵ seeds.ha−1. The level of carotenes is expressed in mg per kg DW; β-carotene, red; α-carotene, blue.

Figure 3.
OPLS-DA model of 48 samples (methanolic extracts, positive ion mode). The samples are clustered according to: (a) farming system (conv = conventional, int = integrated, org = organic), (b) variety, and (c) planting density (LD = low density, 6 × 10⁵ seeds per ha, HD = high density, 9 × 10⁵ seeds per ha).


Table 1.
An overview of the performance parameters of the OPLS-DA models.
| Extract (Ionization) | Farming System (Organic vs. Integrated vs. Conventional) | Variety (Cortina vs. Afalon) | Seed Density 6 × 10⁵ vs. 9 × 10⁵ Seeds.ha−1 |
|---|---|---|---|
| MeOH (+) | R2(X) = 0.97 Q2 = 0.92 | R2(X) = 0.99 Q2 = 0.99 | R2(X) = 0.98 Q2 = 0.88 |
| MeOH (−) | R2(X) = 0.82 Q2 = 0.54 | R2(X) = 0.99 Q2 = 0.98 | R2(X) = 0.97 Q2 = 0.92 |
| EtOAc (+) | R2(X) = 0.98 Q2 = 0.85 | R2(X) = 0.99 Q2 = 0.96 | R2(X) = 0.98 Q2 = 0.92 |
| EtOAc (−) | R2(X) = 0.97 Q2 = 0.87 | R2(X) = 0.99 Q2 = 0.96 | R2(X) = 0.97 Q2 = 0.89 |
Table 2.
List of compounds identified by UHPLC–Q-TOF-MS used for metabolomic analysis of carrot samples (methanol extracts). The compounds are sorted according to their retention time. (Conv = conventional, int = integrated, org = organic, LD = low seeding density, 6 × 10⁵ seeds per ha, HD = high seeding density, 9 × 10⁵ seeds per ha).
| MeOH extracts in positive ionization mode | ||||||
| RT [min] | Formula | Identification | Δppm | [M + H]+ | Fragments Obtained | Importance for Group |
| 0.61 | C12H22O11 | Sucrose | −1.17 | 365.1054 [M + Na]+ | 203.0509 | No clear trend |
| 1.64 | C12H16O8 | Glucosylmaltol | 0.64 | 311.0740 [M + Na]+ | 127.0391 | HD |
| 2.17 | C18H24O12 | Licoagroside B | −0.70 −1.20 | 433.1343 455.1160 [M + Na]+ | 127.0390 | Cortina, Conv |
| 4.49 | C12H14O4 | Apiole | 2.24 | 223.0965 | 205.0860 | Int, Conv |
| 5.33 | C11H12O4 | 6-methoxymellein | 1.96 | 209.0814 | 191.0704; 181.0860; 163.0759; 135.0806; 103.0554 | Afalon, Int |
| 5.77 | C18H34O5 | Trihydroxy-octadecenoic acid | −1.11 | 353.2300 [M + Na]+ | 213.1474 | Afalon |
| 7.63 | C21H26O7 | Laserine/epilaserine | −1.75 | 413.1569 [M + Na]+ | 291.1228 | Int, HD |
| 7.75 | C21H26O7 | Laserine/epilaserine | −1.75 | 413.1569 [M + Na]+ | 291.1228 | Cortina |
| 7.96 | C25H38O5 | Non-identified | −1.80 | 441.2609 [M + Na]+ | 341.1750; 283.1671; 161.1324 | Conv, Afalon |
| MeOH extracts in negative ionization mode | ||||||
| RT [min] | Formula | Identification | Δppm | [M − H]− | Fragments obtained | Importance for group |
| 0.54 | C6H8O7 | Citric acid | −0.93 | 191.0185 | 111.0074 | Afalon |
| 0.60 | C5H10N2O3 | Glutamine | −1.50 | 145.0605 | LD | |
| 0.63 | C12H22O11 | Sucrose | −1.17 | 341.1081 | 179.0544 | No clear trend |
| 1.43 | C16H18O9 | Chlorogenic acid | −1.86 | 353.0866 | 191.0551 | Afalon |
| 2.17 | C18H24O12 | Licoagroside B | 2.67 | 431.1201 | 369.1672; 329.0829; 269.0706; 125.0233 | Cortina, Conv |
| 3.93 | C14H26O5 | hydroxytetradecanedioic acid | 0.37 | 273.1702 | 255.1592; 155.0700 | Afalon |
| 4.22 | C10H10O4 | Ferulic acid | 0.08 | 193.0494 | 133.0269 | Cortina |
| 5.41 | C18H32O5 | Trihydroxyoctadecedienoic acid | −2.29 | 327.2164 | HD | |
| 5.75 | C12H22O4 | Dodecanedioic acid | −6.48 | 229.1425 | 211.1332 | Afalon |
| 5.77 | C18H34O5 | Trihydroxy-octadecenoic acid | −1.82 | 329.2322 | Afalon, HD | |
| 8.68 | C18H32O2 | Linoleic acid | 2.13 | 279.2330 | Cortina | |
Table 3.
List of compounds identified by UHPLC–Q-TOF-MS used for metabolomic analysis of carrot samples (ethylacetate extracts). The compounds are sorted according to their retention time. (Conv = conventional, int = integrated, org = organic, LD = low seeding density, 6 × 10⁵ seeds per ha, HD = high seeding density, 9 × 10⁵ seeds per ha).
| EtAOc extracts in positive ionization mode | ||||||
| RT [min] | Formula | Identification | Δppm | [M + H]+ | Fragments Obtained | Importance for group |
| 4.41 | C12H14O4 | Apiole | 2.24 | 223.0965 | 190.0622; 177.0911; 163.0791; 147.0437; 133.0670 | Cortina |
| 5.72 | C11H10O4 | Eugenin | −2.58 | 207.0652 | 195.1379; 107.0852 | Afalon, Int, LD |
| 7.34 | C15H20O2 | Eremofrullanolide | −1.72 | 233.1540 | 217.1579; 159.1635; 119.0848 | Cortina |
| 7.62 | C18H30O2 | Linolenic acid | −2.15 | 279.2320 | 191.0694; 161.1319 | Int |
| 7.63 | C21H26O7 | Laserine/epilaserine | −1.75 | 413.1569 [M + Na]+ | 291.1239; 259.1665; 159.1170 | Int |
| 8.12 | C17H24O2 | Falcarindiol | −0.76 | 261.1852 | No clear trend | |
| 8.70 | C17H24O | Falcarinol | −1.63 | 245.1901 | Cortina | |
| EtAOc extracts in negative ionization mode | ||||||
| RT [min] | Formula | Identification | Δppm | [M − H]− | Fragments obtained | Importance for group |
| 5.74 | C18H34O5 | Trihydroxyoctadecenonoic acid | 0.03 | 329.2328 | 229.1432; 211.1326; 183.1368 | Afalon, Org, HD |
| 7.60 | C18H32O3 | Hydroxyoctadecadienoic acid | −0.23 | 295.2277 | 277.2177; 195.1385 | Int, Afalon |
| 8.25 | C16H32O3 | Hydroxypalmitic acid | −3.68 | 271.2267 | 225.2209; 223.2040 | Cortina, Conv, HD |
| 8.69 | C18H32O2 | Linoleic acid | −5.01 | 279.2316 | Cortina | |
Publisher’s Note: MDPI stays neutral with regard to jurisdictional claims in published maps and institutional affiliations. |
© 2022 by the authors. Licensee MDPI, Basel, Switzerland. This article is an open access article distributed under the terms and conditions of the Creative Commons Attribution (CC BY) license (https://creativecommons.org/licenses/by/4.0/).
Share and Cite
MDPI and ACS Style
Schulzova, V.; Koudela, M.; Chmelarova, H.; Hajslova, J.; Novotny, C. Assessment of Carrot Production System Using Biologically Active Compounds and Metabolomic Fingerprints. Agronomy 2022, 12, 1770. https://doi.org/10.3390/agronomy12081770
AMA Style
Schulzova V, Koudela M, Chmelarova H, Hajslova J, Novotny C. Assessment of Carrot Production System Using Biologically Active Compounds and Metabolomic Fingerprints. Agronomy. 2022; 12(8):1770. https://doi.org/10.3390/agronomy12081770
Chicago/Turabian StyleSchulzova, Vera, Martin Koudela, Hana Chmelarova, Jana Hajslova, and Cenek Novotny. 2022. "Assessment of Carrot Production System Using Biologically Active Compounds and Metabolomic Fingerprints" Agronomy 12, no. 8: 1770. https://doi.org/10.3390/agronomy12081770
Note that from the first issue of 2016, this journal uses article numbers instead of page numbers. See further details here.