Macro-, Micro- and Nanomechanical Characterization of Crosslinked Polymers with Very Broad Range of Mechanical Properties

 , , ,
, , ,
Abstract
:
1. Introduction
2. Theoretical Background
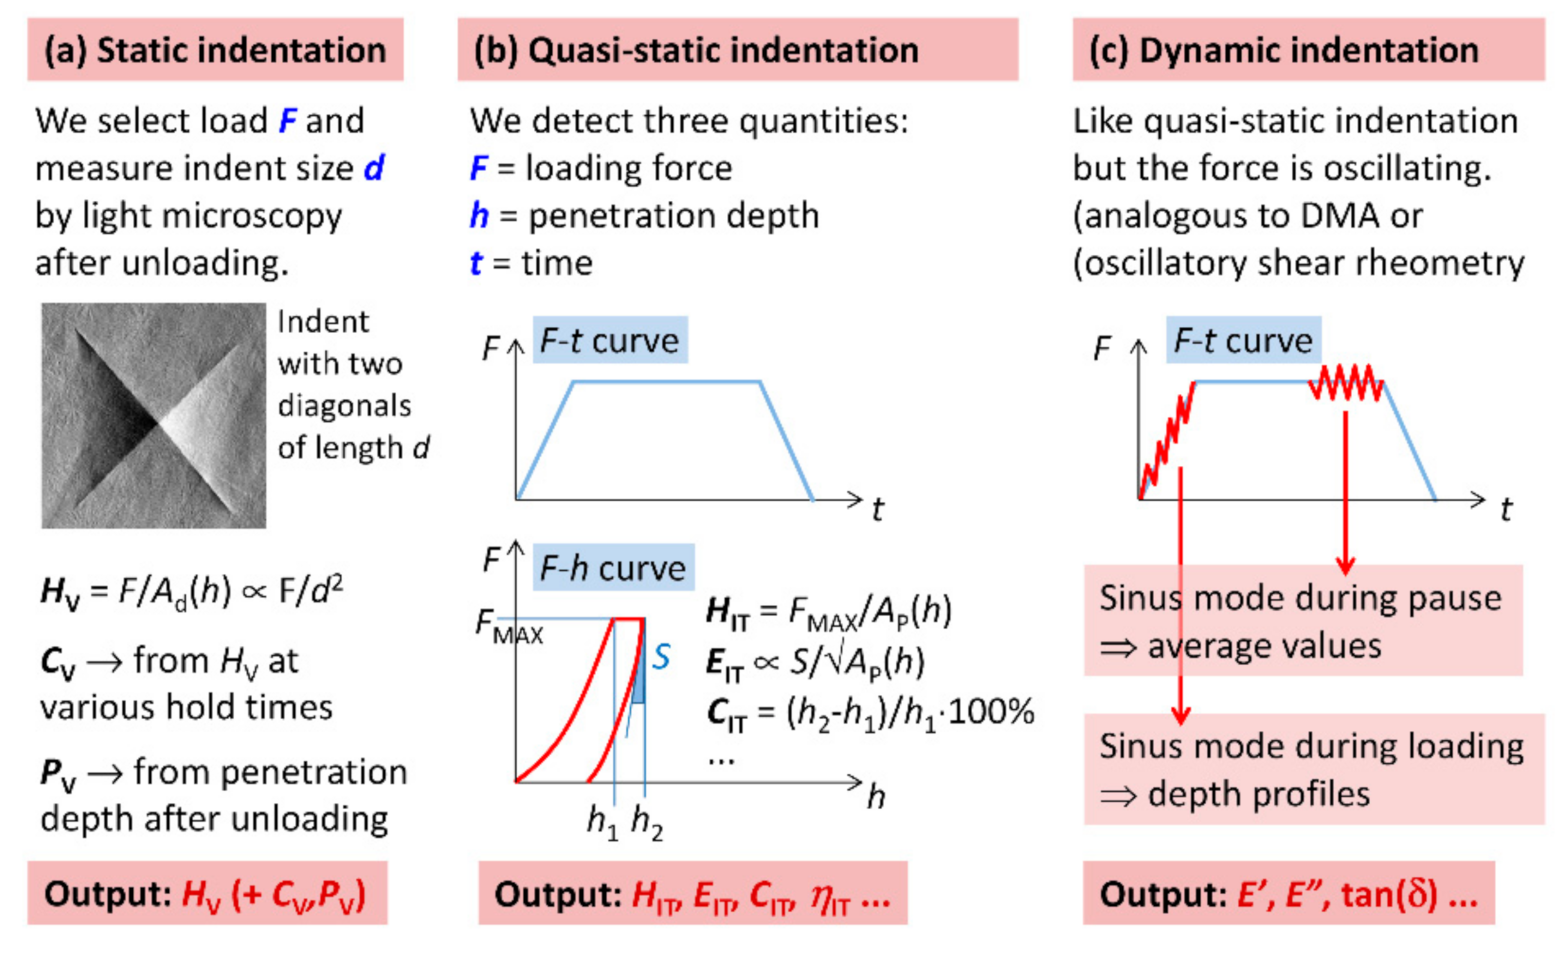
2.1. Static, Quasi-Static and Dynamic Indentation Experiments
2.2. Stiffness-Related Properties of Amorphous and Crosslinked Polymers
2.2.1. Basic Formulas for Stiffness-Related Properties of Polymers
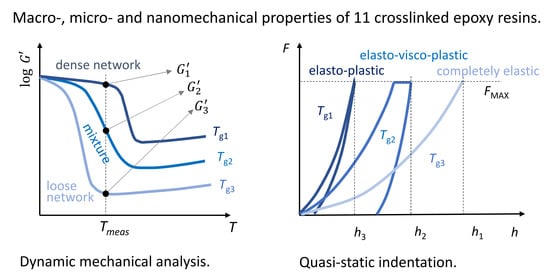
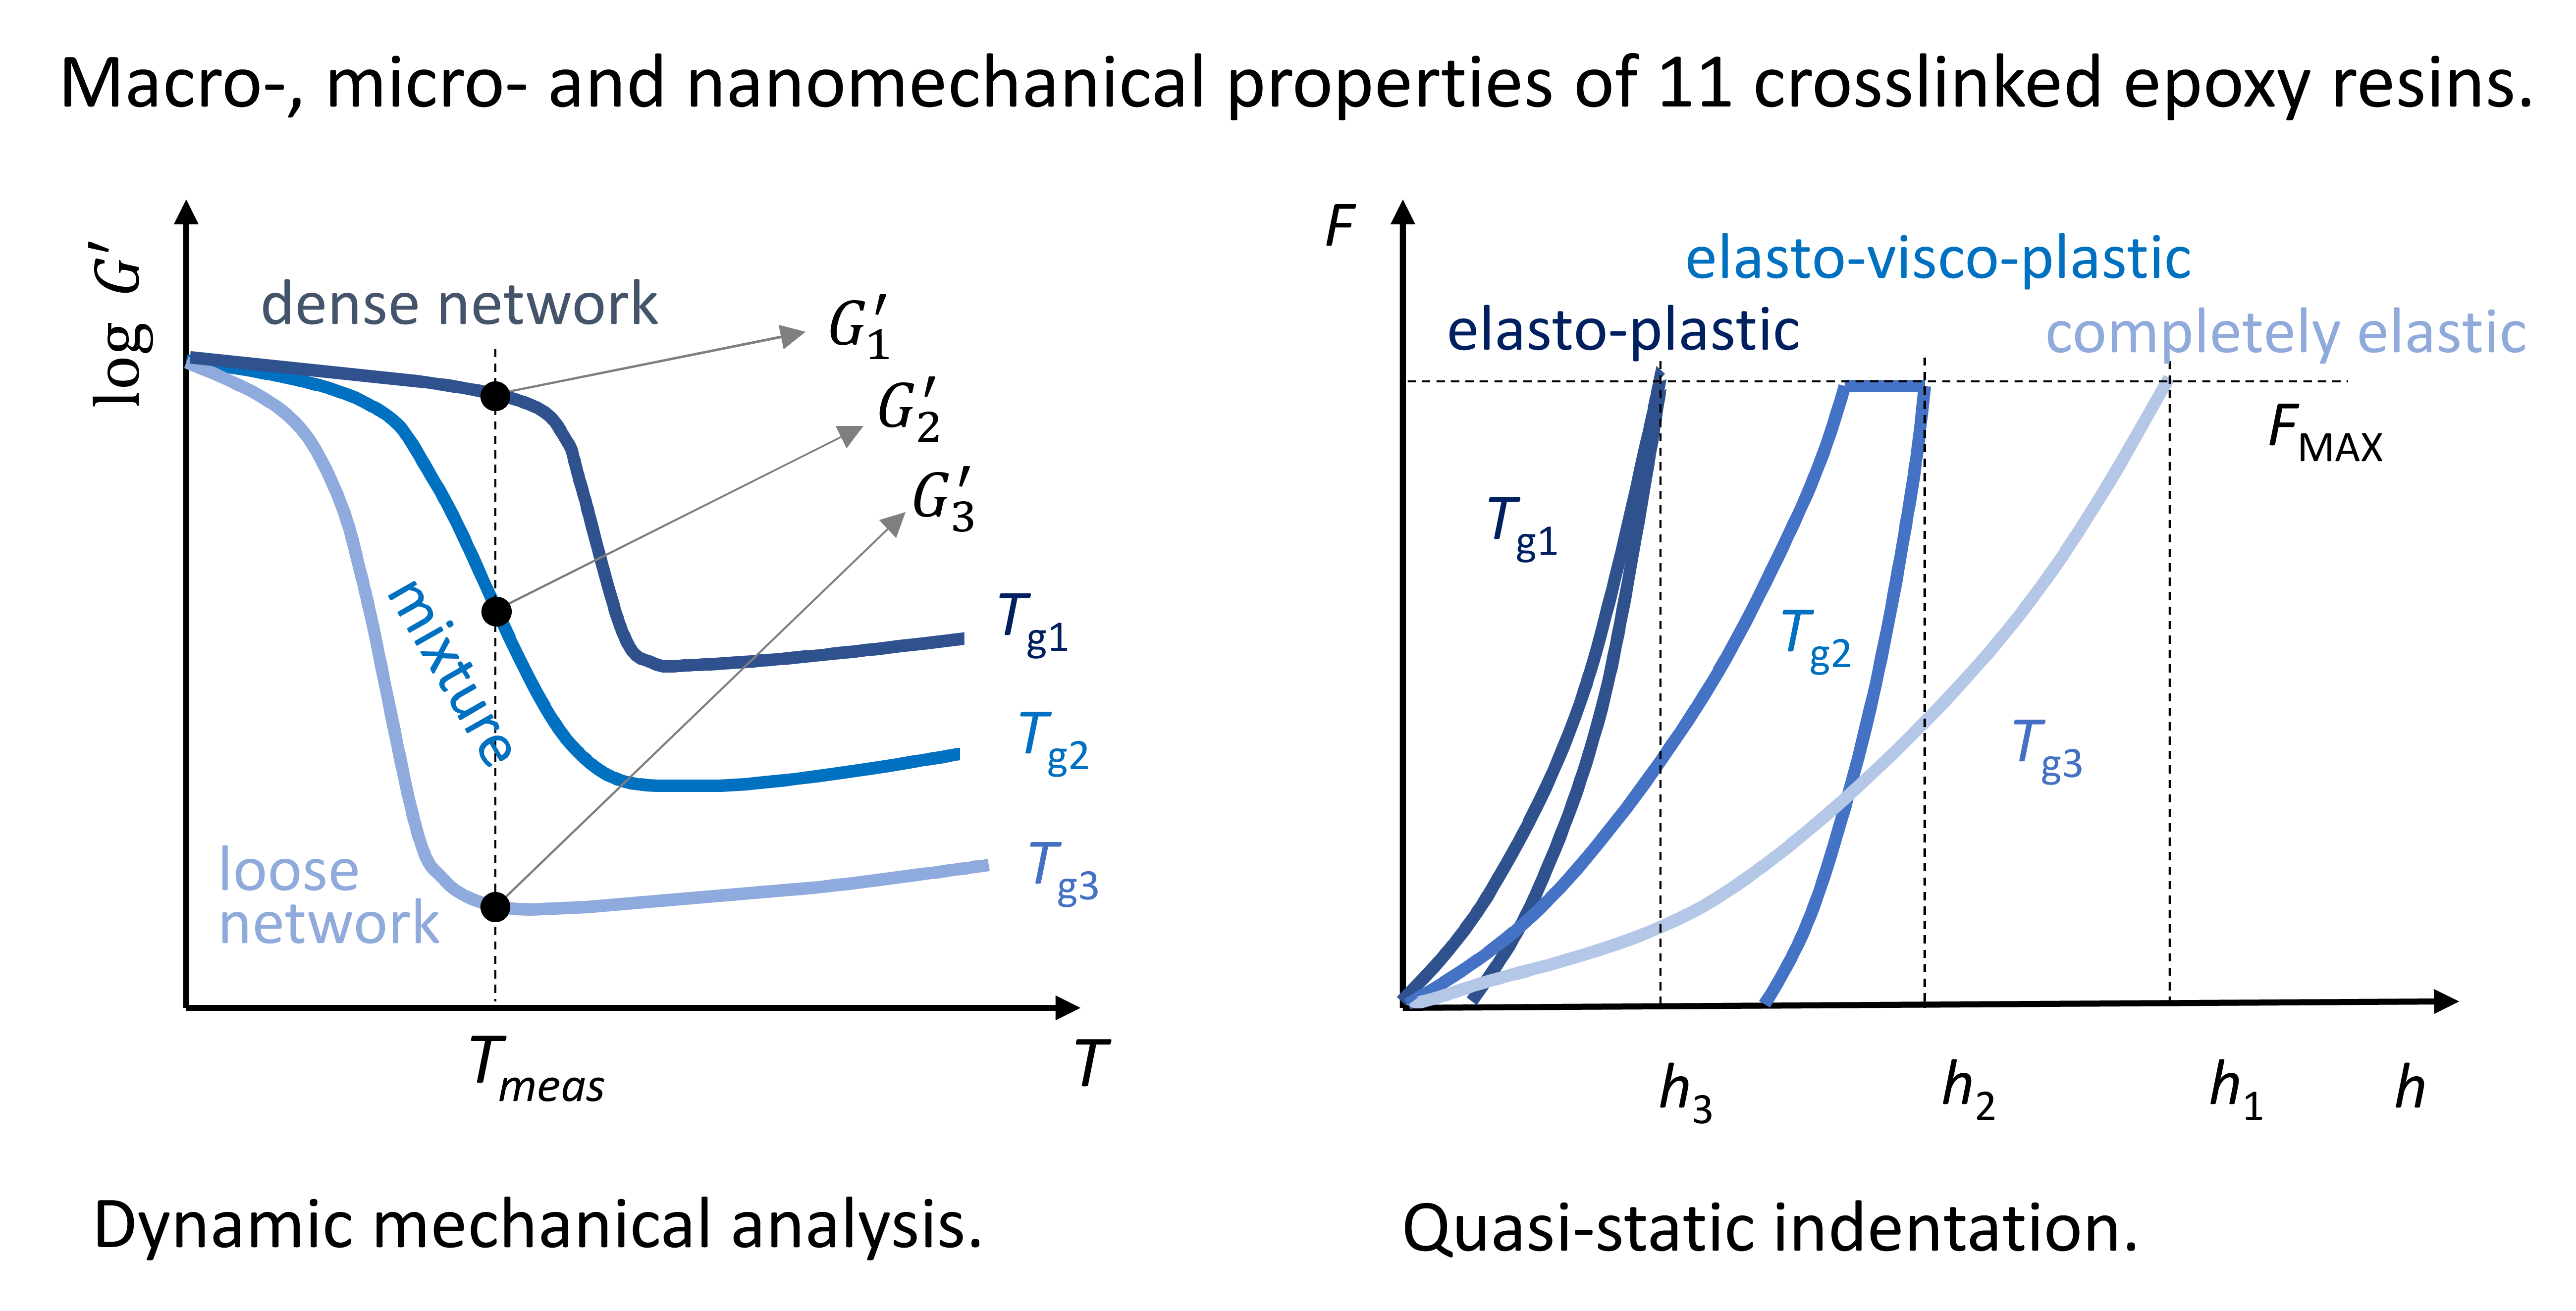
2.2.2. Stiffness-Related Properties of Crosslinked Polymers
3. Experimental
3.1. Materials
3.2. Preparation of Polymer Networks with Increasing Glass Transition Temperature
3.3. Dynamic Mechanical Analysis
3.4. Microindentation
3.5. Nanoindentation
3.6. Statistical Evaluation of Results
4. Results
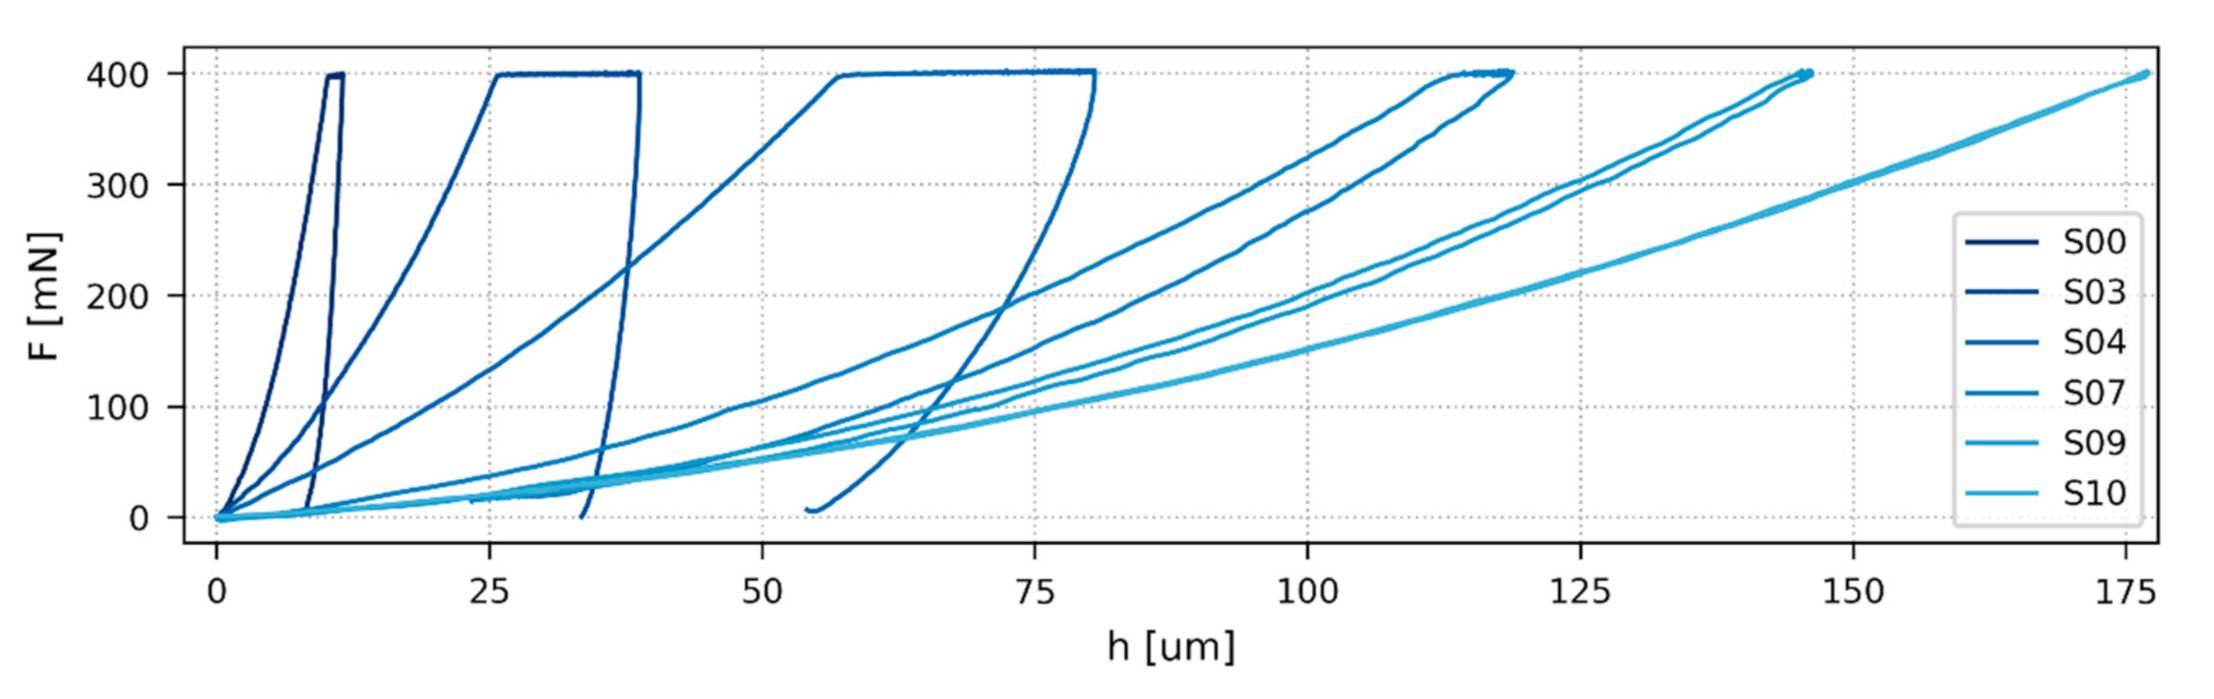
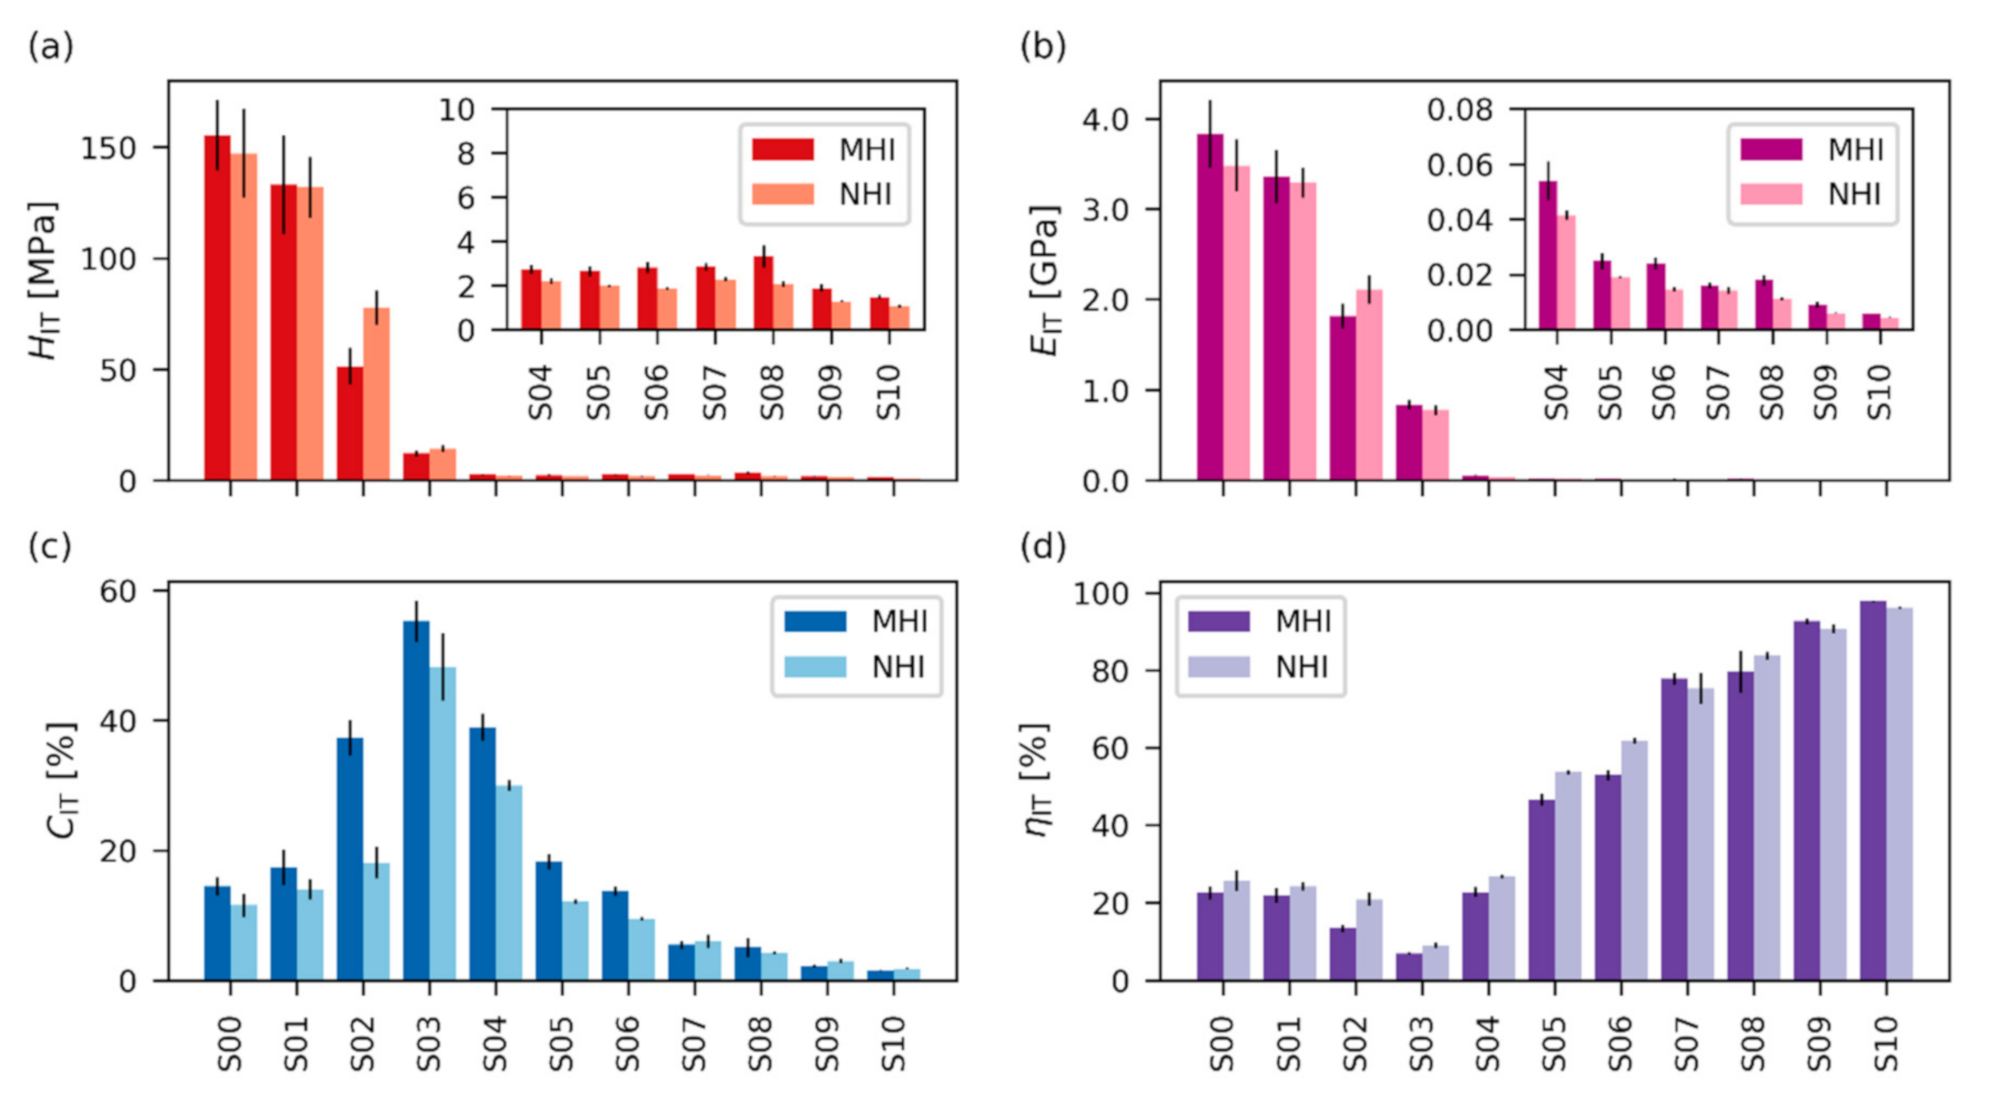
4.1. Quasi-Static Experiments
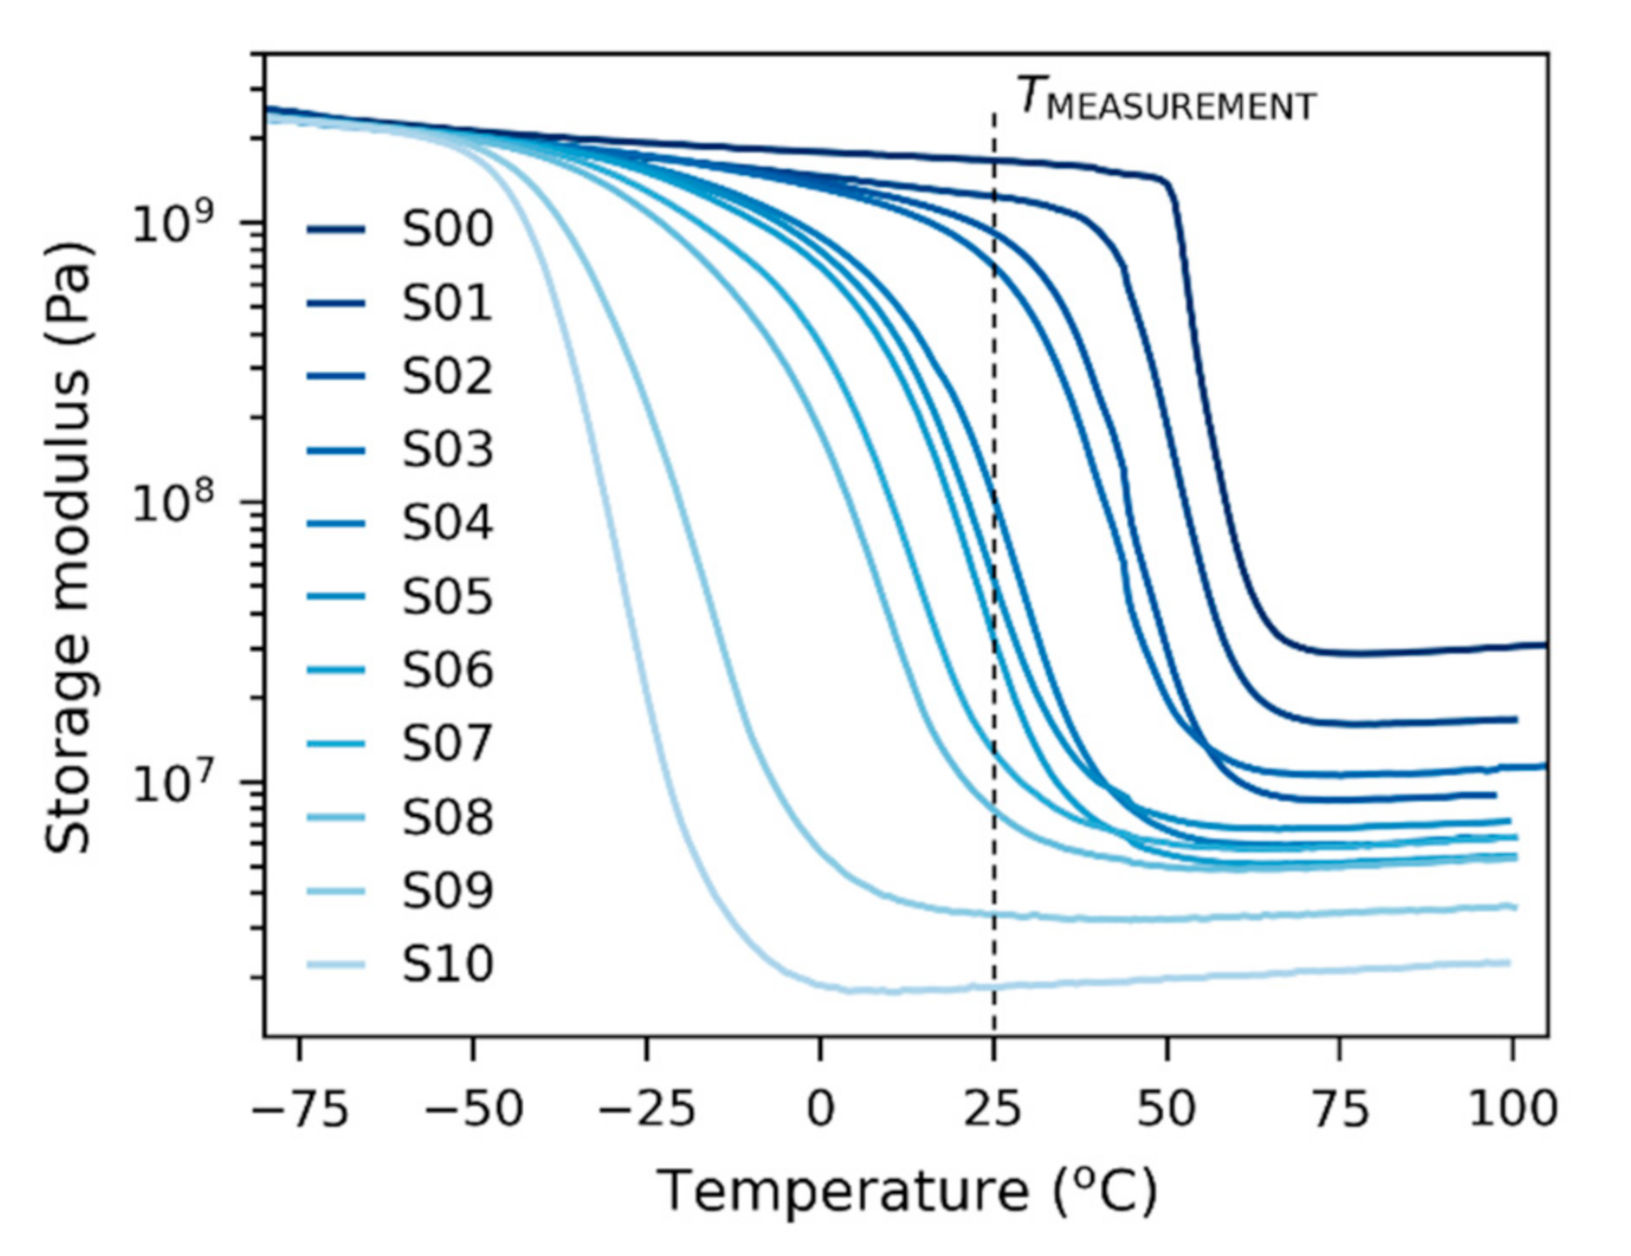
4.2. Dynamic Experiments
5. Discussion
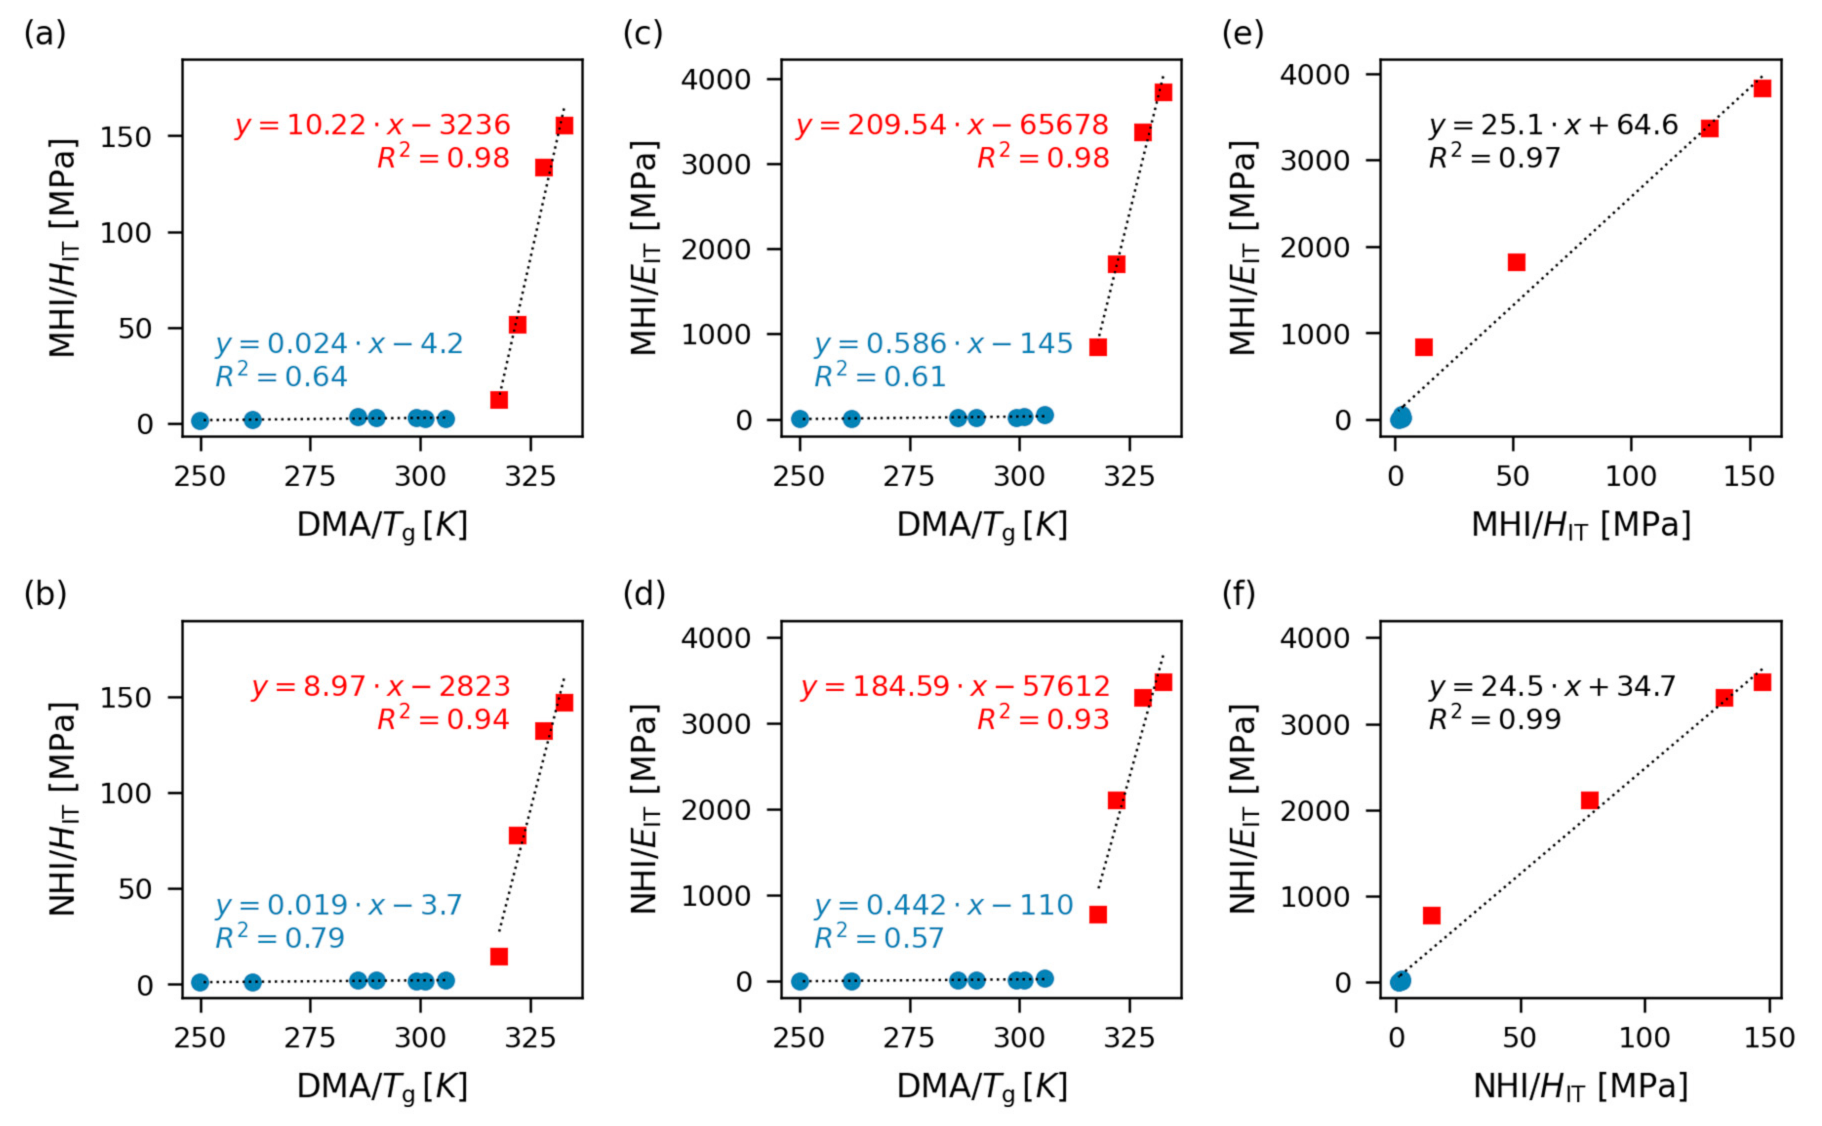
5.1. Correlations between Tg and Stiffness-Related Properties
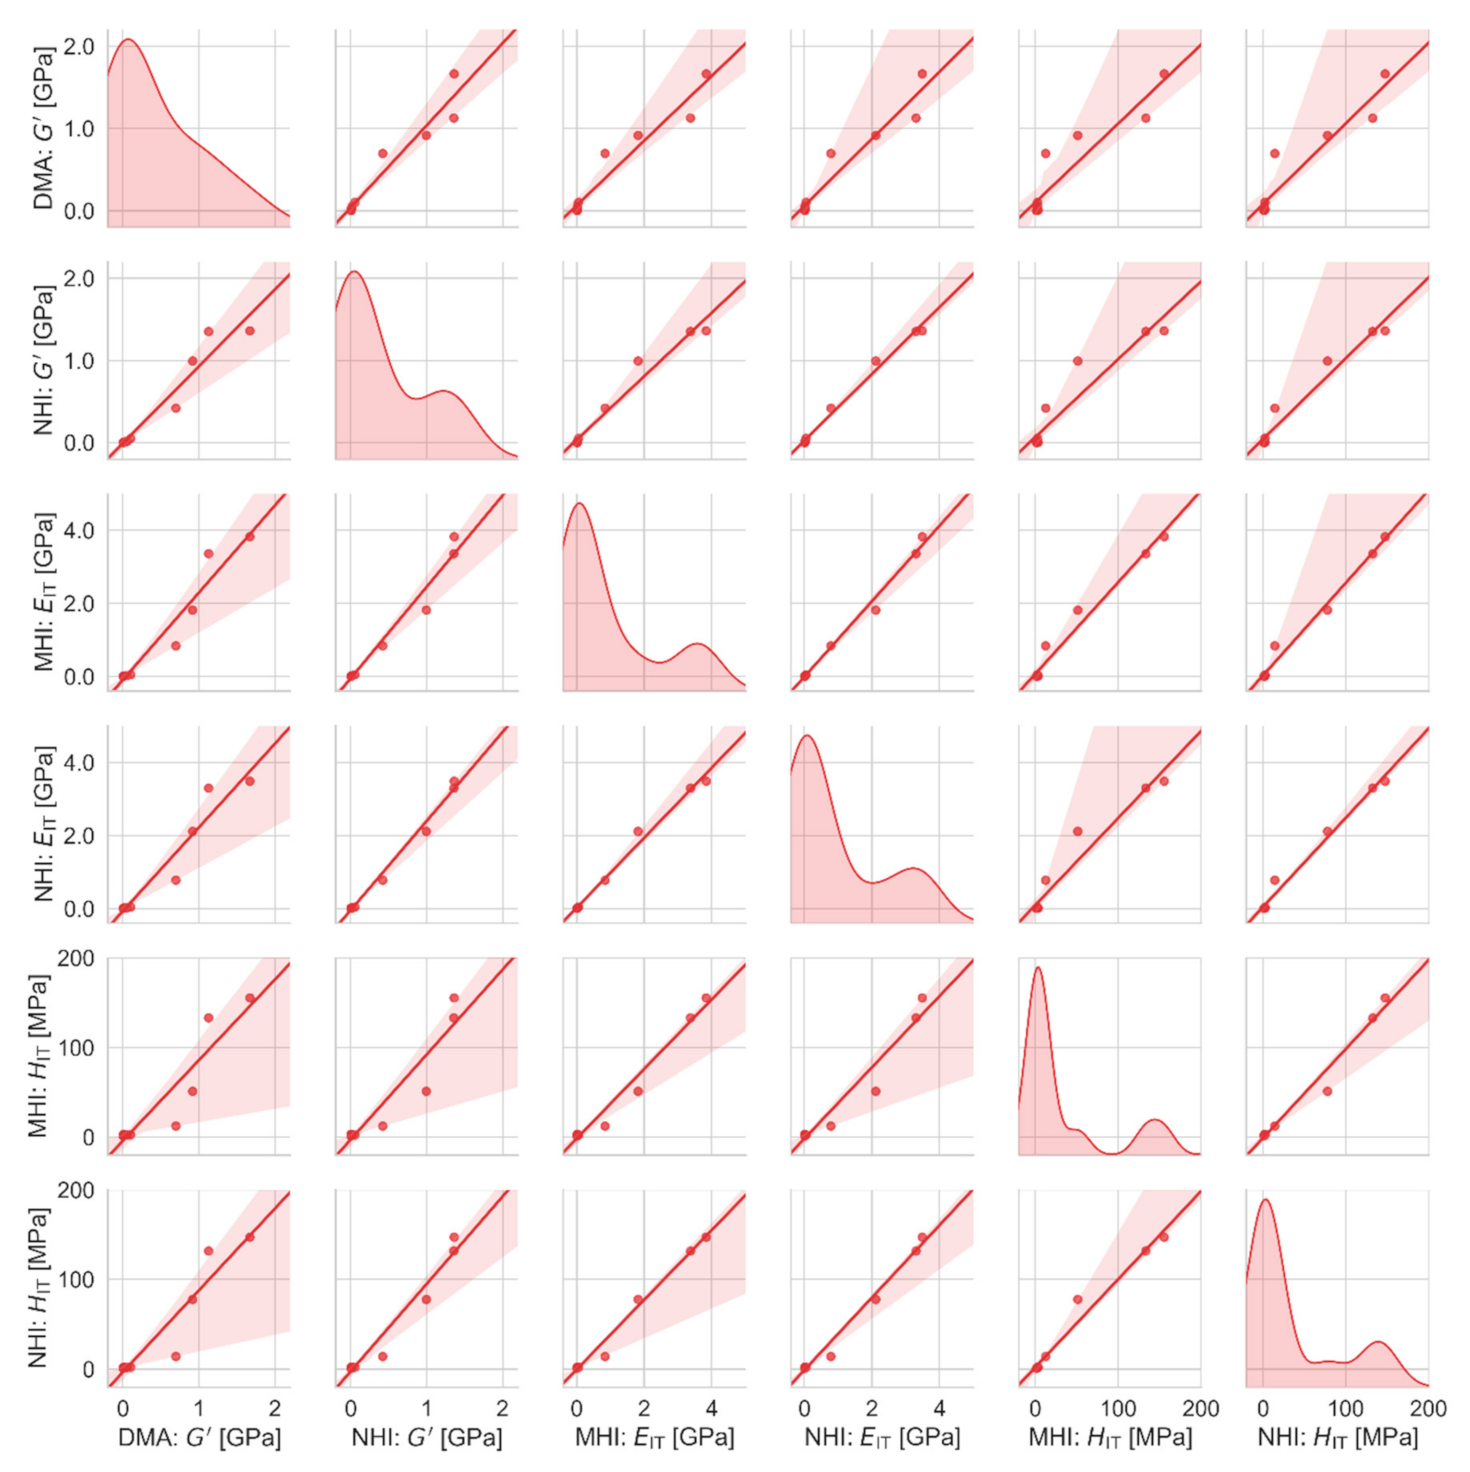
5.2. Correlations among Macro-, Micro- and Nanomechanical Properties
5.3. Small Differences among Mechanical Properties at Different Length Scales
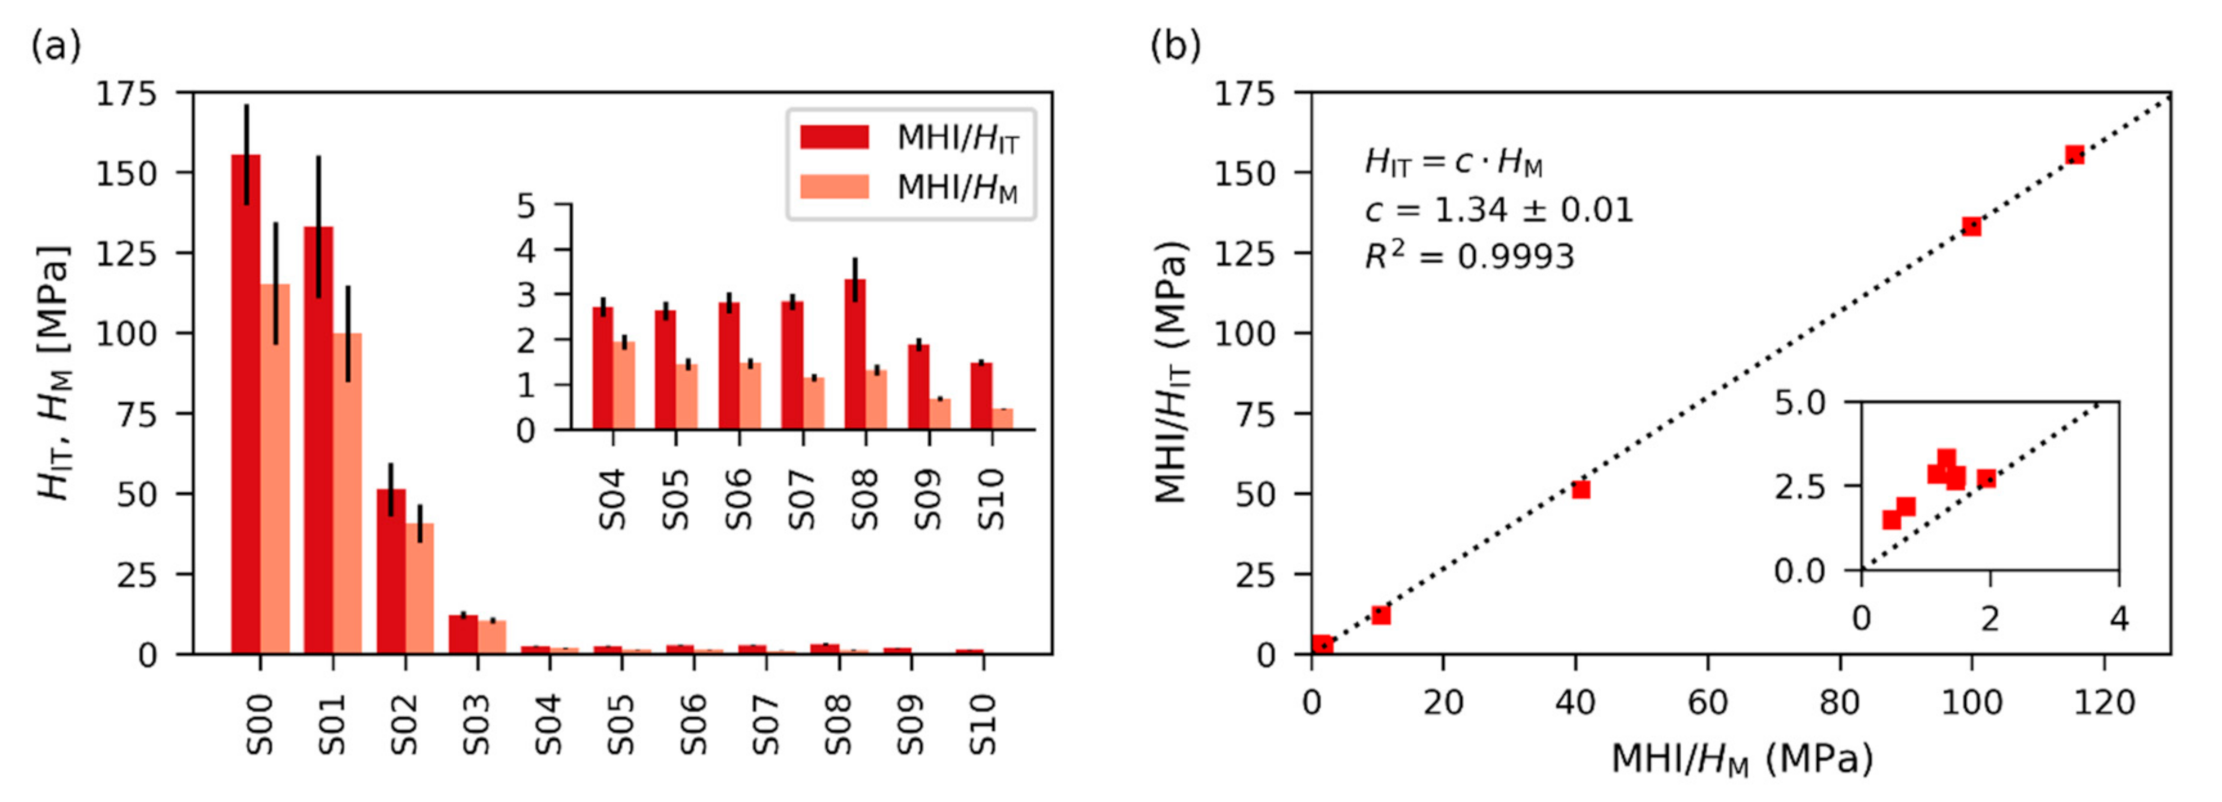
5.4. Small Difference between Indentation Hardness and Universal Hardness
5.5. Limitations of Approximate Relations Used in This Study
5.6. Comparison with Previous Results
6. Conclusions
- All three test methods (DMA, MHI and NHI) could be successfully applied to the characterization of the crosslinked polymer samples. The changes of the mechanical behavior and stiff–ductile–elastic transitions could be reliably detected not only by the dynamic methods (DMA and dynamic NHI), but also by the quasi-static methods (quasi-static MHI and NHI).
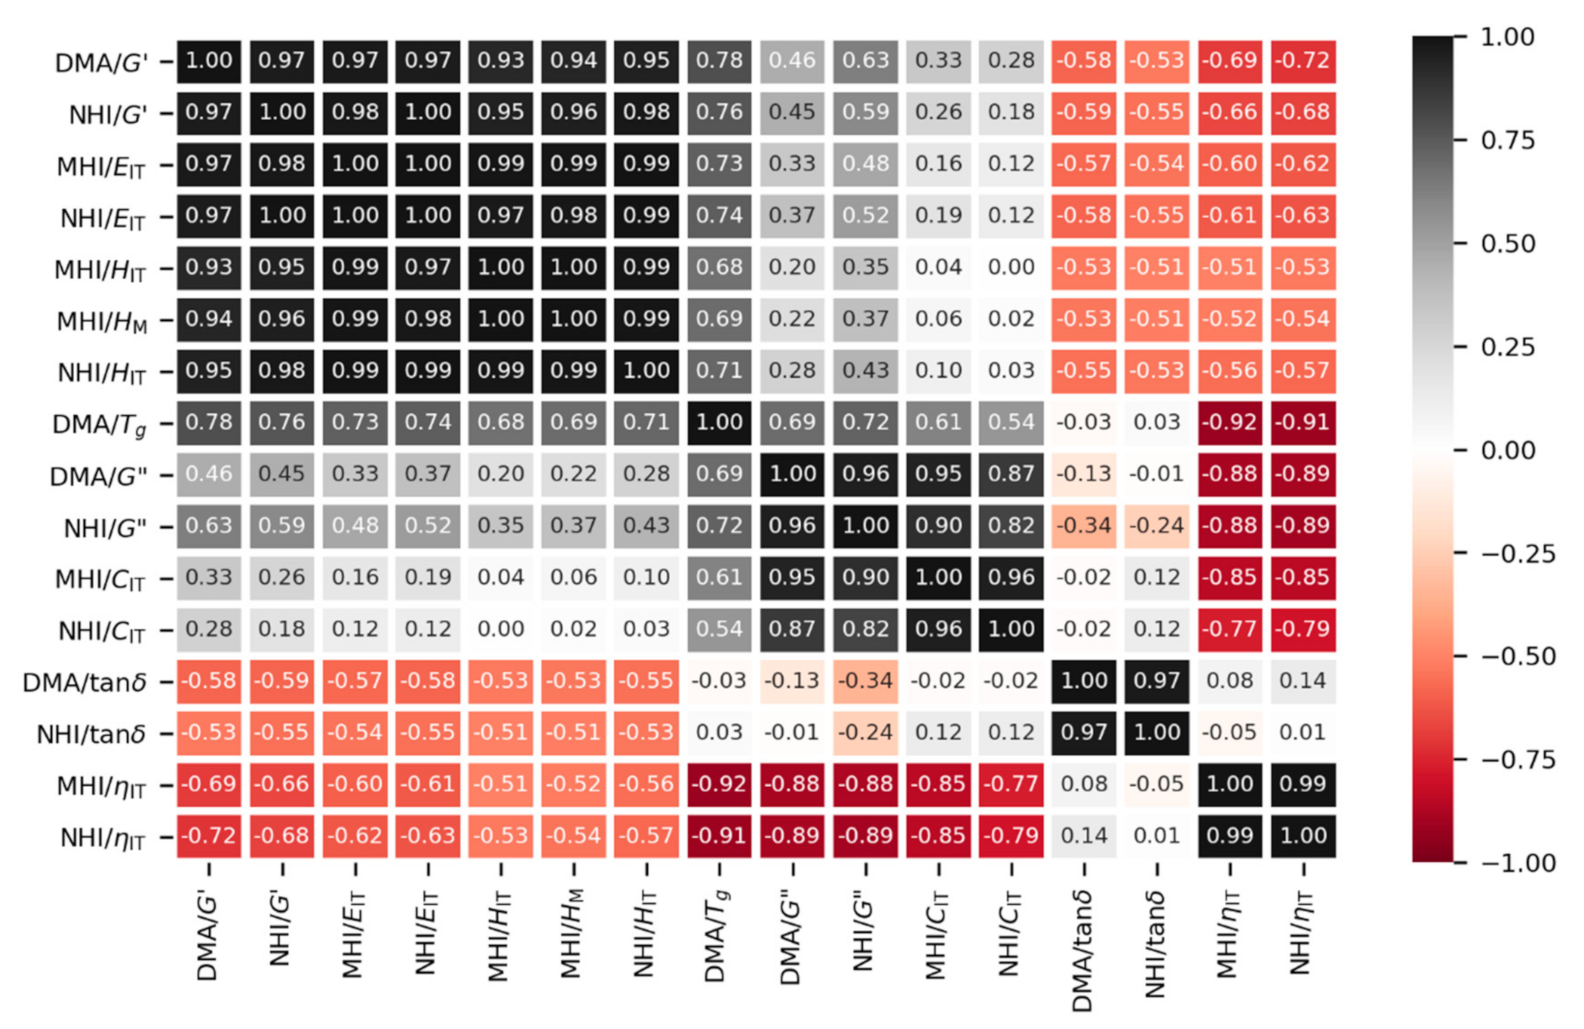
- The stiffness-related properties (i.e., storage moduli, indentation moduli and indentation hardness at all length scales) showed strong and statistically significant correlations (all Pearson′s correlation coefficients r > 0.9 and corresponding p-values < 0.001). Moreover, the relations among all stiffness-related properties were approximately linear, in agreement with a theoretical prediction.
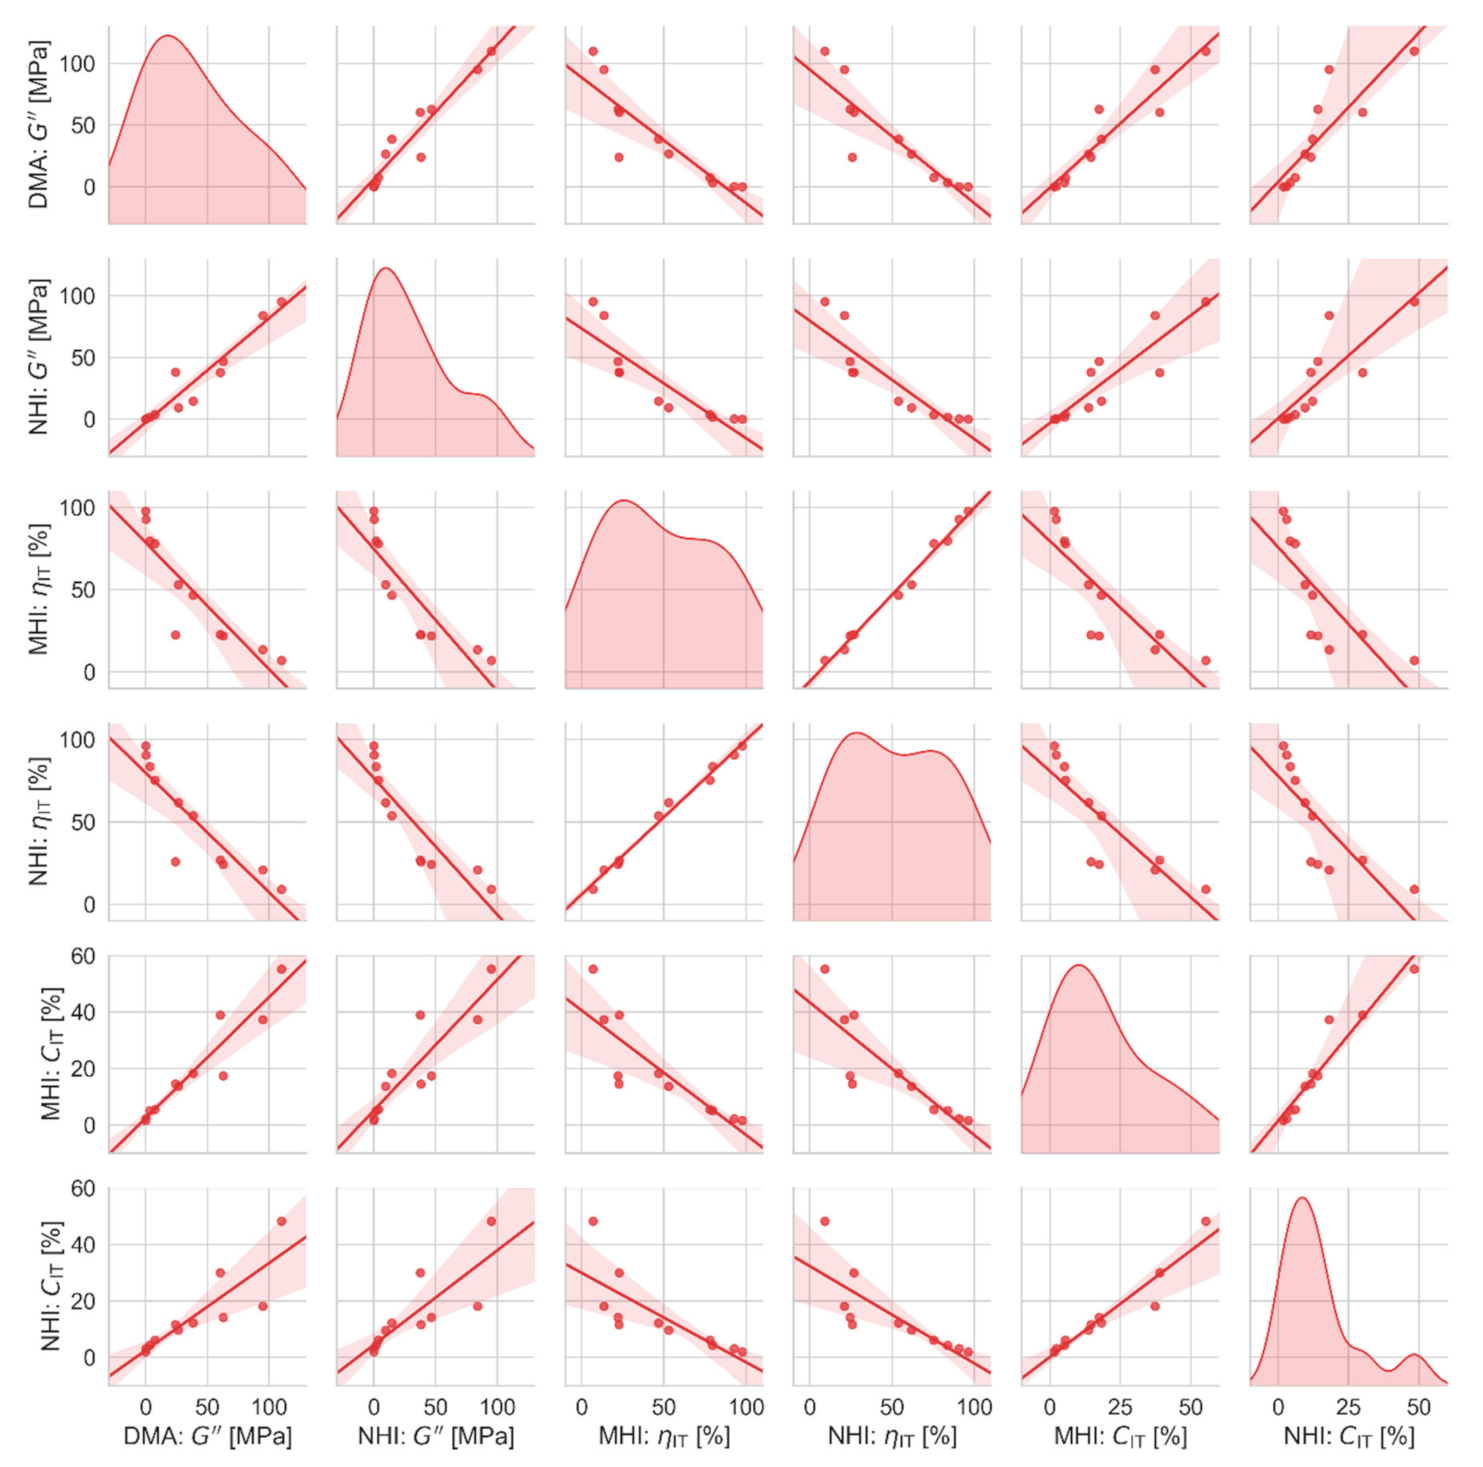
- The viscosity-related properties (i.e., loss moduli, damping factors, indentation creep and elastic work of indentation at all length scales) yielded useful additional information about stiff-ductile-elastic transitions, although their mutual correlations were more complex in comparison with the stiffness-related properties: Loss moduli, damping factors and indentation creep showed one maximum for ductile samples with intermediate crosslinking density (the deformation of ductile polymers exhibited the highest contribution of viscosity), while elastic work of indentation showed two maxima for the hardest samples in the glassy state (acting as enthalpic springs) and the softest samples in the rubbery state (elastic rubbers, acting as entropic springs).
- The similar values and trends of the corresponding macro-, micro- and nanomechanical properties (such as storage modulus from DMA and dynamic NHI, indentation hardness from quasi-static MHI and NHI, etc.) confirmed that micro- and nanoindentation are relevant methods for characterization of polymer materials with a broad range of properties. Both quasi-static and dynamic indentation methods can be employed as an alternative to traditional and well-established DMA analysis of crosslinked polymers.
- The strong correlations among the corresponding macro-, micro- and nanomechanical properties confirmed the reliability of our measurements and pointed out that additional indentation results, such as indentation creep or elastic work of indentation are useful properties for characterization of polymer materials, despite being often neglected.
Supplementary Materials
Author Contributions
Funding
Conflicts of Interest
References
- Tabor, D. The Hardness of Metals; Oxford University Press: New York, NY, USA, 1951. [Google Scholar]
- Oliver, W.C.; Pharr, G.M. An improved technique for determining hardness and elastic modulus using load and displacement sensing indentation experiments. J. Mater. Res. 1992, 7, 1564–1583. [Google Scholar] [CrossRef]
- VanLandingham, M.R.; Villarrubia, J.S.; Guthrie, W.F.; Meyers, G.F. Nanoindentation of Polymers: An Overview. Macromol. Symp. 2001, 167, 15–43. [Google Scholar] [CrossRef]
- Oyen, M.L. Handbook of Nanoindentation with Biological Applications; Pan Stanford Publishing: Singapore, 2011; ISBN 9789814241601. [Google Scholar]
- Panteli, P.A.; Patrickios, C.S.; Constantinou, M.; Constantinides, G. Multiple Network Hydrogels: A Study of Their Nanoindentation Hardness. Macromol. Symp. 2019, 385, 1800201. [Google Scholar] [CrossRef]
- Ramakers-van Dorp, E.; Haenel, T.; Ciongwa, D.; Moginger, B.; Hausnerova, B. Development of an Advanced Dynamic Microindentation System to Determine Local Viscoelastic Properties of Polymers. Polymers 2019, 11, 833. [Google Scholar] [CrossRef] [PubMed] [Green Version]
- Herrmann, K. Instrumented Indentation Test. In Hardness Testing: Principles and Application; Herrmann, K., Ed.; ASM International: Menlo Park, OH, USA, 2011; pp. 167–234. [Google Scholar]
- Fischer-Cripps, A.C. Nanoindentation Testing. In Nanoindentation; Fischer-Cripps, A.C., Ed.; Springer: New York, NY, USA, 2011; pp. 21–37. [Google Scholar]
- Herrmann, K. The Fundamentals of Hardness Testing. In Hardness Testing: Principles and Applications; Herrmann, K., Ed.; ASM International: Menlo Park, OH, USA, 2011; pp. 1–24. [Google Scholar]
- Balta-Calleja, F.J.; Fakirov, S. Introduction. In Microhardness of Polymers; Balta-Calleja, F.J., Fakirov, S., Eds.; Cambridge University Press: Cambridge, UK, 2000; pp. 1–10. [Google Scholar] [CrossRef]
- Broitman, E. Indentation Hardness Measurements at Macro-, Micro-, and Nanoscale: A Critical Overview. Tribol. Lett. 2017, 65, 23. [Google Scholar] [CrossRef] [Green Version]
- Slouf, M.; Pavlova, E.; Krejcikova, S.; Ostafinska, A.; Zhigunov, A.; Krzyzanek, V.; Sowinski, P.; Piorkowska, E. Relationship between morphology and micromechanical properties of alpha, beta and gamma phases of iPP. Polym. Test. 2018, 67, 522–532. [Google Scholar] [CrossRef]
- Oyen, M.L.; Cook, R.F. A practical guide for analysis of nanoindentation data. J. Mech. Behav. Biomed. Mater. 2009, 2, 396–407. [Google Scholar] [CrossRef]
- Gibson, R.F. A review of recent research on nanoindentation of polymer composites and their constituents. Compos. Sci. Technol. 2014, 105, 51–65. [Google Scholar] [CrossRef]
- Slouf, M.; Vackova, T.; Nevoralova, M.; Pokorny, D. Micromechanical properties of one-step and sequentially crosslinked UHMWPEs for total joint replacements. Polym. Test. 2015, 41, 191–197. [Google Scholar] [CrossRef]
- Enrique-Jimenez, P.; Quiles-Díaz, S.; Salavagione, H.J.; Fernández-Blázquez, J.P.; Monclús, M.A.; de Villoria, R.G.; Gómez-Fatou, M.A.; Ania, F.; Flores, A. Nanoindentation mapping of multiscale composites of graphene-reinforced polypropylene and carbon fibres. Compos. Sci. Technol. 2019, 169, 151–157. [Google Scholar] [CrossRef]
- Fu, K.; Chang, Y.; Tang, Y.; Zheng, B. Effect of loading rate on the creep behaviour of epoxy resin insulators by nanoindentation. J. Mater. Sci: Mater. Electron. 2014, 25, 3552–3558. [Google Scholar] [CrossRef]
- Diez-Pascual, A.M.; Gomez-Fatou, M.A.; Ania, F.; Flores, A. Nanoindentation in polymer nanocomposites. Prog. Mater. Sci. 2015, 67, 1–94. [Google Scholar] [CrossRef] [Green Version]
- Wrucke, A.J.; Han, C.; Majumdar, P. Indentation Size Effect of Multiple Orders of Magnitude in Polydimethylsiloxane. J. Appl. Polym. Sci. 2013, 128, 258–264. [Google Scholar] [CrossRef]
- Voyiadjis, G.Z.; Malekmotiei, L.; Samadi-Dooki, A. Indentation size effect in amorphous polymers based on shear transformation mediated plasticity. Polymer 2018, 137, 72–81. [Google Scholar] [CrossRef]
- Lin, H.; Jin, T.; Lv, L.; Ai, Q. Indentation Size Effect in Pressure-Sensitive Polymer Based on A Criterion for Description of Yield Differential Effects and Shear Transformation-Mediated Plasticity. Polymers 2019, 11, 412. [Google Scholar] [CrossRef] [PubMed] [Green Version]
- Lin, H.; Lv, L.; Jin, T. Investigation on the Influences of Hygrothermal Aging on the Indentation Size Effects and Micro-Indentation Measurements of PMMA. Part I: Experimental Results. Appl. Sci. 2020, 10, 5454. [Google Scholar] [CrossRef]
- Mezger, T.G. The Rheology Handbook, 4th ed.; Vincentz Network GmbH: Hannover, Germany, 2014; pp. 135–210. [Google Scholar]
- Tan, N.C.B.; Bauer, B.J.; Plestil, J.; Barnes, J.D.; Liu, D.; Matejka, L.; Dusek, K.; Wu, W.L. Network structure of bimodal epoxies—A small angle X-ray scattering study. Polymer 1999, 40, 4603–4614. [Google Scholar] [CrossRef]
- Wu, W.L.; Bauer, B.J. Network structure of epoxies—A neutron scattering study: 2. Polymer 1986, 27, 169–180. [Google Scholar] [CrossRef]
- Wu, W.L.; Bauer, B.J. Epoxy network structure. 3. Neutron-scattering study of epoxies containing monomers of different molecular weight. Macromolecules 1986, 19, 1613–1618. [Google Scholar] [CrossRef]
- Balta-Calleja, F.J.; Fakirov, S. Microhardness Determination in Polymeric Materials. In Microhardness of Polymers; Balta-Calleja, F.J., Fakirov, S., Eds.; Cambridge University Press: Cambridge, UK, 2000; pp. 11–45. [Google Scholar] [CrossRef]
- Flores, A.; Ania, F.; Balta-Calleja, F.J. From the glassy state to ordered polymer structures: A microhardness study. Polymer 2009, 50, 729–746. [Google Scholar] [CrossRef] [Green Version]
- Oliver, W.C.; Pharr, M.G. Nanoindentation in Materials Research: Past, present, and future. MRS Bull. 2010, 35, 897–907. [Google Scholar] [CrossRef]
- Hochstetter, G.; Jimenez, A.; Loubet, J.L. Strain-rate effects on hardness of glassy polymers in the nanoscale range. Comparison between Quasi-static and continuous stiffness measurements. J. Macromol. Sci. Part B-Phys. 1999, 38, 681–692. [Google Scholar] [CrossRef]
- Koch, T.; Seidler, S. Correlations between Indentation Hardness and Yield Stress in Thermoplastic Polymers. Strain 2009, 45, 26–33. [Google Scholar] [CrossRef]
- Ostafinska, A.; Fortelny, I.; Nevoralova, M.; Hodan, J.; Kredatusova, J.; Slouf, M. Synergistic effects in mechanical properties of PLA/PCL blends with optimized composition, processing, and morphology. RSC Adv. 2015, 5, 98971–98982. [Google Scholar] [CrossRef]
- Ostafinska, A.; Fortelny, I.; Hodan, J.; Krejcikova, S.; Nevoralova, M.; Kredatusova, J.; Krulis, Z.; Kotek, J.; Slouf, M. Strong synergistic effects in PLA/PCL blends: Impact of PLA matrix viscosity. J. Mech. Behav. Biomed. Mater. 2017, 69, 229–241. [Google Scholar] [CrossRef]
- Chudoba, T.; Griepentrog, M. Comparison between conventional Vickers hardness and indentation hardness obtained with different instruments. Z. Metallkd. 2005, 96, 1242–1246. [Google Scholar] [CrossRef]
- Kang, S.; Kim, J.; Park, C.; Kim, H.; Kwon, D. Conventional Vickers and true instrumented indentation hardness determined by instrumented indentation tests. J. Mater. Res. 2010, 25, 337–343. [Google Scholar] [CrossRef] [Green Version]
- Hardiman, M.; Vaughan, T.J.; McCarthy, C.T. The effects of pile-up, viscoelasticity and hydrostatic stress on polymer matrix nanoindentation. Polym. Test. 2016, 52, 157–166. [Google Scholar] [CrossRef] [Green Version]
- Brinson, H.F.; Brinson, L.C. Polymer Engineering Science and Viscoelasticity: An Introduction; Springer: New York, NY, USA, 2008; pp. 15–54. [Google Scholar]
- Fischer-Cripps, A.C. Time Dependent Nanoindentation. In Nanoindentation 3rd edition; Fischer-Cripps, A.C., Ed.; Springer: New York, NY, USA, 2011; pp. 125–145. [Google Scholar]
- Balta-Calleja, F.J.; Fakirov, S. Microhardness of Glassy Polymers. In Microhardness of Polymers; Balta-Calleja, F.J., Fakirov, S., Eds.; Cambridge University Press: Cambridge, UK, 2000; pp. 46–79. [Google Scholar] [CrossRef]
- Balta-Calleja, F.J.; Fakirov, S. Microharndess of Crystalline Polymers. In Microhardness of Polymers; Balta-Calleja, F.J., Fakirov, S., Eds.; Cambridge University Press: Cambridge, UK, 2000; pp. 80–126. [Google Scholar] [CrossRef]
- Struik, L.C.E. Some problems in the non-linear viscoelasticity of amorphous glassy polymers. J. Non-Cryst. Solids 1991, 131–133, 395–407. [Google Scholar] [CrossRef]
- Balta-Calleja, F.J.; Cagiao, M.E.; Adhikari, R.; Michler, G.H. Relating microhardness to morphology in styrene/butadiene block copolymer/polystyrene blends. Polymer 2004, 45, 247–254. [Google Scholar] [CrossRef] [Green Version]
- Slouf, M.; Pilar, J.; Dybal, J.; Sloufova, I.; Michalkova, D.; Lukesova, M.; Zgadzai, O.; Blank, A.; Filippov, S.K. UV degradation of styrene-butadiene rubber versus high density poly(ethylene) in marine conditions studied by infrared spectroscopy, micro indentation, and electron spin resonance imaging. Polym. Degrad. Stab. 2018, 156, 132–143. [Google Scholar] [CrossRef]
- Kupka, V.; Zhou, Q.; Ansari, F.; Tang, H.; Slouf, M.; Vojtova, L.; Berglund, L.A.; Jancar, J. Well-dispersed polyurethane/cellulose nanocrystal nanocomposites synthesized by a solvent-free procedure in bulk. Polym. Compos. 2019, 40, E456–E465. [Google Scholar] [CrossRef]
- Yin, H.; Jin, H.; Wang, C.; Sun, Y.; Yuan, Z.; Xie, H.; Wang, Z.; Cheng, R. Thermal, damping, and mechanical properties of thermosetting epoxy-modified asphalts. J. Therm. Anal. Calorim. 2014, 115, 1073–1080. [Google Scholar] [CrossRef]
- Ramsdale-Capper, R.; Foreman, J.P. Internal antiplasticisation in highly crosslinked amine cured multifunctional epoxy resins. Polymer 2018, 146, 321–330. [Google Scholar] [CrossRef]
- Ostafinska, A.; Vackova, T.; Slouf, M. Strong synergistic improvement of mechanical properties in HDPE/COC blends with fibrillar morphology. Polym. Eng. Sci. 2018, 58, 1955–1964. [Google Scholar] [CrossRef]
- Ilie, N.; Hickel, R. Macro-, micro- and nano-mechanical investigations on silorane and methacrylate-based composites. Dent. Mater. 2009, 25, 810–819. [Google Scholar] [CrossRef]
- Kenned, J.J.; Sankaranarayanasamy, K.; Binoj, J.S.; Chelliah, S.K. Thermo-mechanical and morphological characterization of needle punched non-woven banana fiber reinforced polymer composites. Compos. Sci. Technol. 2020, 185, 107890. [Google Scholar] [CrossRef]
- Gedde, U.W. The Rubber Elastic State. In Polymer Physics; Gedde, U.W., Ed.; Chapman & Hall: London, UK, 1995; pp. 39–53. [Google Scholar]
- Ward, I.M.; Sweeney, J. An Introduction to the Mechanical Properties of Solid Polymers, 2nd ed.; John Wiley & Sons: Chichester, UK, 2004; pp. 31–78. [Google Scholar]
- Strachota, A.; Rodzen, K.; Ribot, F.; Trchova, M.; Steinhart, M.; Starovoytova, L.; Pavlova, E. Behavior of Tin-Based “Super-POSS” Incorporated in Different Bonding Situations in Hybrid Epoxy Resins. Macromolecules 2014, 47, 4266–4287. [Google Scholar] [CrossRef]
- Gedde, U.W. The Glassy Amorphous State. In Polymer Physics; Gedde, U.W., Ed.; Chapman & Hall: London, UK, 1995; pp. 81–82. [Google Scholar]
- McKinney, W. Python for Data Analysis, 2nd ed.; O’Reilly: Boston, MA, USA, 2018. [Google Scholar]
- Urdan, T.C. Statistics in Plain English, 4th ed.; Routledge Taylor and Francis Group: New York, NY, USA; London, UK, 2017. [Google Scholar]
- Fasce, L.; Cura, J.; del Grosso, M.; Bermudez, G.G.; Frontini, P. Effect of nitrogen ion irradiation on the nano-tribological and surface mechanical properties of ultra-high molecular weight polyethylene. Surf. Coat. Technol. 2010, 204, 3887–3894. [Google Scholar] [CrossRef]
- Kotsilkova, R.; Todorov, P.; Ivanov, E.; Kaplas, T.; Svirko, Y.; Paddubskaya, A.; Kuzhir, P. Mechanical properties investigation of bilayer graphene/poly(methyl methacrylate) thin films at macro, micro and nanoscale. Carbon 2016, 100, 355–366. [Google Scholar] [CrossRef]
- Alisafei, F.; Han, C. Indentation Depth Dependent Mechanical Behavior in Polymers. Adv. Condens. Matter Phys. 2015, 391579. [Google Scholar] [CrossRef] [Green Version]
- Marsh, D.M. Plastic flow in glass. Proc. R. Soc. Lond. Ser. A 1964, 279, 420–435. [Google Scholar] [CrossRef]
- Hirst, W.; Howse, M.G.J.W. The indentation of materials by wedges. Proc. Roy. Soc. Lond. A 1969, 311, 429–444. [Google Scholar] [CrossRef]
- Johnson, K.L. The correlation of indentation experiments. J. Mech. Phys. Sol. 1970, 18, 115–126. [Google Scholar] [CrossRef]
- Johnson, K.L. Contact Mechanics; Cambridge University Press: Cambridge, UK, 1985. [Google Scholar] [CrossRef]
- Gao, X.L.; Jing, X.N.; Subhash, G. Two new expanding cavity models for indentation deformations of elastic strain-hardening materials. Int. J. Solids Struct. 2006, 43, 2193–2208. [Google Scholar] [CrossRef] [Green Version]
- Alcala, J.; Esque-de los Ojos, D. Reassessing spherical indentation: Contact regimes and mechanical property extractions. Int. J. Solids Struct. 2010, 47, 2714–2732. [Google Scholar] [CrossRef]
- Balta Calleja, F.J. Microhardness relating to crystalline polymers. In Characterization of Polymers in the Solid State I: Part A: NMR and Other Spectroscopic Methods Part B: Mechanical Methods; Advances in Polymer Science; Kaush, H.H., Zachman, H.G., Eds.; Springer: Berlin/Heidelberg, Germany, 1985; Volume 66, pp. 117–148. [Google Scholar] [CrossRef]
- Lesan–Khosh, R.; Bagheri, R.; Asgari, S. Nanoindentation of isotactic polypropylene: Correlations between hardness, yield stress, and modulus on the local and global scales. J. Appl. Polym. Sci. 2011, 121, 930–938. [Google Scholar] [CrossRef]
- Balta-Calleja, F.J.; Giri, L.; Ward, I.M.; Cansfield, D.L.M. Microstructure of bulk crystallized linear polyethylene: Correlation of microhardness and yield stress. J. Mater. Sci. 1995, 30, 1139–1143. [Google Scholar] [CrossRef]
- Flores, A.; Balta-Calleja, F.J.; Attenburrow, G.E.; Bassett, D.-C. Microhardness studies of chain-extended PE: III. Correlation with yield stress and elastic modulus. Polymer 2000, 41, 5431–5435. [Google Scholar] [CrossRef]
- Gimenez, E.; Lagaron, J.M.; Gavara, R.; Saura, J.J. On the linear correlation between microhardness and mechanical properties in polar polymers and blends. Polym. Int. 2003, 52, 1243–1245. [Google Scholar] [CrossRef]
- Cook, R.F.; Koester, K.J.; Macosko, C.W.; Ajbani, M. Rheological and Mechanical Behavior of Blends of Styrene-Butadiene Rubber With Polypropylene. Polym. Eng. Sci. 2005, 45, 1487–1497. [Google Scholar] [CrossRef]
- Slouf, M.; Kotek, J.; Baldrian, J.; Kovarova, J.; Fencl, J.; Bouda, T.; Janigova, I. Comparison of one-step and sequentially irradiated ultra-high molecular weight polyethylene for total joint replacements. J. Biomed. Mater. Res. Part B Appl. Biomater. 2013, 101B, 414–422. [Google Scholar] [CrossRef]
- Balta-Calleja, F.J.; Kilian, H.G. A novel concept of describing elastic and plastic properties of semicrystalline polymers: Polyethylene. Colloid Polym. Sci. 1985, 263, 697–707. [Google Scholar] [CrossRef]
- Lorenzo, V.; Perena, J.M.; Fatou, J.M.G. Relationships between Mechanical Properties and Microhardness of Polyethylenes. Angew. Makromol. Chem. 1989, 172, 25–35. [Google Scholar] [CrossRef]
- Demetrio da Silva, V.; Ribeiro de Barros, I.; Silva da Conceicao, D.K.; Nunes de Almeida, K.; Schrekker, H.S.; Amico, S.C.; Jacobi, M.M. Aramid pulp reinforced hydrogenated nitrile butadiene rubber composites with ionic liquid compatibilizers. J. Appl. Polym. Sci. 2020, 137, 48702. [Google Scholar] [CrossRef]
- Habeeb Rahiman, K.; Unnikrishnan, G.; Sujith, G.A.; Radhakrishnan, C.K. Cure characteristics and mechanical properties of styrene–butadiene rubber/acrylonitrile butadiene rubber. Mater. Lett. 2005, 59, 633–639. [Google Scholar] [CrossRef]
- Barghamadi, M.; Karrabi, M.; Ghoreishy, M.H.R.; Mohammadian-Gezaz, S. Effects of two types of nanoparticles on the cure, rheological, and mechanical properties of rubber nanocomposites based on the NBR/PVC blends. J. Appl. Polym. Sci. 2019, 136, 47550. [Google Scholar] [CrossRef]
- van den Heuvel, P.W.J.; Peijs, T.; Young, R.J. Failure phenomena in two-dimensional multi-fibre microcomposites. Part 4: A Raman spectroscopic study on the influence of the matrix yield stress on stress concentrations. Compos. Part A Appl. Sci. Manuf. 2000, 31, 165–171. [Google Scholar] [CrossRef]


| Sample ID | Molar Ratio 1 of Components: DGEBA:D400:D2000 | Tg2 (°C) |
|---|---|---|
| S00 | 2:1:00:0.00 | 59.5 |
| S01 | 2:0.98:0.02 | 55.0 |
| S02 | 2:0.95:0.05 | 49.0 |
| S03 | 2:0.92:0.08 | 44.7 |
| S04 | 2:0.85:0.15 | 32.5 |
| S05 | 2:0.80:0.20 | 27.8 |
| S06 | 2:0.78:0.22 | 26.0 |
| S07 | 2:0.70:0.30 | 16.9 |
| S08 | 2:0.65:0.35 | 12.7 |
| S09 | 2:0.30:0.70 | −11.3 |
| S10 | 2:0.00:1.00 | −23.2 |
Publisher’s Note: MDPI stays neutral with regard to jurisdictional claims in published maps and institutional affiliations. |
© 2020 by the authors. Licensee MDPI, Basel, Switzerland. This article is an open access article distributed under the terms and conditions of the Creative Commons Attribution (CC BY) license (http://creativecommons.org/licenses/by/4.0/).
Share and Cite
Slouf, M.; Strachota, B.; Strachota, A.; Gajdosova, V.; Bertschova, V.; Nohava, J. Macro-, Micro- and Nanomechanical Characterization of Crosslinked Polymers with Very Broad Range of Mechanical Properties. Polymers 2020, 12, 2951. https://doi.org/10.3390/polym12122951
Slouf M, Strachota B, Strachota A, Gajdosova V, Bertschova V, Nohava J. Macro-, Micro- and Nanomechanical Characterization of Crosslinked Polymers with Very Broad Range of Mechanical Properties. Polymers. 2020; 12(12):2951. https://doi.org/10.3390/polym12122951
Chicago/Turabian StyleSlouf, Miroslav, Beata Strachota, Adam Strachota, Veronika Gajdosova, Vendulka Bertschova, and Jiri Nohava. 2020. "Macro-, Micro- and Nanomechanical Characterization of Crosslinked Polymers with Very Broad Range of Mechanical Properties" Polymers 12, no. 12: 2951. https://doi.org/10.3390/polym12122951