
TiO2 Modified Geopolymers for the Photocatalytic Dye Decomposition
by
 , , ,
, , ,
Martina Novotná
1,2 ,
,
Petr Knotek
3,
Tomáš Hanzlíček
1,
Petr Kutálek
4,*,
Ivana Perná
1,
Klára Melánová
4,
Eva Černošková
4 and
Kateřina Kopecká
3,5 1
Department of Material Structure and Properties, Institute of Rock Structure and Mechanics, Czech Academy of Sciences, V Holešovičkách 94/41, 18209 Prague 8, Czech Republic
2
Department of Glass and Ceramics, University of Chemistry and Technology Prague, Technická 5, 16628 Prague 6, Czech Republic
3
Department of General and Inorganic Chemistry, Faculty of Chemical Technology, University of Pardubice, Studentská 573, 53210 Pardubice, Czech Republic
4
Joint Laboratory of Solid State Chemistry, Faculty of Chemical Technology, University of Pardubice, Studentská 84, 53210 Pardubice, Czech Republic
5
Synpo, a.s., S. K. Neumanna 1316, 53207 Pardubice, Czech Republic
*
Author to whom correspondence should be addressed.
Crystals 2021, 11(12), 1511; https://doi.org/10.3390/cryst11121511
Submission received: 5 November 2021
/
Revised: 24 November 2021
/
Accepted: 1 December 2021
/
Published: 3 December 2021
(This article belongs to the Special Issue Geopolymer Composites)
Abstract
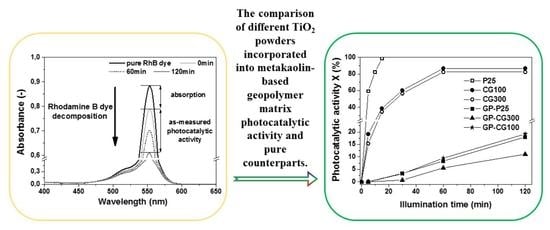
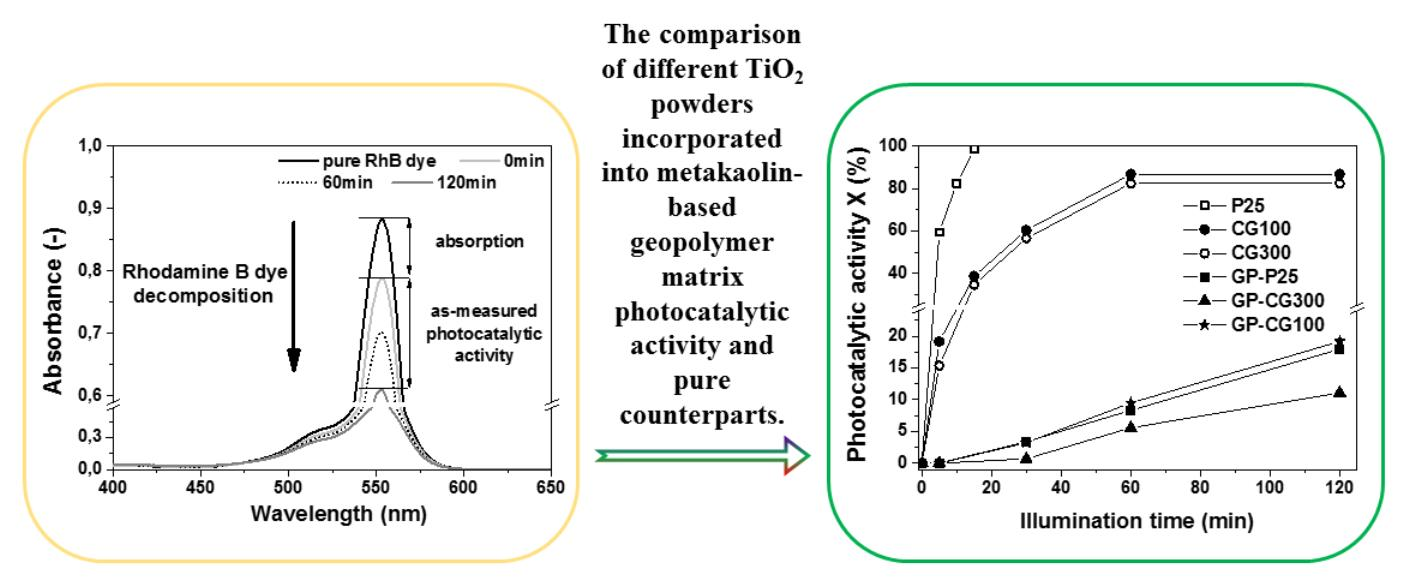
:This article studies the photocatalytic activity of three types of industrially produced TiO2 powder (P25, CG100 and CG300) incorporated into a parent geopolymer matrix, and their pure counterparts, based on the decomposition of Rhodamine B dye. Rhodamine B dye is applied as a model substance because it is frequently used in the textile industry and thus may be present in the wastewater. The average particle size, specific surface area and mineralogical composition of TiO2 powders have been determined. The geopolymer matrix works well as a supporting material for the CG100 and P25 pure types of TiO2 powder as these input materials have better properties such as a higher average particle size, lower specific surface area, mineralogicalcomposition, etc., than the CG300 TiO2 powder. These properties (or their combination) affect the photocatalytic activity of the resulting materials, which may thus become advanced composites with an additional purifying ability, e.g., materials that can be used for wastewater treatment or air purification.
1. Introduction
The industrial and transport activities of our civilization produce adverse effect of air and water pollution. This phenomenon poses serious danger with a significant negative impact on human health. The efforts to sustain current life conditions and to protect the environment have led us to search for new materials. Life protection includes the purification of water and permanent care for clean air [1].
Over the past few decades, many researchers across the world [2,3,4,5] have contributed to a new field in environmental protection, using the photocatalytic reactions produced by TiO2 nanoparticles. It has been discovered that TiO2 nanoparticles are able to free electrons when illuminated by ultra-violet (UV) radiation, which decomposes organic substances into radicals [6,7]. Photoactivity is influenced by the mineralogical form of TiO2—both rutile and anatase forms are photoactive, but anatase exhibits higher photoactivity than rutile [8]. The photoactivity of TiO2 nanoparticles further depends on their particle size and surface area [9,10,11]. Simultaneously, TiO2 is able to form a highly hydrophilic surface [12]. Not only does it facilitate the cleaning of pollutants from the surface of support materials, but it also improves freeze–thaw resistance [13]. For its pollutant purification ability, TiO2 is used in several cleaning methods. The TiO2 photocatalytic reaction has also been applied for antibacterial and fungicidal protection [14,15]. The wider use of TiO2 nanoparticles depends on the penetration of UV radiation to them and on ensuring their photocatalytic effect when attached to a support material. The efficiency of TiO2 nanoparticles is reduced when they are covered by the support materials used [16,17]. Furthermore, organic binders are degraded by photocatalysis, which decomposes organic substances [18,19]. On the other hand, nanoparticles must be well attached to the surface of a long-term stable substrate, because they have to be resistant to washing out by precipitation [20].
Therefore, new support materials for the photoactive nanoparticles (e.g., self-cleaning tiles, paints, glass, concrete, facades, textiles and foils) [13,21,22] and new techniques for their preparation and application (sol-gel, electrolytic processes/electrodeposition, spraying, etc.) [23,24,25,26] are being developed in many branches of purification and cleaning to maintain best photoactivity. Methods for the better fixation of TiO2 nanoparticles are being investigated and developed. It is necessary to attach the particles firmly, while not reducing their photoactivity.
These requirements may be met by geopolymer materials (GPs), which could be used as a suitable substrate for attaching TiO2 nanoparticles. GPs have been considered as alternative binders to Portland cement [27], which is the main cementitious material used in concrete technology. However, GP production is more environmentally friendly, and many industrial by-products (e.g., fly ash, slag) can be used as precursors for their synthesis [27,28,29]. Due to the photocatalytic process, the addition of TiO2 into the GPs can contribute to surface-air purification and self-cleaning functions. A GP matrix is generally prepared by the mixing of powdered, thermally treated clay with aqueous solutions of alkali silicates. The GP materials have a purely inorganic structure and practically amorphous character formed by the -Si-O-Al-O- net [30,31]. Significant GP properties include their high mechanical strength, fire resistance (up to 1100 °C) and alkali and acid resistance [32,33,34,35]. GPs have a porous structure, which may increase the level of UV radiation reaching the nanoparticles incorporated into the GP structure [36]. The pre-eminent qualities of GPs also include their insolubility in water and the long-term stability of the solid matter obtained [30]. Previous studies and experimental works on geopolymer technology have shown, among other extraordinary behavior, the perfect incorporation/encapsulation of various materials, including metals, into the formed GP net [28,37]. Presumably, TiO2 nanoparticles will be incorporated into the aluminosilicate net formed during geopolymerization, which should lead to practically zero extraction into the environment when submerged in water [36,38]. This may help to void [39,40,41,42] the possible harmful effects of TiO2 on human health. The photocatalytic behavior in connection with the geopolymer materials has already been studied on the various geopolymer-based materials, e.g., metakaolin and fly ash [36,43,44]. However, none of these studies focused on the effect of different types of TiO2.
For this reason, the main objective of the current study is to compare the photocatalytic activity of three different industrially produced TiO2 powders incorporated into the parent metakaolin based geopolymer matrix and their pure counterparts. Industrially produced TiO2 powders of different particle sizes, surface areas (BET) and mineralogical compositions are studied. The photocatalytic activity, based on the Rhodamine B dye decomposition of the parent geopolymer matrixes with the addition of different types of TiO2 powder, is evaluated and compared with the parent geopolymer as a reference material and with the mechanical mixture of geopolymer and TiO2 powder. The influence of the input TiO2 powder properties on the photocatalytic activity of incorporated counterparts is discussed.
2. Materials and Methods
2.1. Materials
Activated metakaolin-based clay, a basic material for geopolymer preparation, was supplied by ČLUZ, a.s. (Nové Strašecí, Czech Republic), under the trade mark Mefisto L05. The properties (chemical composition, particle size, etc.) are standardized and guaranteed by the producer.
Blast furnace slag (BFS) was obtained from the textile filters supplied by DESTRO Ltd., (Kladno, Czech Republic).
The chemical compositions and particle-size distributions of the clay material and BFS are shown in Table A1 and Table A2, respectively.
An aqueous alkaline solution of potassium silicates was supplied by Vodní sklo, a.s. (Ústí nad Labem, Czech Republic). The molar ratio (SiO2/K2O = 1.7) and other properties are guaranteed by the producer.
Three types of TiO2 powder, marked as CG100 and CG300 (the producer Precheza a.s., Přerov, Czech Republic) and P25 (the producer Evonik Industries AG, Essen, Germany), were used for the experiments. Their chemical compositions are presented in Table A3. The average primary particle size, specific surface area (BET) and mineralogical composition of the TiO2 powder specified by the producer are presented in Table A4.
Rhodamine B (RhB), with ≥ 95% (HPLC) purity, was obtained from Sigma-Aldrich (St. Louis, MO, USA) and was used for the dye decomposition study.
2.2. Sample Preparation
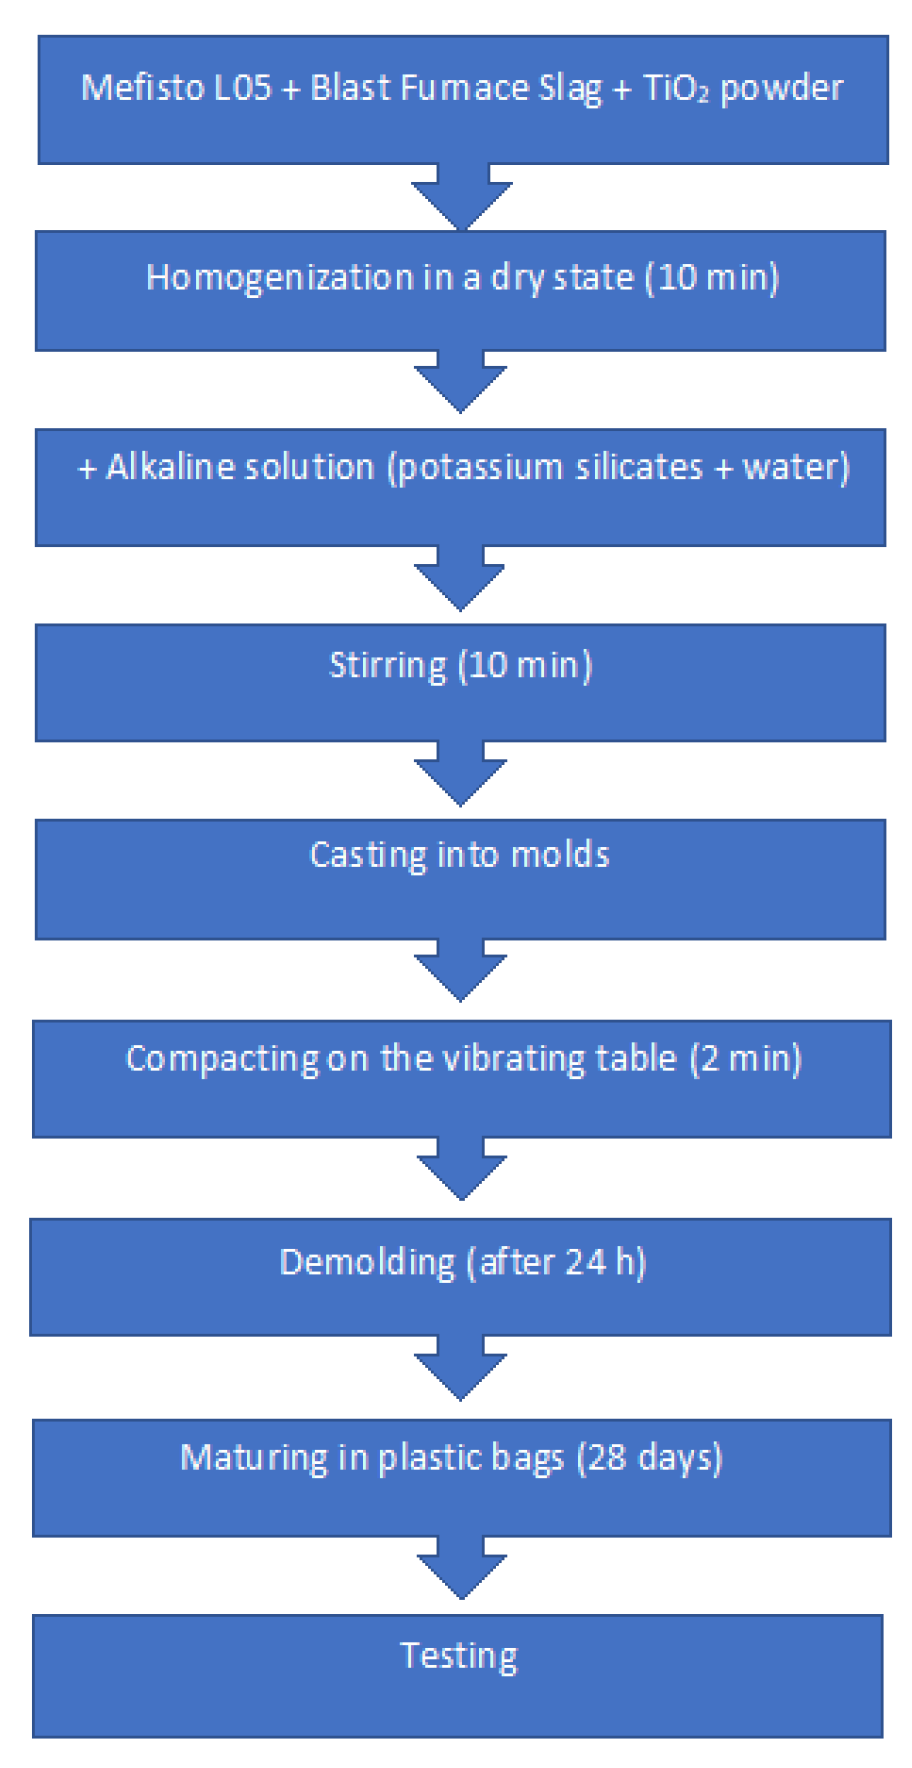
The TiO2 powder was homogenized with the supplied clay (Mefisto L05) and BFS in a dry state for 10 min. The prepared mixture was activated by an aqueous alkaline solution of potassium silicates, which had been prepared by mixing with water (the molar ratios of the geopolymer-matrix components: SiO2/Al2O3 = 3.36; K2O/Al2O3 = 0.78; H2O/K2O = 12.61). The potassium activator was selected because the resulting materials have a lower visible efflorescence and higher compressive strength than those with a sodium activator [45,46]. A homogenized mixture of Mefisto L05, TiO2 powder and BFS was stirred with the alkaline solution for 10 min. Subsequently, the prepared geopolymer mixture was cast into molds and compacted on the vibrating table VSB 40 (Brio Hranice, Czech Republic) for 1 min. The clay/slag ratio was 1:0.33 and 5 g of the TiO2 powder (CG100, CG300 and P25) was added to 100 g of the parent clay material Mefisto L05. The schematic illustration of photocatalysts preparation is shown in Figure A1 in Appendix A. A geopolymer matrix without the addition of TiO2 powder was prepared as a reference sample. The above-mentioned ratios of individual components and the alkaline activator were selected on the basis of previous experiments [47,48].
For clarity, Table 1 summarizes the weights of the individual components used for the preparation of the studied materials. All mixtures were poured into molds and placed into plastic bags. On the second day, solid composites were demolded and stored in plastic bags at laboratory temperature and pressure for 28 days.
Simultaneously, the mechanical mixture (MM-GP-P25) was made by mixing a milled GP reference sample (0.97 g) with 0.03 g of pure P25 TiO2 powder in an agate mortar for 10 min.
2.3. Methods
The dried solid-geopolymer samples were pulverized by a Retsch friction mill (the particle size of 0–0.2 mm). Afterward, the samples were stored in a sealable plastic bag to prevent an increase in the moisture content. The materials prepared in this way were used in the subsequent analyses.
A non-destructive X-ray fluorescence (XRF) spectrometer (Spectro IQ, Kleve, Germany), equipped with an HOPG Barkla crystal was used to determine chemical compositions. The tested samples were prepared by the pressed-pellet method (4.0 g of the material and 0.9 g of the binding additive HWC Hoechst wax, Germany). For the evaluation, X-LabPro software was utilized.
For the determination of the loss on ignition (LOI), the samples were pre-dried and pulverized (at 105 °C up to a constant weight, the particle size of 0–0.2 mm) and subsequently heated in a muffle furnace (a temperature rise of 10 °C/min) to a temperature of 1000 °C with a dwell of 10 min.
Microscopic studies of the samples were performed using an SEM (scanning electron microscope) equipped with an Apollo EDS (energy dispersive spectrometer) silicon drift Si(Li) detector with a FET preamplifier for chemical element X-ray microanalysis. Data were acquired on EDAX TSL OIM software with ZAF corrections. Analyses were performed on polished blocks and powder obtained by milling or rubbing individual samples.
Particle-size distribution was measured by a CILAS 920L (CILAS, Orléans, France) analyzer with a range of 0.7–400 μm, using material suspension in water and detecting particle sizes via the laser-beam reflection. The mean hydrodynamic diameter of industrial TiO2 powder, DH, was measured by a 90Plus/BI-MAS analyzer (Brookhaven Instruments Corp., Holtsville, NY, USA) using dynamic light scattering (DLS). DH values were measured for 30 s at 10 replications, and these data were statistically processed according to the ISO 13321 and 22412. Before measurement, the solids were mixed with water by a laboratory shaker for 25 min. For more details, see [49].
The powder X-ray diffraction (XRD) patterns (Cu Kα, λ = 1.5418 Å) were recorded on powdered samples using a D8 Advance diffractometer (Bruker AXS, Karlsruhe, Germany) with a Bragg-Brentano θ-θ goniometer (radius 217.5 mm) equipped with a Ni-beta filter and a LynxEye detector. The scan was performed at room temperature from 5 to 80° (2 θ) in 0.01° steps with a counting time of 1 s per step. The mass concentrations of the phases present were calculated by full-pattern matching using EVA software [50,51]. For each selected pattern, EVA adjusted the scaling factor and width parameters by fitting, and the results were transformed into concentrations using the I/Icor factors from the PDF-4+ database [52].
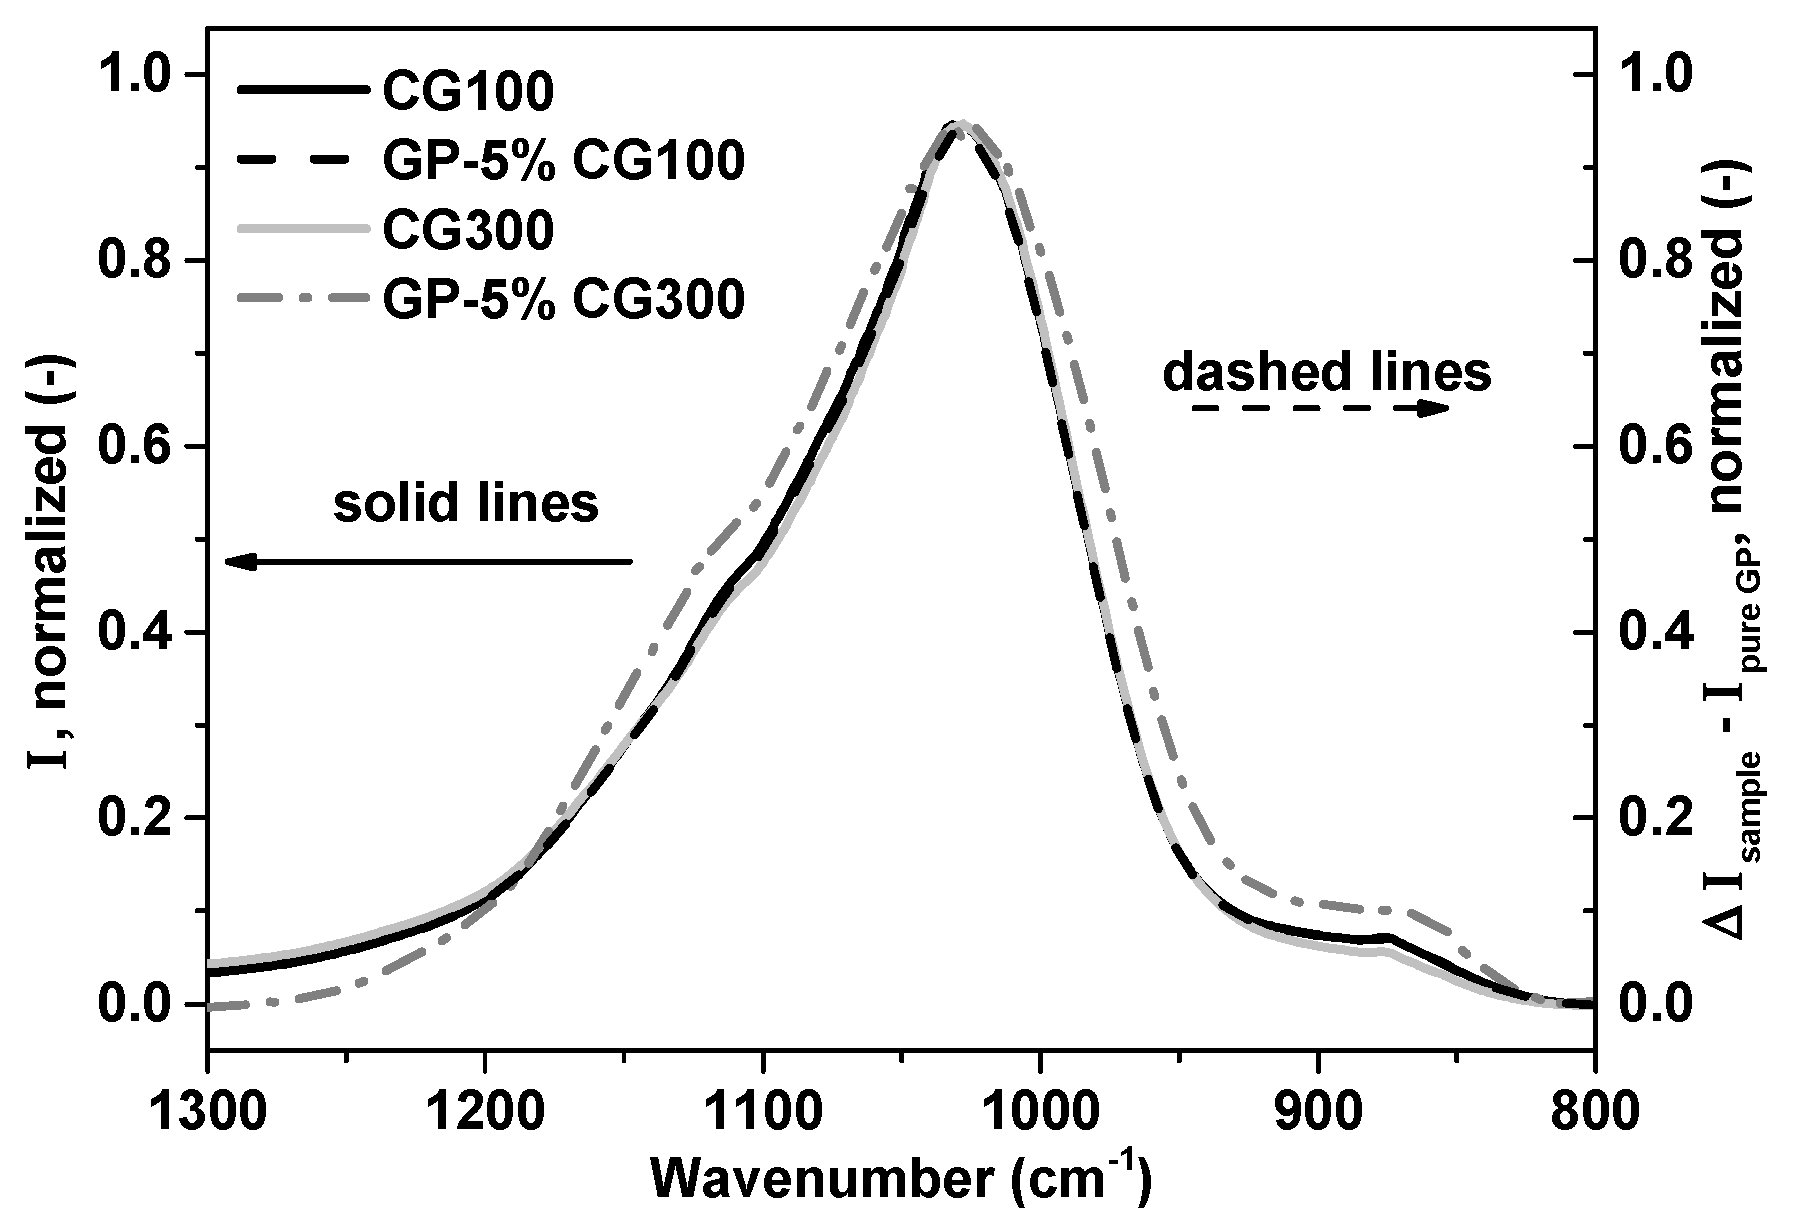
The Fourier transform infrared (FTIR) transmission spectra of the samples were measured by an FTIR Thermo Nicolet Nexus spectrophotometer using the KBr technique with a total number of 128 scans and the resolution of 4 cm−1. A 3 mm aperture was used for these measurements. The spectra were normalized to the band with the highest intensity. The parent geopolymer material was used as the background for incorporated photocatalysts.
2.4. Photocatalytic Activity
The photocatalytic activity of the industrial TiO2 photocatalysts incorporated into the geopolymer matrix and their pure counterparts under UV light illumination was evaluated based on dye decomposition. Before photocatalytic testing, 0.15 g of the photocatalyst was mixed with 60 ml of a solution of RhB dye and distilled water (in the concentration of 1 × 10⁻⁵ mol·dm−3, pH = 7.0 measured by pocked pH meter ad 110 ph) and stirred at 500 rpm for 5 min to obtain a uniform dispersion. After this, the dispersion was illuminated by a 250 nm enhanced Mercury Xenon lamp (200 W), housed in a LC-08 (Hamamatsu). The UV photons were generated in three wavelength regions (photon energy, Eph, in parentheses), of λ = 360 nm (Eph = 3.44 eV), λ = 310 nm (Eph = 4 eV) and λ = 250 nm (Eph = 4.96 eV), which cover almost 80% of the light energy output of the lamp. We also used bandpass filters with transmissions in the range of 280–400 or 320–410 nm. For more details as well as for the spectral dependence of the normalized intensity of the light source, see our previous work [53]. The samples were obtained at specific reaction times; before UV-Vis spectroscopy measurements, they were further centrifuged at 6000 rpm for 2 min in order to eliminate possible light scattering on photocatalyst particles. The photocatalytic activity of the photocatalysts was evaluated based on RhB dye decomposition. The absorbance spectra of the RhB dye were measured using a PerkinElmer Lambda 20 spectrophotometer in the spectral region of 400–750 nm, where the main broad band of the RhB dye was found with the absorption maxima at 555 nm. The photocatalytic activity (X) was calculated according to the following equation: X (%) = (A0 − A)/A0 × 100, where X is the dye conversion in %, A0 is the initial dye absorbance at the absorption maxima and A is the dye absorbance at the absorption maxima at the specific reaction time of photocatalysis [54]. The error in the determination of X was estimated to be ± 1%. Furthermore, in order to exclude the possible absorption of dye by the photocatalysts themselves, identical dispersions were analyzed in the same manner under the same experimental conditions, but without illumination.
It should also be emphasized that we have studied the possible decomposition of RhB dye caused by the illumination alone in the absence of a photocatalyst under the same testing conditions.
3. Results and Discussion
3.1. Characterization of the Studied Materials
The chemical composition (the average of the three measurements) of the raw materials (Mefisto L05 and BFS) is shown in Table A1. The chemical composition of the clay material Mefisto L05 agrees with the data of the supplier, ČLUZ a.s., (Nové Strašecí). This material has a high content of silica and alumina (52.34 and 41.54 wt.%, respectively). The main components of BFS are calcium oxide (39.78 wt.%), silica (20.79 wt.%), alumina (7.36 wt.%) and sulfur trioxide (10.11 wt.%).
The results of particle-size distribution presented in Table A2 demonstrate that the clay material Mefisto L05 has very fine particles, with sizes below 25 μm (d50 = 3.94 µm). In comparison, BFS has larger particles, with sizes below 45 μm (d50 = 5.01 µm).
The results of the chemical analysis (XRF) of TiO2 powder, presented in Table A3, show the difference between the manufacturing in Precheza a.s. and Evonik Industries AG. Based on the residual content of Cl (0.12 wt.% in P25), it was confirmed that TiO2 P25 is produced by a TiCl4 vapor-fed flame pyrolysis process [55]. On the other hand, CG100 and CG300 contain a residual amount of SO3 (1.36 and 1.22 wt.% in CG100 and CG300, respectively), which proves their manufacture by a sulfate technology [56]. The total content of TiO2 in CG100, CG300 and P25 is 93.49, 91.19 and 97.62 wt.%, respectively. The lowest LOI was observed for P25, which could be caused by the method of manufacturing.
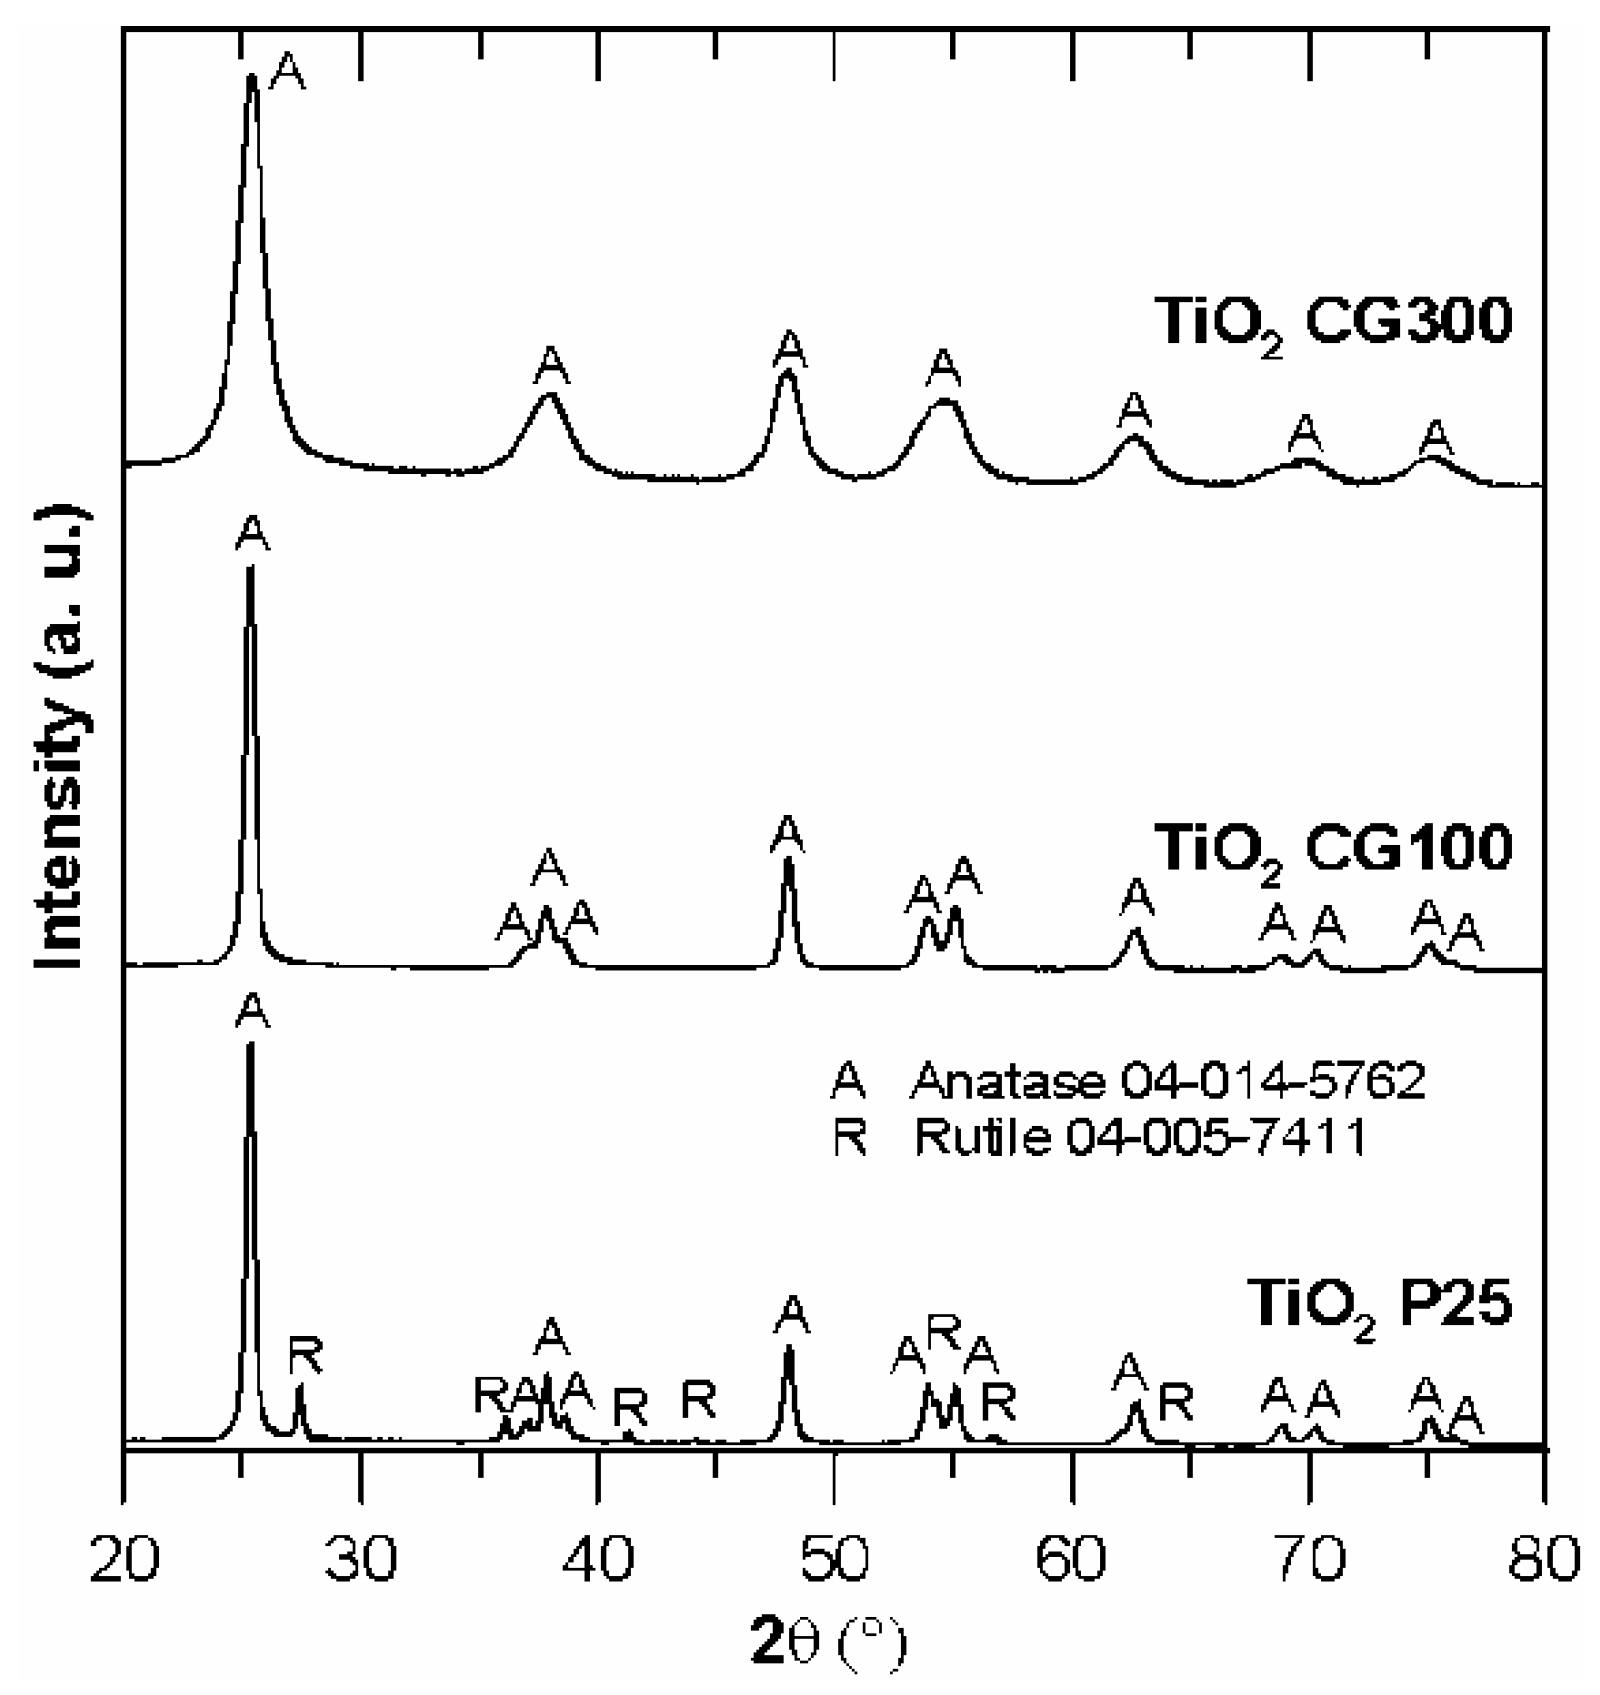
Powder X-ray diffraction patterns of the starting TiO2 are shown in Figure 1. Pure CG100 and CG300 contain only anatase, P25 contains approximately 87 wt.% of anatase and 13 wt.% of rutile, which agrees with the data of the producers. Crystallite sizes computed by the Scherrer equation are 18 nm, 6 nm and 20 nm for GC100, GC300 and P25, respectively, which is in good agreement with the average size of the particles provided by the producers (see Table A4).
We have also characterized the TiO2 particle-size distribution that could occur in a water colloid during sample preparation by dynamic light scattering. It is clear from Figure 2 that TiO2 forms agglomerates with the average particle size in the ranges of 150–350 nm and 720–1700 nm, depending on the TiO2 powder type. These results are comparable with the literature data where the authors dispersed TiO2 in water—see, e.g., [57,58].
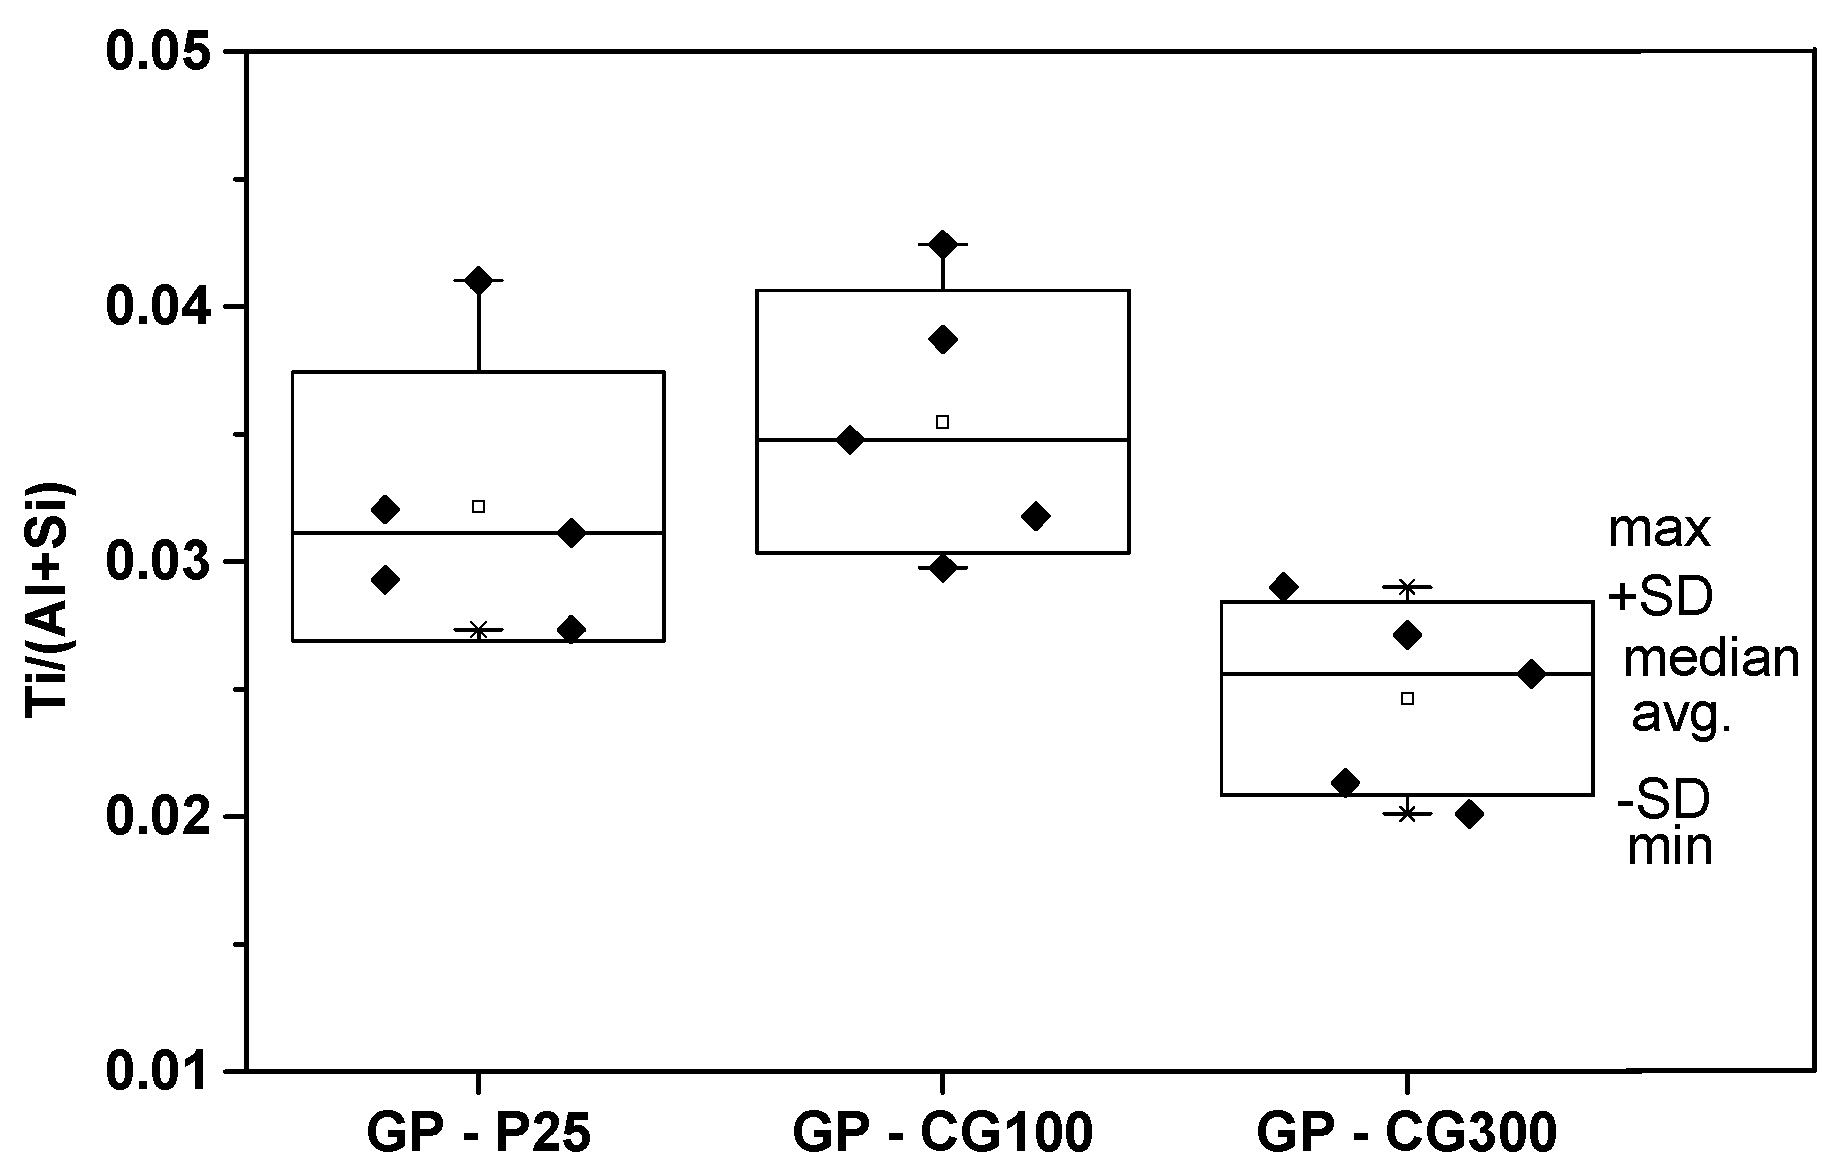
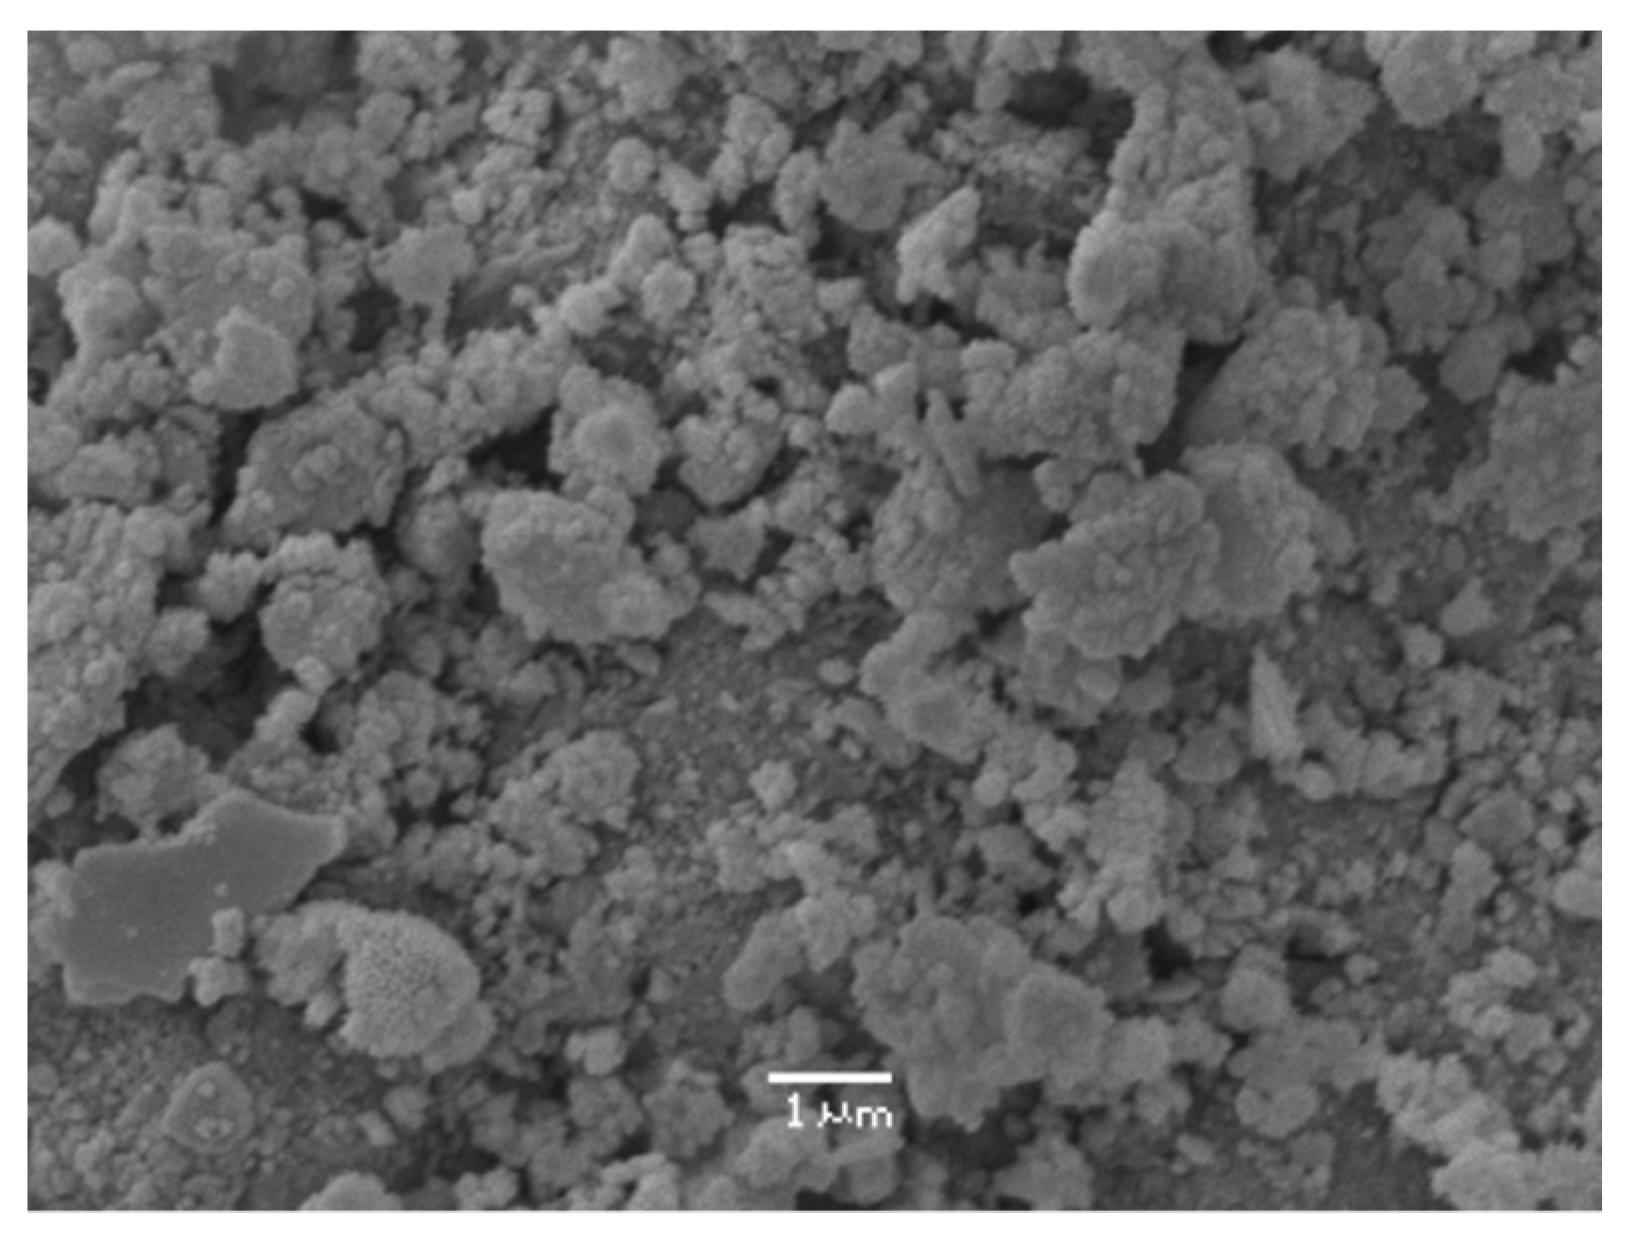
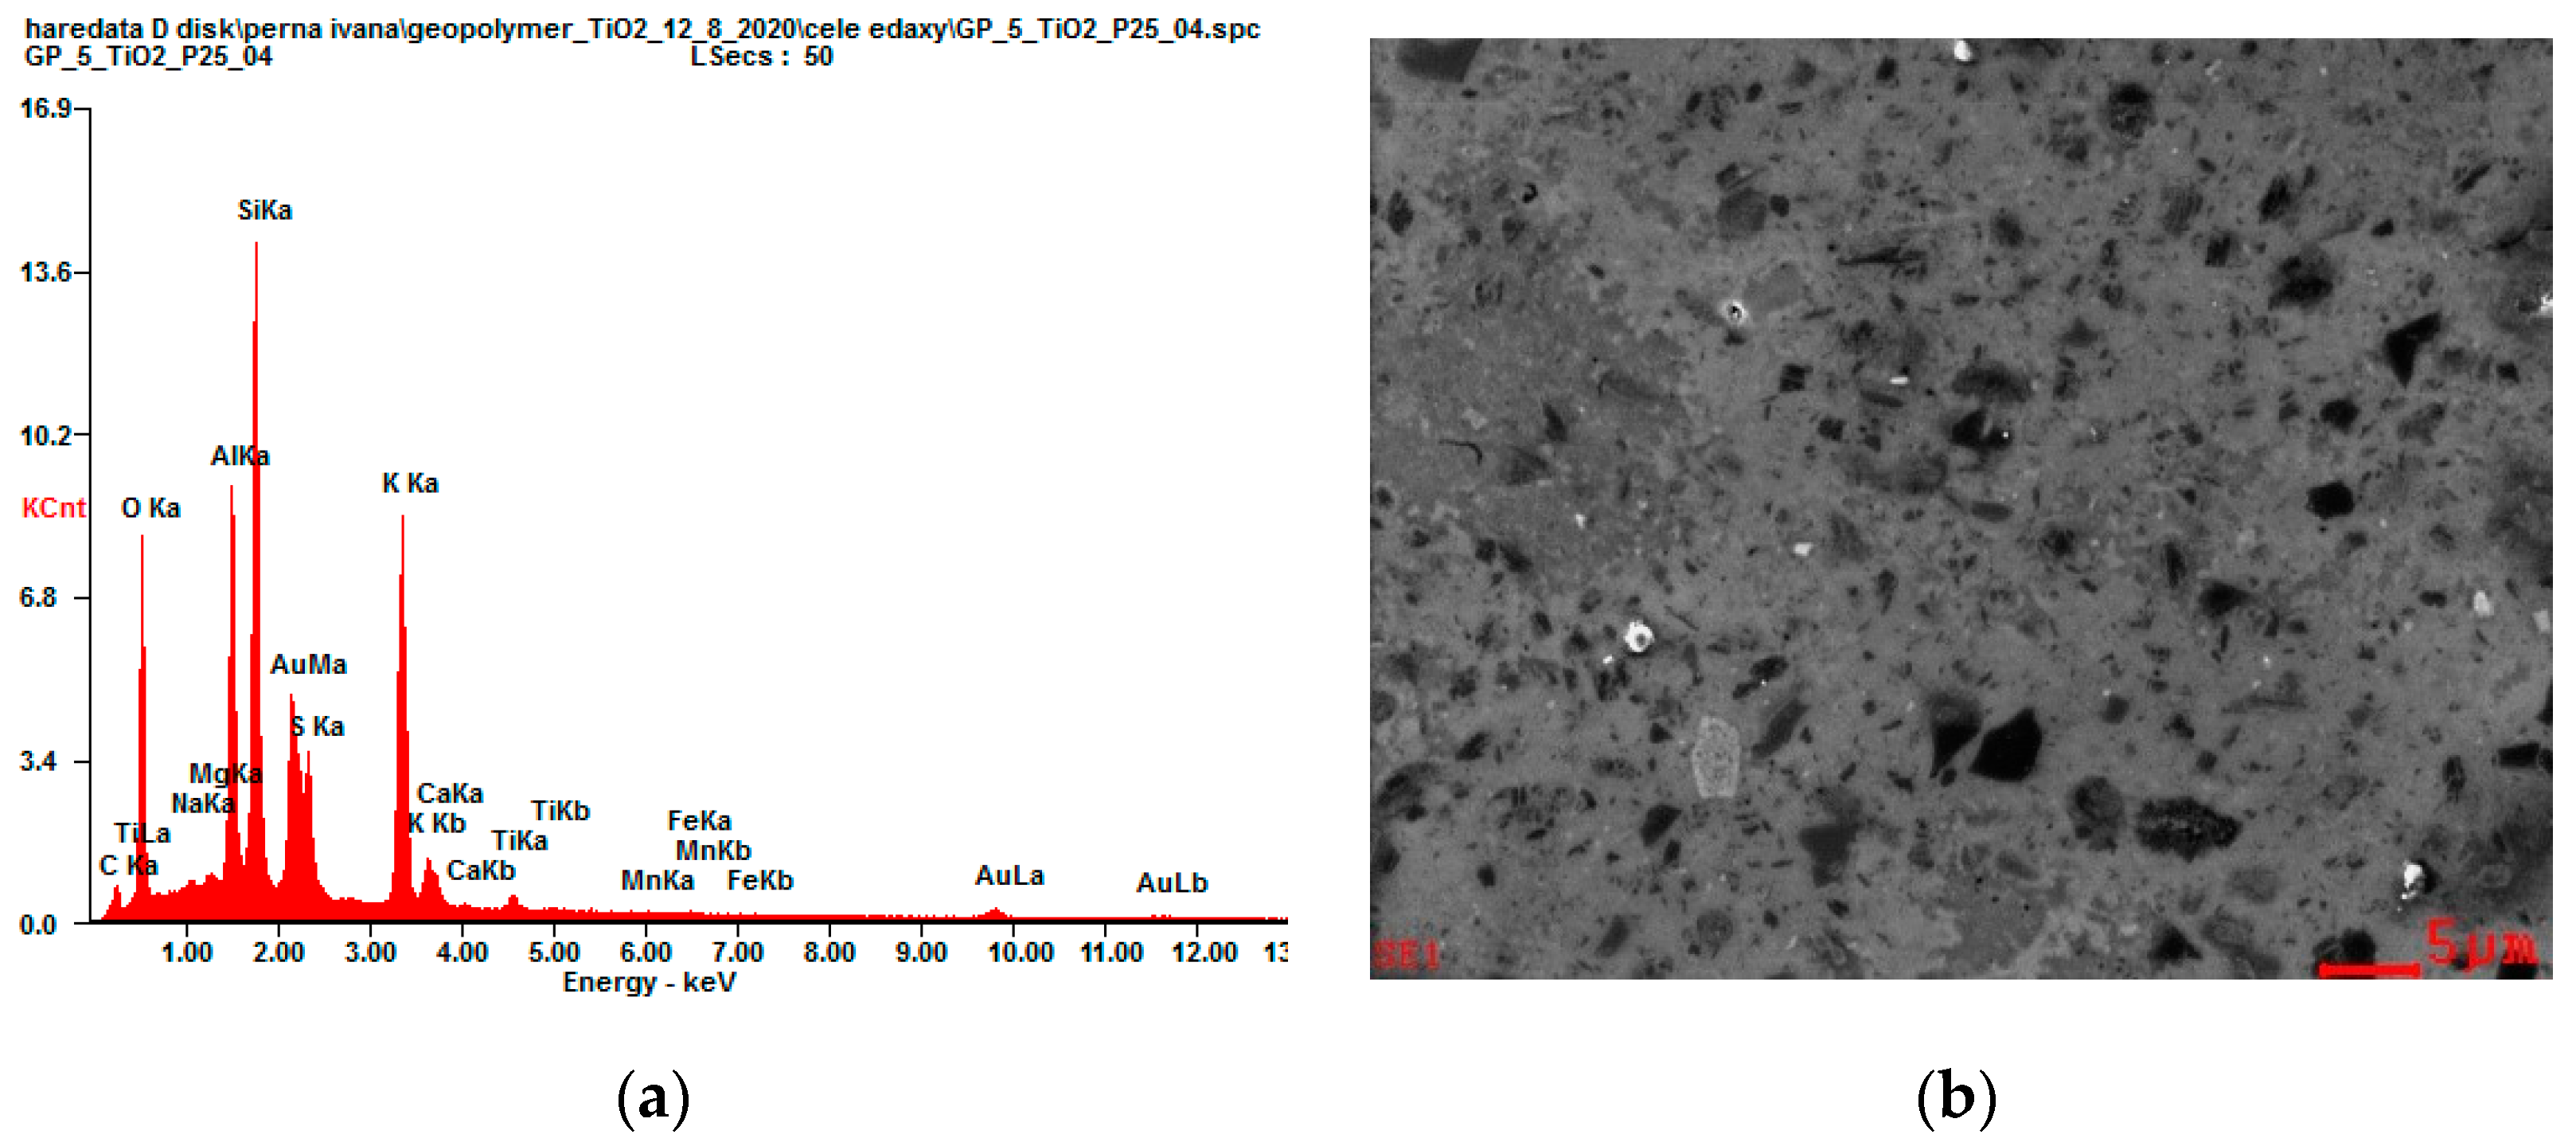
To determine the content and distribution of TiO2 in the incorporated samples, two different routes were followed. The first was an analysis of a cut and polished piece in four different places of the identical cut. The elemental analysis shows a comparable content of titanium in all samples treated with the different types of titanium dioxides and its homogeneous distribution within the sample (see Table 2 and also Figure A2 in Appendix A for the representative EDS spectra and SEM image and Table A6). The other route was an analysis of milled materials as an alternative (more relevant to our experiment) pre-analysis preparation. To avoid the problem of the electron penetration depth being comparable to grain size, the ratio of the analyte signal (Ti) to the cumulative signal of (Al+Si) was used for seven different grains. This proved the homogeneity of Ti dispersion over the different grains (see Figure 3) and at the same time the comparable Ti content in the different incorporated samples. Furthermore, Figure 4 shows the representative SEM image for GP-P25, with the average particle size of this sample being ≈ 500–600 nm. Agglomerates of P25 TiO2 powder with the average particle size ≈ 1µm, present in a water colloid (see Figure 2), were not observed here and thus were broken during incorporation into the GP matrix. Figure 4 also shows the successful incorporation of TiO2 into the geopolymer structure. In contrast to the work of Maiti et al. [54], where the authors found TiO2 nanoparticles of different sizes in their respective GP matrices, we observed homogenous material without traces of agglomerated TiO2.
The geopolymer source materials contain impurities such as titanium dioxide (see Table A1), and the prepared parent geopolymer matrix contains the TiO2 (0.94 wt.%)—see Table 3. The studied materials with the industrially produced TiO2 powder incorporated into the GP matrix were prepared by mixing 5 g of TiO2 powder, 100 g of the clay material Mefisto L05, 33 g of the BFS material and the corresponding amounts of alkalis. The chemical composition of the prepared samples was checked using an XRF analysis, which detected 3.42, 2.93 and 3.31 wt.% of TiO2 in GP-CG100, GP-CG300 and GP-P25 materials, respectively (Table 3). The elemental maps obtained from the electron microscopy also show the homogenous distribution of titanium dioxide over the entire volume of the studied geopolymer with the incorporated TiO2.
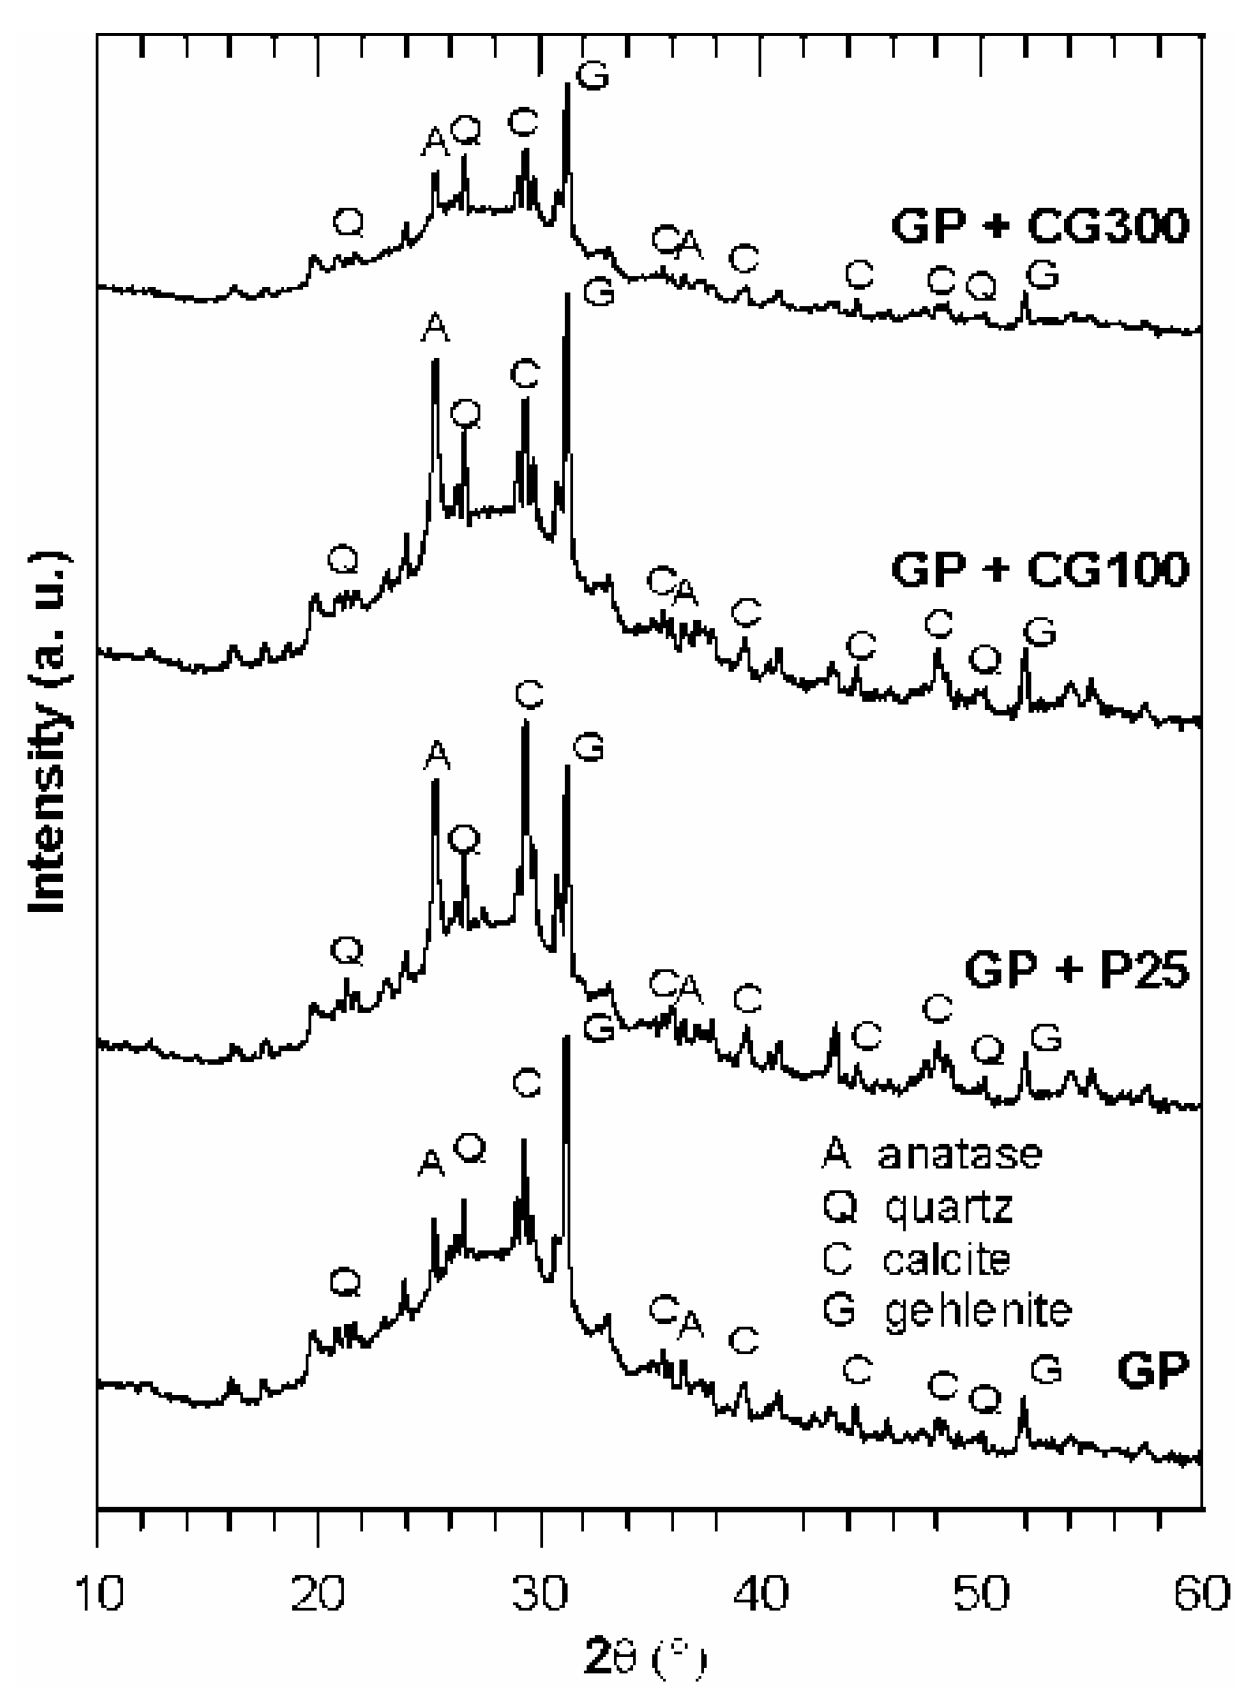
Powder X-ray diffraction patterns of the milled geopolymers are shown in Figure 5. The parent geopolymer (GP) contains, aside from a large quantity of amorphous geopolymers, quartz (JCPDS No. 00-046-1045), calcite (JCPDS No. 00-047-1748), gehlenite (JCPDS No. 00-035-0755) and anatase (JCPDS No. 04-014-5762). Diffraction lines of these phases have also been observed in the case of geopolymers with added TiO2. The intensity of the (101) line of anatase at about 25.3° in the diffraction pattern of GP-CG300 seems to be similar to that of the GP, whereas in the case of GP-P25 and GP-CG100, the intensity of this diffraction line increases. To confirm this, the peak areas of the most intensive diffraction lines of anatase, calcite and quartz in the diffractograms were determined; they are shown in Table 4. As evident from Table 4, the anatase/quartz and anatase/calcite peak-area ratios for GP-P25 and GP-CG100 samples are about three times larger than in the case of the parent GP, which is in accordance with the increase in theTiO2 content. On the other hand, the values of the peak-area ratios for the GP-CG300 sample remained practically the same as in the untreated GP, although the TiO2 content in GP-CG300 also increased to about 3 wt.%. Furthermore, if we compare the proportion of the amorphous phase in the individual samples, it is clear that in the case of GP-CG100 and GP-P25 it was reduced in comparison with the parent geopolymer matrix by the addition of TiO2. On the other hand, the proportion of the amorphous phase in the GP-CG300 sample is comparable to the parent geopolymer. Based on these data, we can assume that the added TiO2 CG300 (probably due to the smaller particle size and thus larger surface area (see Table A4)) reacts with the geopolymer matrix and therefore the addition of CG300 does not lead to an increase in the anatase content in the material.
3.2. Photocatalytic Activity
Before the photocatalytic testing, we studied (i) the possible decomposition of RhB under the used UV illumination without the presence of photocatalysts and (ii) the possible absorption of RhB dye by the parent geopolymer material (pure or with incorporated TiO2) due to its porous structure. Both of these phenomena could significantly influence the as-measured photocatalytic activity.
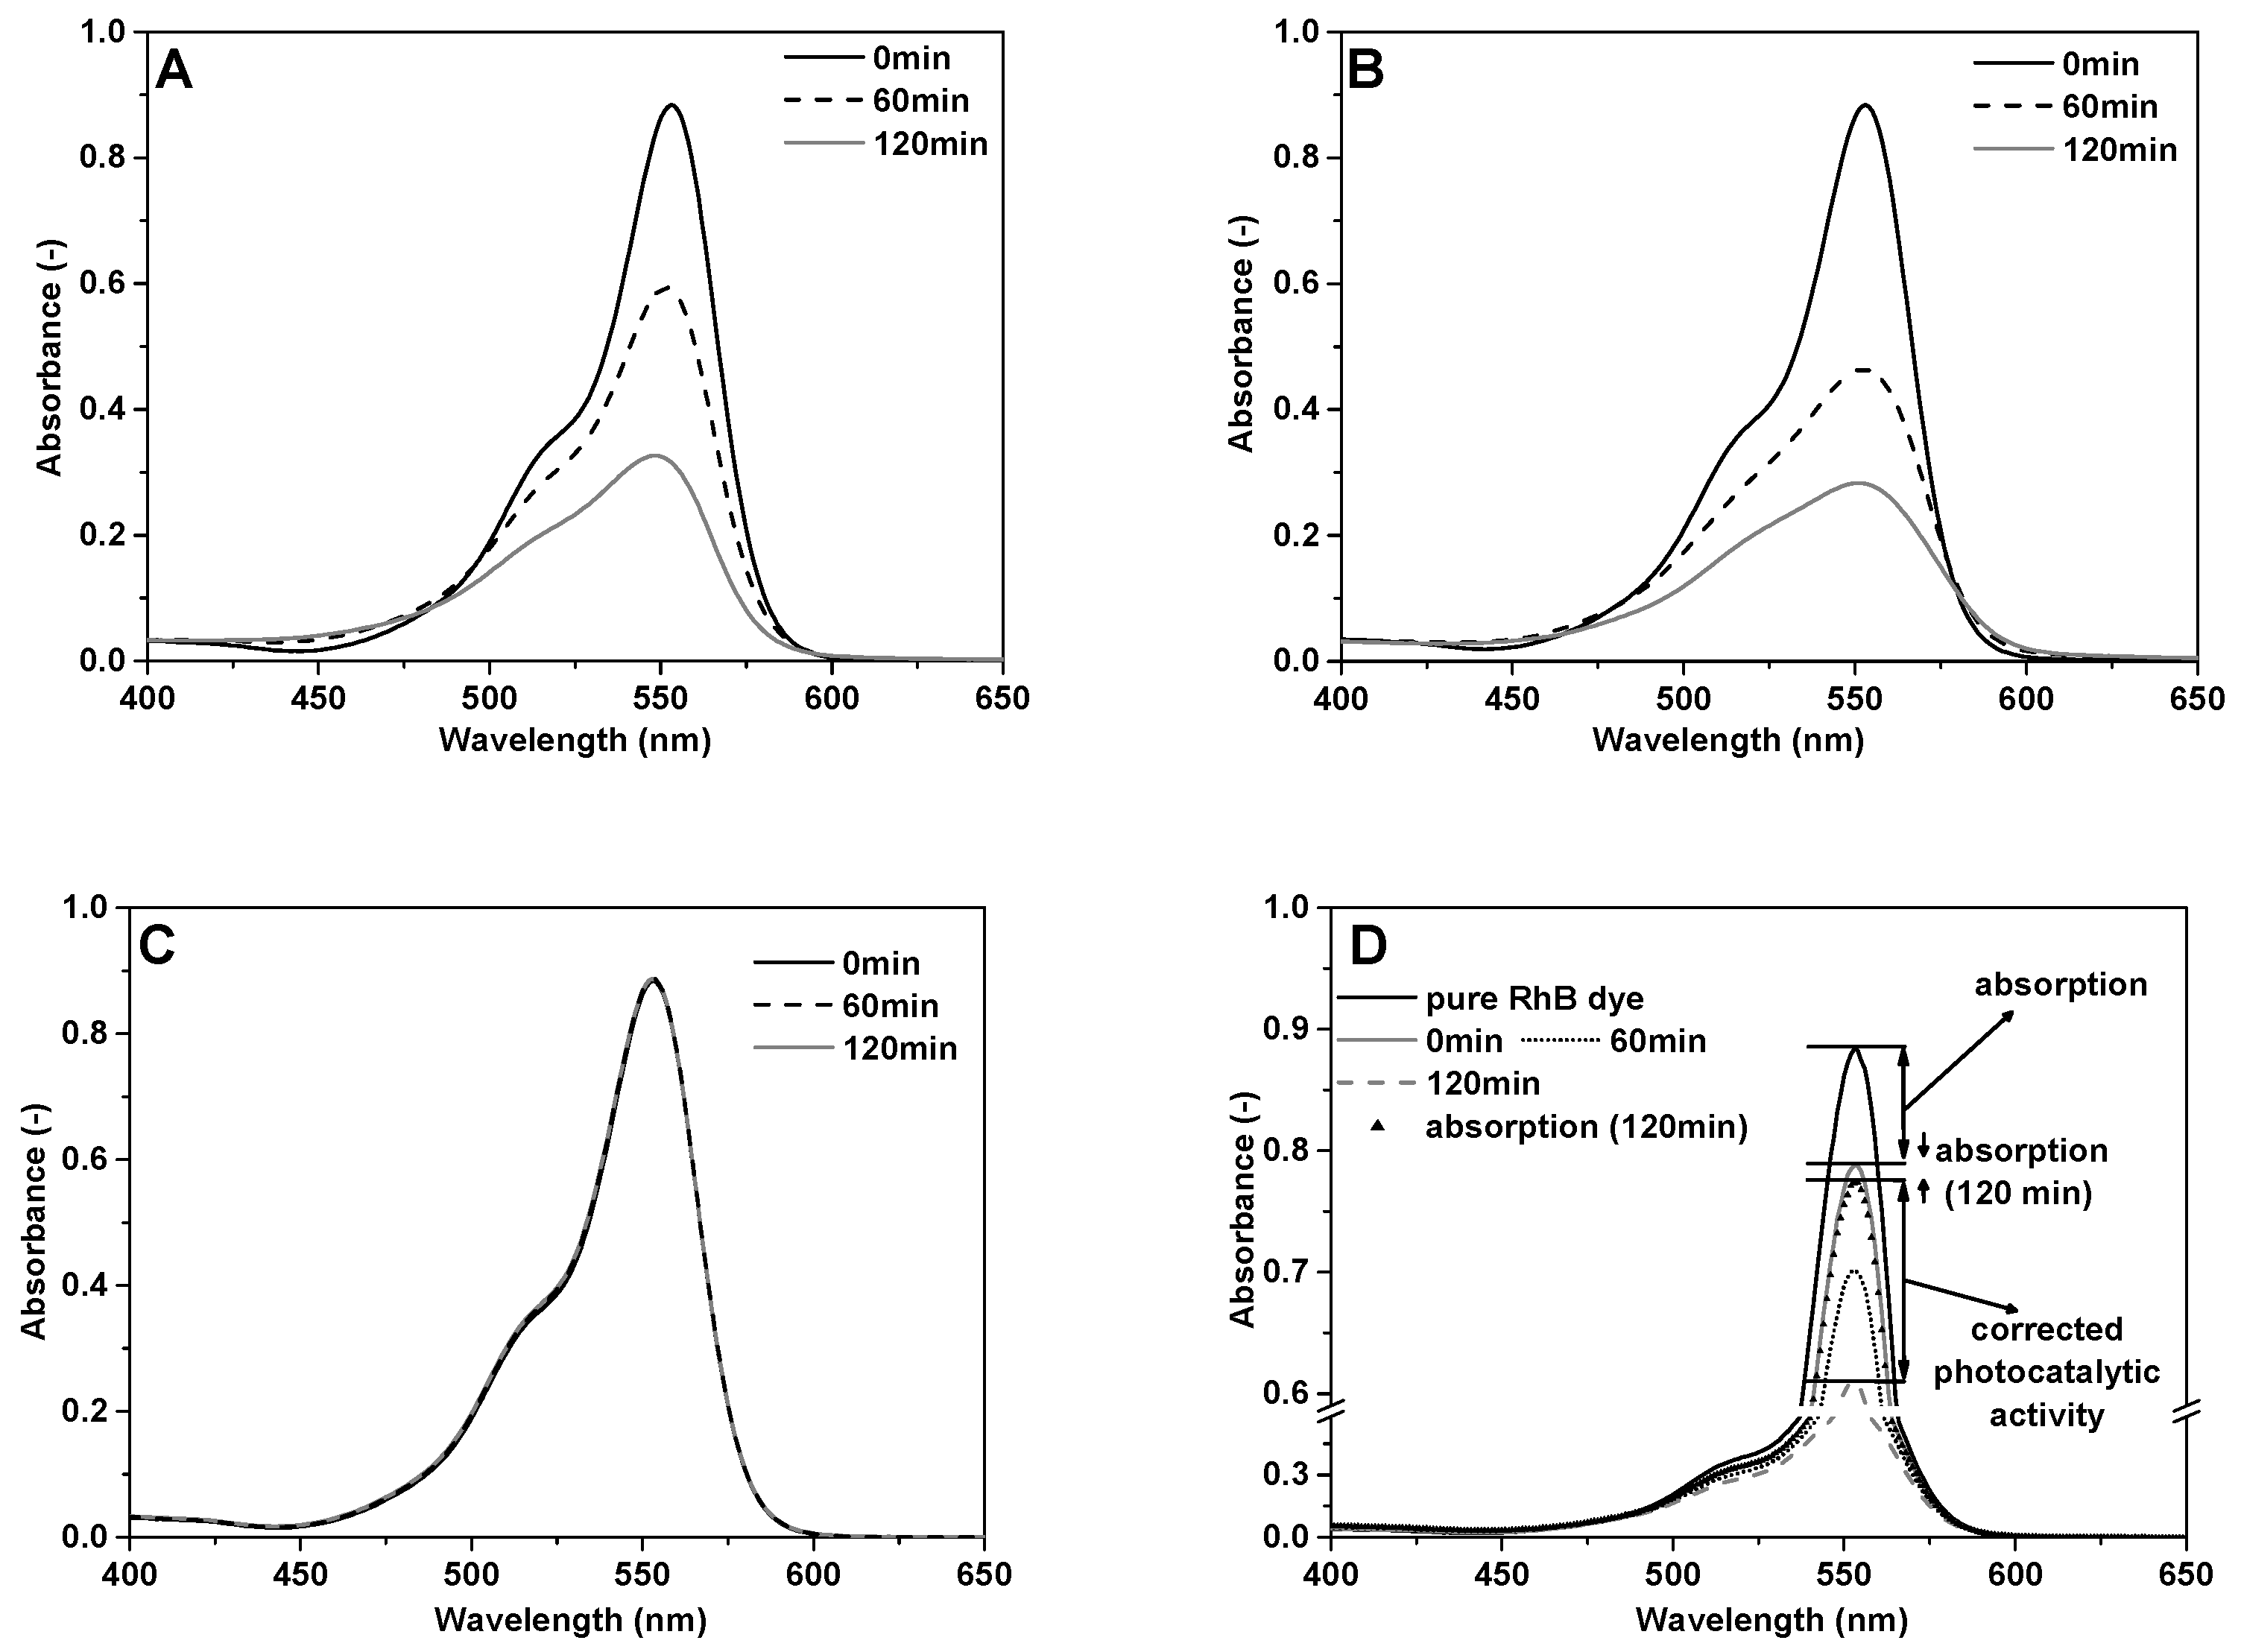
Figure A3A–C in Appendix A shows the change of the RhB dye absorption spectra during the illumination under different UV illumination conditions. It is evident that the RhB dye is decomposed under the illumination by UV photons generated either at λ = 250, 310 and 360 nm (without any filter) and 50% of the total intensity (Figure A3A) or only at λ = 360 nm (using a filter transmitting in the range of 320–410 nm) and 100% of the total light source intensity (Figure A3B). In both cases, RhB dye absorbance at the absorption maxima gradually decreases during illumination. After 120 min of illumination, the absorbance of the RhB dye decreases from 0.883 to 0.325 and to 0.281, respectively (Figure A1A,B, respectively). Under milder illumination conditions, with UV photons generated only at λ = 360 nm (using a filter transmitting in the range of 320–410 nm) and 50% of the total light source intensity, the RhB was stable (Figure A3C). Under these illumination conditions, the absorbance at the absorption maxima at λ = 555 nm of the RhB dye remained the same for 120 min of illumination and the RhB dye did not decompose. Therefore, only these illumination conditions were used in further photocatalytic tests.
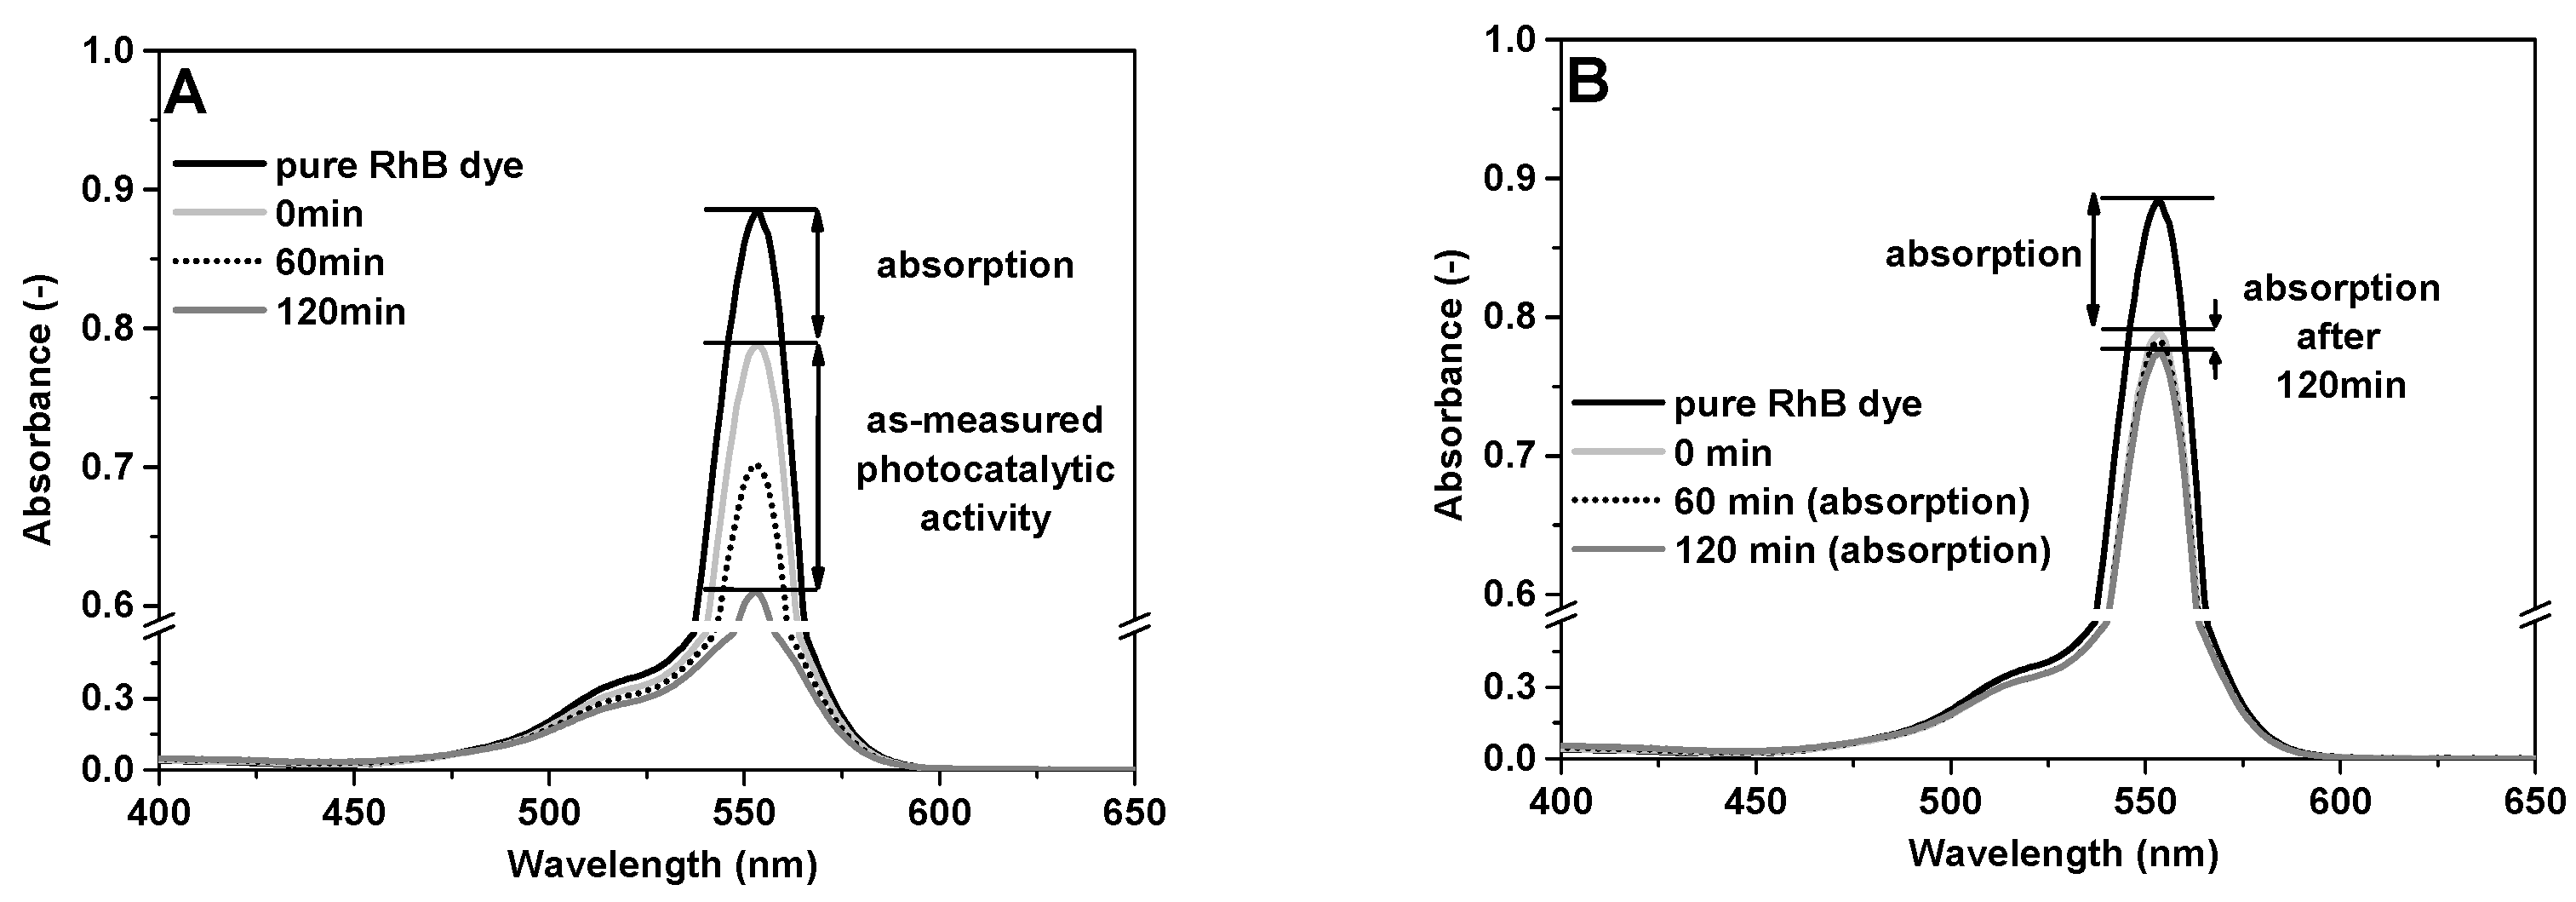
The representative change of RhB dye absorption spectra during the illumination under the above-mentioned conditions in the presence of the GP-P25 photocatalyst is shown in Figure 6A. Based on the decrease in the RhB dye absorbance at the absorption maxima (marked as “absorption” in Figure 6A), the RhB dye is absorbed by the porous geopolymer structure, due to the method of synthesis (polycondensation reactions) [27,28,30], before the photocatalytic testing during the photocatalyst dispersion. The absorbance of RhB dye at the absorption maxima (λ = 555 nm) decreased from 0.883 to 0.793 after 5 min of dispersion (Figure 6A). After this, the light source was switched on and the photocatalytic activity induced by UV illumination was monitored. With an increase in the illumination time, RhB dye absorbance gradually decreased. The absorbance decreased from 0.793 to 0.702 and 0.611 after 60 and 120 min of illumination, respectively (see Figure 6A and the difference between the lines “0 min” and “120 min” marked as “as-measured photocatalytic activity”). We continued to monitor the possible absorption of the RhB dye by the porous structure of the photocatalyst by the analysis of the identical dispersion, but without the illumination. The absorption of the RhB dye continued to proceed as the absorbance of the RhB dye decreased from 0.793 to 0.782 and 0.778 after 60 and 120 min, respectively (see Figure 6B and also Figure A3D). The photocatalytic activity X (%) was calculated according to the following equation: X (%) = (A0 − At)/A0 × 100, where, based on the above-mentioned experiments A0, is the initial dye absorbance at the absorption maxima after 5 min of dispersion and At is the dye absorbance at the absorption maxima at the specific time of photocatalysis corrected by the RhB dye absorption by the porous geopolymer structure.
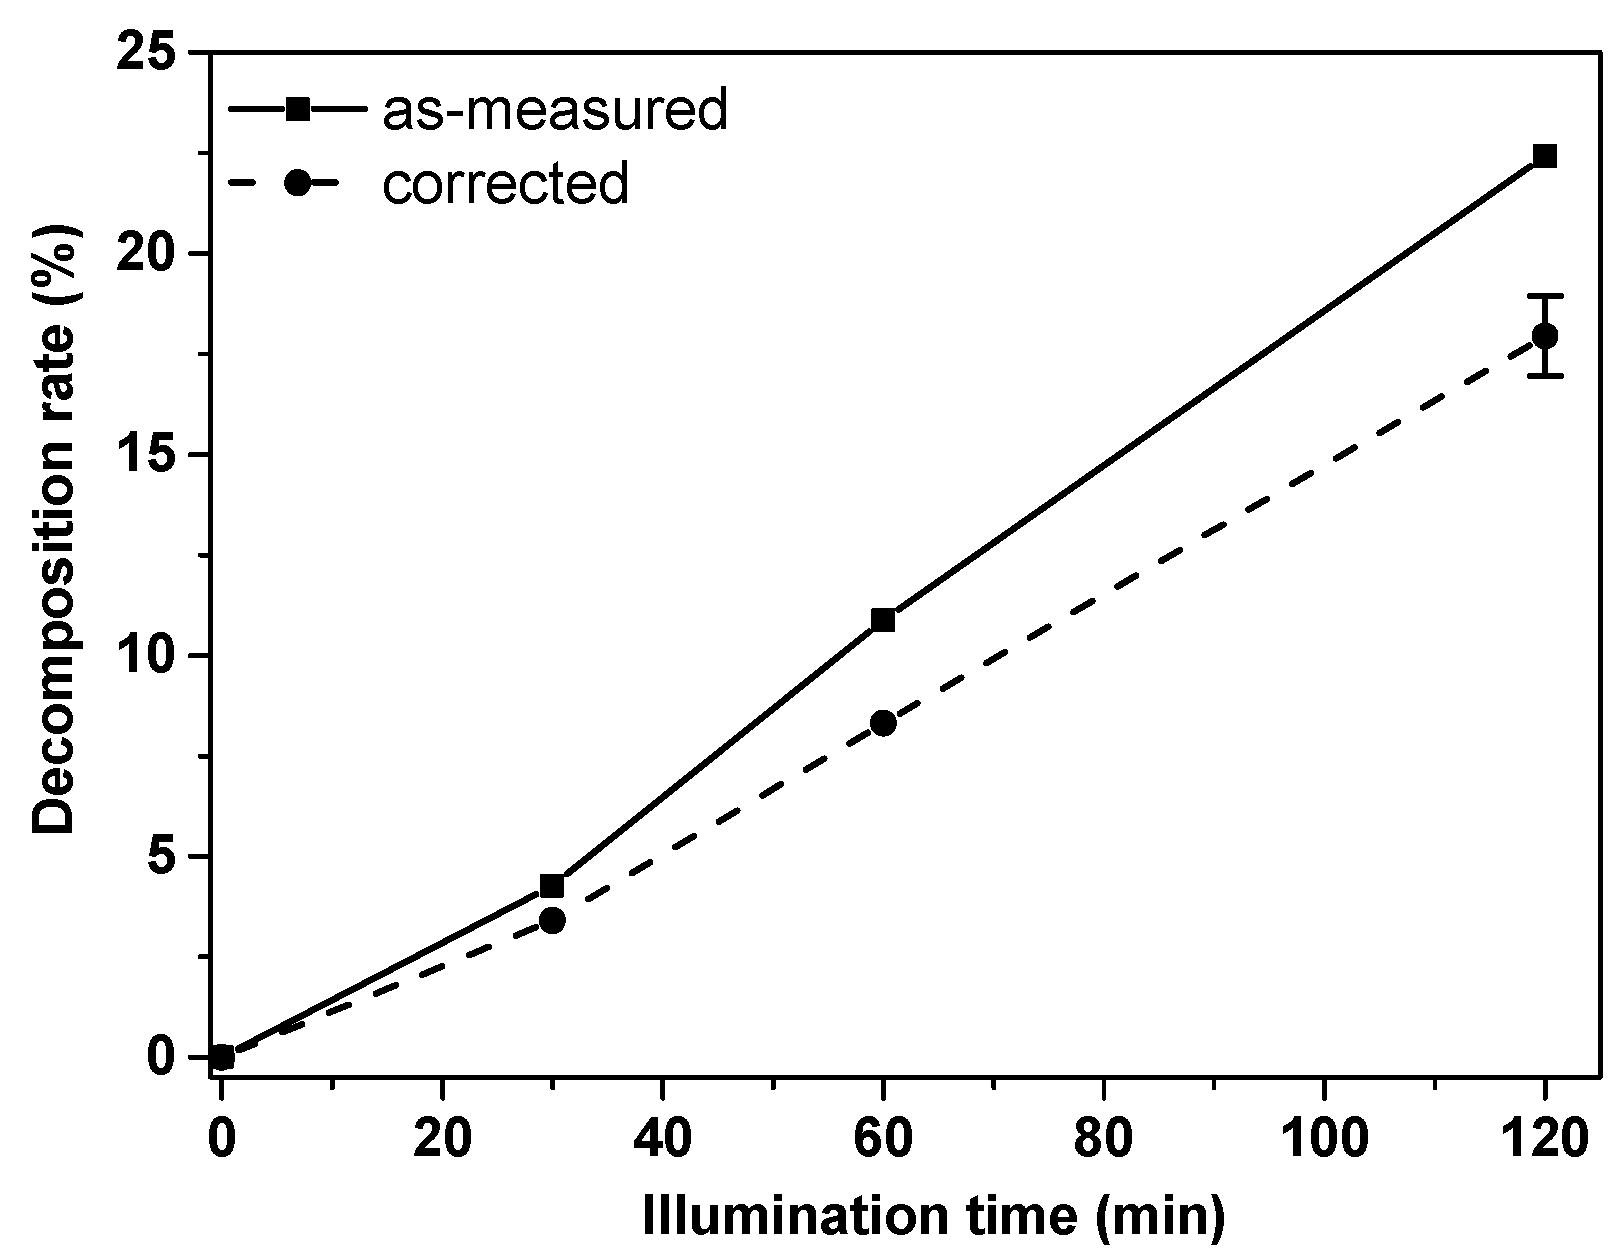
The decomposition rate (calculated in the similar way as X) as-measured and corrected by the absorption of the RhB dye by the geopolymer porous structure difference for the GP-P25 photocatalyst during the illumination is shown in Figure 7. After 120 min of illumination, the as-measured and corrected decomposition rate for the GP-P25 photocatalyst were 22.5 and 18%, respectively. The text below discusses only the corrected decomposition rate of the photocatalysts marked with the photocatalytic activity X, evaluated for pure TiO2 or the counterparts incorporated into the parent GP as in the case of GP-P25.
Figure 8A summarizes the photocatalytic activity X (%) during the illumination for as-supplied pure TiO2 photocatalysts (P25, CG100, CG300), the parent geopolymer matrix (GP) and a mechanical mixture of the parent geopolymer with the addition of 3 wt.% of TiO2 P25 (MM-GP-P25). The photocatalytic activity of the parent geopolymer matrix (Figure 8A) is much lower in comparison with the other materials, of only X ≈ 1.4 % after 120 min of illumination. This is in accordance with the literature as the photocatalytic mechanism in geopolymers is usually extrinsic [59]. On the other hand, the commercially used pure TiO2 P25 photocatalyst reached X = 98.6% within as early as 15min under the given illumination conditions (see Figure 8A). Furthermore, pure CG100 and CG300 photocatalysts reached the comparable photocatalytic activity (X) of 87.0 and 82.5%, respectively, but only after 120 min of illumination. The reasons for the different photocatalytic activity of the pure photocatalyst may be as follows: (i) even though CG100 and CG300 photocatalysts consist of only pure anatase, P25 also contains 13 wt.% of the rutile phase (see Figure 1 and the corresponding text); and (ii) there are significant differences in the average particle size and the specific surface area between individual photocatalysts (see Table A4). According to the literature data [9,10,11,60,61], all of these properties could have an effect on the photocatalytic activity of the photocatalyst. The different manufacturing method for the pure TiO2 P25 in comparison with CG100 and CG300 photocatalysts (see Table A1 and the results of LOI) could also influence their photocatalytic activity. Furthermore, the mechanical mixture (MM-GP-P25) of the parent geopolymer with the addition of 3 wt.% of TiO2 P25 also had an almost comparable X, of 77.0% after 120 min of illumination. This mechanical mixture (MM-GP-P25) was prepared for comparison as the pure TiO2 P25 powder exhibited the highest photocatalytic activity.
Figure 8B shows the time dependence of photocatalytic activity (X) for photocatalysts incorporated into the parent geopolymer matrix with a comparable content of TiO2 powder (≈3.2 wt.%, see Table 3), labelled as GP-P25, GP-CG100 and GP-CG300. For the possible schematic mechanism of RhB dye decomposition on TiO2 modified metakaolin-based geopolymer see, e.g., [59,62,63]. All materials were milled to a comparable particle size (d50) before testing (see Table A5). Furthermore, the photocatalysts with the higher (≈6.0 wt.%) and lower (≈1.5 wt.%) content of TiO2 incorporated powder were also tested (not shown in Tables and Figures). However, as it did not have a positive effect, with the respect to the TiO2 cost, on the photocatalytic activity (e.g., the X value is equal to 10.5, 18.0 and 20.0% for GP-P25 photocatalyst with ≈1.7, 3.3 and 6.0 wt.% of TiO2, respectively), the photocatalysts containing ≈3.2 wt.% of different TiO2sources were compared. The time dependence of X for GP-P25 and GP-CG100 photocatalysts is almost comparable (Figure 8B). After 120 min of illumination, the photocatalytic activity reaches 19.5 and 18.0% for the GP-CG100 and GP-P25 photocatalysts, respectively. Evidently, the difference in X between the pure, industrially produced TiO2 P25 and CG100 photocatalysts (Figure 8A) were eliminated. Furthermore, the X dropped to 11.0% for the GP-CG300 photocatalyst after 120 min of illumination (Figure 8B). The different photocatalytic activities of the photocatalysts incorporated into the parent geopolymer matrix may be explained as follows: Firstly, the lowest X for the GP-CG300 photocatalyst could be the consequence of the above-mentioned fact that (see Figure 5 and also Table 4) this was the only incorporated photocatalyst not to exhibit an increase in the anatase diffraction lines in comparison with the parent geopolymer matrix. In the GP-CG300 photocatalyst, titanium is thus present in a form other than anatase. To support this idea, we performed FTIR measurements. Figure 9 shows a comparison of FTIR spectra for pure CG300 and CG100 photocatalysts and those incorporated into the parent geopolymer matrix. We compared the results for all the samples in the spectral region of 1300–800 cm−1, where the pure TiO2 samples provided the absorption and the absorption of the parent geopolymer matrix in the incorporated photocatalysts was subtracted. The spectra of the pure CG100 photocatalyst and the incorporated photocatalyst GP-CG100 are practically identical. On the other hand, the spectra of the pure CG300 photocatalyst and the incorporated photocatalyst GP-CG300 are slightly different. It is possible to see the broadening for GP-CG300 in comparison with the spectra of the CG300 photocatalyst, which indicates the loss of ordering in the first case. This corroborates the results obtained by the XRD analysis (see Figure 5 and Table 4). Secondly, the different photocatalytic activities of the incorporated photocatalysts could also be caused by the fact that the average particle size (see Table A4) of the pure CG300 was the lowest of the pure TiO2 photocatalysts. As stated above, this pure TiO2 photocatalyst could thus be incorporated into the porous geopolymer structure much more easily than the other pure TiO2 photocatalysts, and thus the support covers the TiO2 particles, see, e.g., [16,17]. We assume that covered TiO2 particles are unavailable for the photocatalytic reaction. On the other hand, DLS demonstrated that the average particle size for the pure CG300 photocatalyst during the preparation of its incorporated counterpart is the highest among the pure photocatalysts (Figure 2), which makes available less-active sites for the reaction. The results of the DLS are inversely proportional to the activities of the photocatalysts; therefore, the higher the DLS-average particle size, the lower the photocatalytic activity. The photocatalytic activity of the incorporated photocatalyst GP-CG300 was negatively affected either by incorporation into the geopolymer structure or by self shielding. Furthermore, the photocatalytic activity of the incorporated photocatalysts could also be influenced by other material characteristics, such as the specific surface area (see Table A4) of the TiO2 additives.
The stability of incorporated photocatalysts, which is one of the most important aspects of heterogeneous photocatalysis in general, was tested in the three consecutive cycles for GP-CG100 material, under the above-mentioned illumination conditions. The catalyst was recovered by filtration between each cycle and at the same time the appropriate volume of fresh RhB dye solution was used. After 120 min of illumination in each cycle, the photocatalytic activity reached 19.5, 18.0 and 18.5% showing good stability, with respect to the experimental error in X determination, for the GP-CG100 photocatalyst. A detailed analysis of photocatalysts after each cycle will be explored in our future work.
In summary, the properties of raw TiO2 powder materials such as the average particle size, mineralogical composition, etc., are suitable for the incorporated photocatalysts GP-CG100 and GP-P25 and the parent geopolymer works well for them as a supporting material, which leads to the higher photocatalytic activity of these materials in comparison with the GP-CG300 material. Furthermore, our future work will be focused on the identification of the key properties and/or their relationship for the preparation of photoactive geopolymer-based photocatalyst with incorporated TiO2 powder and the photocatalytic activity of block samples, which would be more relevant to their possible practical usage.
For comparison, the kinetic data according to the work of Maiti et al. [54] were evaluated. The pseudo first-order rate constants (see Table 5) for each photocatalyst were estimated from the slopes of linear plots ln (A0/A) vs. time. With regard to pure photocatalysts, the highest rate constant (0.27 min−1) was observed for TiO2 P25. For CG100 and CG300 photocatalysts, the reaction was approximately 10 times slower, with rate constants of 0.033 min−1 and 0.029 min−1, respectively (Table 5). As mentioned above, this may relate to the properties of the photocatalysts (the mineralogical composition, the average particle size, etc.); the decrease in the rate constants of the CG100 and CG300 photocatalysts is in good agreement with their decrease in photocatalytic activity, (X) in comparison with the P25 photocatalyst. Furthermore, the rate constant for the mechanical mixture of the parent geopolymer with the addition of 3 wt.% of TiO2 P25 was 0.012 min−1, which is approximately 4.4% of the rate constant of the pure TiO2 P25 photocatalyst and thus, in good agreement with its content in the mixture. This may be the result of the shielding effect [64]. The rate constant for the parent geopolymer matrix has not been evaluated as this material exhibits very low photocatalytic activity (X ≈ 1.4%). The rate constants for the photocatalysts incorporated into the parent geopolymer matrix were significantly lower in comparison with their pure counterparts. We assume this to be caused by the covering of TiO2 particles by supporting materials during preparation (see Figure A1 in Appendix A) and such particles are then inactive in the photocatalytic reaction. The lowest rate constant (0.0010 min−1) was observed for the GP-CG300 material. For the GP-CG100 and GP-P25 photocatalysts, the rate constants were almost comparable—0.0017 and 0.0018 min−1, respectively (Table 5). Evidently, the photocatalytic activities X (see the text above) and the rate constants for GP-CG100 and GP-P25 photocatalysts are comparable, although these properties significantly differ for their pure counterparts. The key parameters identification of pure TiO2 powders that are suitable for the preparation of incorporated counterparts into the parent geopolymer matrix, with a high photocatalytic activity, will be the subject of our future work. Furthermore, the rate constants of incorporated photocatalysts are in good agreement with their photocatalytic activity.
4. Conclusions
In this work, the different types of industrial TiO2 powder were incorporated into the parent geopolymer matrix (GP-P25, GP-CG100 and GP-CG300). The successful incorporation of TiO2 into the parent geopolymer matrix was demonstrated by the SEM analysis, and the elemental analysis revealed its homogeneous distribution within a sample and its comparable content over different samples. The photo-catalytic activity of materials, corrected by the possible absorption and decomposition of the dye, caused by porous geopolymer structures and UV illumination, respectively, was evaluated based on the Rhodamine B dye decomposition. The GP-CG100 and GP-P25 photocatalysts exhibited a higher photocatalytic activity (≈19%) than the GP-CG300 material (11%). While the addition of CG100 and P25 TiO2 powder leads to an increase in the anatase content of GP-CG100 and GP-P25 materials, the anatase content in GP-CG300 is comparable with the parent GP (see powder XRD). Furthermore, since CG300 has a significantly smaller particle size and higher surface area than the others, the properties of the TiO2 powder used could affect its interaction with the geopolymer matrix during preparation, which could also influence the photocatalytic performance of the resultant materials. Additionally, the repeated cycles show the good stability of the GP-CG100 photocatalyst. This metakaolin-based geopolymer, with additional TiO2, represents an alternative environmentally friendly material with an enhanced purifying ability.
Author Contributions
Conceptualization, P.K. (Petr Knotek) and I.P.; formal analysis, K.M.; investigation, M.N., P.K. (Petr Kutálek), I.P., K.M., E.Č. and K.K.; writing—original draft preparation, M.N., T.H. and P.K. (Petr Kutálek); writing—review and editing, M.N., P.K. (Petr Kutálek) and E.Č.; supervision, P.K. (Petr Knotek). All authors have read and agreed to the published version of the manuscript.
Funding
The financial support from the Grant Agency of Czech Republic (GA CR), project No. 19-11814S is greatly appreciated. The financial support of the Ministry of Education, Youth and Sports of the Czech Republic via projects NANOBIO (Reg. No. CZ.02.1.01/0.0/0.0/17_048/0007421) is acknowledged by P. Knotek and K. Melánová. This work was carried out thanks to the support of the long-term project for the conceptual development of the research organization No. 67985891 and the grant of Specific University Research—grant No. A1_FCHT_2021_006.
Data Availability Statement
Not applicable.
Conflicts of Interest
The authors declare no conflict of interest.
Appendix A

Table A1.
The chemical composition of the clay material Mefisto L05 and BFS (the main oxides in wt.%).
Table A1.
The chemical composition of the clay material Mefisto L05 and BFS (the main oxides in wt.%).
| Material | SiO2 | Al2O3 | CaO | MgO | Fe2O3 | TiO2 | K2O | SO3 | LOI * |
|---|---|---|---|---|---|---|---|---|---|
| Mefisto L05 | 52.34 | 41.54 | 0.13 | 0.02 | 0.98 | 1.46 | 0.48 | 0.11 | 2.41 |
| BFS | 20.79 | 7.36 | 39.78 | 3.21 | 1.90 | 0.44 | 1.63 | 10.11 | 11.70 |
* LOI = loss on ignition
Table A2.
The particle size distribution of the clay material Mefisto L05 and the BFS.
| Particle Size (% of Total) | 2 [µm] | 5 [µm] | 8 [µm] | 10 [µm] | 15 [µm] | 25 [µm] | 45 [µm] | d10 [µm] | d50 [µm] | d90 [µm] |
|---|---|---|---|---|---|---|---|---|---|---|
| Mefisto L05 | 27.03 | 57.98 | 77.70 | 88.49 | 99.14 | 100.00 | 100.00 | 1.00 | 3.94 | 10.43 |
| BFS | 21.26 | 49.94 | 69.94 | 78.98 | 91.44 | 98.89 | 100.00 | 1.06 | 5.01 | 14.23 |
Table A3.
The chemical composition of the TiO2 additives CG100, TiO2 CG300 and TiO2 P25 (the main oxides in wt.%).
Table A3.
The chemical composition of the TiO2 additives CG100, TiO2 CG300 and TiO2 P25 (the main oxides in wt.%).
| Material | TiO2 | SiO2 | Al2O3 | Cl | P2O5 | Fe2O3 | Nb2O5 | SO3 | LOI |
|---|---|---|---|---|---|---|---|---|---|
| CG100 | 93.49 | 0.12 | 0.03 | 0.00 | 0.05 | 0.03 | 0.25 | 1.36 | 4.61 |
| CG300 | 91.19 | 0.06 | 0.05 | 0.00 | 0.15 | 0.02 | 0.14 | 1.22 | 7.10 |
| P25 | 97.62 | 0.00 | 0.00 | 0.12 | 0.00 | 0.01 | 0.00 | 0.00 | 2.21 |
Table A4.
The parameters of the TiO2 powder supplied by the producers.
| Material | Average Particle Size [nm] * | Specific Surface Area (BET) [m2/g] | Mineralogical Composition |
|---|---|---|---|
| CG100 | 20/18 | 70–110 | Anatase |
| CG300 | 10/6 | 250–350 | Anatase |
| P25 | 21/20 | 40–60 | Anatase/rutile |
* The average size of the particles provided by the producers/ crystallite sizes computed from the XRD data by the Scherrer equation.
Table A5.
The particle size distribution of the milled parent geopolymer and incorporated photocatalysts.
Table A5.
The particle size distribution of the milled parent geopolymer and incorporated photocatalysts.
| Particle Size (% of Total) | 5 [µm] | 45 [µm] | 90 [µm] | 180 [µm] | 400 [µm] | d10 [µm] | d50 [µm] | d90 [µm] |
|---|---|---|---|---|---|---|---|---|
| GP | 23.96 | 78.54 | 93.48 | 99.84 | 100.00 | 2.10 | 17.14 | 74.72 |
| GP-CG100 | 22.88 | 66.67 | 82.60 | 92.90 | 100.00 | 2.09 | 21.97 | 141.96 |
| GP-CG300 | 24.50 | 72.39 | 86.34 | 94.18 | 100.00 | 2.07 | 18.37 | 117.09 |
| GP-P25 | 29.23 | 75.02 | 86.11 | 92.89 | 100.00 | 1.72 | 14.06 | 129.41 |
Table A6.
The EDS analysis of titanium content at four different places on grind samples.
| Sample | Line | wt.% | wt.% | wt.% | wt.% | Average | SD |
|---|---|---|---|---|---|---|---|
| GP-CG100 | Ti Kα | 1.56 | 1.32 | 1.50 | 1.66 | 1.57 | 0.19 |
| GP-CG300 | Ti Kα | 1.66 | 1.68 | 1.62 | 1.32 | 1.57 | 0.17 |
| GP-P25 | Ti Kα | 1.80 | 1.56 | 1.58 | 1.63 | 1.64 | 0.11 |
Figure A1.
The schematic illustration of photocatalysts preparation.

Figure A2.
The representative EDS spectra (a) for the corresponding SEM image (cutand polished GP-P25 sample) (b).
Figure A2.
The representative EDS spectra (a) for the corresponding SEM image (cutand polished GP-P25 sample) (b).

Figure A3.
The change of RhB dye absorbance spectra during illumination by UV photons generated (A) at λ = 250, 310 and 360 nm (without any filter) and 50% of the total intensity, (B) at λ = 360 nm (using a filter transmitting in the range of 320–410 nm) and 100% of the total intensity, (C) at λ = 360 nm (using a filter transmitting in the range of 320–410 nm) and 50% of the total intensity, (D) and a combination of Figure 6A,B.

References
- Harper, C.; Snowden, M. Environment and Society: Human Perspectives on Environmental Issues, 6th ed.; Taylor & Francis: New York, NY, USA, 2017. [Google Scholar]
- Frank, S.N.; Bard, A.J. Heterogeneous Photocatalytic Oxidation of Cyanide and Sulfite in Aqueous-Solutions at Semiconductor Powders. J. Phys. Chem. 1977, 81, 1484–1488. [Google Scholar] [CrossRef]
- Fujishima, A.; Rao, T.N.; Tryk, D.A. Titanium dioxide photocatalysis. J. Photochem. Photobiol. C 2000, 1, 1–21. [Google Scholar] [CrossRef]
- Kennedy, D.R.; Ritchie, M.; Mackenzie, J. The Photosorption of Oxygen and Nitric Oxide on Titanium Dioxide. Trans. Faraday Soc. 1958, 54, 119–129. [Google Scholar] [CrossRef]
- Reiche, H.; Dunn, W.W.; Bard, A.J. Heterogeneous Photocatalytic and Photosynthetic Deposition of Copper on TiO2 and WO3 Powders. J. Phys. Chem. 1979, 83, 2248–2251. [Google Scholar] [CrossRef]
- Fujishima, A.; Zhang, X.T.; Tryk, D.A. TiO2 photocatalysis and related surface phenomena. Surf. Sci. Rep. 2008, 63, 515–582. [Google Scholar] [CrossRef]
- Singh, R.; Dutta, S. Synthesis and characterization of solar photoactive TiO2 nanoparticles with enhanced structural and optical properties. Adv. Powder Technol. 2018, 29, 211–219. [Google Scholar] [CrossRef]
- Luttrell, T.; Halpegamage, S.; Tao, J.G.; Kramer, A.; Sutter, E.; Batzill, M. Why is anatase a better photocatalyst than rutile?—Model studies on epitaxial TiO2 films. Sci. Rep. 2014, 4, 4043. [Google Scholar] [CrossRef] [PubMed] [Green Version]
- Gao, L.; Zhang, Q.H. Effects of amorphous contents and particle size on the photocatalytic properties of TiO2 nanoparticles. Scr. Mater. 2001, 44, 1195–1198. [Google Scholar] [CrossRef]
- Jang, H.D.; Kim, S.K.; Kim, S.J. Effect of particle size and phase composition of titanium dioxide nanoparticles on the photocatalytic properties. J. Nanopart. Res. 2001, 3, 141–147. [Google Scholar] [CrossRef]
- Li, D.Q.; Song, H.C.; Meng, X.; Shen, T.T.; Sun, J.; Han, W.J.; Wang, X.K. Effects of Particle Size on the Structure and Photocatalytic Performance by Alkali-Treated TiO2. Nanomaterials 2020, 10, 546. [Google Scholar] [CrossRef] [Green Version]
- Wang, R.; Hashimoto, K.; Fujishima, A.; Chikuni, M.; Kojima, E.; Kitamura, A.; Shimohigoshi, M.; Watanabe, T. Light-induced amphiphilic surfaces. Nature 1997, 388, 431–432. [Google Scholar] [CrossRef]
- Chunping, G.; Qiannan, W.; Jintao, L.; Wei, S. The effect of nano TiO2 on the durability of ultra-high-performance concrete with and without a flexural load. Ceramics 2018, 62, 374–381. [Google Scholar]
- Hashimoto, K.; Irie, H.; Fujishima, A. TiO2 photocatalysis: A historical overview and future prospects. Jpn. J. Appl. Phys. 2005, 44, 8269–8285. [Google Scholar] [CrossRef]
- Shilova, O.A.; Vlasov, D.Y.; Zelenskaya, M.S.M.S.; Ryabusheva, Y.V.; Khamova, T.V.; Glebova, I.B.I.B.; Sinelnikov, A.A.; Marugin, A.M.; Frank-Kamenetskaya, O.V. Sol-Gel Derived TiO2 and Epoxy-Titanate Protective Coatings: Structure, Property, Fungicidal Activity and Biomineralization Effects. In Processes and Phenomena on the Boundary between Biogenic and Abiogenic Nature; Frank-Kamenetskaya, O.V., Panova, E.G., Lessovaia, S.N., Eds.; Springer: Cham, Switzerland, 2020; pp. 619–638. [Google Scholar]
- Dong, H.R.; Zeng, G.M.; Tang, L.; Fan, C.Z.; Zhang, C.; He, X.X.; He, Y. An overview on limitations of TiO2-based particles for photocatalytic degradation of organic pollutants and the corresponding countermeasures. Water Res. 2015, 79, 128–146. [Google Scholar] [CrossRef]
- Pawar, M.; Sendogdular, S.T.; Gouma, P. A Brief Overview of TiO2 Photocatalyst for Organic Dye Remediation: Case Study of Reaction Mechanisms Involved in Ce-TiO2 Photocatalysts System. J. Nanomater. 2018, 2018, 5953609. [Google Scholar] [CrossRef] [Green Version]
- Miklecic, J.; Blagojevic, S.L.; Petric, M.; Jirous-Rajkovic, V. Influence of TiO2 and ZnO nanoparticles on properties of waterborne polyacrylate coating exposed to outdoor conditions. Prog. Org. Coat. 2015, 89, 67–74. [Google Scholar] [CrossRef]
- Ren, Y.A.; Chen, M.; Zhang, Y.; Wu, L.M. Fabrication of Rattle-Type TiO2/SiO2 Core/Shell Particles with Both High Photoactivity and UV-Shielding Property. Langmuir 2010, 26, 11391–11396. [Google Scholar] [CrossRef] [PubMed]
- Shandilya, N.; Le Bihan, O.; Bressot, C.; Morgeneyer, M. Emission of Titanium Dioxide Nanoparticles from Building Materials to the Environment by Wear and Weather. Environ. Sci. Technol. 2015, 49, 2163–2170. [Google Scholar] [CrossRef]
- Banerjee, S.; Dionysiou, D.D.; Pillai, S.C. Self-cleaning applications of TiO2 by photo-induced hydrophilicity and photocatalysis. Appl. Catal. B-Environ. 2015, 176, 396–428. [Google Scholar] [CrossRef] [Green Version]
- Zailan, S.N.; Mahmed, M.; Abdullah, M.; Sandu, A. Self-cleaning geopolymer concrete—A review. IOP Conf. Ser. Mater. Sci. Eng. 2016, 133, 012026. [Google Scholar] [CrossRef]
- Dundar, I.; Krichevskaya, M.; Katerski, A.; Acik, I.O. TiO2 thin films by ultrasonic spray pyrolysis as photocatalytic material for air purification. Roy Soc. Open Sci. 2019, 6, 181578. [Google Scholar]
- Malnieks, K.; Mezinskis, G.; Pavlovska, I. Effect of different dip-coating techniques on TiO2 thin film properties. Key Eng. Mater. 2017, 721, 128–132. [Google Scholar] [CrossRef]
- Masiala, T.M.; Bantu, A.K.M.; Bakambo, G.E.; Lunguya, J.M.; Kanza, J.L.K.; Muamba, O.M. Influence of pH Preparation on the Photo-Response of Electrodeposited Titanium Dioxide (TiO2) Thin Films. Int. J. Mater. Sci. Appl. 2019, 5, 207–213. [Google Scholar]
- Pala, L.P.R.; Uday, V.; Gogoi, D.; Peela, N.R. Surface and photocatalytic properties of TiO2 thin films prepared by non-aqueous surfactant assisted sol-gel method. J. Environ. Chem. Eng. 2020, 8, 104267. [Google Scholar] [CrossRef]
- Duxson, P.; Provis, J.L.; Lukey, G.C.; van Deventer, J.S.J. The role of inorganic polymer technology in the development of ‘green concrete’. Cem. Concr. Res. 2007, 37, 1590–1597. [Google Scholar] [CrossRef]
- Wu, Y.G.; Lu, B.W.; Bai, T.; Wang, H.; Du, F.P.; Zhang, Y.F.; Cai, L.; Jiang, C.; Wang, W.J. Geopolymer, green alkali activated cementitious material: Synthesis, applications and challenges. Constr. Build. Mater. 2019, 224, 930–949. [Google Scholar] [CrossRef]
- McLellan, B.C.; Williams, R.P.; Lay, J.; van Riessen, A.; Corder, G.D. Costs and carbon emissions for geopolymer pastes in comparison to ordinary portland cement. J. Clean. Prod. 2011, 19, 1080–1090. [Google Scholar] [CrossRef] [Green Version]
- Davidovits, J. Geopolymer Chemistry and Applications, 5th ed.; Institut Géopolymère: Saint-Quentin, France, 2020. [Google Scholar]
- Provis, J.L. Alkali-activated materials. Cem. Concr. Res. 2018, 114, 40–48. [Google Scholar] [CrossRef]
- Jin, M.T.; Zheng, Z.D.; Sun, Y.; Chen, L.W.; Jin, Z.F. Resistance of metakaolin-MSWI fly ash based geopolymer to acid and alkaline environments. J. Non-Cryst. Solids 2016, 450, 116–122. [Google Scholar] [CrossRef]
- Karthik, A.; Sudalaimani, K.; Vijayakumar, C.T. Durability study on coal fly ash-blast furnace slag geopolymer concretes with bio-additives. Ceram. Int. 2017, 43, 11935–11943. [Google Scholar] [CrossRef]
- Lahoti, M.K.; Tan, K.H.; Yang, E.H. A critical review of geopolymer properties for structural fire-resistance applications. Constr. Build. Mater. 2019, 221, 514–526. [Google Scholar] [CrossRef]
- Neupane, K.; Chalmers, D.; Kidd, P. High-Strength Geopolymer Concrete—Properties. Advant. Chall. Adv. Mater. 2018, 7, 15–25. [Google Scholar]
- Rasaki, S.A.; Zhang, B.X.; Guarecuco, R.; Thomas, T.; Yang, M.H. Geopolymer for use in heavy metals adsorption, and advanced oxidative processes: A critical review. J. Clean. Prod. 2019, 213, 42–58. [Google Scholar] [CrossRef]
- Novotná, M.; Perná, I.; Hanzlíček, T. Review of Possible Fillers and Additives for Geopolymer Materials. Wasteforum 2020, 8, 78–89. [Google Scholar]
- Duan, P.; Yan, C.J.; Luo, W.J.; Zhou, W. Effects of adding nano-TiO2 on compressive strength, drying shrinkage, carbonation and microstructure of fluidized bed fly ash based geopolymer paste. Constr. Build. Mater. 2016, 106, 115–125. [Google Scholar] [CrossRef]
- Adams, L.K.; Lyon, D.Y.; Alvarez, P.J.J. Comparative eco-toxicity of nanoscale TiO2, SiO2, and ZnO water suspensions. Water Res. 2006, 40, 3527–3532. [Google Scholar] [CrossRef]
- Baranowska-Wojcik, E.; Szwajgier, D.; Oleszczuk, P.; Winiarska-Mieczan, A. Effects of Titanium Dioxide Nanoparticles Exposure on Human Health—A Review. Biol. Trace Elem. Res. 2020, 193, 118–129. [Google Scholar] [CrossRef] [Green Version]
- Czajka, M.; Sawicki, K.; Sikorska, K.; Popek, S.; Kruszewski, M.; Kapka-Skrzypczak, L. Toxicity of titanium dioxide nanoparticles in central nervous system. Toxicol. Vitr. 2015, 29, 1042–1052. [Google Scholar] [CrossRef] [PubMed]
- Pelclova, D.; Navratil, T.; Kacerova, T.; Zamostna, B.; Fenclova, Z.; Vlckova, S.; Kacer, P. NanoTiO2 Sunscreen Does Not Prevent Systemic Oxidative Stress Caused by UV Radiation and a Minor Amount of NanoTiO2 is Absorbed in Humans. Nanomaterials 2019, 9, 888. [Google Scholar] [CrossRef] [Green Version]
- Wattanasiriwech, D.; Yomthong, K.; Wattanasiriwech, S. Adsorption efficiency and photocatalytic activity of fly ash-based geopolymer foam mortar. Ceram. Int. 2021, 47, 27361–27371. [Google Scholar] [CrossRef]
- Kaya-Ozkiper, K.; Uzun, A.; Soyer-Uzun, S. Red mud- and metakaolin-based geopolymers for adsorption and photocatalytic degradation of methylene blue: Towards self-cleaning construction materials. J. Clean. Prod. 2021, 288, 125120. [Google Scholar] [CrossRef]
- Longhi, M.A.; Zhang, Z.H.; Rodriguez, E.D.; Kirchheim, A.P.; Wang, H. Efflorescence of Alkali-Activated Cements (Geopolymers) and the Impacts on Material Structures: A Critical Analysis. Front. Mater. 2019, 6, 89. [Google Scholar] [CrossRef]
- Perná, I.; Hanzlíček, T.; Ertl, Z. Utilization of biomass ashes for construction purposes. In Proceedings of the Third Euro Mediterranean Symposium in Advances on Geomaterials and Structures, Tunis, Tunisia, 1 January 2010; Darve, F., Doghri, I., El Fatmi, R., Hassis, H., Zenzri, H., Eds.; LGC-ENIT: Tunis, Tunisia, 2010; pp. 661–666. [Google Scholar]
- Perna, I.; Hanzlicek, T. The setting time of a clay-slag geopolymer matrix: The influence of blast-furnace-slag addition and the mixing method. J Clean. Prod. 2016, 112, 1150–1155. [Google Scholar] [CrossRef]
- Hanzlicek, T.; Perna, I.; Ulicna, K.; Rimal, V.; Stepankova, H. The Evaluation of Clay Suitability for Geopolymer Technology. Minerals 2020, 10, 852. [Google Scholar] [CrossRef]
- Srb, M.; Milasheuskaya, Y.; Jambor, R.; Kopecká, K.; Knotek, P. Low-Temperature Sn0 Nanoparticles Synthesis by Means of Tin (II) N,N-Complexes Reduction. ChemistrySelect 2021, 6, 3926–3931. [Google Scholar] [CrossRef]
- EVA, Diffracplus Basic Evaluating Package, version 19; Bruker AXS GmbH: Karlsruhe, Germany, 2013.
- DIFRAC. EVA, version 2.1; Bruker AXS GmbH: Karlsruhe, Germany, 2011. [Google Scholar]
- Joint Committee on Powder Diffraction Standards. International Centre of Diffraction Data; ICDD: Swarthmore, PA, USA, 2021. [Google Scholar]
- Knotek, P.; Kutalek, P.; Cernoskova, E.; Tichy, L.; Janicek, P. The wettability of variously treated AA42Se58 thin films. Mater. Chem. Phys. 2019, 221, 216–223. [Google Scholar] [CrossRef]
- Maiti, M.; Sarkar, M.; Maiti, S.; Malik, M.A.; Xu, S.L. Modification of geopolymer with size controlled TiO2 nanoparticle for enhanced durability and catalytic dye degradation under UV light. J. Clean. Prod. 2020, 255, 120183. [Google Scholar] [CrossRef]
- Jiang, X.Z.; Manawan, M.; Feng, T.; Qian, R.F.; Zhao, T.; Zhou, G.D.; Kong, F.T.; Wang, Q.; Dai, S.Y.; Pan, J.H. Anatase and rutile in evonik aeroxide P25: Heterojunctioned or individual nanoparticles? Catal. Today 2018, 300, 12–17. [Google Scholar] [CrossRef]
- PRECHEZA a.s. Available online: https://www.precheza.cz/en/history (accessed on 3 July 2021).
- Tsai, W.-B.; Kao, J.-Y.; Wu, T.-M.; Cheng, W.-T. Dispersion of Titanium Oxide Nanoparticles in Aqueous Solution with Anionic Stabilizer via Ultrasonic Wave. J. Nanopart. 2016, 2016, 6539581. [Google Scholar] [CrossRef]
- Sentein, C.; Guizard, B.; Giraud, S.; Yé, C.; Ténégal, F. Dispersion and stability of TiO2 nanoparticles synthesized by laser pyrolysis in aqueous suspensions. J. Phys. Conf. Ser. 2009, 170, 012013. [Google Scholar] [CrossRef] [Green Version]
- Falah, M.; MacKenzie, K.J.D. Photocatalytic Nanocomposite Materials Based on Inorganic Polymers (Geopolymers): A Review. Catalysts 2020, 10, 1158. [Google Scholar] [CrossRef]
- Chan, C.K.; Porter, J.F.; Li, Y.G.; Guo, W.; Chan, C.M. Effects of calcination on the microstructures and photocatalytic properties of nanosized titanium dioxide powders prepared by vapor hydrolysis. J. Am. Ceram. Soc. 1999, 82, 566–572. [Google Scholar] [CrossRef]
- Porter, J.F.; Li, Y.G.; Chan, C.K. The effect of calcination on the microstructural characteristics and photoreactivity of Degussa P-25 TiO2. J. Mater. Sci. 1999, 34, 1523–1531. [Google Scholar] [CrossRef]
- Sanalkumar, K.U.A.; Yang, E.H. Self-cleaning performance of nano-TiO2 modified metakaolin-based geopolymers. Cem. Concr. Comp. 2021, 115, 103847. [Google Scholar] [CrossRef]
- Chen, F.; Zhao, J.C.; Hidaka, H. Highly selective deethylation of rhodamine B: Adsorption and photooxidation pathways of the dye on the TiO2/SiO2 composite photocatalyst. Int. J. Photoenergy 2003, 5, 209. [Google Scholar] [CrossRef] [Green Version]
- Zhu, S.S.; Wang, D.W. Photocatalysis: Basic Principles, Diverse Forms of Implementations and Emerging Scientific Opportunities. Adv. Energy Mater. 2017, 7, 1700841. [Google Scholar] [CrossRef] [Green Version]
Figure 1.
Powder X-ray diffraction patterns of the starting TiO2.

Figure 2.
The distribution of the hydrodynamic diameter of the three types of industrial TiO2 powder during dispersion in water.
Figure 2.
The distribution of the hydrodynamic diameter of the three types of industrial TiO2 powder during dispersion in water.

Figure 3.
The box plot of the Ti/(Al+Si) ratio for the milled photocatalysts incorporated into the geopolymer matrix obtained by EDS analysis formed from the minimum and maximum values (whiskers), the standard deviation (SD) values (box) and the arithmetic mean (open squares in the box).
Figure 3.
The box plot of the Ti/(Al+Si) ratio for the milled photocatalysts incorporated into the geopolymer matrix obtained by EDS analysis formed from the minimum and maximum values (whiskers), the standard deviation (SD) values (box) and the arithmetic mean (open squares in the box).

Figure 4.
The representative SEM image for the GP-P25 sample.

Figure 5.
Powder X-ray diffraction patterns of the milled parent geopolymer (GP) and the GP with different types of TiO2 powder incorporated.
Figure 5.
Powder X-ray diffraction patterns of the milled parent geopolymer (GP) and the GP with different types of TiO2 powder incorporated.

Figure 6.
The change of RhB dye absorbance spectra during (A) the illumination by UV photons generated at λ = 360 nm (using a filter transmitting in the range of 320–410 nm) and 50% of total light source intensity or (B) without the illumination in the presence of the GP-P25 photocatalyst.
Figure 6.
The change of RhB dye absorbance spectra during (A) the illumination by UV photons generated at λ = 360 nm (using a filter transmitting in the range of 320–410 nm) and 50% of total light source intensity or (B) without the illumination in the presence of the GP-P25 photocatalyst.

Figure 7.
The time dependence of the as-measured/corrected decomposition rate for the GP-P25 photocatalyst. The lines are included as a mere eye guide.
Figure 7.
The time dependence of the as-measured/corrected decomposition rate for the GP-P25 photocatalyst. The lines are included as a mere eye guide.

Figure 8.
The time dependence of corrected photocatalytic activity (X) for (A) the parent geopolymer matrix (GP), the mechanical mixture (MM-GP-P25)) and the pure TiO2 photocatalysts (P25, CG100 and CG300) and (B) those incorporated into the geopolymer matrix. The lines are included as a mere eye guide.

Figure 9.
The FTIR spectra of pure CG100 and CG300 photocatalysts and those incorporated into the parent geopolymer matrix.
Figure 9.
The FTIR spectra of pure CG100 and CG300 photocatalysts and those incorporated into the parent geopolymer matrix.

Table 1.
A summary of the weights of the individual components used for the preparation of the studied materials.
Table 1.
A summary of the weights of the individual components used for the preparation of the studied materials.
| Mix Designation | Content [g] | ||||||
|---|---|---|---|---|---|---|---|
| Mefisto L05 | BFS | Alkaline Solution | Water | TiO2 CG100 | TiO2 CG300 | TiO2 P25 | |
| GP | 100 | 33 | 120 | 20 | - | - | - |
| GP-CG100 | 100 | 33 | 120 | 20 | 5 | - | - |
| GP-CG300 | 100 | 33 | 120 | 20 | - | 5 | - |
| GP-P25 | 100 | 33 | 120 | 20 | - | - | 5 |
Table 2.
The EDS control analysis of titanium content (the surface area of 0.1 mm2) on grind samples (the average of the four measurements).
Table 2.
The EDS control analysis of titanium content (the surface area of 0.1 mm2) on grind samples (the average of the four measurements).
| Sample Name | GP | GP-CG100 | GP-CG300 | GP-P25 |
|---|---|---|---|---|
| Ti (wt.%) | 0.61 ± 0.06 | 1.57 ± 0.19 | 1.57 ± 0.17 | 1.64 ± 0.11 |
Table 3.
The chemical composition of GP-CG100, GP-CG300 and GP-P25 (the main oxides in wt.%).
| Material | SiO2 | Al2O3 | CaO | MgO | Fe2O3 | TiO2 | K2O | SO3 | LOI |
|---|---|---|---|---|---|---|---|---|---|
| GP | 40.75 | 18.56 | 6.48 | 0.34 | 1.42 | 0.94 | 13.98 | 1.35 | 15.53 |
| GP-CG100 | 39.57 | 17.90 | 6.31 | 0.31 | 1.40 | 3.42 | 13.91 | 1.34 | 15.19 |
| GP-CG300 | 39.60 | 18.12 | 6.50 | 0.36 | 1.42 | 2.93 | 13.87 | 1.33 | 15.20 |
| GP-P25 | 38.62 | 17.81 | 6.04 | 0.35 | 1.35 | 3.31 | 13.32 | 1.33 | 17.30 |
Table 4.
The peak areas and the peak-area ratios in powder X-ray diffraction patterns for the parent geopolymer matrix and the incorporated photocatalysts.
Table 4.
The peak areas and the peak-area ratios in powder X-ray diffraction patterns for the parent geopolymer matrix and the incorporated photocatalysts.
| Sample | Peak Area | Area Ratio | Amorphous Phase Proportion, wt.% | |||
|---|---|---|---|---|---|---|
| (101) Anatase | (101) Quartz | (104) Calcite | Anatase/ Quartz | Anatase/ Calcite | ||
| GP | 2.2 | 1.7 | 3.3 | 1.3 | 0.7 | 66–69 |
| GP-P25 | 10.3 | 2.4 | 3.8 | 4.3 | 2.7 | 63–65 |
| GP-CG100 | 10.5 | 2.2 | 3.1 | 4.8 | 3.4 | 62–64 |
| GP-CG300 | 2.6 | 2.1 | 3.1 | 1.2 | 0.8 | 67–69 |
Table 5.
The pseudo-first-order rate constants for the photodecomposition of the RhB dye.
| Sample | k (min−1) | R2 |
|---|---|---|
| P25 | 0.27 | 0.981 |
| GC100 | 0.033 | 0.998 |
| GC300 | 0.029 | 0.999 |
| MM-GP-P25 (parent GP + 3 wt.% of P25) | 0.0012 | 0.990 |
| GP-P25 | 0.0018 | 0.997 |
| GP-CG100 | 0.0017 | 0.996 |
| GP-CG300 | 0.0010 | 0.984 |
Publisher’s Note: MDPI stays neutral with regard to jurisdictional claims in published maps and institutional affiliations. |
© 2021 by the authors. Licensee MDPI, Basel, Switzerland. This article is an open access article distributed under the terms and conditions of the Creative Commons Attribution (CC BY) license (https://creativecommons.org/licenses/by/4.0/).
Share and Cite
MDPI and ACS Style
Novotná, M.; Knotek, P.; Hanzlíček, T.; Kutálek, P.; Perná, I.; Melánová, K.; Černošková, E.; Kopecká, K. TiO2 Modified Geopolymers for the Photocatalytic Dye Decomposition. Crystals 2021, 11, 1511. https://doi.org/10.3390/cryst11121511
AMA Style
Novotná M, Knotek P, Hanzlíček T, Kutálek P, Perná I, Melánová K, Černošková E, Kopecká K. TiO2 Modified Geopolymers for the Photocatalytic Dye Decomposition. Crystals. 2021; 11(12):1511. https://doi.org/10.3390/cryst11121511
Chicago/Turabian StyleNovotná, Martina, Petr Knotek, Tomáš Hanzlíček, Petr Kutálek, Ivana Perná, Klára Melánová, Eva Černošková, and Kateřina Kopecká. 2021. "TiO2 Modified Geopolymers for the Photocatalytic Dye Decomposition" Crystals 11, no. 12: 1511. https://doi.org/10.3390/cryst11121511
Note that from the first issue of 2016, this journal uses article numbers instead of page numbers. See further details here.