Co-Mn-Al Mixed Oxides Promoted by K for Direct NO Decomposition: Effect of Preparation Parameters

 ,
,  , ,
, , 
Abstract
:1. Introduction
2. Results
2.1. Characterization of Catalysts
2.1.1. Chemical Composition
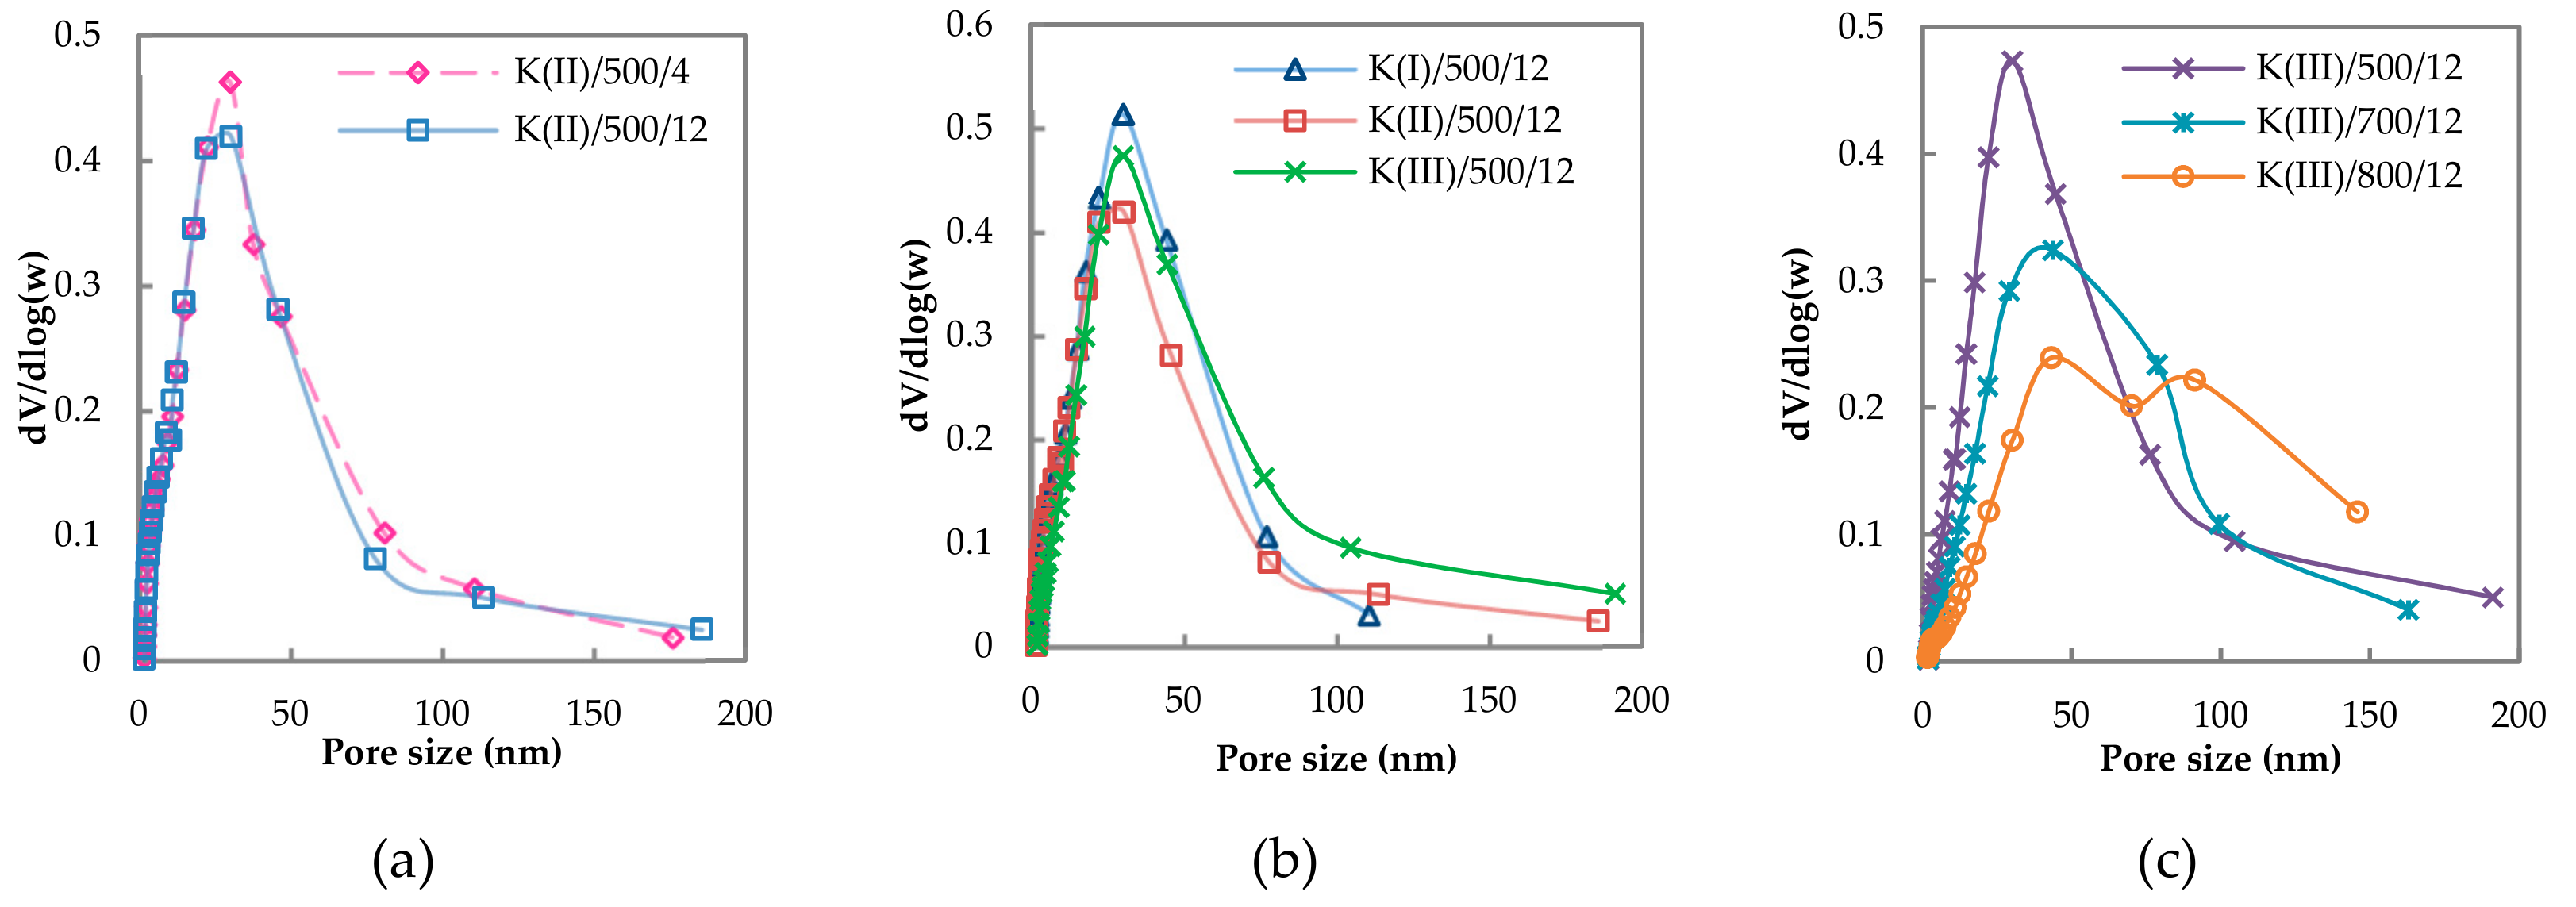
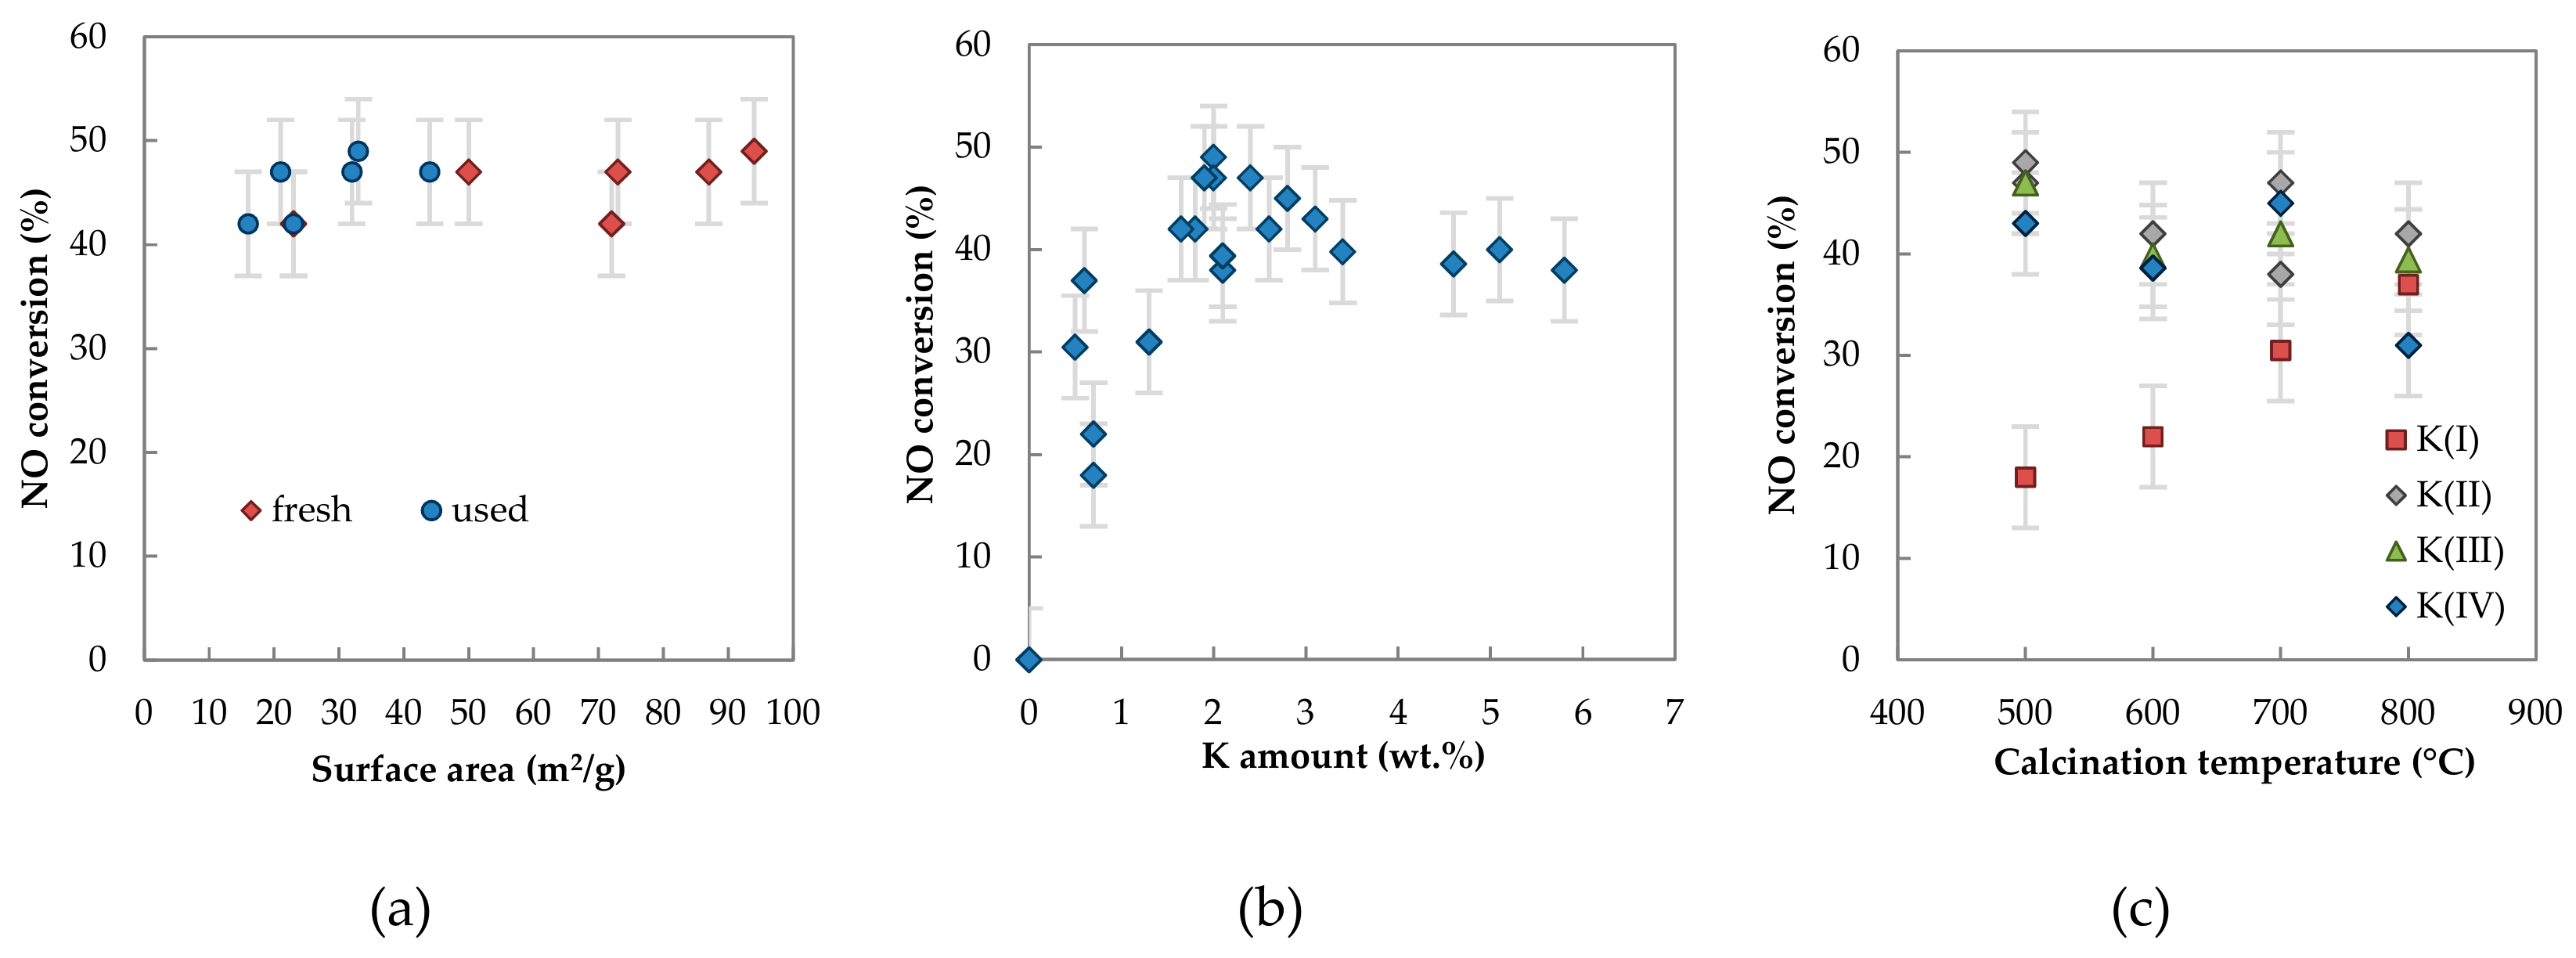
2.1.2. Textural Properties
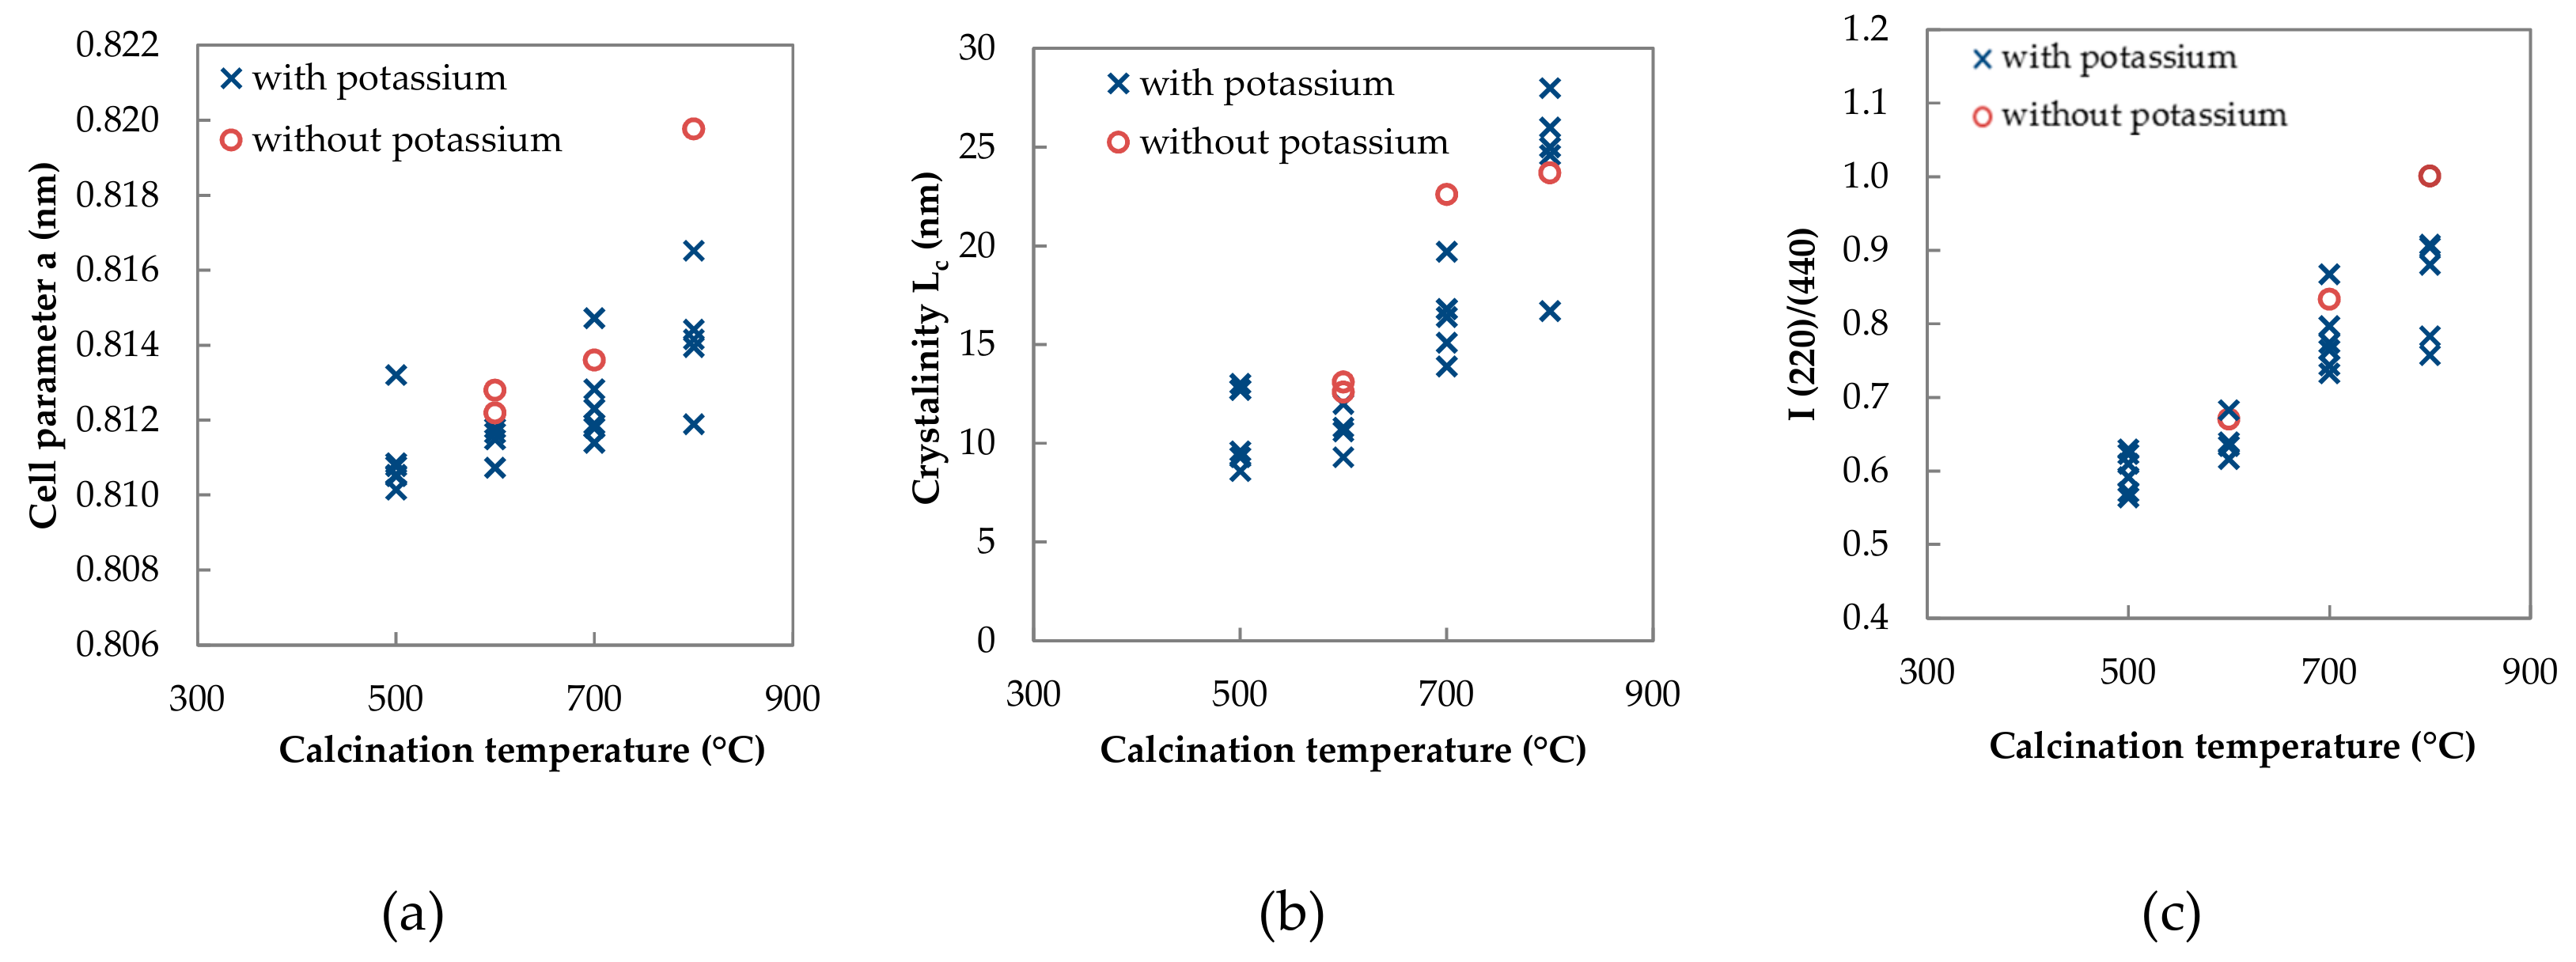
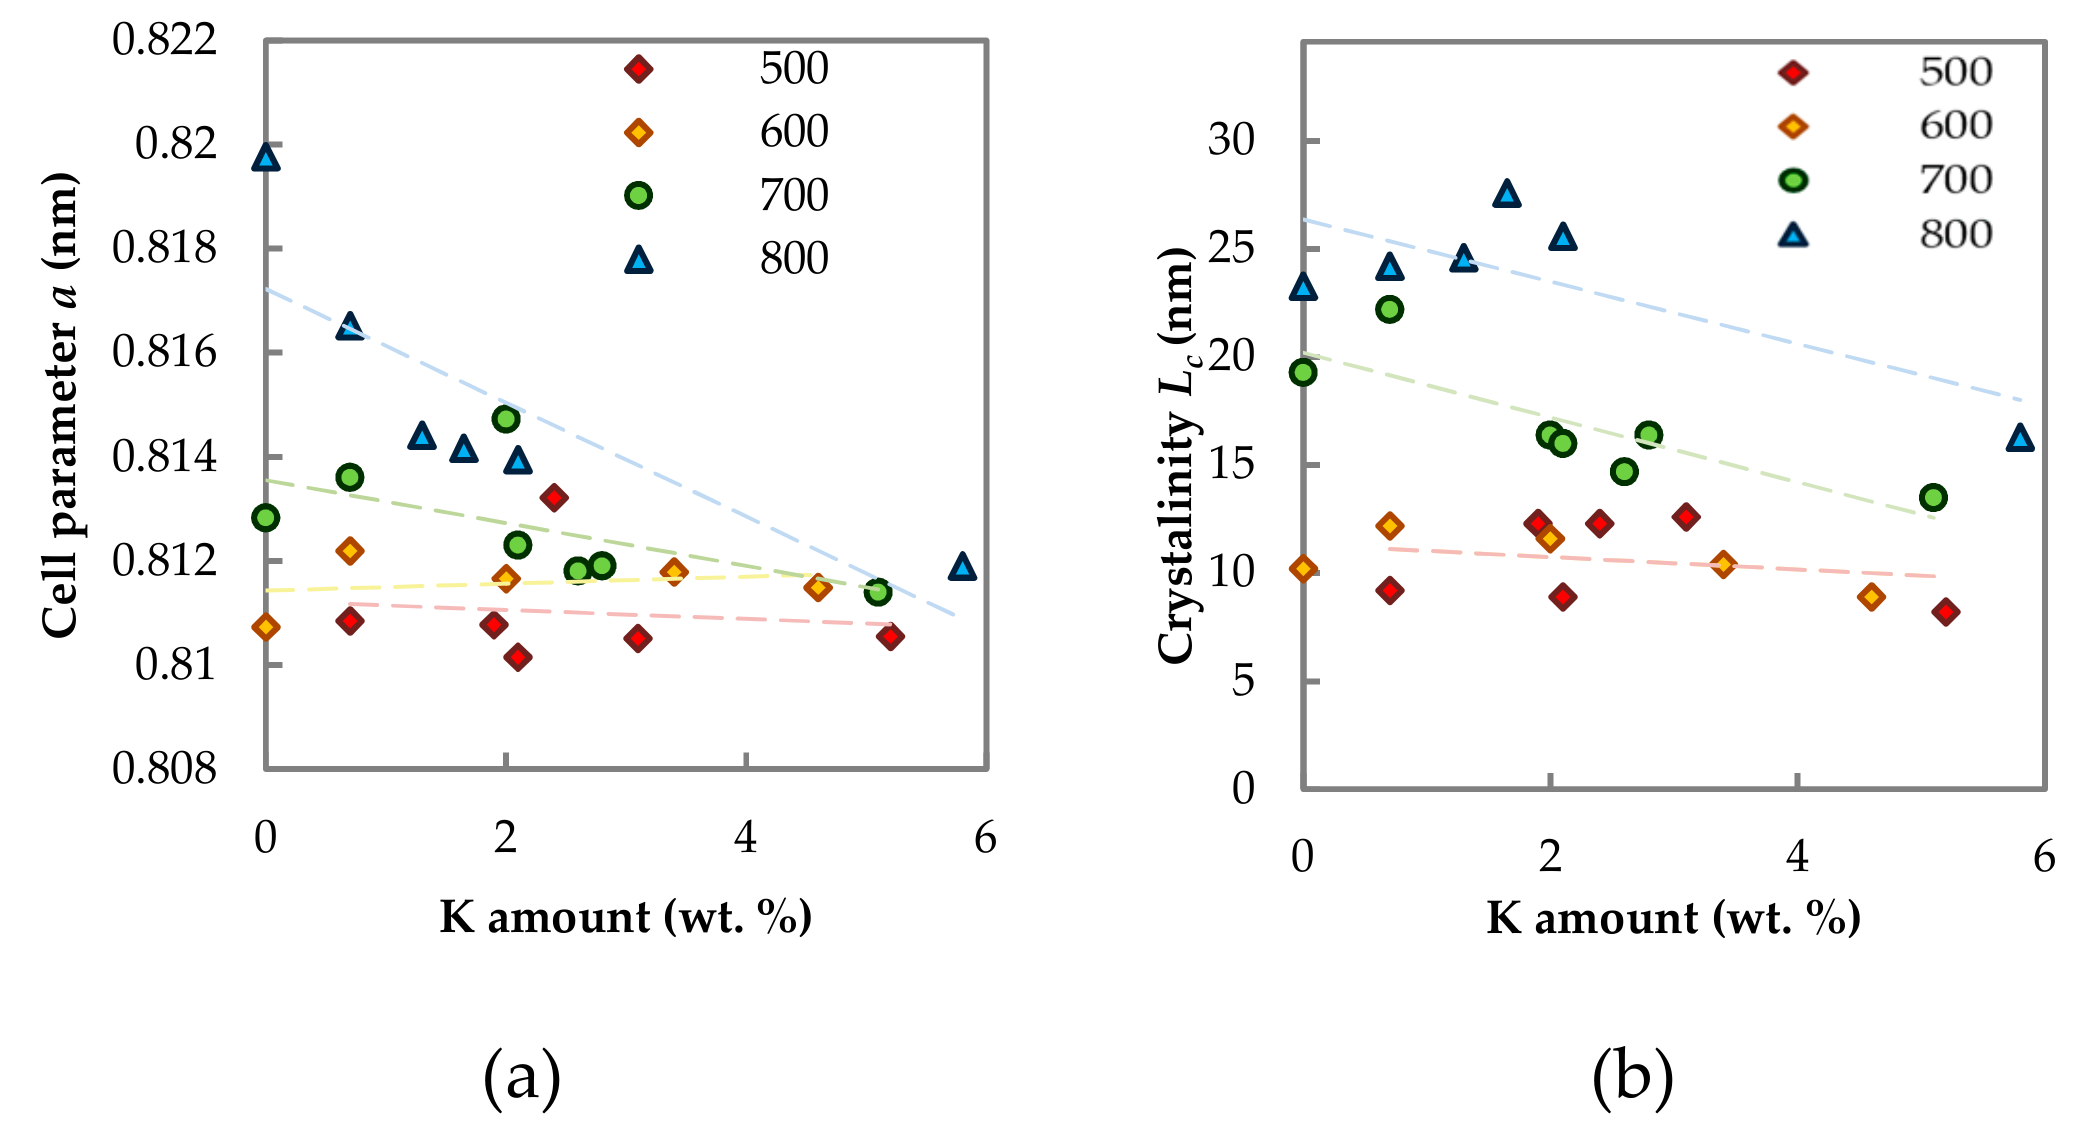
2.1.3. Phase Composition
2.1.4. Surface Composition
- (i)
- Sample without K,
- (ii)
- Fresh sample modified by potassium calcined at 500 °C,
- (iii)
- Used sample modified by potassium, which means that its structure corresponds to the sample calcined at 700 °C and can be changed somehow by catalytic reaction intermediates.
2.1.5. Reducibility
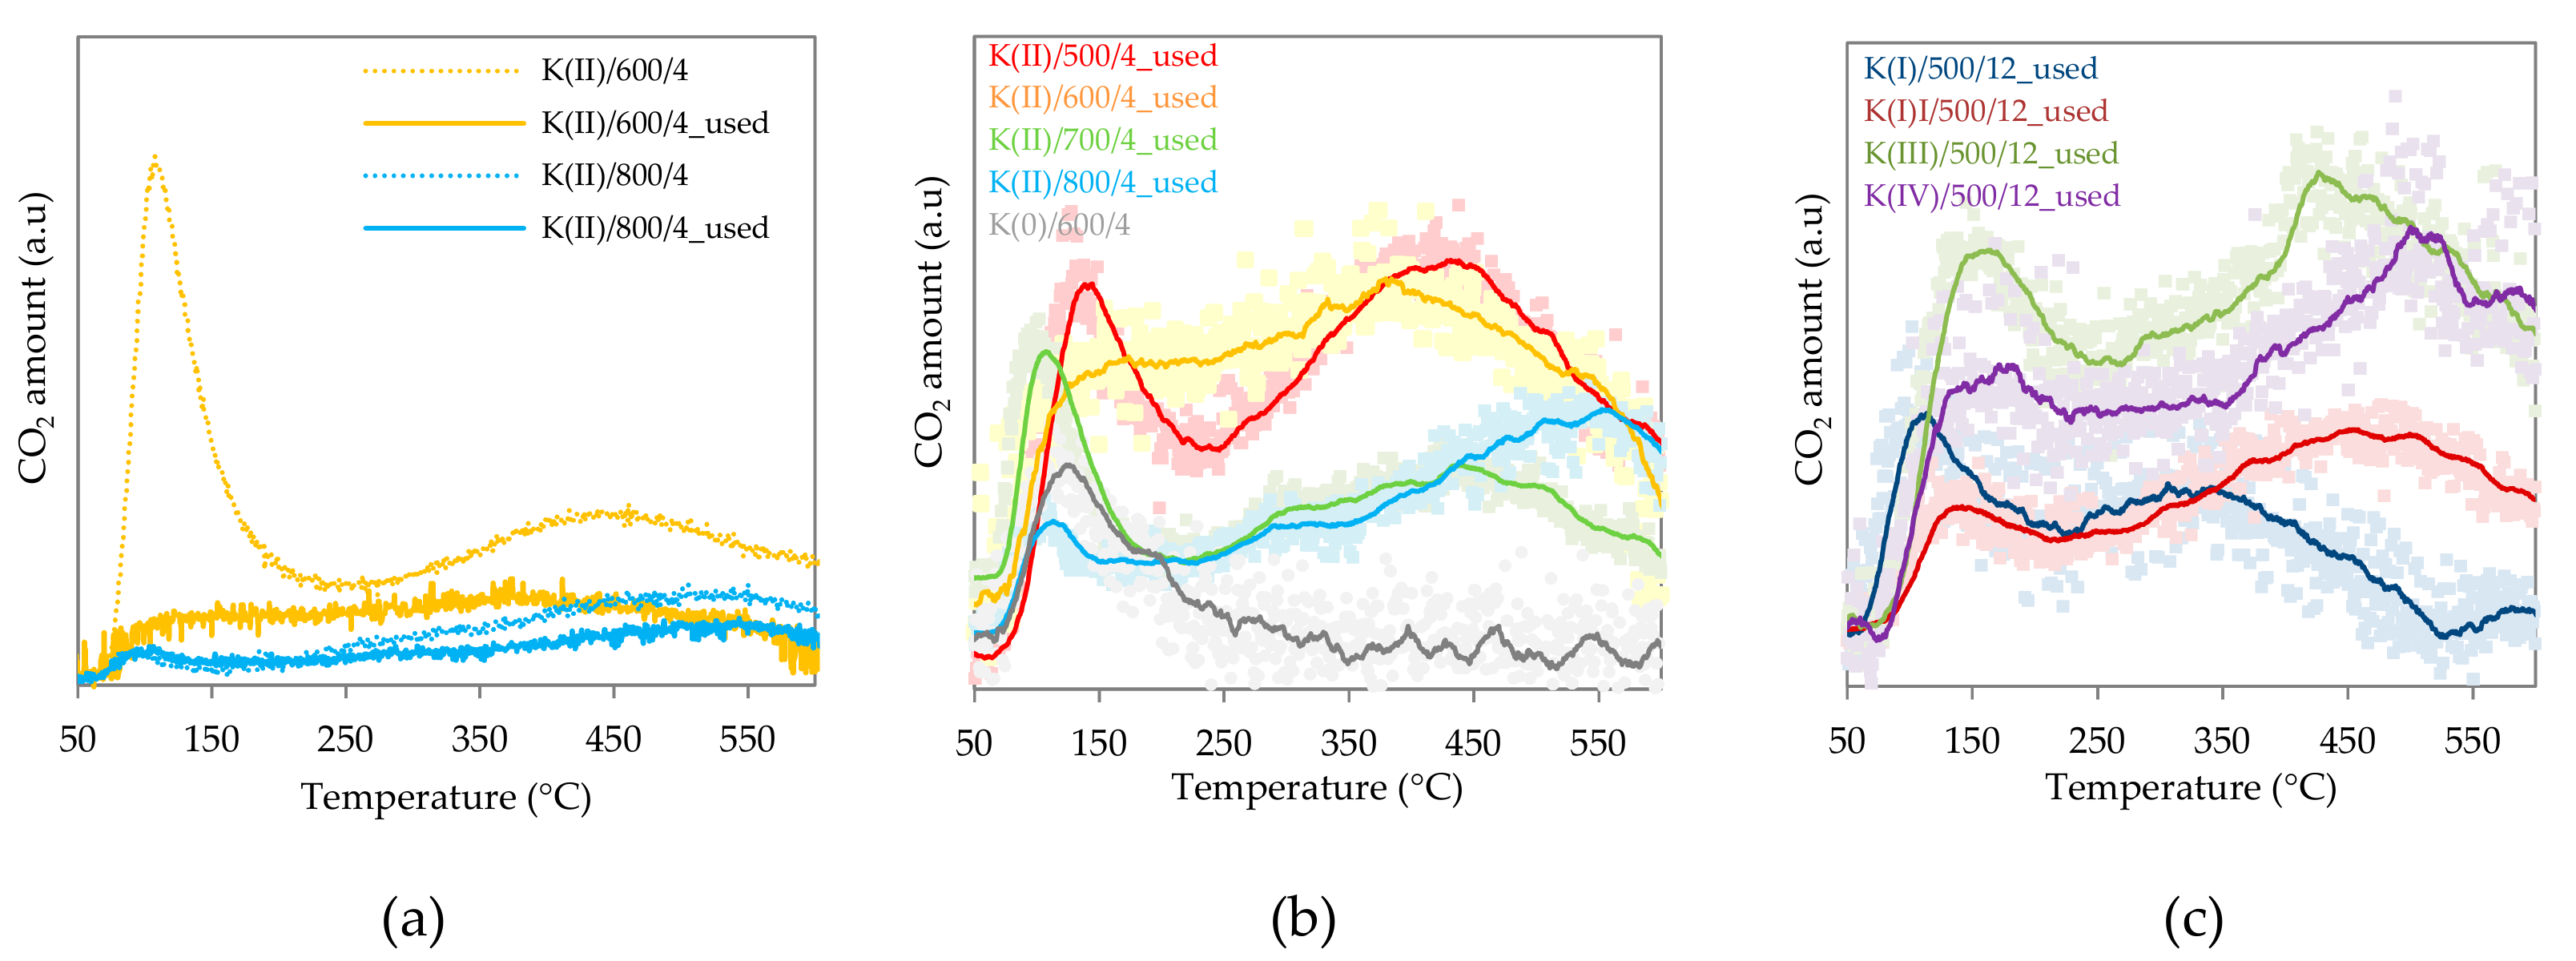
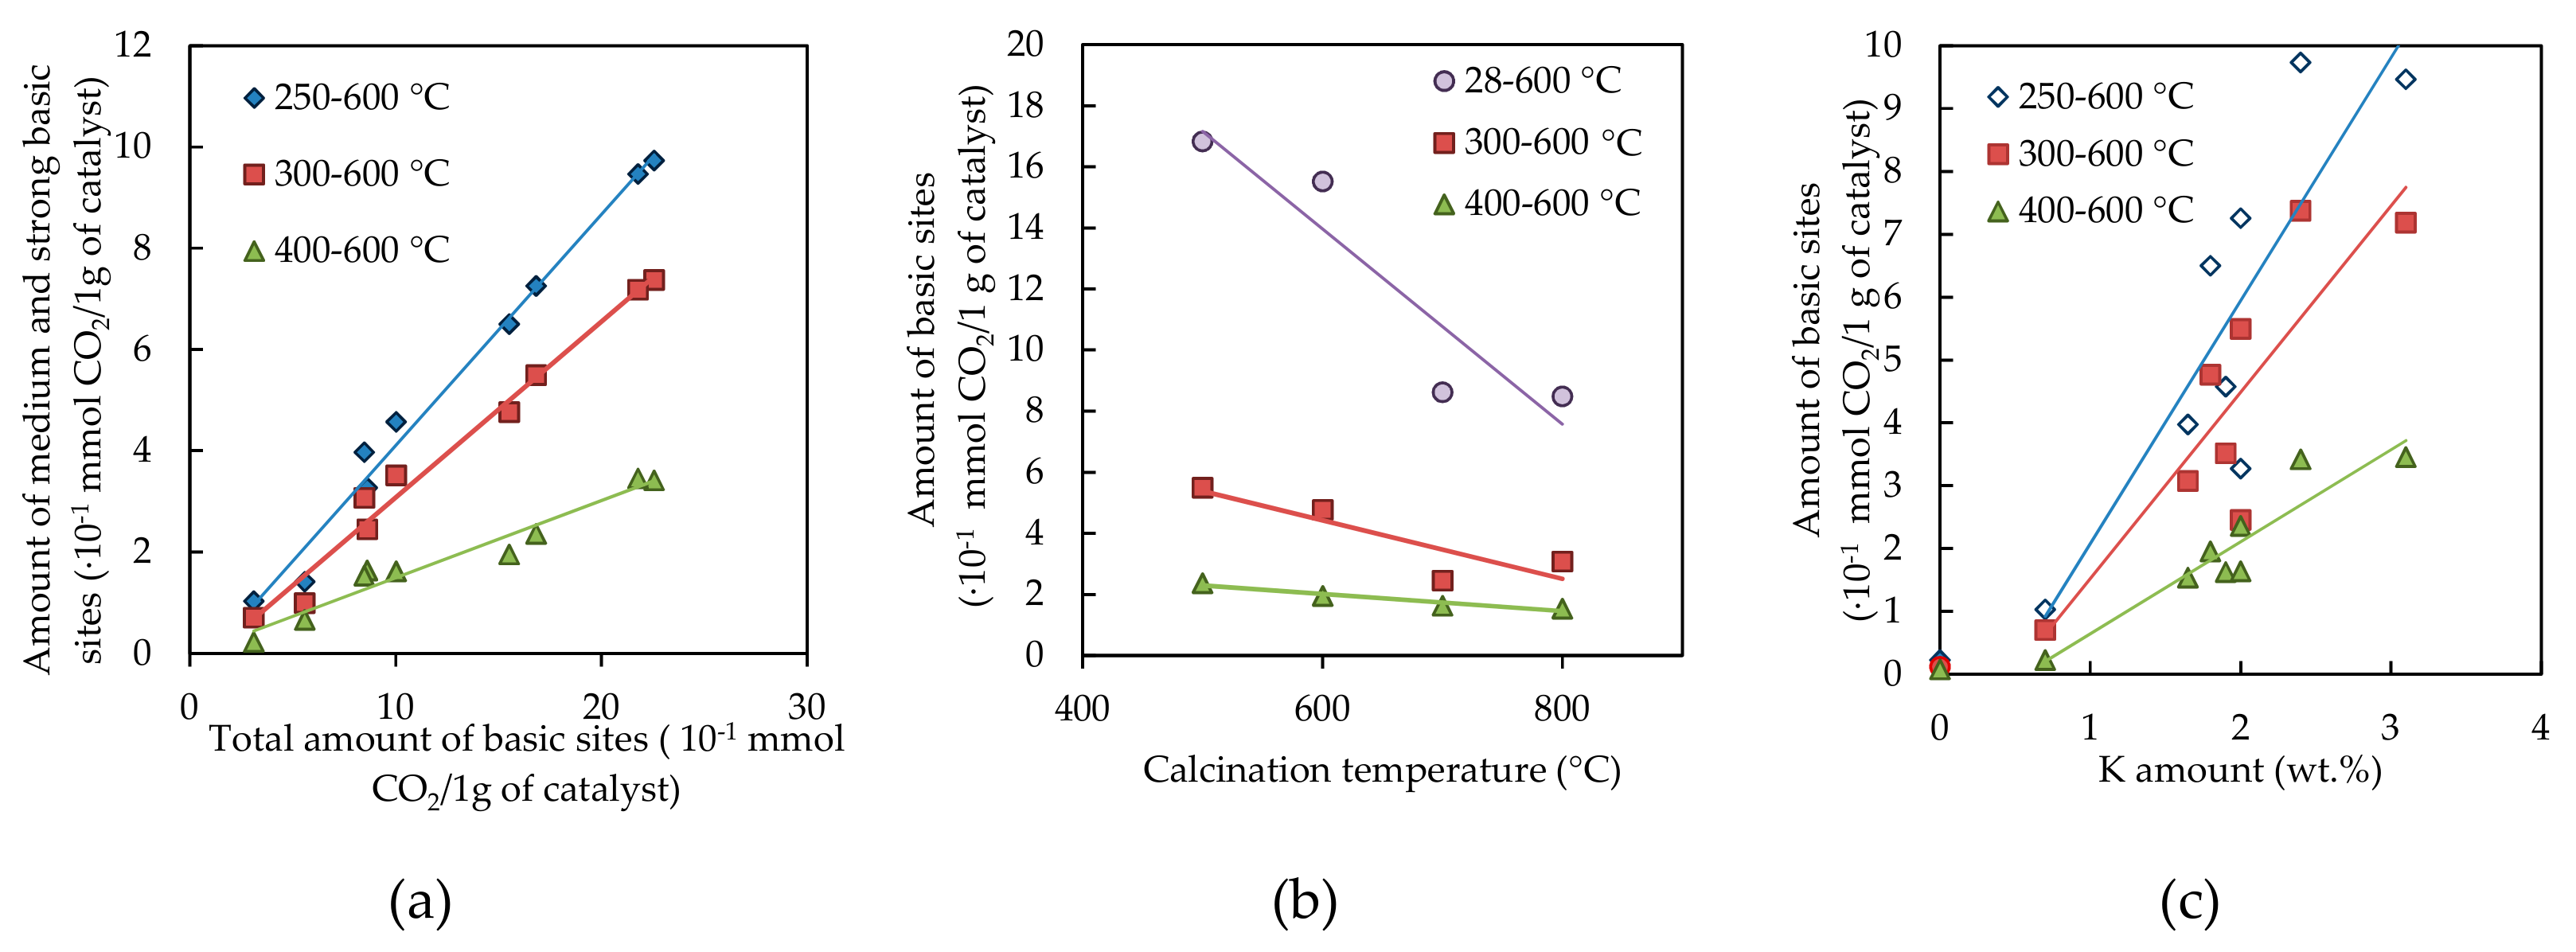
2.1.6. Basicity
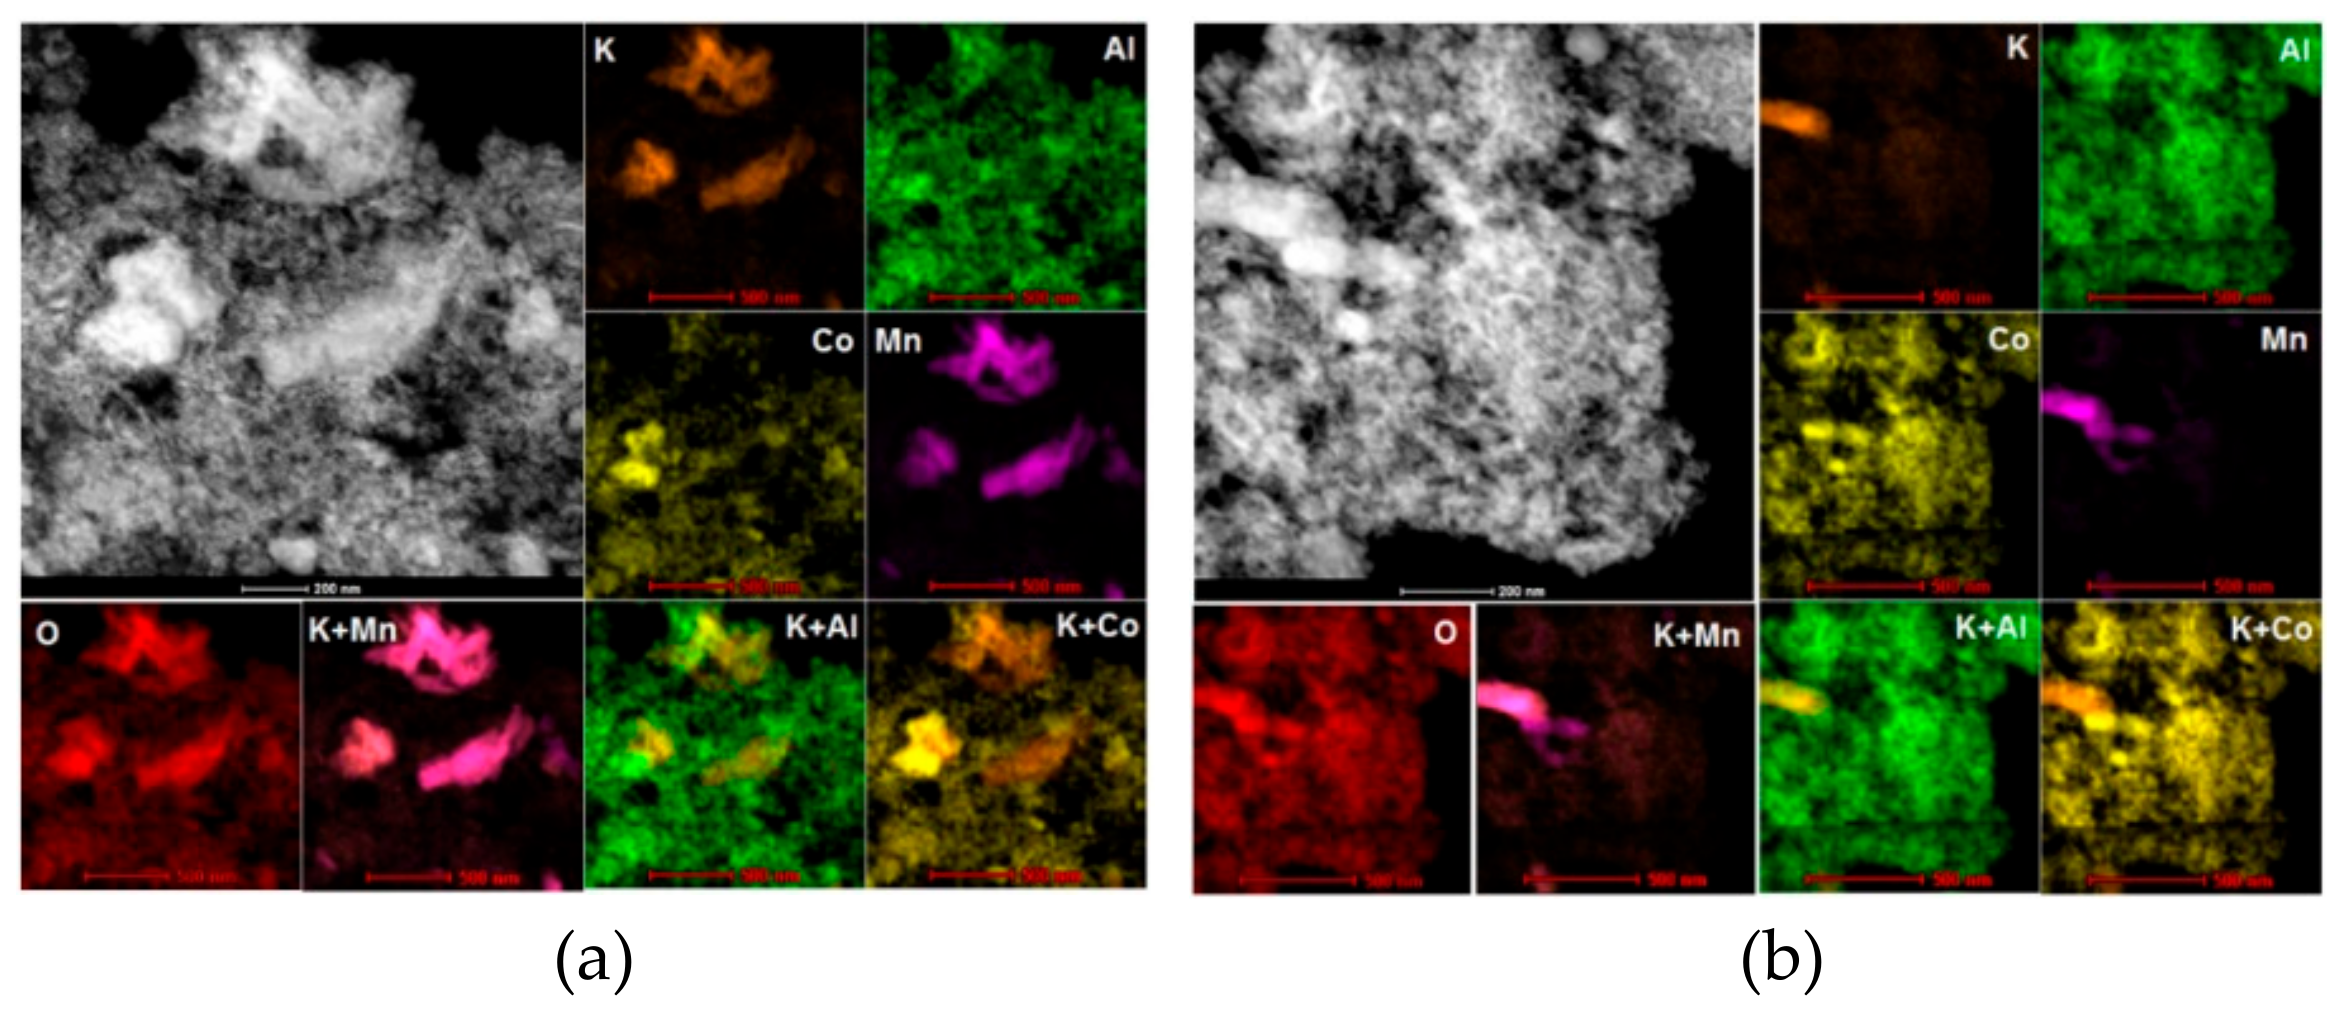
2.1.7. Phase Composition and Surface Elementary Mapping—TEM and STEM-EDS Analyses
2.1.8. Work Function
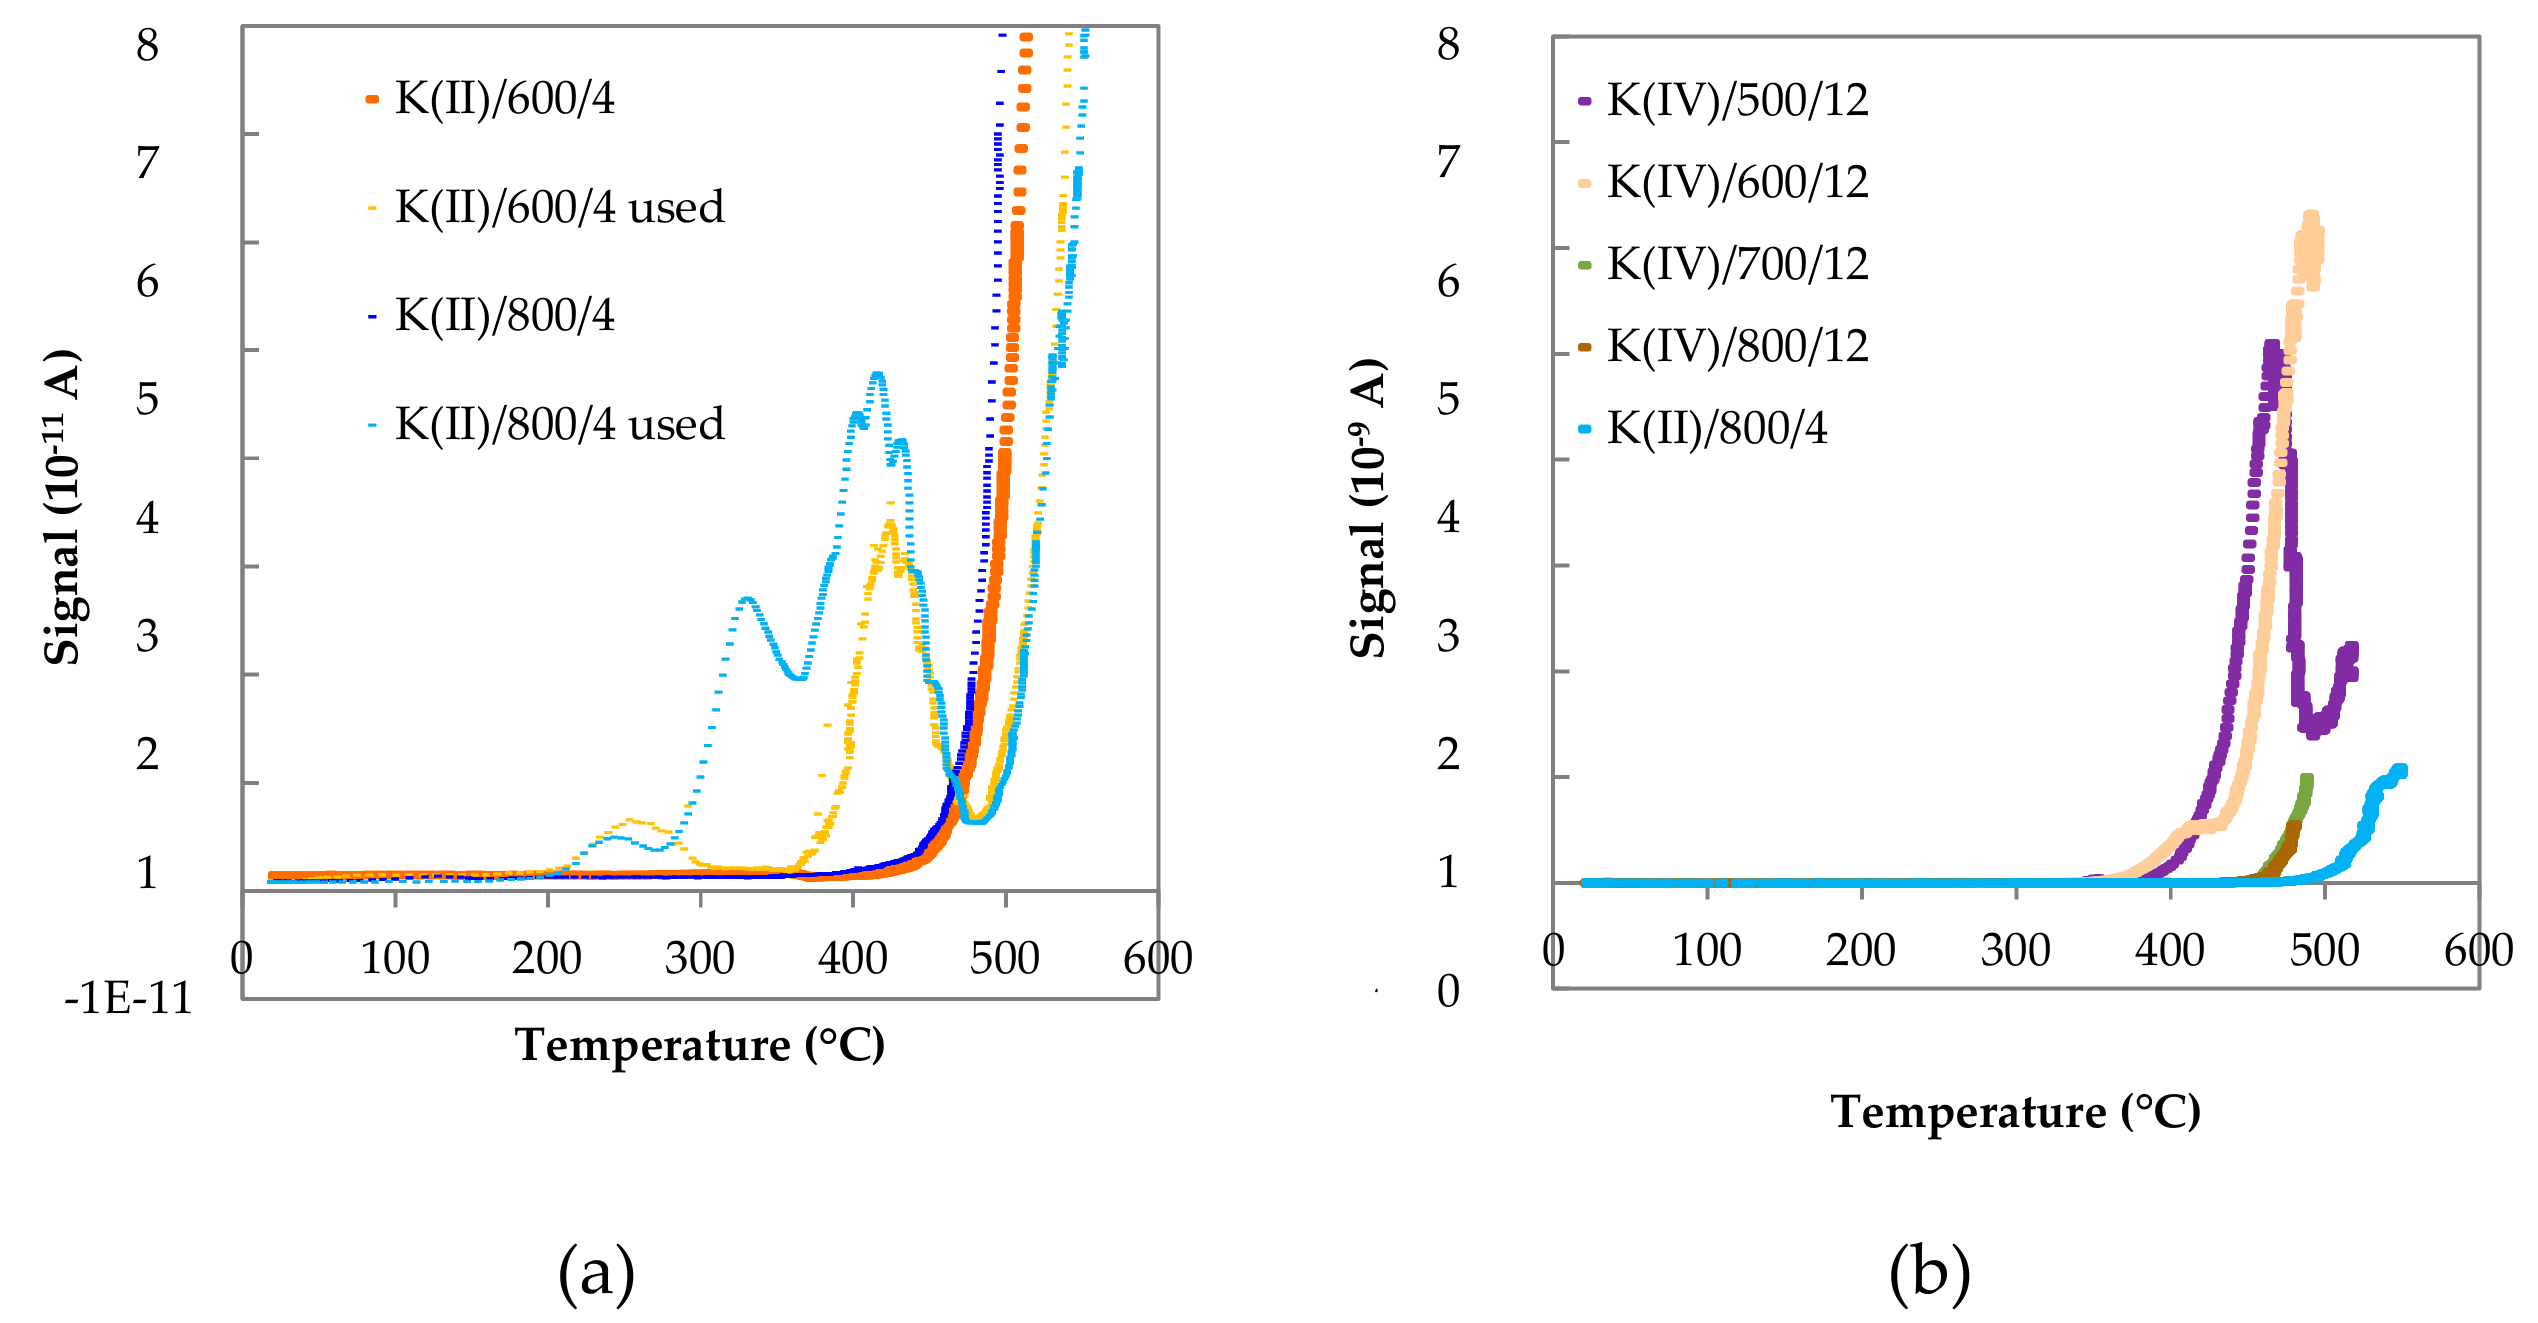
2.1.9. Species-Resolved Thermal Alkali Desorption
2.2. Direct NO Decomposition
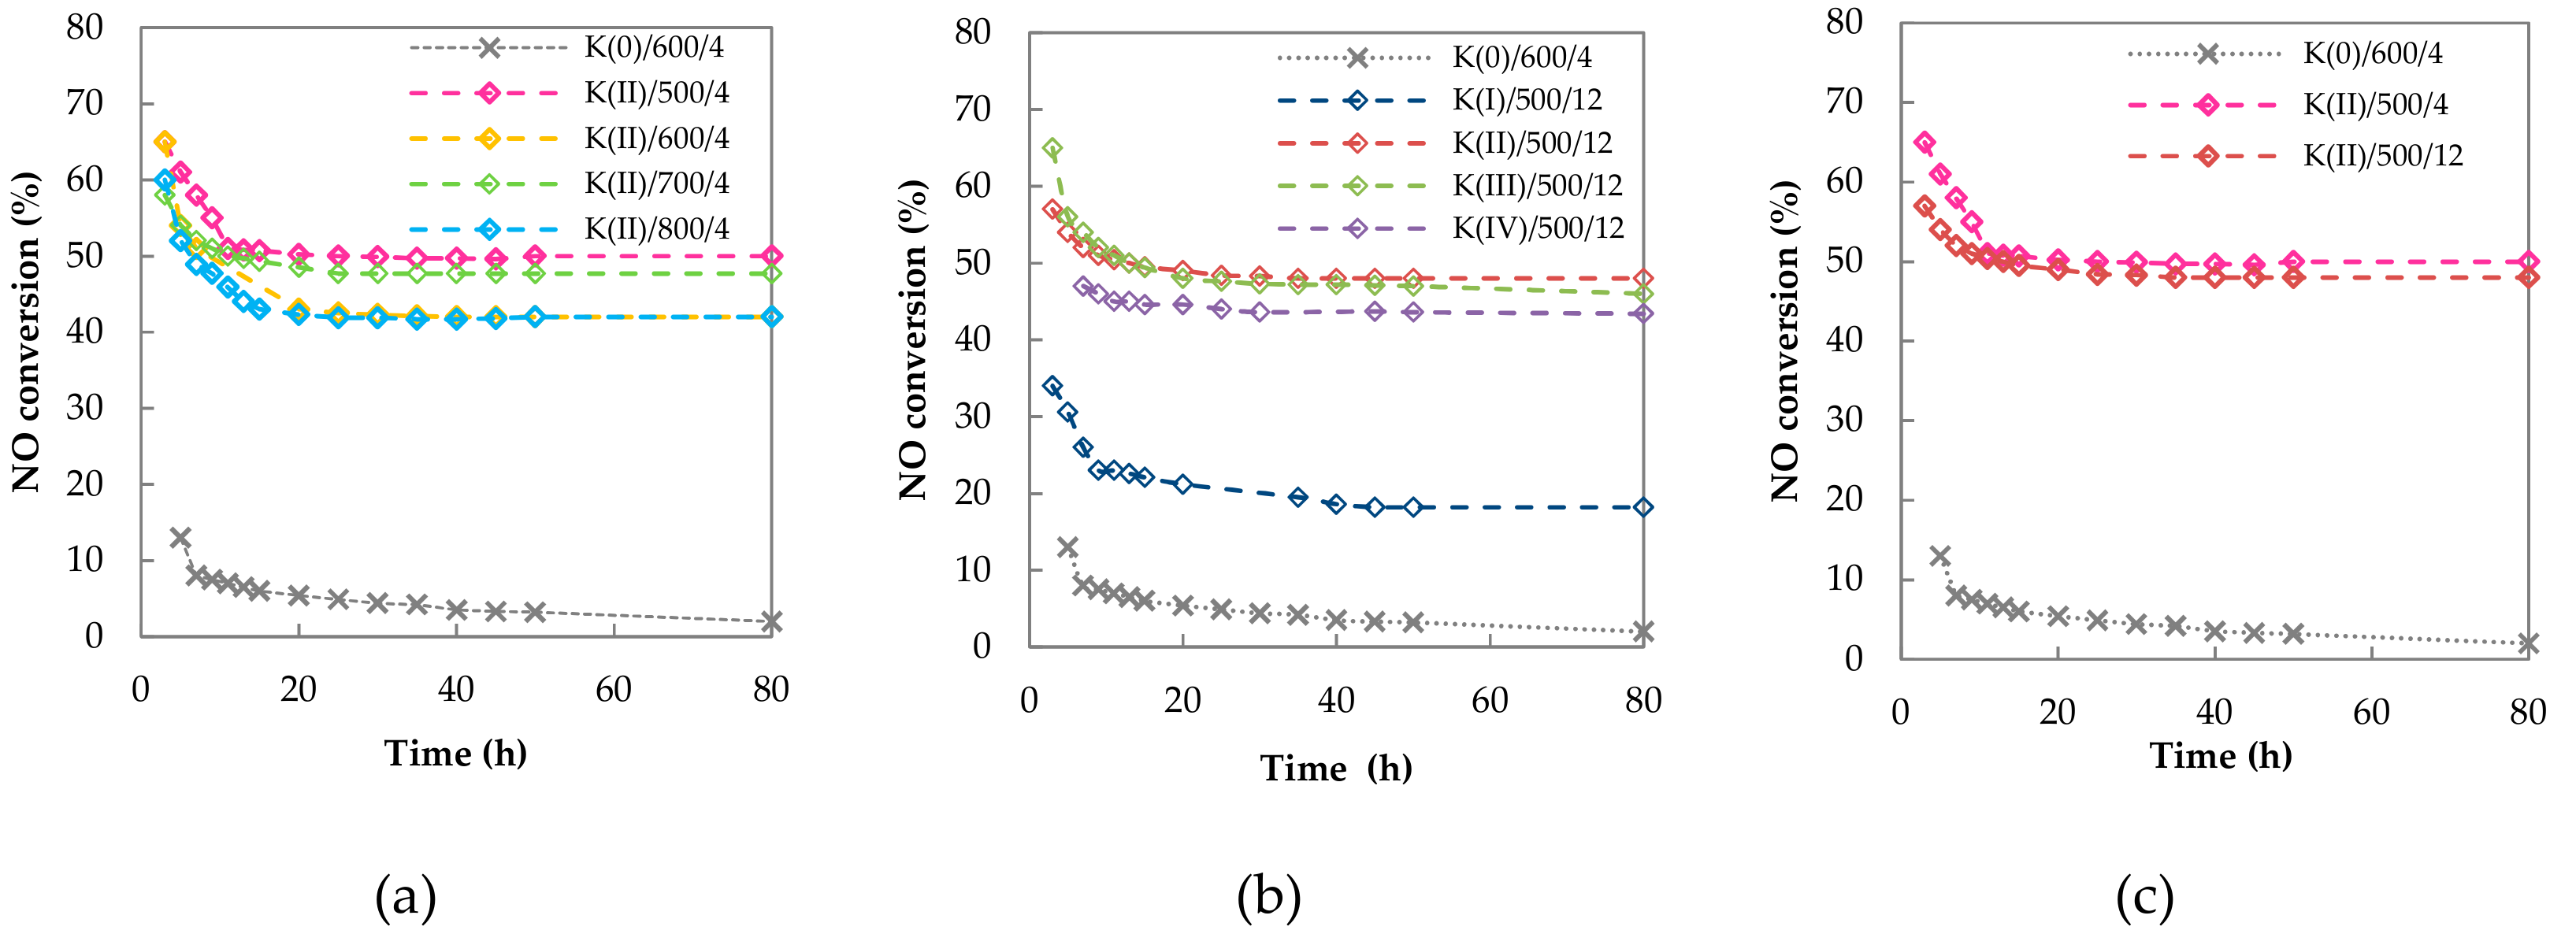
2.2.1. Long Term Stability
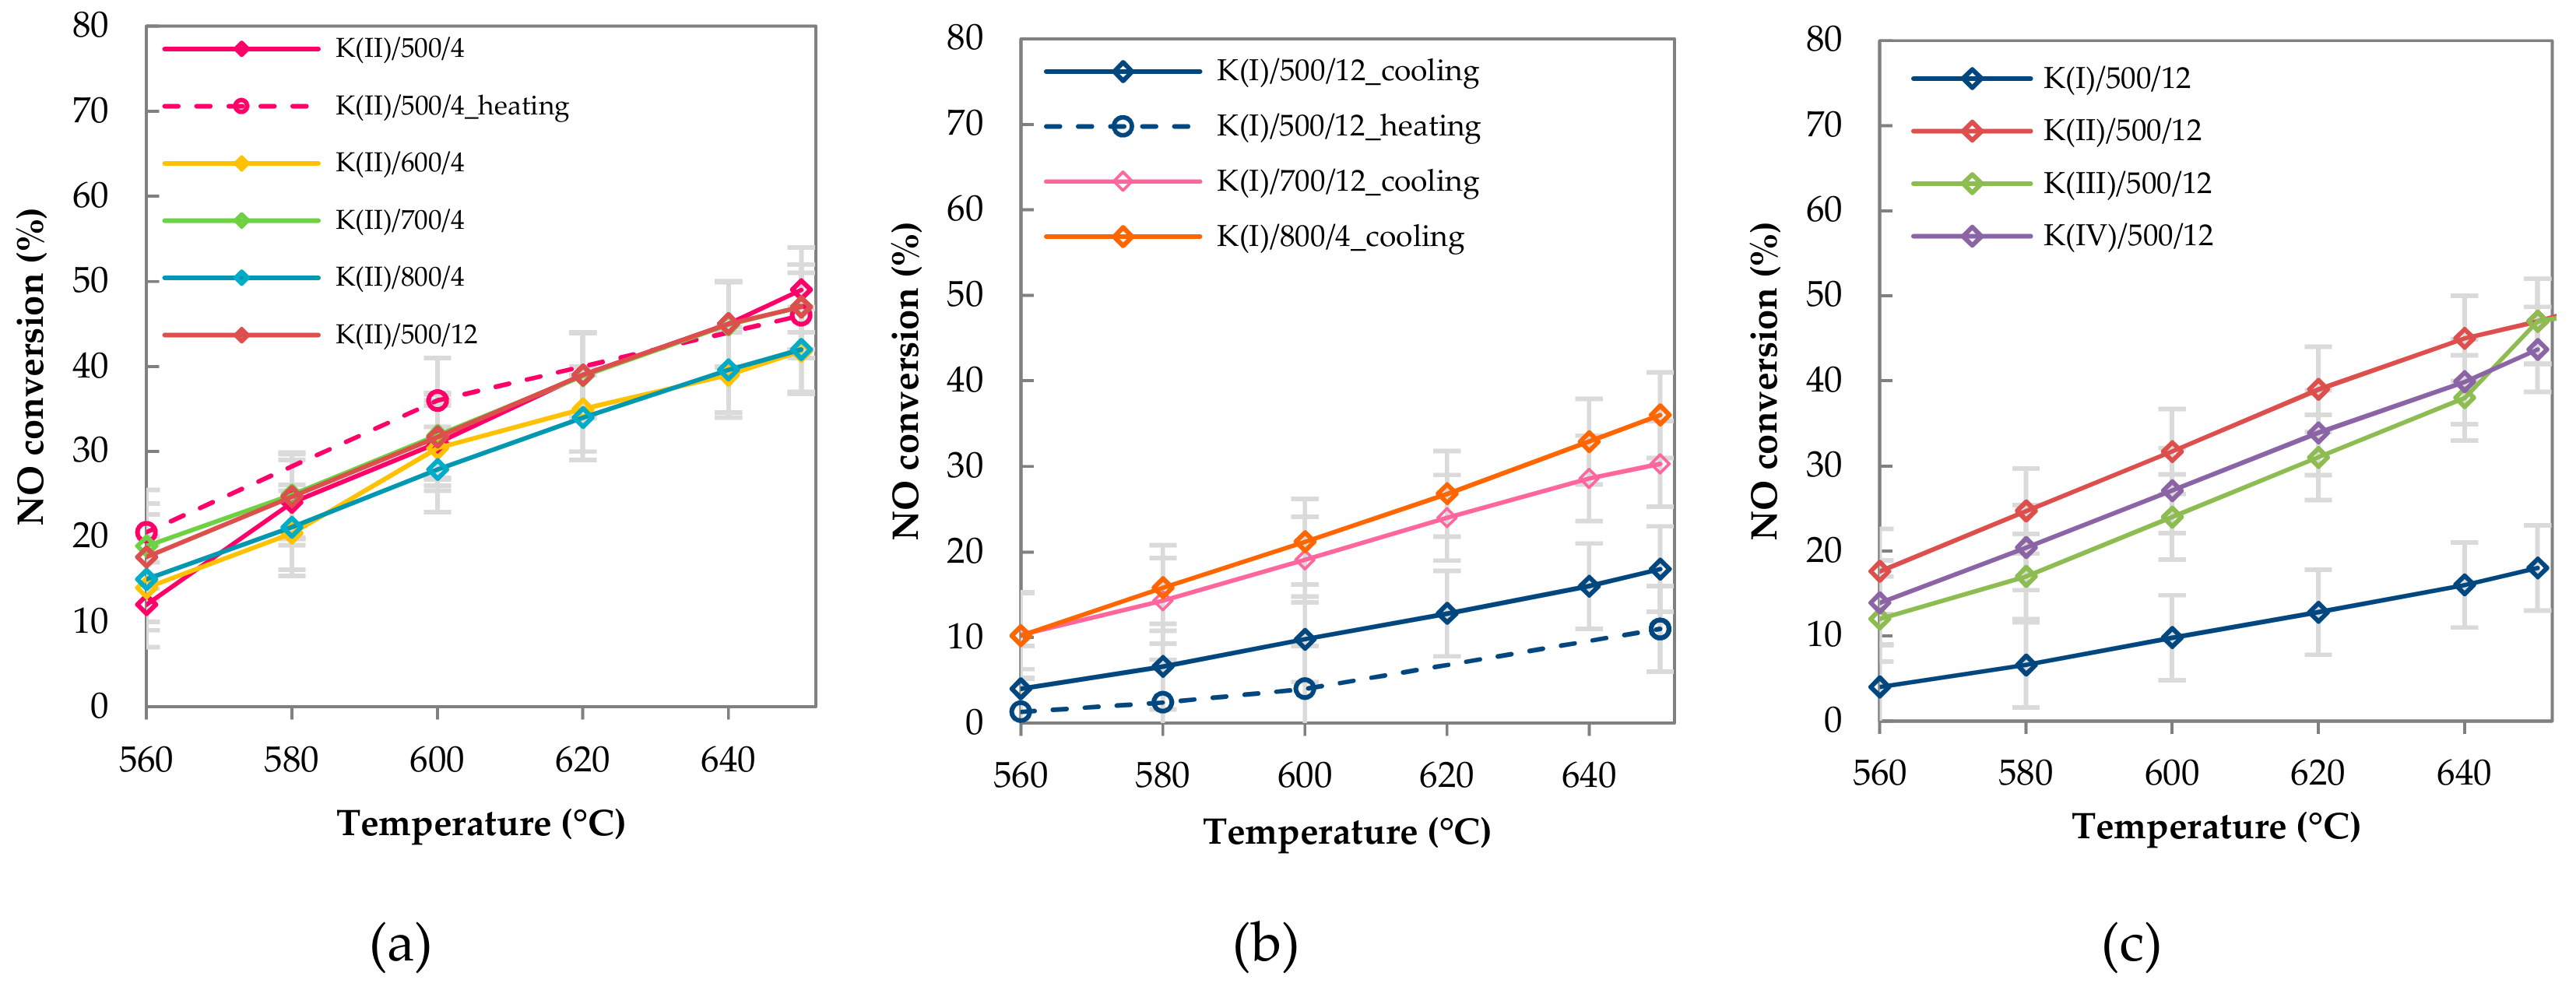
2.2.2. Catalytic Activity
3. Discussion
4. Materials and Methods
4.1. Catalyst Preparation
4.2. Catalyst Characterization
4.3. Catalytic Measurements
5. Conclusions
Supplementary Materials
Author Contributions
Funding
Acknowledgments
Conflicts of Interest
References
- Falsig, H.; Bligaard, T.; Rass-Hansen, J.; Kustov, A.; Christensen, C.; Nørskov, J. Trends in catalytic NO decomposition over transition metal surfaces. Top. Catal. 2007, 45, 117–120. [Google Scholar] [CrossRef]
- Garin, F. Mechanism of NOx decomposition. Appl. Catal. A 2001, 222, 183–219. [Google Scholar] [CrossRef]
- Brown, W.A.; King, D.A. NO Chemisorption and Reactions on Metal Surfaces: A New Perspective. J. Phys. Chem. B 2000, 104, 2578–2595. [Google Scholar] [CrossRef]
- Inderwildi, O.R.; Jenkins, S.J.; King, D.A. When adding an unreactive metal enhances catalytic activity: NOx decomposition over silver–rhodium bimetallic surfaces. Surf. Sci. 2007, 601, L103–L108. [Google Scholar] [CrossRef]
- Kumar, A.; Medhekar, V.; Harold, M.P.; Balakotaiah, V. NO decomposition and reduction on Pt/Al2O3 powder and monolith catalysts using the TAP reactor. Appl. Catal. B 2009, 90, 642–651. [Google Scholar] [CrossRef]
- Modén, B.; Da Costa, P.; Fonfé, B.; Lee, D.K.; Iglesia, E. Kinetics and Mechanism of Steady-State Catalytic NO Decomposition Reactions on Cu–ZSM5. J. Catal. 2002, 209, 75–86. [Google Scholar] [CrossRef]
- Ganemi, B.; Björnbom, E.; Paul, J. Conversion and in situ FTIR studies of direct NO decomposition over Cu-ZSM5. Appl. Catal. B 1998, 17, 293–311. [Google Scholar] [CrossRef]
- Shi, Y.; Pan, H.; Li, Z.; Zhang, Y.; Li, W. Low-temperature decomposition of NOx over Fe–Mn/H-beta catalysts in the presence of oxygen. Catal. Commun. 2008, 9, 1356–1359. [Google Scholar] [CrossRef]
- Haneda, M.; Kintaichi, Y.; Hamada, H. Surface reactivity of prereduced rare earth oxides with nitric oxide: New approach for NO decomposition. Phys. Chem. Chem. Phys. 2002, 4, 3146–3151. [Google Scholar] [CrossRef]
- Hamada, H.; Kintaichi, Y.; Sasaki, M.; Ito, T. Silver-promoted cobalt oxide catalysts for direct decomposition of nitrogen oxides. Chem. Lett. 1990, 19, 1069–1070. [Google Scholar] [CrossRef]
- Pacultová, K.; Draštíková, V.; Chromčáková, Ž.; Bílková, T.; Kutláková, K.M.; Kotarba, A.; Obalová, L. On the stability of alkali metal promoters in Co mixed oxides during direct NO catalytic decomposition. Mol. Catal. 2017, 428, 33–40. [Google Scholar] [CrossRef]
- Haneda, M.; Kintaichi, Y.; Bion, N.; Hamada, H. Alkali metal-doped cobalt oxide catalysts for NO decomposition. Appl. Catal. B Environ. 2003, 46, 473–482. [Google Scholar] [CrossRef]
- Cheng, J.; Wang, X.; Ma, C.; Hao, Z. Novel Co-Mg-Al-Ti-O catalyst derived from hydrotalcite-like compound for NO storage/decomposition. J. Environ. Sci. 2012, 24, 488–493. [Google Scholar] [CrossRef]
- Park, P.W.; Kil, J.K.; Kung, H.H.; Kung, M.C. NO decomposition over sodium-promoted cobalt oxide. Catal. Today 1998, 42, 51–60. [Google Scholar] [CrossRef]
- Neurock, M. Theory-Aided Catalyst Design. In Design of Heterogeneous Catalysts; Wiley-VCH Verlag GmbH & Co. KGaA: Weinheim, Germany, 2009; pp. 231–258. [Google Scholar] [CrossRef]
- Kotarba, A.; Kruk, I.; Sojka, Z. Energetics of Potassium Loss from Styrene Catalyst Model Components: Reassignment of K Storage and Release Phases. J. Catal. 2002, 211, 265–272. [Google Scholar] [CrossRef]
- Bieniasz, W.; Trębala, M.; Sojka, Z.; Kotarba, A. Irreversible deactivation of styrene catalyst due to potassium loss—Development of antidote via mechanism pinning. Catal. Today 2010, 154, 224–228. [Google Scholar] [CrossRef]
- Grzybek, G.; Wójcik, S.; Legutko, P.; Gryboś, J.; Indyka, P.; Leszczyński, B.; Kotarba, A.; Sojka, Z. Thermal stability and repartition of potassium promoter between the support and active phase in the K-Co2.6Zn0.4O4|α-Al2O3 catalyst for N2O decomposition: Crucial role of activation temperature on catalytic performance. Appl. Catal. B 2017, 205, 597–604. [Google Scholar] [CrossRef]
- Cheng, H.; Huang, Y.; Wang, A.; Li, L.; Wang, X.; Zhang, T. N2O decomposition over K-promoted Co-Al catalysts prepared from hydrotalcite-like precursors. Appl. Catal. B 2009, 89, 391–397. [Google Scholar] [CrossRef]
- Kotarba, A.S.G.; Ciura, K.; Indyka, P.; Grybos, J.; Grzybek, G.; Legutko, P.; Stelmachowski, P.; Sojka, Z. Alkali Promotion for Enhancing the Activity of Bulk and Supported Cobalt Spinel Catalysts for Low-Temperature deN2O, KRAcat de N2O. In Proceedings of the International Thematic Workshop KRACat-deN2O, Krakow, Poland, 4–6 May 2016. [Google Scholar]
- Cheng, J.; Wang, X.; Yu, J.; Hao, Z.; Xu, Z.P. Sulfur-Resistant NO Decomposition Catalysts Derived from Co−Ca/Ti−Al Hydrotalcite-like Compounds. J. Phys. Chem. C 2011, 115, 6651–6660. [Google Scholar] [CrossRef]
- Haneda, M.; Nakamura, I.; Fujitani, T.; Hamada, H. Catalytic Active Site for NO Decomposition Elucidated by Surface Science and Real Catalyst. Catal. Surv. Asia 2005, 9, 207–215. [Google Scholar] [CrossRef]
- Winter, E.R.S. The catalytic decomposition of nitric oxide by metallic oxides. J. Catal. 1971, 22, 158–170. [Google Scholar] [CrossRef]
- Tsujimoto, S.; Masui, T.; Imanaka, N. Fundamental Aspects of Rare Earth Oxides Affecting Direct NO Decomposition Catalysis. Eur. J. Inorg. Chem. 2015, 2015, 1524–1528. [Google Scholar] [CrossRef]
- Hong, W.-J.; Iwamoto, S.; Hosokawa, S.; Wada, K.; Kanai, H.; Inoue, M. Effect of Mn content on physical properties of CeOx–MnOy support and BaO–CeOx–MnOy catalysts for direct NO decomposition. J. Catal. 2011, 277, 208–216. [Google Scholar] [CrossRef]
- Falsig, H.; Bligaard, T.; Christensen, C.H.; Nørskov, J.K. Direct NO decomposition over stepped transition-metal surfaces. Pure Appl. Chem. 2007, 79, 1895–1903. [Google Scholar] [CrossRef]
- Jakubek, T.; Kaspera, W.; Legutko, P.; Stelmachowski, P.; Kotarba, A. Surface versus bulk alkali promotion of cobalt-oxide catalyst in soot oxidation. Catal. Commun. 2015, 71, 37–41. [Google Scholar] [CrossRef]
- Niemantsverdriet, J.W. Spectroscopy in Catalysis: An Introduction; Willey: Hoboken, NJ, USA, 2007. [Google Scholar] [CrossRef]
- Raghuvanshi, S.; Mazaleyrat, F.; Kane, S.N. Mg1-xZnxFe2O4 nanoparticles: Interplay between cation distribution and magnetic properties. AIP Adv. 2017, 8, 047804. [Google Scholar] [CrossRef]
- Kovanda, F.; Rojka, T.; Dobešová, J.; Machovič, V.; Bezdička, P.; Obalová, L.; Jirátová, K.; Grygar, T. Mixed oxides obtained from Co and Mn containing layered double hydroxides: Preparation, characterization, and catalytic properties. J. Solid State Chem. 2006, 179, 812–823. [Google Scholar] [CrossRef]
- Deraz, N.M. Formation and Characterization of Cobalt Aluminate Nano-Particles. Int. J. Electrochem. Sci. 2013, 8, 4036–4046. [Google Scholar]
- Scofield, J.H. Hartree-Slater subshell photoionization cross-sections at 1254 and 1487 eV. J. Electron. Spectrosc. Relat. Phenom. 1976, 8, 129–137. [Google Scholar] [CrossRef]
- Obalová, L.; Pacultová, K.; Balabánová, J.; Jirátová, K.; Bastl, Z.; Valášková, M.; Lacný, Z.; Kovanda, F. Effect of Mn/Al ratio in Co–Mn–Al mixed oxide catalysts prepared from hydrotalcite-like precursors on catalytic decomposition of N2O. Catal. Today 2007, 119, 233–238. [Google Scholar] [CrossRef]
- Obalová, L.; Karásková, K.; Jirátová, K.; Kovanda, F. Effect of potassium in calcined Co–Mn–Al layered double hydroxide on the catalytic decomposition of N2O. Appl. Catal. B 2009, 90, 132–140. [Google Scholar] [CrossRef]
- Biesinger, M.C.; Payne, B.P.; Grosvenor, A.P.; Lau, L.W.M.; Gerson, A.R.; Smart, R.S.C. Resolving surface chemical states in XPS analysis of first row transition metals, oxides and hydroxides: Cr, Mn, Fe, Co and Ni. Appl. Surf. Sci. 2011, 257, 2717–2730. [Google Scholar] [CrossRef]
- Gautier, J.L.; Rios, E.; Gracia, M.; Marco, J.F.; Gancedo, J.R. Characterisation by X-ray photoelectron spectroscopy of thin MnxCo3−xO4(1≥x≥0) spinel films prepared by low-temperature spray pyrolysis. Thin Solid Films 1997, 311, 51–57. [Google Scholar] [CrossRef]
- Todorova, S.; Kolev, H.; Holgado, J.P.; Kadinov, G.; Bonev, C.; Pereñíguez, R.; Caballero, A. Complete n-hexane oxidation over supported Mn–Co catalysts. Appl. Catal. B 2010, 94, 46–54. [Google Scholar] [CrossRef]
- Zhou, M.; Cai, L.; Bajdich, M.; García-Melchor, M.; Li, H.; He, J.; Wilcox, J.; Wu, W.; Vojvodic, A.; Zheng, X. Enhancing Catalytic CO Oxidation over Co3O4 Nanowires by Substituting Co2+ with Cu2+. ACS Catal. 2015, 5, 4485–4491. [Google Scholar] [CrossRef]
- Chen, Z.; Kronawitter, C.X.; Koel, B.E. Facet-dependent activity and stability of Co3O4 nanocrystals towards the oxygen evolution reaction. PCCP 2015, 17, 29387–29393. [Google Scholar] [CrossRef]
- Bhatnagar, A.; Jain, A.K. A comparative adsorption study with different industrial wastes as adsorbents for the removal of cationic dyes from water. J. Colloid Interface Sci. 2005, 281, 49–55. [Google Scholar] [CrossRef]
- Kim, S.C.; Shim, W.G. Catalytic combustion of VOCs over a series of manganese oxide catalysts. Appl. Catal. B 2010, 98, 180–185. [Google Scholar] [CrossRef]
- Obalová, L.; Maniak, G.; Karásková, K.; Kovanda, F.; Kotarba, A. Electronic nature of potassium promotion effect in Co–Mn–Al mixed oxide on the catalytic decomposition of N2O. Catal. Commun. 2011, 12, 1055–1058. [Google Scholar] [CrossRef]
- Klyushina, A.; Pacultová, K.; Karásková, K.; Jirátová, K.; Ritz, M.; Fridrichová, D.; Volodarskaja, A.; Obalová, L. Effect of preparation method on catalytic properties of Co-Mn-Al mixed oxides for N2O decomposition. J. Mol. Catal. A Chem. 2016, 425, 237–247. [Google Scholar] [CrossRef]
- Santos, V.P.; Soares, O.S.G.P.; Bakker, J.J.W.; Pereira, M.F.R.; Órfão, J.J.M.; Gascon, J.; Kapteijn, F.; Figueiredo, J.L. Structural and chemical disorder of cryptomelane promoted by alkali doping: Influence on catalytic properties. J. Catal. 2012, 293, 165–174. [Google Scholar] [CrossRef]
- Becerra, M.E.; Arias, N.P.; Giraldo, O.H.; López Suárez, F.E.; Illán Gómez, M.J.; Bueno López, A. Soot combustion manganese catalysts prepared by thermal decomposition of KMnO4. Appl. Catal. B 2011, 102, 260–266. [Google Scholar] [CrossRef]
- Da Costa-Serra, J.F.; Chica, A. Catalysts based on Co-Birnessite and Co-Todorokite for the efficient production of hydrogen by ethanol steam reforming. Int. J. Hydrog. Energy 2018, 43, 16859–16865. [Google Scholar] [CrossRef]
- Obalová, L.; Karásková, K.; Wach, A.; Kustrowski, P.; Mamulová-Kutláková, K.; Michalik, S.; Jirátová, K. Alkali metals as promoters in Co–Mn–Al mixed oxide for N2O decomposition. Appl. Catal. A 2013, 462–463, 227–235. [Google Scholar] [CrossRef]
- Imanaka, N.; Masui, T. Advances in direct NOx decomposition catalysts. Appl. Catal. A 2012, 431–432, 1–8. [Google Scholar] [CrossRef]
- Smoláková, L.; Frolich, K.; Troppová, I.; Kutálek, P.; Kroft, E.; Čapek, L. Determination of basic sites in Mg–Al mixed oxides by combination of TPD-CO2 and CO2 adsorption calorimetry. J. Therm. Anal. Calorim. 2017, 127, 1921–1929. [Google Scholar] [CrossRef]
- Maniak, G.; Stelmachowski, P.; Kotarba, A.; Sojka, Z.; Rico-Pérez, V.; Bueno-López, A. Rationales for the selection of the best precursor for potassium doping of cobalt spinel based deN2O catalyst. Appl. Catal. B 2013, 136–137, 302–307. [Google Scholar] [CrossRef]
- Gálvez, M.E.; Ascaso, S.; Stelmachowski, P.; Legutko, P.; Kotarba, A.; Moliner, R.; Lázaro, M.J. Influence of the surface potassium species in Fe–K/Al2O3 catalysts on the soot oxidation activity in the presence of NOx. Appl. Catal. B 2014, 152–153, 88–98. [Google Scholar] [CrossRef]
- Borowiecki, T.; Denis, A.; Rawski, M.; Gołębiowski, A.; Stołecki, K.; Dmytrzyk, J.; Kotarba, A. Studies of potassium-promoted nickel catalysts for methane steam reforming: Effect of surface potassium location. Appl. Surf. Sci. 2014, 300, 191–200. [Google Scholar] [CrossRef]
- Gimenez, P.; Fereres, S. Effect of Heating Rates and Composition on the Thermal Decomposition of Nitrate Based Molten Salts. Energy Procedia 2015, 69, 654–662. [Google Scholar] [CrossRef] [Green Version]
- Kaspera, W.; Wojas, J.; Molenda, M.; Kotarba, A. Parallel migration of potassium and oxygen ions in hexagonal tungsten bronze—Bulk diffusion, surface segregation and desorption. Solid State Ion. 2016, 297, 1–6. [Google Scholar] [CrossRef]
- Haneda, M.; Tsuboi, G.; Nagao, Y.; Kintaichi, Y.; Hamada, H. Direct Decomposition of NO Over Alkaline Earth Metal Oxide Catalysts Supported on Cobalt Oxide. Catal. Lett. 2004, 97, 145–150. [Google Scholar] [CrossRef]
- Hong, W.-J.; Iwamoto, S.; Inoue, M. Direct NO decomposition over a Ce–Mn mixed oxide modified with alkali and alkaline earth species and CO2-TPD behavior of the catalysts. Catal. Today 2011, 164, 489–494. [Google Scholar] [CrossRef]
- Palomares, E.; Uzcátegui, A.; Franch, C.; Corma, A. Multifunctional catalyst for maximizing NOx oxidation/storage/reduction: The role of the different active sites. Appl. Catal. B 2013, 142–143, 795–800. [Google Scholar] [CrossRef]
- Haneda, M.; Kintaichi, Y.; Hamada, H. Reaction mechanism of NO decomposition over alkali metal-doped cobalt oxide catalysts. Appl. Catal. B 2005, 55, 169–175. [Google Scholar] [CrossRef]
- Haneda, M.; Hamada, H. Recent progress in catalytic NO decomposition. Comptes Rendus Chim. 2016, 19, 1254–1265. [Google Scholar] [CrossRef]
- Zhu, J.; Thomas, A. Perovskite-type mixed oxides as catalytic material for NO removal. Appl. Catal. B 2009, 92, 225–233. [Google Scholar] [CrossRef]
- Jabłońska, M.; Palomares, A.E.; Chmielarz, L. NOx storage/reduction catalysts based on Mg/Zn/Al/Fe hydrotalcite-like materials. Chem. Eng. J. 2013, 231, 273–280. [Google Scholar] [CrossRef]


| Sample * | Co (wt.%) | Mn (wt.%) | Al (wt.%) | Co:Mn:Al (Molar Ratio) |
|---|---|---|---|---|
| K(II)/500/4 | 52.8 | 11.2 | 5.1 | 4.0:0.9:0.8 |
| K(II)/600/4 | 49.7 | 11.9 | 5.4 | 4.0:1.0:1.0 |
| K(II)/700/4 | 51.5 | 11.4 | 5.4 | 4.0:1.0:0.9 |
| K(II)/800/4 | 45.1 | 12.0 | 5.6 | 4.0:1.1:1.1 |
| K(I)/500/12 | 48.1 | 11.7 | 5.3 | 4.0:1.0:1.0 |
| K(II)/500/12 | 44.2 | 11.3 | 5.1 | 4.0:1.1:1.0 |
| K(III)/500/12 | 46.9 | 11.0 | 5.5 | 4.0:1.0:1.0 |
| K(IV)/500/12 | 51.0 | 10.5 | 5.4 | 4.0:0.9:0.9 |
| K(0)/600/4 | 51.0 | 16.0 | 6.4 | 4.0:1.3:1.1 |
| Sample | Kfresh (wt.%) | Kused (wt.%) | SBET fresh (m2/g) | SBET used (m2/g) | Lc fresh (nm) | afresh (nm) |
|---|---|---|---|---|---|---|
| K(II)/500/4 | 2.1 | 1.8 | 94 | 33 | 9 | 0.81163 ± 0.00004 |
| K(II)/600/4 | 2.0 | 2.0 | 72 | 23 | 12 | 0.81075 ± 0.00007 |
| K(II)/700/4 | 2.0 | 1.8 | 50 | 21 | 16 | 0.81485 ± 0.00004 |
| K(II)/800/4 | 1.6 | 1.4 | 23 | 16 | 28 | 0.81512 ± 0.00004 |
| K(I)/500/12 | 0.7 | 0.6 | 73 | 42 | 10 | 0.81079 ± 0.00010 |
| K(II)/500/12 | 1.9 | 1.8 | 87 | 32 | 13 | 0.81085 ± 0.00011 |
| K(III)/500/12 | 2.4 | 2.5 | 73 | 44 | 12 | 0.81051 ± 0.00005 |
| K(IV)/500/12 | 3.1 | 2.7 | 69 | 40 | 13 | 0.81051 ± 0.00005 |
| K(0)/600/4 | 0 | 0 | 49 | 12 | 13 | 0.81210 ± 0.00008 |
| Calcination Temperature y (°C) | Sample | |||
|---|---|---|---|---|
| K(I)/y/4 | K(II)/y/4 | K(III)/y/4 | K(IV)/y/4 | |
| 500 | A | A | A | A |
| 600 | A | A | B | n.d. |
| 700 | B | B | B | B |
| 800 | B | B | B | B |
| Sample | Co | Mn | Al | O | C | K | Na |
|---|---|---|---|---|---|---|---|
| (at. %) | (at. %) | (at. %) | (at. %) | (at. %) | (at. %) | (at. %) | |
| K(0)/670/4 | 9.08 | 4.55 | 7.66 | 44.41 | 30.12 | 0 | 4.18 |
| K(II)/500/12 | 9.37 | 4.07 | 8.25 | 44.26 | 30.99 | 3.07 | 0 |
| K(II)/500/12_used | 8.81 | 4.17 | 8.54 | 45.59 | 27.1 | 5.79 | 0 |
| Sample | Co (wt.%) | Mn (wt.%) | Al (wt.%) | K (wt.%) | Na (wt.%) |
|---|---|---|---|---|---|
| Bulk Surface | Bulk Surface | Bulk Surface | Bulk Surface | Surface | |
| K0/670/4 | 52.0 49.2 | 11.7 23.0 | 5.4 19.0 | 0.0 0 | n.d. |
| KII/500/12 | 45.6 49.4 | 11.0 0.0 | 4.4 19.9 | 2.5 10.7 | 0 |
| KII/500/12_used | 44.0 43.1 | 10.1 19.0 | 5.0 19.1 | 1.9 18.8 | 0 |
| Sample | Surface/Bulk (Weight Ratio) | |||
|---|---|---|---|---|
| Co | Mn | Al | K | |
| K(0)/670/4 | 0.9 | 2.0 | 3.5 | 0 |
| K(II)/500/12 | 1.1 | 1.8 | 4.5 | 4.3 |
| K(II)/500/12_used | 1.0 | 1.9 | 3.8 | 9.9 |
| Sample | Co 2p3/2 | Co 2p3/2 sat. | Mn 2p3/2 | Mn 2p3/2 | O 1s | O 1s | O 1s |
|---|---|---|---|---|---|---|---|
| eV (%) | eV (%) | eV (%) | eV (%) | eV (%) | eV (%) | eV (%) | |
| K(0)/670/4 | 780.5 (82) | 786.4 (18) | 641.4 (57) | 642.6 (43) | 529.9 (66) | 531.4 (27) | 532.7 (7) |
| K(II)/500/12 | 780.5 (70) | 786.3 (24) | 641.7 (58) | 642.9 (42) | 529.8 (57) | 531.3 (33) | 532.7 (10) |
| K(II)/500/12_used | 780.5 (76) | 786.4 (30) | 641.4 (47) | 642.6 (53) | 529.7 (53) | 531.2 (28) | 532.8 (19) |
| Sample | Activation Energy (eV) |
|---|---|
| K(IV)/500/12 | 2.7 |
| K(IV)/600/12 | 2.6 |
| K(IV)/700/12 | 2.3 |
| K(IV)/800/12 | 2.2 |
| K(II)/600/4 | 2.3 |
| K(II)/700/4 | 2.3 |
| K(II)/800/4 | 1.9 |
| K(II)/600/4 used | 2.1 |
| K(II)/800/4 used | 1.8 |
© 2019 by the authors. Licensee MDPI, Basel, Switzerland. This article is an open access article distributed under the terms and conditions of the Creative Commons Attribution (CC BY) license (http://creativecommons.org/licenses/by/4.0/).
Share and Cite
Pacultová, K.; Bílková, T.; Klegova, A.; Karásková, K.; Fridrichová, D.; Jirátová, K.; Kiška, T.; Balabánová, J.; Koštejn, M.; Kotarba, A.; et al. Co-Mn-Al Mixed Oxides Promoted by K for Direct NO Decomposition: Effect of Preparation Parameters. Catalysts 2019, 9, 593. https://doi.org/10.3390/catal9070593
Pacultová K, Bílková T, Klegova A, Karásková K, Fridrichová D, Jirátová K, Kiška T, Balabánová J, Koštejn M, Kotarba A, et al. Co-Mn-Al Mixed Oxides Promoted by K for Direct NO Decomposition: Effect of Preparation Parameters. Catalysts. 2019; 9(7):593. https://doi.org/10.3390/catal9070593
Chicago/Turabian StylePacultová, Kateřina, Tereza Bílková, Anna Klegova, Kateřina Karásková, Dagmar Fridrichová, Květa Jirátová, Tomáš Kiška, Jana Balabánová, Martin Koštejn, Andrzej Kotarba, and et al. 2019. "Co-Mn-Al Mixed Oxides Promoted by K for Direct NO Decomposition: Effect of Preparation Parameters" Catalysts 9, no. 7: 593. https://doi.org/10.3390/catal9070593