Article

Nickel-Copper Oxide Catalysts Deposited on Stainless Steel Meshes by Plasma Jet Sputtering: Comparison with Granular Analogues and Synergistic Effect in VOC Oxidation

1
Institute of Chemical Process Fundamentals of the Czech Academy of Sciences, Rozvojová 135, 165 02 Prague, Czech Republic
2
Institute of Physics of the Czech Academy of Sciences, Na Slovance 2, 182 21 Prague, Czech Republic
3
Faculty of Mathematics and Physics, Charles University, V Holešovičkách 2, 180 00 Prague, Czech Republic
4
Department of Solid State Chemistry, University of Chemistry and Technology, Prague, Technická 5, 166 28 Prague, Czech Republic
5
Central Laboratories, University of Chemistry and Technology, Prague, Technická 5, 166 28 Prague, Czech Republic
*
Author to whom correspondence should be addressed.
Catalysts 2023, 13(3), 595; https://doi.org/10.3390/catal13030595
Submission received: 23 February 2023 / Revised: 10 March 2023 / Accepted: 14 March 2023 / Published: 16 March 2023

Abstract

:
A novel method for the preparation of Ni-Cu oxide catalysts—deposition on stainless steel meshes using hollow cathode plasma jet sputtering—was studied. This method allows the preparation of thin oxide films. Consequently, the whole volume of the active phase is readily accessible for the reactants and can be employed in the catalytic reaction due to the negligible effect of internal diffusion. As a result, the activity of our sputtered catalyst was seven times higher in ethanol oxidation and 61 times higher in toluene oxidation than that of the corresponding granular catalyst. Moreover, due to stainless steel meshes used as a catalyst support, the pressure drop across the catalyst bed was lower. Finally, the catalytic activity of the sputtered Ni-Cu oxide catalyst with Ni:Cu molar ratio of 1:1 in ethanol oxidation was 1.7 times higher than that of the commercial EnviCat® VOC-1544 catalyst, while the amount of the active phase in the catalyst bed was 139 times lower. The outstanding performance of the Ni0.5Cu0.5 catalyst was ascribed to the synergistic effect between the copper and nickel components.

Graphical Abstract

1. Introduction

Transition metal oxides are active in various oxidation reactions, including the total oxidation of volatile organic compounds [1]. Cobalt oxide-based catalysts in combination with Mn oxides are particularly active [2]. However, cobalt compounds are among those materials considered strategic and are therefore expensive. As such, we have attempted to investigate new oxidation catalysts based on nickel oxide in combination with other transition metal oxides, including copper oxides. The Ni-Cu oxide catalysts, both supported and unsupported, are active in several reactions, e.g., in steam reforming of ethanol [3], hydrogenation reaction [4], hydrogen generation from ammonia borane [5], reduction of 4-nitrophenol [6], and in combination with CeO2 as well as in CO oxidation [7].
Our study involves the use of a new method for the preparation of Ni-Cu oxides, specifically their deposition on stainless steel meshes using hollow cathode plasma jet sputtering. This method allows the preparation of thin oxide layers on a support where the effect of internal diffusion does not play a role in catalytic activity [8]. Recently, we have reported the preparation of mixed oxide catalysts using a standard radio frequency planar magnetron sputtering technique [9]. In this work, we used a different approach based on sputtering using a hollow cathode made of the deposited material. The hollow cathode consists of a water-cooled cylindrical tube connected to a high-voltage power supply. In contrast to the planar magnetron, argon was delivered into the vacuum chamber directly through the hollow cathode while oxygen, as the reactive gas, was fed into the chamber by a separated port. When a sufficient cathode voltage is applied, an intense plasma is created at the end of the hollow cathode in the flowing argon and the so-called plasma beam is formed [10].
To determine whether the properties of Ni-Cu oxide catalysts prepared by sputtering differ significantly from those of conventional catalysts prepared by calcination of coprecipitated precursors, we characterized the properties of both types of catalysts with various Ni:Cu molar ratios using powder XRD, adsorption of nitrogen, Raman spectroscopy, XPS, and H2-TPR. Moreover, the examination of catalytic performance of both types of catalysts in the total oxidation of ethanol and toluene was an important part of the present study.

2. Results

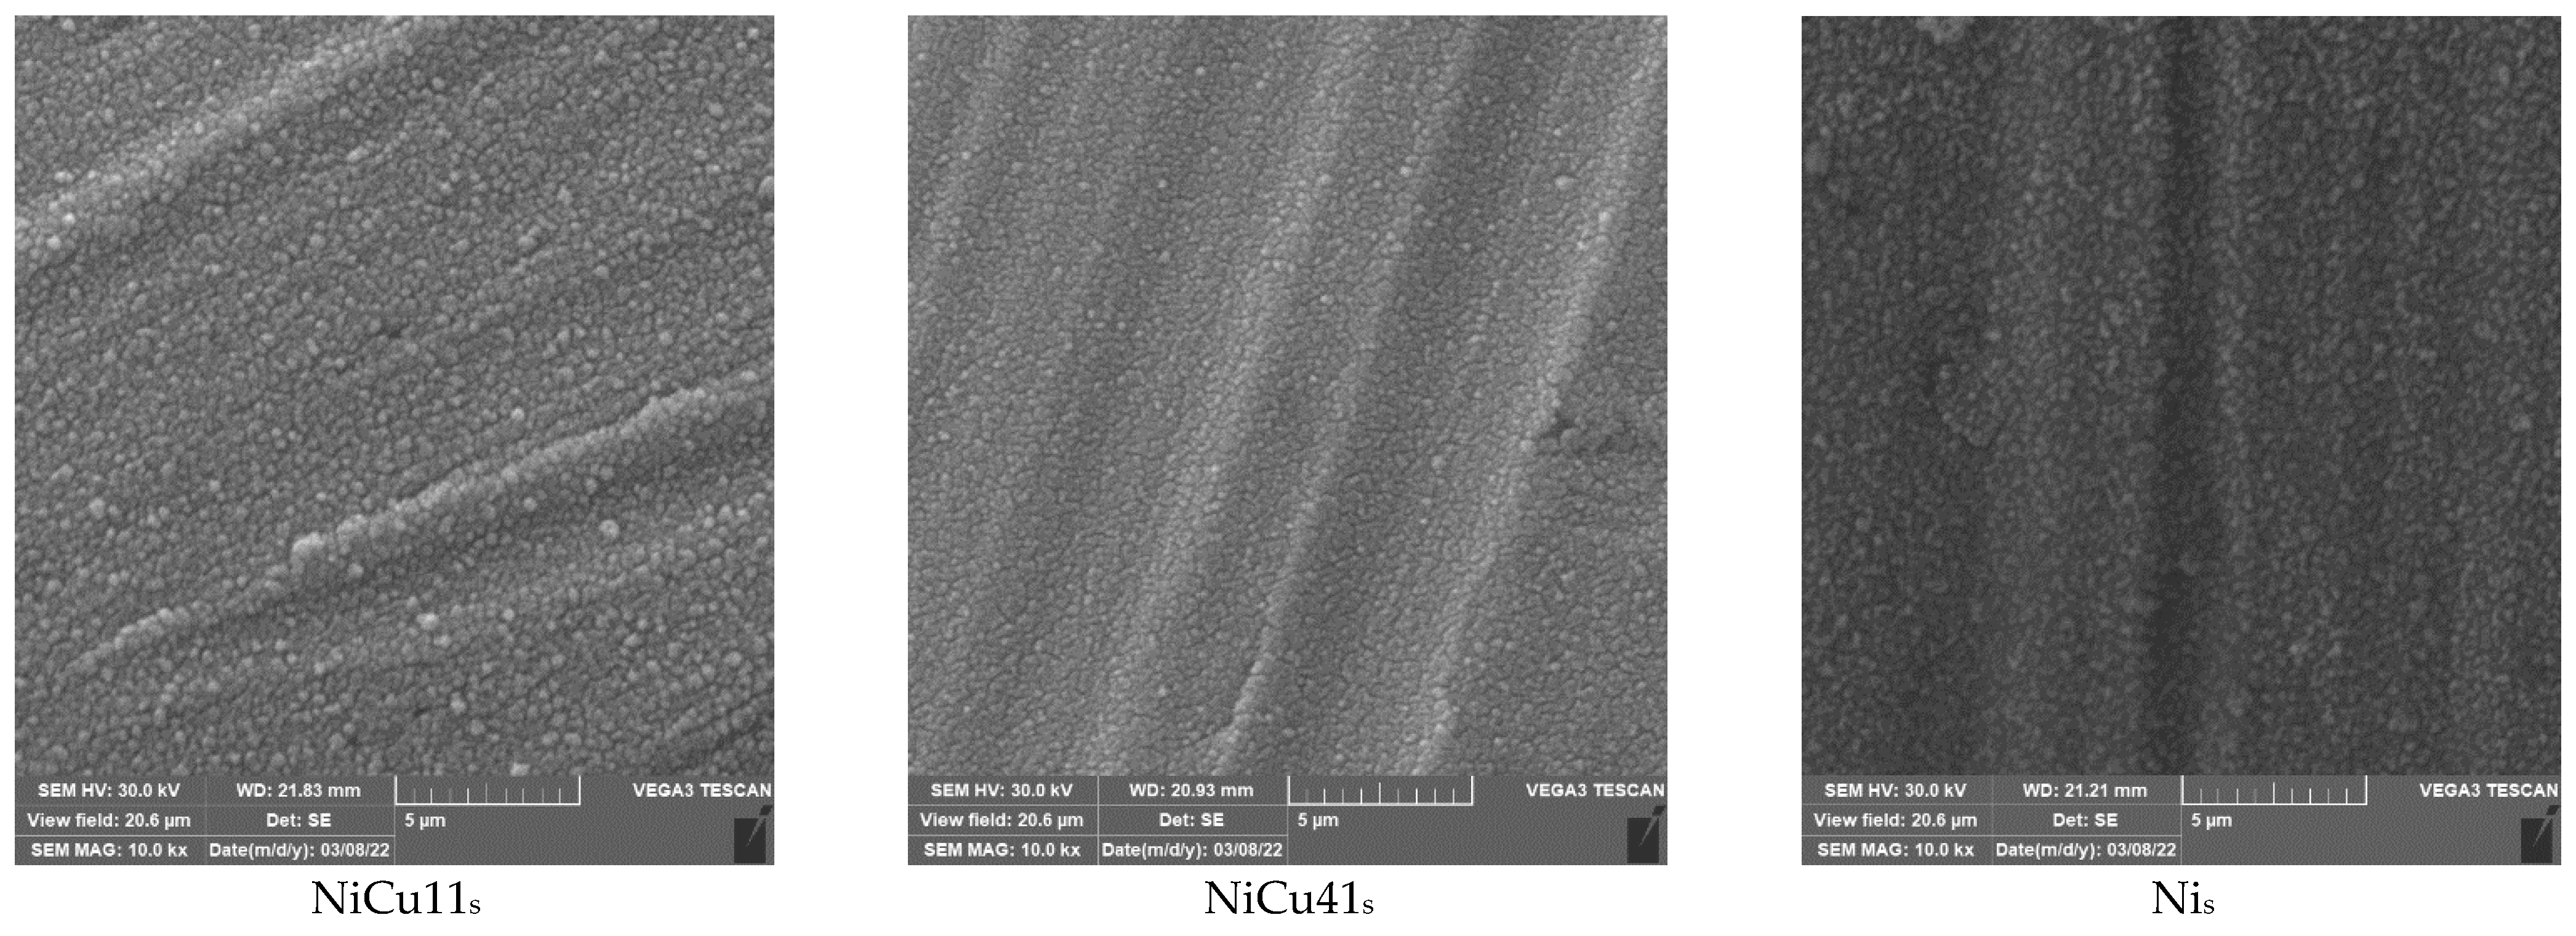
2.1. Composition of the Catalysts

The composition of the granular catalysts was evaluated using atomic absorption spectroscopy. The metal content in the oxides (Table 1) was calculated based on their content in the precursors and weight loss after calcination at 500 °C, assuming that no loss of metal components occurred during calcination. Molar ratios of Ni and Cu cations calculated from the measured data are in a good agreement with nominal values, which were adjusted in nitrate solutions used for synthesis of precursors by coprecipitation. In addition to the main catalytic components, the catalysts contained also small amount of sodium cations, which remained in the prepared products after washing.
Atomic absorption spectroscopy (AAS) could not be used to determine the composition of catalysts prepared by sputtering on the meshes due to issues with the mesh dissolving during the preparation of the sample for the AAS measurement. The issue was the determination of nickel because nickel was one of the primary components of the stainless steel. Moreover, the amount of oxides deposited on the mesh was very low when compared to the total mass of the catalyst. Therefore, the sputtered catalysts were analyzed using energy-dispersive X–ray spectroscopy (Table S1 in Supplementary). Analysis of the stainless steel support showed that the support contained 6.50 at.% Ni and, therefore, the EDX analysis of catalytically active oxide layers had to be corrected accordingly. The Ni/Fe intensity ratio (Kα line) for the mesh was equal to 0.07. Since the Fe in all samples originated from the support, the Ni intensity was reduced by the Fe intensity multiplied by the Ni/Fe mesh intensity ratio (from the pure support). This allowed the approximate Ni correction to be determined as the ratio between the reduced and measured Ni Kα intensities. This correction was made for an approximate and rapid determination of the Ni content in the deposited oxide layer, although it may have led to a reduced accuracy of the determination. Moreover, the EDX analysis of sputtered catalysts was complicated by partial overlapping of the Ni band by the Cu band and by the fact that the values of Ni concentrations had to be corrected relative to its concentration in the bare mesh; concentrations of Ni and Cu were approaching the expected nominal values (Table 2). Nevertheless, some variation in the contents of active metals on the meshes cannot be excluded due to the applied method of catalyst preparation, i.e., plasma sputtering.
The SEM images of the bare mesh and meshes with deposited Ni-Cu oxide layers are shown in Figure 1. The appearance of the particles was similar in all cases: the oxides form analogous clusters of spherical particles, which differ in size. The NiCu14s and NiCu41s catalysts showed the smallest clusters, while the single-component Cus catalyst showed the largest clusters. This finding is understandable, as CuO has the lowest melting temperature (1326 °C); therefore, during calcination at 500 °C, sintering and enlargement of particles may occur. Nickel oxide melts at higher temperature (1955 °C) and, thus, enlargement of the particles may not be so significant.

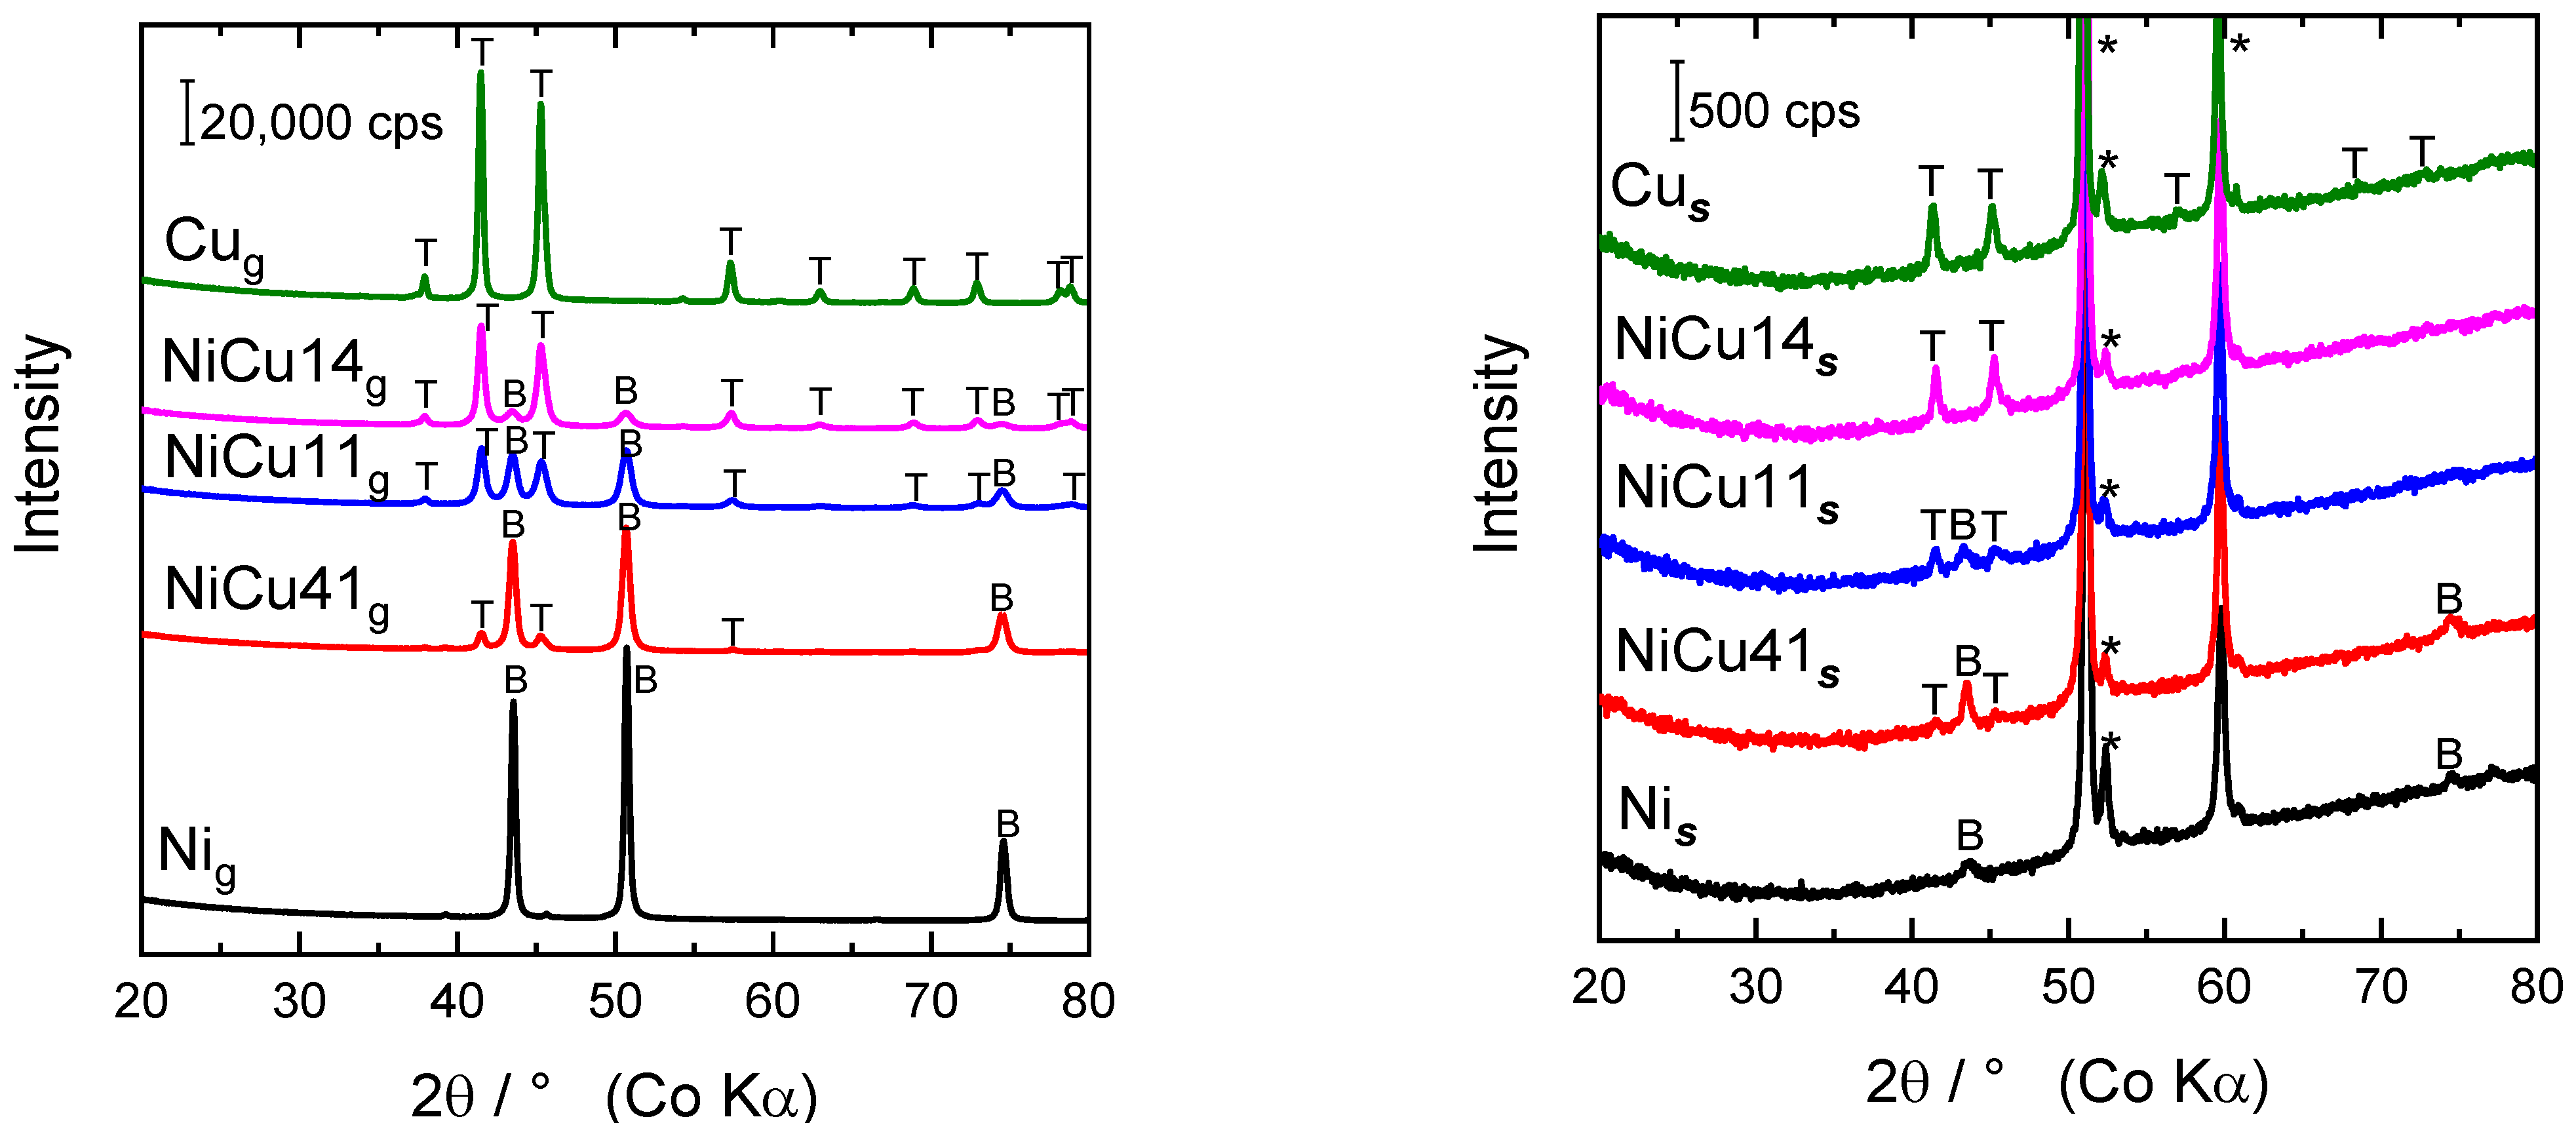
2.2. Powder X-ray Diffraction

Powder XRD patterns of the granular and sputtered catalysts are shown in Figure 2. The Cug catalysts contained monoclinic CuO (tenorite, PDF 04-012-7238), whereas diffraction peaks of cubic NiO (bunsenite, PDF 04-006-6925) were found in the Nig catalyst. The Ni-Cu oxide catalysts with various Ni:Cu molar ratios showed diffractions peaks, which were attributed to both NiO and CuO phases. Therefore, mixtures of NiO and CuO, rather than Ni-Cu mixed oxides, were formed during the calcination of the coprecipitated Ni-Cu precursors. Formation of these phases occurs at temperatures of 400 °C and 500 °C [11]. The presence of NiO and CuO phases agrees with the reports of other authors [12,13,14]. The intensities of diffraction peaks corresponding to NiO and CuO phases changed in accordance with Ni and Cu contents in the catalysts. A slight change in the positions of NiO diffraction lines could be explained by partial substitution of cations. Moreover, Stoyanova et al. [11] reported that the increase in calcination temperature led to a decrease in the content of NiO and CuO and subsequent formation of the spinel structure due to interaction between the oxides.
Powder XRD patterns of the Ni and Cu catalysts sputtered in an oxidizing atmosphere and after subsequent calcination in air showed diffraction peaks of NiO and CuO, respectively, together with intensive diffraction peaks ascribed to the stainless-steel support (Figure 2). When both elements were deposited simultaneously, a mixture of NiO and CuO was formed. The intensities of the diffraction peaks were much smaller than the intensities of the peaks of granular catalysts due to the low concentration of metal oxides on the mesh. Calculated crystallite sizes and lattice parameters of granular and sputtered Ni-Cu oxide catalysts are summarized in Table 3. The lattice parameter of cubic bunsenite was calculated as an average value from all diffraction peaks that do not overlap and have the correct profile fit. The NiO (bunsenite) belongs to space group Fm3m with lattice parameter a of 0.4173 nm [12]. The NiO lattice parameter evaluated from powder XRD pattern of the Ni catalyst was slightly larger (0.4179 nm) and increased with increasing Cu content in the samples. This finding can be explained by partial incorporation of larger Cu2+ cations into NiO lattice (Cu2+ and Ni2+ ionic radii are 0.073 and 0.069 nm, respectively) [12,15]. Consequently, the NiCu14g sample exhibited the largest NiO lattice parameter among the prepared granular Ni-Cu oxide catalysts. The cell refinement procedure was also used to evaluate lattice parameters of monoclinic CuO (tenorite). Slight changes were found but without dependence on the composition of the granular Ni-Cu catalysts (Table 3). The crystallite sizes evaluated from powder XRD data reflected structure ordering of the crystalline phases. Values of integral width (Bobs) were automatically determined using the HighScore Plus software, once powder patterns were exposed to default profile fitting. The further step included calculation of crystallite sizes using the Scherrer equation, considering integral width values of each diffraction peak. Some peaks were overlapped or showed poor profile fit; therefore, such values were omitted. Crystallite sizes of the tenorite phase in the granular Ni-Cu catalysts were between 15.8 and 19.7 nm, whereas the CuO crystallite size evaluated for the Cug catalyst was 33.9 nm. The largest NiO crystallite size was found in the Nig sample (33.1 nm). Considerably smaller NiO crystallite sizes were evaluated for the granular Ni-Cu catalysts, decreasing from 18.5 to 12.1 nm for NiCu41g and NiCu14g samples, respectively.
Evaluation of lattice parameters and crystallite size of the sputtered catalysts was much more difficult due to the few identifiable peaks present. In addition, the stainless-steel support peak (~51.1°) overlies the most intense NiO peak (~50.7°) and the NiO diffraction peaks are essentially not visible in the NiCu14s catalyst. For this reason, the calculated values are affected by a large error. The values summarized in Table 4 are compared with the data of granular catalysts. Some differences can be observed between the two kinds of catalysts: the lattice parameter a of the sputtered NiO is slightly smaller than that in the granular Nis catalyst and the NiO crystallite sizes in the granular Nig and NiCu41g catalysts are considerably larger than those in the analogous sputtered catalysts. Slightly smaller CuO crystallite sizes were found in the sputtered Cu and Ni-Cu catalysts when compared to the granular ones. However, it is necessary to emphasize that the determination of mean coherence lengths in the sputtered catalysts is burdened with a large error.

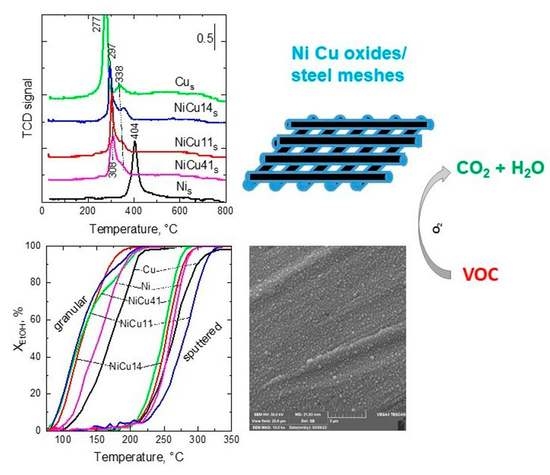
2.3. Temperature-Programmed Reduction

The reduction properties of the catalysts were investigated using H2-temperature programmed reduction. The reduction profiles of the granular and sputtered catalysts are shown in Figure 3. Numerous studies of Ni-Cu mixed oxides reduction using the H2-TPR method were already reported. For example, Fedorov et al. [12], Srivastava et al. [4], and Paryjczak [16] found that reduction profiles of CuO and NiO represent a single peak, and that the temperature of the reduction onset (Tonset) is lower than the reduction temperature of NiO. Based on their experimental data, Srivastava et al. [4] revealed a synergistic effect between copper and nickel oxides, as Tonset of the mixed oxide occurred at a lower temperature than in the case of pure oxides. Yen et al. [5] found that the TPR profiles of bulk CuO and NiO exhibited Tonset at 250 and 270 °C and the maximum reduction rates (reduction peak maxima) for both oxides occurred at 300 and 350 °C, respectively. This finding confirmed the easier reduction of CuO in comparison with NiO. The lower Tonset (approximately 40 °C) of the Cu0.5Ni0.5 mixed oxide compared to both CuO and NiO oxides indicated the presence of an intimate interaction between the metals, which increased the reducibility of both Cu and Ni oxide species.
The TPR profiles of the granular Ni-Cu catalysts reflected different phase compositions (Figure 3). The Cug and Nig catalysts showed broad reduction peaks with maximums at 285 and 366 °C, respectively. An indication of the splitting of both peaks into two parts corresponds to the reduction in two steps (CuO-Cu2O-Cu). In comparison with the TPR profiles of the single-component catalysts, the reduction peaks of the Ni-Cu catalysts were shifted to lower temperatures (223–270 °C). The temperature of the reduction onset (Tonset) was 138–140 °C for all granular Ni-Cu catalysts, while the Cug and Nig catalysts showed the Tonset at 172 and 234 °C, respectively. This indicates a synergistic effect between copper and nickel components in the Ni-Cu catalysts. The reduction peaks did not show major effect of the composition. Hydrogen consumption up to 500 °C during reduction of the Ni-Cu oxides was practically not affected by the Ni:Cu molar ratio as well (Table 4).
The reduction profile of the sputtered Cus catalyst (Figure 3) is rather complex, with a broad reduction feature ranging from 200 °C to 400 °C and a maximum at 277 °C. A small peak also appeared at 338 °C. In this catalyst, the powder XRD revealed the presence of CuO only and, thus, the main reduction peak may be ascribed to the reduction of Cu2+ species to metallic copper. In the literature, different H2-TPR profiles of CuO were reported, consisting of a simple reduction peak [17,18] or two reduction peaks [18,19]. This inconsistency may be ascribed to different CuO particle sizes (dispersed CuO, small crystallites, or bulk CuO), which lead to different Cu2+ and Cu+ reduction temperatures [20]. The Nis catalyst exhibited one reduction peak with a maximum at 404 °C. The peak can be attributed to the reduction of Ni2+ to Ni0. The Ni-Cus catalysts were reduced at lower temperatures when compared to the Nis and Cus samples (Figure 3). The reduction maxima were shifted to lower temperatures with increasing copper content in the catalysts (308, 303, and 297 °C for the NiCu41s, NiCu11s, and NiCu14s catalysts, respectively). The Tonset followed the same trend (226, 205, and 155 °C). In contrast to the granular catalyst, no synergistic effect between the copper and nickel components was observed (Tonset of the Cus catalyst was 114 °C). Finally, compared to the TPR of granular catalysts, the TPR of sputtered catalysts showed narrower peaks, indicating a more uniform particle size.

2.4. Nitrogen Adsorption Measurements

Pore volumes of granular Ni-Cug catalysts varied substantially with their composition (Table 4). The pore volume of the Nig catalyst was 80 mm3 g−1, while pore volume of the Cug catalyst was the lowest among all granular catalysts (15 mm3 g−1). The pore volumes of binary granular Ni-Cu oxides were higher than that of the single-component catalysts. The largest total pore volume was found for the NiCu11g catalyst (180 mm3 g−1). The presence of sodium in the granular catalysts had no significant effect on the values. Similar to the pore volume, the surface area of the catalysts varied according to their composition (from 7 to 33 m2 g−1). The largest surface area was revealed for the NiCu41g catalyst, whereas the single-component catalysts showed the lowest surface area. The surface area of the sputtered catalysts (normalized per gram of metal oxides) was lower than that of their granular analogues and varied from 3 to 18 m2 g−1. It indicates that particles of metal oxides deposited on meshes by plasma jet sputtering may be larger and with minor volume of micropores, which contribute to surface area.

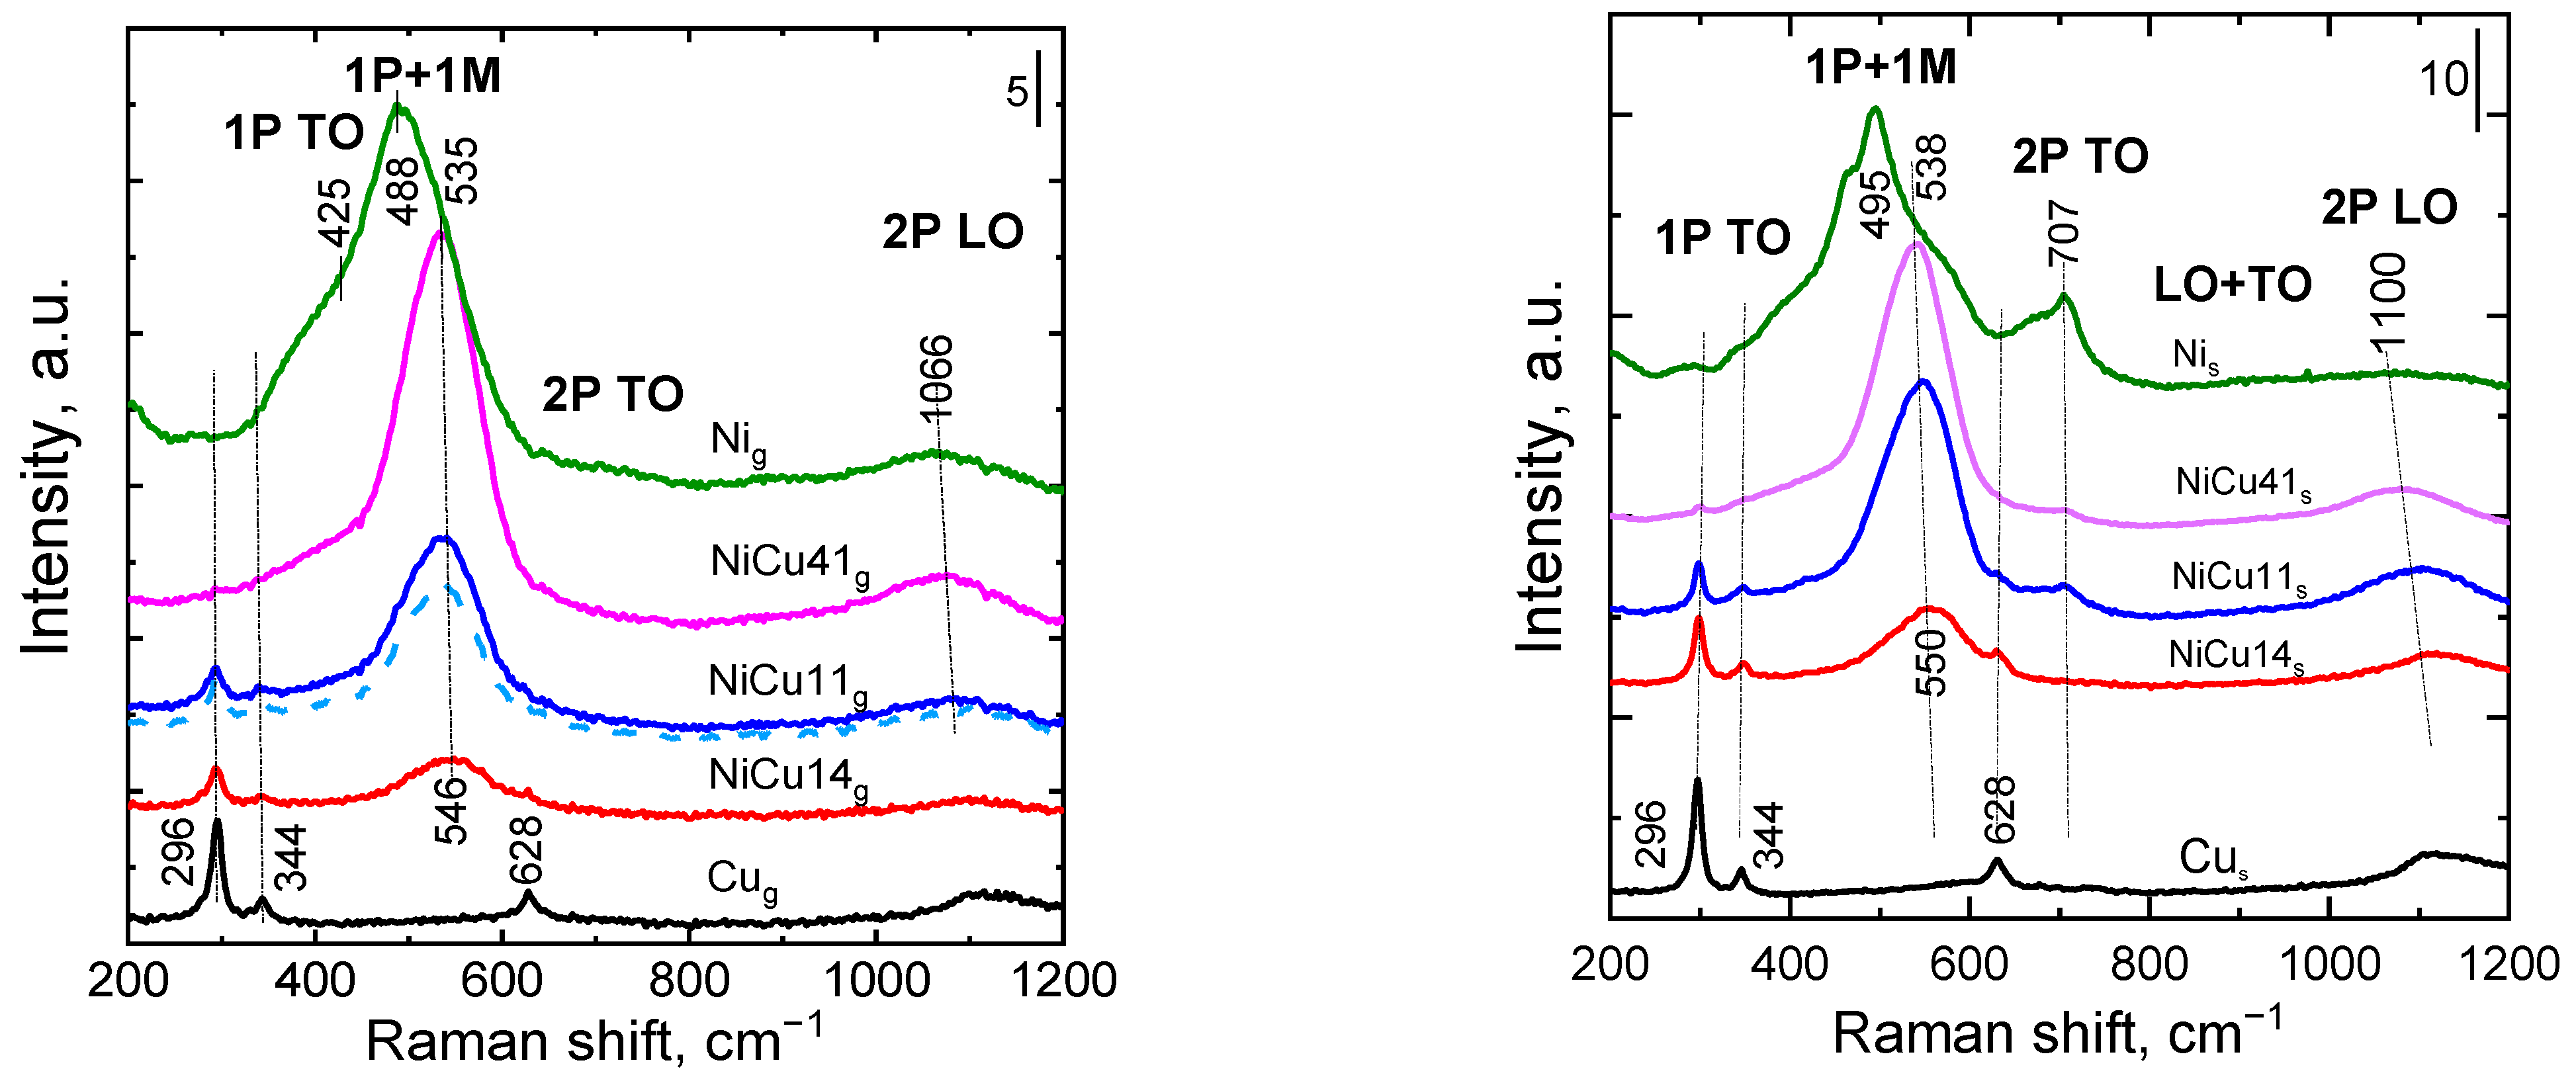
2.5. Raman Spectroscopy

Raman spectra of bulk NiO published in study [21] showed four Raman peaks located around 420, 500, 708 and 1075 cm−1. Peaks at approximately 420 and 500 cm−1 were assigned to first-order transverse optical (1P TO) and longitudinal optical (1P LO) phonon modes of NiO, respectively. Peaks around 708 and 1075 cm−1 were attributed to a combination of 2TO and 2LO [22,23]. Mironova et al. [24] studied the effect of the crystal size of NiO prepared using the radio-frequency plasma synthesis method on peaks positions and shape of Raman spectra. In nanosized NiO powders, they identified contributions from one-phonon (1P TO and LO modes) and two-phonon (2P 2TO, TO + LO, and 2LO modes) excitations at about 570 cm−1, two-phonon 2TO (at ca 730 cm−1), TO + LO (at 906 cm−1), and 2LO (at ca 1090 cm−1) modes. Compared to NiO crystallites, the 1P TO peak became more pronounced in powders due to the presence of defects or surface effects, but the three 2P peaks (2TO, LO + TO, 2LO) appeared to be more broadened, especially the one at 906 cm−1. Changes in NiO Raman spectra with the size of NiO crystallites were also studied in detail [25]. The spectrum was dominated by a broad asymmetric peak at about 500 cm−1; this was attributed to scattering of a one-phonon (TO∼450 cm−1) and a one-magnon (1M) at about 40 cm−1 excited simultaneously in the center of the Brillouin zone [26]. As the size of the crystallites increases, this mode becomes sharper and more intense. The authors [25] observed the TO band splitting when the NiO crystallites size ranged from 30 to 85 nm. On the other hand, the LO band splitting took place at NiO crystallites larger than 85 nm. The authors then observed three main peaks at about 500, 1100 and 1450 cm−1; these were attributed to the 1P + 1M, 2LO, and 2M modes. The other two observed minor peaks at wavenumbers of about 710 and 850 cm−1 were attributed to the 2TO and LO + TO modes.
The Raman spectrum of granular Nig catalyst is shown in Figure 4. The spectrum showed only a broad peak at 488 cm−1 accompanied by a shoulder at 425 cm−1. These peaks correspond to one-phonon (TO∼450 cm−1) and one-magnon (1M) scattering excited simultaneously. The TO and LO peaks of the first-order phonons are absent, indicating a small proportion of crystal defects. The other two possible peaks at about 710 and 850 cm−1, which are attributed to 2TO and LO + TO modes, were negligible. The most intense Raman peak of granular Cug catalyst was observed at 296 cm−1; this was accompanied by peaks at 344 and 628 cm−1. In the literature [27], bulk CuO showed a Raman peak at 295 cm−1 and two peaks at 343 cm−1 and 629 cm−1. The authors observed a distinct shift to lower wavenumbers with a broadening effect for CuO nanomaterials prepared hydrothermally. Similar peaks were observed in the Raman spectrum of electrodeposited CuO layer [28]. The authors [29,30,31] found the peaks between 109 and 619 cm−1 corresponding to copper oxide such as Cu2O (109, 140 and 214 cm−1) and CuO (290, 339 and 619 cm−1). Spectra of granular Ni-Cu catalysts slightly changed with the increasing content of Ni in the catalysts; the intensity of the strongest CuO peak at 296 cm−1 decreased with decreasing Cu content in the catalysts. The Raman spectra of the Ni-Cu catalysts showed a superposition of the individual oxide peaks depending on the different contents of nickel and copper cations in the catalysts (Figure 4). A shift in the position of the Raman peak found for NiO at 488 to 535 cm−1 and in the position of the peak of CuO cannot clearly prove the formation of a mixed oxide, as the Raman peaks’ positions depend on the shape and size of crystallites [24].
The Raman spectra of the sputtered catalysts are shown in Figure 4. The spectra are generally similar to those observed for the granular catalysts. The only exception is the spectrum of the sputtered Nis catalyst. To uncover the cause of this behavior, samples with various amounts of nickel oxide were prepared and measured at two or three different places of the sample surface (Figure 5). Their Raman spectra showed different peaks depending on the amount of NiO deposited. The low amount of NiO in the sample (0.007 wt.%) manifested itself in very broad peak, spreading out from approximately 400 to 800 cm−1 and centered around 570 cm−1. The peak included several smaller features at about 500, 570, 672, and 704 cm−1, indicating the presence of TO + LO modes. The second most visible peak, appearing at 1329 cm−1, was attributed to two magnon (2M) excitation. The increase in the peak’s intensity indicated larger crystallites of NiO [25]. A great difference in the intensity of the peak in three different places of measurement indicated heterogeneity of particles deposited by plasma jet sputtering. When the amount of NiO in the sample increased to 0.026 wt.%, the differences observed in the spectra decreased and became negligible. The Raman spectra of sputtered Ni-Cus and Cus catalysts (Figure 4) showed very similar patterns to those found for the granular catalysts, except for the presence of a band at ca. 707 cm−1. Similar to the granular catalysts, increasing amount of NiO in the catalysts led to the formation of a main peak with a maximum between 550 and 538 cm−1. The Nis catalyst showed similar bands to the granular Nig catalyst, but a new peak appeared at 707 cm−1 and the 2P LO peak at 1100 cm−1 disappeared. In contrast, the intensity of the peaks typical for CuO decreased with increasing NiO amount in the catalyst. Compared to granular catalysts, the catalysts prepared by plasma jet sputtering exhibit a partially different structure manifested by the presence of the band at 707 cm−1.

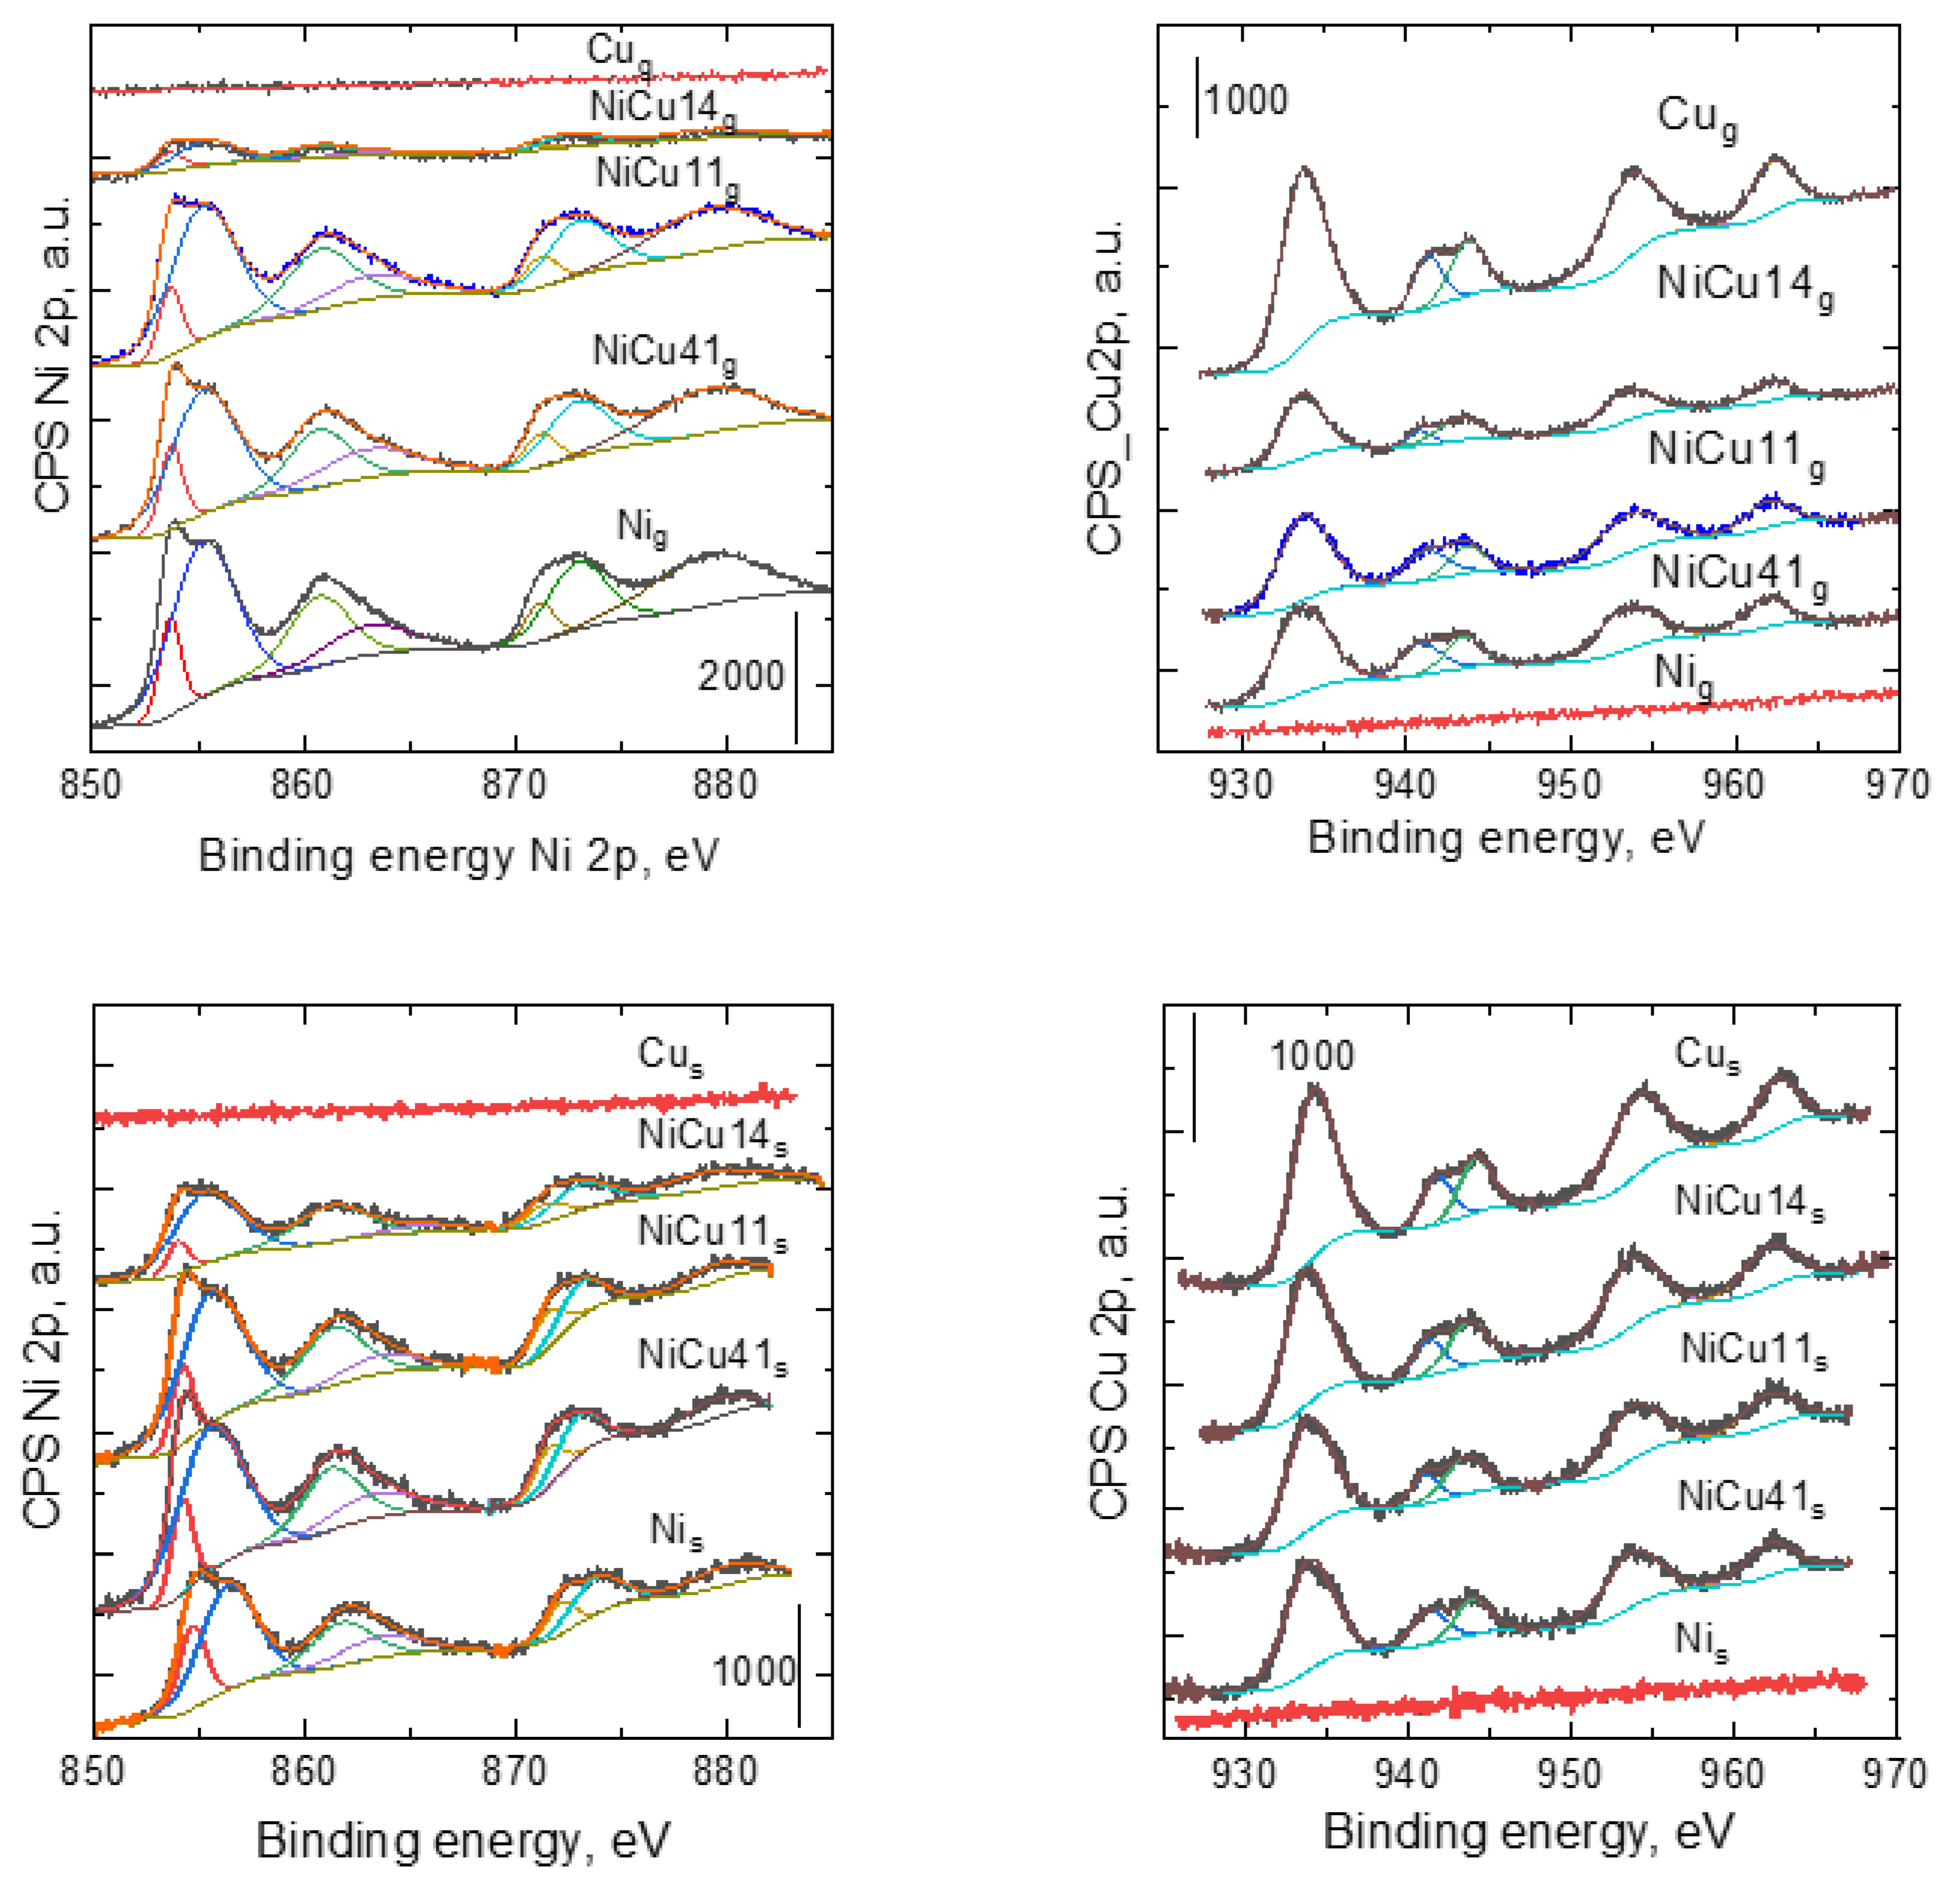
2.6. X-ray Photoelectron Spectroscopy

Binding energies of Ni and Cu in the granular catalysts were observed at 853.7 eV (main line for Ni 2p3/2) and at 933.6–933.8 eV (main line for Cu 2p3/2); these are typical values for the oxidation states of Ni2+ and Cu2+. A large excess of carbon originating from the carbon tape, especially for sputtered catalysts supported on meshes, and adventitious carbon from air was observed during the measurements. Binding energies of about 287 and 288 eV were observed in the carbon spectrum; these are usually assigned to C-O and C=O bonds. Because the carbon spectrum on the sputtered catalyst surface may be shifted slightly differently than on the carbon tape, small peaks at 283.2 eV may appear in the spectrum. This fact is probably the reason for a slight shift in binding energy for the Cus catalyst (by about 0.3 eV). The binding energy of Ni 2p for the Nig catalyst is shifted to higher values compared to the published values of NiO. With increasing Cu concentration in the catalysts, the Ni peaks shifted to lower binding energies, but still have higher energies than reported in the literature [32] for NiO (853.7 eV). This may indicate a presence of Ni hydroxide on the surface of the catalysts with higher Ni content as the Ni hydroxide peak is present at higher energy than the Ni oxide peak (around 854.6 eV). However, the spectra have a shape corresponding to NiO. Therefore, the difference is probably caused by the formation of OH groups on the surface of the catalysts after exposing the samples to air.
The surface concentrations of all elements in granular catalysts are shown in Table 5, together with the ratios of Ni and Cu surface and bulk concentrations. Comparison of these quantities with bulk analysis (AAS) shows that the surface of the catalysts is enriched with Ni. A twofold increase in surface nickel concentration Ni/(Ni + Cu) (relative to total nickel and copper) was found when compared to the bulk value for the NiCu14g catalyst (expressed as a XPS/AAS ratio). This ratio decreased with increasing nickel concentration in the catalyst.
In contrast to granular catalysts, an opposite trend of the ratio of Ni and Cu concentrations on the surface and in the bulk was evaluated for sputtered catalysts. For the NiCu41s catalyst, a fourfold increase in the surface nickel concentration relative to the total nickel and copper content Ni/(Ni + Cu) was found when compared to the bulk value expressed as a XPS/EDX ratio. This ratio decreased with decreasing nickel concentration in the catalyst (Table 5).
Deconvolution of the spectra of Ni 2p of granular catalysts (Figure 6, top left) and sputtered catalysts (Figure 6, top right) showed that there is no difference among the spectra (except for intensity) and that they all correspond to NiO. The structure of Ni 2p3/2, which is fitted by two nearby peaks and a satellite contribution (formed by two peaks, one of which is dominant), confirms the presence of NiO. The determined NiO position, 853.7eV, is consistent with the data reported in the literature [32]. The observed position of the most intense Cu 2p3/2 line corresponds best to the position of CuO, which is given as 933.6–933.8 eV. The structure of the satellite peaks observed at 940 and 943 eV confirms the presence of CuO. The oxidation state of copper is the same for all catalysts and does not change with a change in catalyst composition for both granular (Figure 6, bottom left) and sputtered catalysts (Figure 6, bottom right).
The position and shape of the main Cu 2p3/2 line and satellite structure best resembles that of CuO. However, for NiCu11s and NiCu41s catalysts, a slight shoulder at 935 eV could be seen. It could be explained by the formation of hydroxide at the surface of the catalyst. In addition, it is hard to distinguish between NiO and NiFe2O4, so the incorporation of Cu into NiCuOx cannot be ruled out; however, no solid spectra library was found for this mixed oxide material. For this reason, LMM spectra were also measured (Figure S3 in Supplementary) because they are usually more sensitive to changes in the oxidation state of elements and their bonding. Unfortunately, the Cu LMMb overlaps with the Ni LMMa. Even so, the Cu LMM shape remained visible. With the NiCu41s catalyst, the Cu LMM spectrum appeared to be slightly altered in the region of 915 eV (Table S2 in Supplementary). Based on the interlacing and constraints of the parameters in the Ni LMMa and Cu LMMb region, it can be concluded that the shape and peak ratios remain unchanged and, therefore, there are no significant changes in the oxidation state of Ni and Cu due to changing catalyst composition for all catalysts, either granular or sputtered.
Deconvolution of oxygen spectra of granular and sputtered catalysts showed three principal peaks (Table 6, Figure S2 in Supplementary). Some of the oxygen may originate from the carbon tape and from the trapped carbonaceous impurities (adventitious carbon). The oxygen at 529.6 eV corresponds to metal oxide and the oxygen at 531 eV corresponds to C=O bonds or to oxygen bonded to metal as O or OH. The third oxygen at 533 eV could correspond to C-O bonds. There was no visible trend in oxygen concentration with composition of the catalysts. Roughly speaking, the absolute oxygen concentration at 529.6 eV approximately corresponds to the sum of Cu and Ni concentrations. The rest of the oxygen is bound to the large amount of carbon (Table 6).

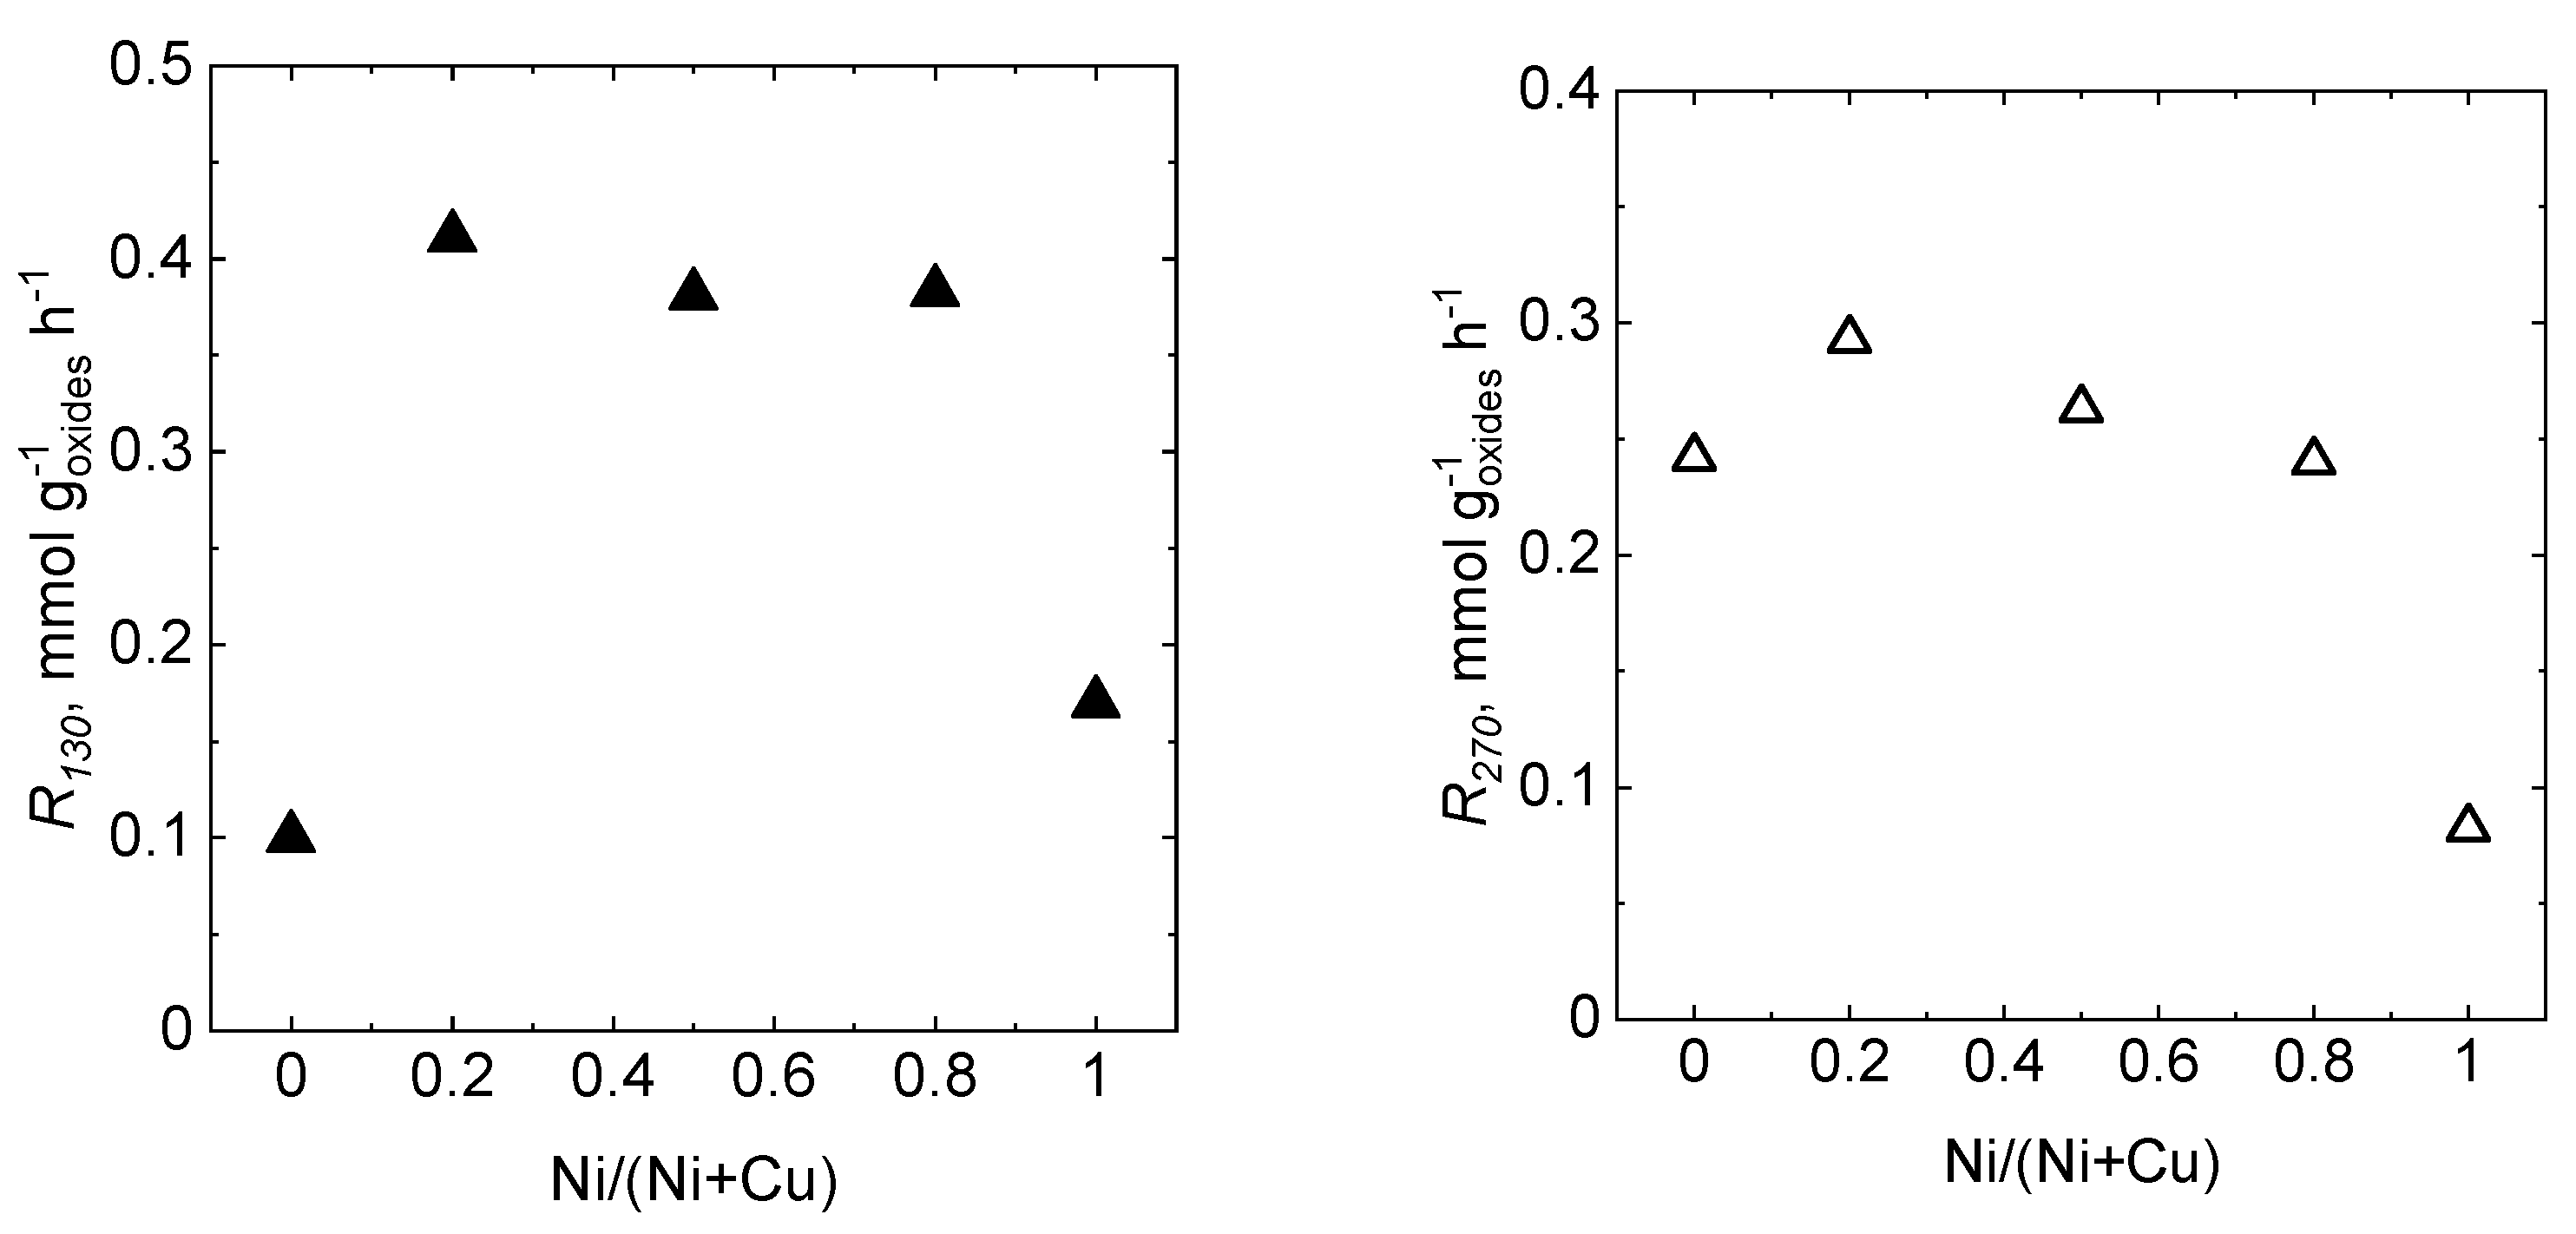
2.7. Catalytic Performance

The light-off curves of ethanol and toluene oxidation over granular and sputtered catalysts are shown in Figure 7. The T50 values for the oxidation of ethanol and toluene as a function of the Ni/(Ni + Cu) molar ratio are summarized in Table 7. The oxidation of toluene was more difficult than the oxidation of ethanol as the temperatures required to achieve the 50% conversion of toluene are approximately 100 °C higher.
Selectivity of the oxidation reaction may be even more important than the activity as some oxidation by-products may be more detrimental than the original compound [33]. The main reaction by-products obtained during ethanol oxidation were acetaldehyde and carbon monoxide; in the oxidation of toluene, carbon monoxide was primarily observed. However, the aim of the reaction is the elimination of the volatile organic compounds by total oxidation to carbon dioxide and water. Thus, the T90CO2 temperature, describing the temperature required to achieve 90% conversion of reactants to CO2, is an important parameter when evaluating the performance of catalysts designed for VOC total oxidation. The results obtained for granular and sputtered catalysts with different Ni-Cu molar ratios are shown in Table 7. In order to assess the catalytic activity of the catalysts more precisely, the specific reaction rates RT (i.e., the amount of ethanol or toluene in milimoles converted per gram of oxides and hour at selected reaction temperature T) were calculated (Table 7).

3. Discussion

As mentioned above, the physicochemical properties of the active components in the granular and sputtered catalysts differed in some cases. For example, the behavior during temperature-programmed reduction showed that the average particle size was larger for the sputtered catalysts than for the granular catalysts. The effect of the particle size of the active phase on catalytic performance has been already demonstrated [34]. For sputtered catalysts, the reduction peaks were sharper with a higher maximum than they were for granular catalysts; the reduction peak temperatures were also shifted to higher values (Figure 3). The difference in Tmax values was greater for catalysts containing more nickel. This can be ascribed to the lower reduction temperature of NiO via hydrogen spillover from Cu, which produces more Ni atoms available for incorporation into the Cu phase [35]. However, for the sputtered catalysts with higher Cu content, a new reduction peak appeared at 300 °C; this new peak was positioned around 340 °C, i.e., at a lower temperature than the reduction peak of the Nis catalyst. Nevertheless, no such peak was observed for the granular catalysts. It is possible that the preparation of sputtered catalysts resulted in the formation of larger copper oxide particles that were reduced at higher temperatures. This assumption is supported by lower surface area values, which were about one-third for sputtered catalysts compared to granular catalysts (Table 5). The assumption of the presence of larger particles for sputtered catalysts than for granular catalysts is also supported by the Raman spectra (Figure 4). Compared to the spectra of granular catalysts, the presence of a new band around 707 cm−1 was detected for sputtered catalysts; this was attributed to larger particles [25].
The XPS measurements showed the presence of CuO and NiO on the catalyst surface for both types of catalysts. However, a difference in the Ni concentration on the surface and in the bulk of the catalysts was found. In the case of granular catalysts, the concentration of active components on the surface and in the volume varied more. For example, the concentration of Ni on the surface was two times higher than in the bulk for the NiCu14g catalyst, while it was four times higher for the sputtered NiCu41s catalyst. We have demonstrated earlier, for the Co-Mn oxide catalysts, that the catalytic activity in VOC oxidation correlated with the proportion of surface oxygen vacancies determined by XPS [2]; however, this was not the case for the Ni-Cu catalysts in the present study.
Figure 8 shows the catalytic activity of the granular catalysts in the oxidation ethanol and toluene in terms of specific reaction rates. In both cases, the activity of single-component Nig and Cug catalysts is the lowest and those of binary Ni-Cu catalysts are substantially higher. Very likely, a synergistic effect between copper and nickel components was observed in the Ni-Cu catalysts. The reason for the different activity of single-component Ni and Cu catalysts in the ethanol and toluene oxidation may be in different reaction mechanisms. In the case of toluene oxidation, dehydrogenation-hydrogenation centers are involved; meanwhile, in the case of ethanol, acid-base centers play a role in addition to dehydrogenation-hydrogenation centers.
In the case of the sputtered Ni-Cu catalysts, the synergistic effect between copper and nickel components was confirmed for both ethanol and toluene oxidation (Figure 9). The SEM image of the NiCu11s catalyst (Figure 1), the most active among the sputtered catalysts, likely shows a nickel oxide layer well decorated by Cu species – supposedly the catalytically active nanoclusters. The combination of Ni and Cu species (Cu or CuyOx) could thus be the reason for a higher activity of this catalyst. The synergistic effect in the Ni-Cu catalysts was already observed earlier [36]. It was also reported that the addition of Cu to Ni increases the number of active sites [37]. Furthermore, in situ XANES and EXAFS studies have indicated that, in bimetallic catalysts, both metal oxides reduce quickly and can be easily reoxidized, which points to a Mars–van Krevelen reaction mechanism [38].
In a commercial catalytic reactor, it is not possible to use catalyst particles as small as those used in the above-discussed catalytic tests (0.160–0.315 mm) due to the large pressure drop. Therefore, we pelletized the coprecipitated NiCu11 precursor into pellets 4 × 3 mm, calcined them at 500 °C, and investigated their activity in ethanol and toluene oxidation. Temperatures T50 obtained for granular, sputtered, and pelletized NiCu11 catalysts and corresponding catalytic activities are presented in Table 8. In ethanol oxidation, the catalytic activity of the granular NiCu11g catalyst was slightly higher than that of the pelletized NiCu11pel catalyst (0.35 vs. 0.31 mmol goxides−1 h−1); this is very likely due to a negligible effect of internal diffusion of the reactants in the particles of sizes 0.160–0.315 mm. On the other hand, in toluene oxidation, the catalytic activity of the granular catalysts was slightly lower than that of the pelletized catalyst (0.26 vs. 0.36 mmol goxides−1 h−1), probably because of heat evolved during the oxidation reaction in the catalyst pellets (which is about two times higher than in the oxidation of ethanol).
The specific catalytic activity of the sputtered catalyst is much higher than that of the pelletized one in both ethanol (6.02 vs. 0.87 mmol goxides−1 h−1) and toluene oxidation (36.3 vs. 0.60 mmol goxides−1 h−1). This can be explained by the fact that the thin film of the catalytically active oxide is easily accessible in the sputtered catalysts while diffusion constraints are present in the pelletized catalyst. In ethanol oxidation, the sputtered catalyst was about seven times more active than the pelletized catalyst; in toluene oxidation, it was about 61 times more active. This difference can be ascribed to slower diffusion of toluene molecules inside catalyst pellets when compared to ethanol molecules. Similar results were obtained in ethanol oxidation over pelletized and sputtered cobalt oxide catalysts, where the latter was 18 times more active [39].
An important parameter for the industrial application of the catalysts is the amount of active phase in the catalyst bed, especially when considering rather expensive transition metal components. We previously reported the performance of the EnviCat® VOC-1544 commercial catalyst [40]. In ethanol oxidation over this catalyst (1000 ppm at the GHSV of 71 L gcat −1 h−1), 87.5 % conversion was reached at 200 °C. Thus, its catalytic activity R200 was 3.5 mmol goxides−1 h−1. On the other hand, our NiCu11s catalyst exhibited the R200 of 6.0 mmol goxides−1 h−1. Moreover, the amount of active phase in the catalyst bed was much lower (0.01 g) than in the case of the EnviCat® VOC-1544 catalyst (1.39 g).

4. Experimental

4.1. Preparation of Catalysts

4.1.1. Granular Ni-Cu Oxide Catalysts

The catalysts were obtained from precursors prepared by coprecipitation. The appropriate amounts of Ni(NO3)2∙6H2O and Cu(NO3)2∙3H2O (both p. a., Sigma-Aldrich, Prague, Czech Republic) were dissolved in distilled water to obtain aqueous solutions with desired molar ratios of metal cations and total cations concentration of 1.0 mol L−1. The prepared aqueous solution (450 mL) was added with the flow rate of 7.5 mL min−1 to a stirred batch reactor containing 200 mL of distilled water. The pH in the reactor was maintained at 10.0 ± 0.1 by controlled simultaneous adding of basic solution (3 M NaOH and 0.5 M Na2CO3). The reaction was carried out under vigorous stirring at room temperature. The resulting suspension was stirred 60 min at room temperature, the product was then filtered off, thoroughly washed with distilled water, and dried at 60 °C overnight. The dried and powdered products were calcined for 4 h at 500 °C in static air. After cooling, the products were crushed and sieved to obtain a fraction with a particle size of 0.160–0.315 mm, which was then used in catalytic measurements. The binary Ni-Cu oxide catalysts with Ni:Cu molar ratios of 1:4, 1:1, and 4:1 were denoted as NiCu14g, NiCu11g, and NiCu41g, respectively. The single-component nickel and copper oxide catalysts were prepared in the same way and denoted as Nig and Cug, respectively. The NiCu11g catalyst was also prepared in the form of pellets (4 × 3 mm) by pelletizing of the dried product. The catalyst was labeled as NiCu11g,pel.

4.1.2. Sputtered Ni-Cu Oxide Catalysts

A cylindrical-shape high vacuum chamber was pumped down by a combination of rotary, roots, and turbo-molecular pumps with typical base pressure of less than 10−3 Pa. The plasma jet was mounted on the chamber in the sputter-down configuration. Since different molar ratios of Ni and Cu in the prepared thin films are required, hollow cathodes of different composition were employed. The hollow cathodes with an outer and inner diameter 12 mm and 5 mm and a length 60 mm made of Ni, Cu, and Cu:Ni alloys (80:20, 50:50, 20:80) with purity 99.95% (Kurt J. Lesker, Jefferson Hills, PA, USA) were used. The hollow cathodes were fixed in the water-cooled copper block connected to the direct-current (DC) power supply. Circular stainless steel (71 wt. % Fe, 16 wt. % Cr, 11 wt. % Ni, 2 wt. % Mn) meshes (mesh size 0.40 mm, wire diameter 0.22 mm) with an outer diameter of 25 mm were used as supports. Before the deposition process, the meshes were cleaned with detergent and then thoroughly washed in distilled water. The cleaning process was finished by degreasing in acetone for 10 min in an ultrasonic bath followed by ethanol and distilled water rinsing. Ten meshes were placed into the vacuum chamber onto the electrically grounded cylindrical rotating substrate holder, which allowed depositing all ten samples under the same process conditions. The distance between the hollow cathode outlet and a mesh was 100 mm. The meshes were not heated and their temperature during the deposition process was below 60 °C. Dvořáková et al. showed that a thin metal oxide layer sputtered at low pressure (about 2 Pa) below and above the functional layer (characterized by poor adhesion to the mesh) can improve the overall adhesion of the multilayer structure to the stainless-steel mesh [41]. Our observations proved that thin film deposited at elevated pressure (80 Pa) demonstrated poor adhesion, while thin film deposited at the lowest pressure (2 Pa) demonstrated excellent adhesion to the stainless-steel substrate. Therefore, this concept was chosen also for the deposition of Cu-Ni oxide catalyst by the plasma jet (Figure 10).
The first and third thin film was deposited at pressure 2 Pa for the same deposition time, while the second layer was deposited at the elevated pressure (80 Pa or 30 Pa). Since the sputtering yield of each hollow cathode material is different, the deposition time was experimentally chosen so that the mass of additions on the prepared catalysts was approximately the same. The deposition process for each hollow cathode composition was calibrated before the active phase was deposited on meshes. Calibration means that, for particular pressure and power delivered into a discharge, we deposited thin film for certain time and then the prepared thin film was weighted. Since the mass of deposited thin film of the sputtering process linearly increases with time (if depositing conditions are kept constant), the calibration process determined the time necessary for deposition of the catalyst with required mass. Finally, the dose of the catalyst was controlled only by the duration of the sputtering process. Details of deposition conditions can be seen in Table 9. The mass flow rate of argon through the hollow cathode was 200 sccm and oxygen was supplied to the reactor by a separated port with the mass flow rate 150 sccm for all the experiments. The coating process was repeated on both sides of the meshes to ensure even coverage. After deposition, the coated meshes were calcined in air at 500 °C for 4 h. The prepared catalysts differed in molar ratios of both components and were labeled as Cus, NiCu14s, NiCu11s, NiCu41s, and Nis (numbers denotes intended molar composition of Ni and Cu).

4.2. Catalyst Characterization

Content of the metals in granular catalysts was determined by atomic absorption spectroscopy (AAS, Agilent Technologies, Santa Clara, CA, USA) after the dissolution of a sample in HCl. Ni and Cu contents in the sputtered catalysts were determined using energy-dispersive X–ray spectroscopy (EDX, Quantax 200, Bruker, Billerica, MA, USA).
Surface morphology of the mixed oxides particles deposited on the stainless-steel supports was observed using a Tescan Fera 3 (Tescan, Brno, Czech Republic scanning electron microscope.
Powder X-ray diffraction (XRD) patterns were measured using a AXS D8 diffractometer (Bruker, Billerica, MA, USA) with Co Ka radiation (λ = 0.179 nm) in 2θ range 20–80°, step size 0.02°. The qualitative analysis was performed using HighScore Plus software, version 4.8 (PANalytical). The lattice parameters were obtained from cell refinement of the attributed phase after default line profile fitting in HighScore Plus 4.8 software package (PANanalytical). The full width in half-maximum (FWHM) values and crystallite sizes were evaluated using the same software. The crystallite sizes were calculated as a mean coherence length in (311) direction (the most intense diffraction line of cubic spinel), unless specified differently. The mean coherence lengths (considered as approximate crystallite sizes) were evaluated using the Scherrer equation.
Surface area of the granular catalysts was determined from the nitrogen adsorption-desorption isotherms at 77 K using Micromeritics Tristar II surface areas and porosity apparatus (Micromeritics, Norcross, GA, USA). Surface area SBET was calculated using the BET method. Pore size and volume distribution was calculated via the BJH method. The samples (~200 mg) were outgassed in vacuum at 150 °C prior to data collection. The surface area of the sputtered catalysts was determined from the adsorption isotherms of physisorbed krypton at 77 K using the ASAP 2020 apparatus (Micromeritics, Norcross, GA, USA), employing a specially designed stainless steel vessel for measurements of bulky catalysts [42] enabling measurements of surfaces of large samples (<30 mm). The samples were outgassed in vacuum at 150 °C prior to data collection.
Raman spectra were measured using a DXR Microscope dispersive Raman spectrometer (Thermo Scientific, Brno, Czech Republic) equipped with an Olympus confocal microscope and a thermoelectrically cooled CCD detector. A solid-state Nd:YAG laser (wavelength 532 nm, maximum power 10 mW, Thermo Scientific, Brno, Czech Republic)) was used as excitation source. A 900 lines/mm grating, 50× magnification objective, laser power of 0.3 mW, acquisition time of 30 s per scan, and 40 repetitions were used to collect the spectra.
H2–TPR with a TCD detector was performed using 0.05 g of granular sample, 10 mol. % H2 in nitrogen, and a temperature ramp of 20 °C min−1. Reduction of the granular CuO (0.160–0.315 mm) was used to calculate absolute values of hydrogen consumed during catalyst reduction. H2–TPR measurements of sputtered catalysts were carried out in the same apparatus under the same conditions as those used for the measurements of granular catalysts. Prior to the measurements, the meshes were cut to small particles (approximately 1 × 1 mm).
Surface elemental analyses were performed using an ESCA 3400 X-ray photoelectron spectrometer (Kratos, Manchester, UK) furnished with a polychromatic Mg X-ray source of Mg Kα radiation (energy: 1253.4 eV). The base pressure during the measurement was around 5.0 × 10⁻⁷ Pa. The Ni, Cu, O, Na, and C elements were detected. The samples were placed on a carbon tape. Shirley background was subtracted, and elemental compositions of the layers were calculated from the areas corresponding to Ni 2p, Cu 2p, O 1s, Na 1s, and C 1s lines. All spectra were corrected by shifting the main carbon C 1s peak to 284.8 eV.

4.3. Catalytic Experiments

Granular oxide catalysts were tested in a fixed–bed reactor with an internal diameter of 5 mm, while eight meshes with deposited oxides were placed in a fixed–bed reactor with an internal diameter of 25 mm. The catalytic tests in total oxidation of ethanol were performed with 760 ppm of ethanol and those in total oxidation of toluene with 780 ppm of toluene in air at the GHSV of 21 L gcat−1 h−1 using the temperature ramp of 2 °C min−1. The composition of the reaction mixture was analyzed using the Agilent 8890 gas chromatograph coupled with a mass spectrometer. The T50 temperature, at which 50% of ethanol or toluene conversion was achieved, was used to compare the performance of the catalysts. Catalytic activity was evaluated as the specific reaction rate RT, i.e., the amount of ethanol or toluene in milimoles converted per gram of oxides and hour at selected reaction temperature T. In order to avoid the influence of heat and mass transfer limitations, the specific reaction rates were calculated at low conversions for every catalyst. The T90(CO2) temperature, at which 90% conversion to CO2 was achieved, was employed to compare the effectiveness of the catalysts. The pelletized NiCu11g,pel catalyst (pellets 4 × 3 mm, 10 mL of the pellets) was tested in the same reactor and under the same reaction conditions as the sputtered catalysts for comparison.

5. Conclusions

Hollow cathode plasma jet sputtering was employed as a novel method for the preparation of thin-layer Ni, Cu, and Ni-Cu oxide catalysts supported on stainless steel meshes. For comparison, their granular analogues were prepared from coprecipitated precursors. Both types of catalysts were thoroughly characterized and tested in the total oxidation of model volatile organic compounds (ethanol and toluene).
Powder XRD and Raman spectroscopy revealed the formation of NiO and CuO mixtures rather than Ni-Cu mixed oxides; however, partial incorporation of larger Cu2+ cations into the NiO lattice cannot be excluded due to a slight increase in the NiO lattice parameter with increasing Cu content in the granular as well as sputtered catalysts. Consequently, the H2-TPR experiments showed a synergistic effect between copper and nickel components in the granular Ni-Cu catalysts; this was not very obvious in the sputtered catalysts. The XPS analysis showed that the surface of the catalysts was enriched with Ni (up to two times compared to the bulk value for granular catalysts and up to four times for sputtered catalysts).
In the catalytic experiments, a synergistic effect between the copper and nickel components was revealed for all granular Ni-Cu catalysts. For the sputtered catalysts, the improvement in catalytic activity due to the synergistic effect was less pronounced and was the most intensive for the NiCu11s catalyst. For both types of catalysts, the synergistic effect was more pronounced in the oxidation of ethanol, which was generally easier to oxidize than toluene.
In order to reveal the effect of mass transfer limitations, the NiCu11pel catalyst was shaped into pellets, which would be necessary for industrial-scale application. The activity of the sputtered NiCu11s catalyst was seven times higher in ethanol oxidation and 61 times higher in toluene oxidation than that of the analogous NiCu11pel catalyst due to the negligible effect of internal diffusion of the reactants.
Finally, the most active sputtered NiCu11s catalyst was compared with the commercial EnviCat® VOC-1544 catalyst (Cu-Mn oxides supported on alumina). The catalytic activity of the sputtered NiCu11s catalyst in ethanol oxidation related to the amount of active components was 1.7 times higher than that of the commercial EnviCat® VOC-1544 catalyst, while the amount of the active phase in the catalyst bed was 139 times lower.

Supplementary Materials

The following supporting information can be downloaded at: https://www.mdpi.com/article/10.3390/catal13030595/s1, Figure S1: SEM image of the bare stainless steel mesh; Figure S2: O1s deconvolution of sputtered (left) and granular (right) catalysts; Figure S3: Deconvoluted XPS spectra corresponding to Auger lines Cu LMMa (blue), Cu LMMb (green) and Ni LMM (red) of sputtered (left) and granular (right) catalysts; Table S1: Average atomic concentration of components in the sputtered catalysts (at. %); Table S2: Kinetic energy of the main Auger lines observed for granular and sputtered catalysts.

Author Contributions

Conceptualization, F.K.; methodology, F.K., K.J. and M.Č.; validation, F.K., J.M., Z.H. and M.Č.; investigation, A.K., T.B., J.B., M.K., J.M., P.S. and P.T.; data curation, K.J., M.K., M.Č., P.T., Z.H. and F.K.; writing—original draft preparation, K.J., M.Č. and F.K.; writing—review and editing, P.T. and Z.H.; supervision, F.K. and M.Č.; project administration, M.Č. and F.K. All authors have read and agreed to the published version of the manuscript.

Funding

The authors thank the Czech Science Foundation for the financial support (project 21–04477S).

Institutional Review Board Statement

Not applicable.

Informed Consent Statement

Not applicable.

Data Availability Statement

All data generated or analyzed during this study are included in this published article and its supplementary material.

Acknowledgments

The authors thank H. Šnajdaufová for the measurement of surface area of the catalysts, L. Lapčák for the measurement of Raman spectra, and E. Tabor for fruitful discussions.

Conflicts of Interest

The authors declare no conflict of interest.

References

  1. Zhang, K.; Ding, H.; Pan, W.; Mu, X.; Qiu, K.; Ma, J.; Zhao, Y.; Song, J.; Zhang, Z. Research Progress of a Composite Metal Oxide Catalyst for VOC Degradation. Environ. Sci. Technol. 2022, 56, 9220–9236. [Google Scholar] [CrossRef]
  2. Topka, P.; Jirátová, K.; Dvořáková, M.; Balabánová, J.; Koštejn, M.; Kovanda, F. Hydrothermal deposition as a novel method for the preparation of Co–Mn mixed oxide catalysts supported on stainless steel meshes: Application to VOC oxidation. Environ. Sci. Pollut. Res. 2022, 29, 5172–5183. [Google Scholar] [CrossRef]
  3. Chen, L.C.; Lin, S.D. The ethanol steam reforming over Cu-Ni/SiO2 catalysts: Effect of Cu/Ni ratio. Appl. Catal. B Environ. 2011, 106, 639–649. [Google Scholar] [CrossRef]
  4. Srivastava, S.; Jadeja, G.C.; Parikh, J. Synergism studies on alumina-supported copper-nickel catalysts towards furfural and 5-hydroxymethylfurfural hydrogenation. J. Mol. Catal. A Chem. 2017, 426, 244–256. [Google Scholar] [CrossRef]
  5. Yen, H.; Kleitz, F. High-performance solid catalysts for H2 generation from ammonia borane: Progress through synergetic Cu–Ni interactions. J. Mater. Chem. A 2013, 1, 14790–14796. [Google Scholar] [CrossRef]
  6. Lv, H.; Sun, H. Foamlike NiO/CuO Nanocomposites with Superior Catalytic Activity toward the Reduction of 4-Nitrophenol. ACS Omega 2020, 5, 11324–11332. [Google Scholar] [CrossRef] [PubMed]
  7. Guo, Y.; Wang, G.; Yao, X.; Liu, B. A comparison of NiO–CuO–CeO2 composite catalysts prepared via different methods for CO oxidation. J. Solid State Chem. 2020, 292, 121697. [Google Scholar] [CrossRef]
  8. Olejníček, J.; Šmíd, J.; Perekrestov, R.; Kšírová, P.; Rathouský, J.; Kohout, M.; Dvořáková, M.; Kment, Š.; Jurek, K.; Čada, M.; et al. Co3O4 thin films prepared by hollow cathode discharge. Surf. Coat. Technol. 2019, 366, 303–310. [Google Scholar] [CrossRef]
  9. Jirátová, K.; Perekrestov, R.; Dvořáková, M.; Balabánová, J.; Koštejn, M.; Veselý, M.; Čada, M.; Topka, P.; Pokorná, D.; Hubička, Z.; et al. Modification of Cobalt Oxide Electrochemically Deposited on Stainless Steel Meshes with Co-Mn Thin Films Prepared by Magnetron Sputtering: Effect of Preparation Method and Application to Ethanol Oxidation. Catalysts 2021, 11, 1453. [Google Scholar] [CrossRef]
  10. Hubička, Z.; Kment, Š.; Olejníček, J.; Čada, M.; Kubart, T.; Brunclíková, M.; Kšírová, P.; Adámek, P.; Remeš, Z. Deposition of hematite Fe2O3 thin film by DC pulsed magnetron and DC pulsed hollow cathode sputtering system. Thin Solid Films 2013, 549, 184–191. [Google Scholar] [CrossRef]
  11. Stoyanova, D.; Michailova, I.; Radev, D.; Ivanov, G.; Mehandjiev, D. Catalytic oxidation of CO by copper-nickel oxides supported on γ-alumina. C. R. L’académie Bulg. Sci. Sci. Mathématiques Nat. 2017, 70, 1095–1102. [Google Scholar]
  12. Fedorov, A.V.; Kukushkin, R.G.; Yeletsky, P.M.; Bulavchenko, O.A.; Chesalov, Y.A.; Yakovlev, V.A. Temperature-programmed reduction of model CuO, NiO and mixed CuO–NiO catalysts with hydrogen. J. Alloys Compd. 2020, 844, 156135. [Google Scholar] [CrossRef]
  13. Abo Zeid, E.F.; Nassar, A.M.; Hussein, M.A.; Alam, M.M.; Asiri, A.M.; Hegazy, H.H.; Rahman, M.M. Mixed oxides CuO-NiO fabricated for selective detection of 2-Aminophenol by electrochemical approach. J. Mater. Res. Technol. 2019, 9, 1457–1467. [Google Scholar] [CrossRef]
  14. Oluku, I.; Ibrahim, H.; Idem, R. Ternary oxide-supported bimetallic nickel-copper catalysts for a single step high temperature water gas shift of biogas reformate. Fuel 2018, 234, 1238–1258. [Google Scholar] [CrossRef]
  15. Radev, D.; Michailova, I.; Mechandjiev, D. Mechanically assisted synthesis of mixed nickel-copper oxides. C. R. L’académie Bulg. Sci. Sci. Mathématiques Nat. 2019, 72, 604. [Google Scholar] [CrossRef]
  16. Paryjczak, T.; Rynkowski, J.; Krzyzanowski, K. Temperature-programmed reduction of CuO−NiO/Al2O3 catalysts. React Kinet. Catal. Lett. 1982, 21, 295–298. [Google Scholar] [CrossRef]
  17. Buciuman, F.C.; Patcas, F.; Hahn, T. A spillover approach to oxidation catalysis over copper and manganese mixed oxides. Chem. Eng. Process. 1999, 38, 563–569. [Google Scholar] [CrossRef]
  18. Wang, Y.; Liu, X.; Hu, X.; Wu, R.; Zhao, Y. Preparation and characterization of Cu–Mn composite oxides in N2O decomposition. Reac. Kinet. Mech. Cat. 2020, 129, 165–179. [Google Scholar] [CrossRef]
  19. Chen, C.; Liu, L.; Li, Y.; Li, W.; Zhou, L.; Lan, Y.; Li, Y. Insight into heterogeneous catalytic degradation of sulfamethazine by peroxymonosulfate activated with CuCo2O4 derived from bimetallic oxalate. Chem. Eng. J. 2020, 384, 123257. [Google Scholar] [CrossRef]
  20. Suib, S.L. New and Future Developments in Catalysis; Elsevier: Amsterdam, The Netherlands, 2013. [Google Scholar]
  21. Bose, P.; Ghosh, S.; Basak, S.; Naskar, M.K. A facile synthesis of mesoporous NiO nanosheets and their application in CO oxidation. J. Asian Ceram. Soc. 2016, 4, 1–5. [Google Scholar] [CrossRef] [Green Version]
  22. Wang, W.; Liu, Y.; Xu, C.; Zheng, C.; Wang, G. Synthesis of NiO nanorods by a novel simple precursor thermal decomposition approach. Chem. Phys. Lett. 2002, 362, 119–122. [Google Scholar] [CrossRef]
  23. Song, L.X.; Yang, Z.K.; Teng, Y.; Xia, J.; Du, P. Nickel oxide nanoflowers: Formation, structure, magnetic property and adsorptive performance towards organic dyes and heavy metal ions. J. Mater. Chem. A 2013, 1, 8731–8736. [Google Scholar] [CrossRef]
  24. Mironova-Ulmane, N.; Kuzmin, A.; Steins, I.; Grabis, J.; Sildos, I.; Pars, M. Raman scattering in nanosized nickel oxide. J. Phys. Conf. Ser. 2007, 93, 012039. [Google Scholar] [CrossRef]
  25. Bala, N.; Singh, H.K.; Verma, S.; Rath, S. Magnetic-order induced effects in nanocrystalline NiO probed by Raman spectroscopy. Phys. Rev. B 2020, 102, 024423. [Google Scholar] [CrossRef]
  26. Mironova-Ulmane, N.; Kuzmin, A.; Sildos, I.; Puust, L.; Grabis, J. Magnon and phonon excitations in nanosized NiO. Latv. J. Phys. Tech. Sci. 2019, 56, 61–72. [Google Scholar] [CrossRef] [Green Version]
  27. Murthy, P.S.; Venugopalan, V.P.; Arunya, D.D.; Dhara, S.; Pandiyan, R.; Tyagi, A.K. Antibiofilm Activity of Nano sized CuO. In Proceedings of the International Conference on Nanoscience, Engineering and Technology (ICONSET 2011), Chennai, India, 28–30 November 2011; pp. 580–583. [Google Scholar] [CrossRef]
  28. Ciobotea-Barbu, O.C.; Ciobotaru, I.A.; Vaireanu, D.I.; Dumitras, D.G.; Nicolae, C. XRD, Raman and SEM surface analysis on Ni-Cu electrodeposited layers. J. Optoelectron. Adv. Mater. 2019, 21, 536–540. Available online: https://joam.inoe.ro/articles/xrd-raman-and-sem-surface-analysis-on-ni-cu-electrodeposited-layers/fulltext (accessed on 23 February 2023).
  29. Niaura, G. Surface-enhanced Raman spectroscopic observation of two kinds of adsorbed OH− ions at copper electrode. Electrochim. Acta 2000, 45, 3507–3519. [Google Scholar] [CrossRef]
  30. Chen, S.; Brown, L.; Levendorf, M.; Cai, W.; Ju, S.Y.; Edgeworth, J.; Li, X.; Magnuson, C.W.; Velamakanni, A.; Piner, R.D.; et al. Oxidation Resistance of Graphene-Coated Cu and Cu/Ni Alloy. ACS Nano 2011, 5, 1321. [Google Scholar] [CrossRef] [Green Version]
  31. Chou, M.H.; Liu, S.B.; Huang, C.Y.; Wu, S.Y.; Cheng, C.L. Confocal Raman spectroscopic mapping studies on a single CuO nanowire. Appl. Surf. Sci. 2008, 254, 7539–7543. [Google Scholar] [CrossRef]
  32. Biesinger, M.C.; Payne, B.P.; Lau, L.W.M.; Gerson, A.; Smart RStC. X-ray photoelectron spectroscopic chemical state quantification of mixed nickel metal, oxide and hydroxide systems. Surf. Interface Anal. 2009, 41, 324–332. [Google Scholar] [CrossRef]
  33. Kaštánek, F.; Topka, P.; Soukup, K.; Maléterová, Y.; Demnerová, K.; Kaštánek, P.; Šolcová, O. Remediation of Contaminated Soils by Thermal Desorption; Effect of Benzoyl Peroxide Addition. J. Clean Prod. 2016, 125, 309–313. [Google Scholar] [CrossRef]
  34. Gaálová, J.; Topka, P.; Kaluža, L.; Soukup, K.; Barbier, J., Jr. Effect of gold loading on ceria-zirconia support in total oxidation of VOCs. Catal. Today 2019, 333, 190–195. [Google Scholar] [CrossRef]
  35. De Waele, J.; Galvita, V.V.; Poelman, H.; Gabrovska, M.; Nikolova, D.; Damyanova, S.; Thybaut, J.W. Ethanol dehydrogenation over Cu catalysts promoted with Ni: Stability control. Appl. Catal. A 2020, 591, 117401. [Google Scholar] [CrossRef]
  36. Sun, L.; Deng, Y.; Yang, Y.; Xu, Z.; Xie, K.; Liao, L. Preparation and catalytic activity of magnetic bimetallic nickel/copper nanowires. RSC Adv. 2017, 7, 17781–17787. [Google Scholar] [CrossRef] [Green Version]
  37. Cross, A.; Miller, J.T.; Danghyan, V.; Mukasyan, A.S.; Wolf, E.E. Highly active and stable Ni-Cu supported catalysts prepared by combustion synthesis for hydrogen production from ethanol. Appl. Catal. A 2019, 572, 124–133. [Google Scholar] [CrossRef]
  38. Kumar, A.; Cross, A.; Manukyan, K.; Bhosale, R.R.; van den Broeke, L.J.P.; Miller, J.T.; Mukasyan, A.S.; Wolf, E.E. Combustion synthesis of copper–nickel catalysts for hydrogen production from ethanol. Chem. Eng. J. 2015, 278, 46–54. [Google Scholar] [CrossRef] [Green Version]
  39. Topka, P.; Dvořáková, M.; Kšírová, P.; Perekrestov, R.; Čada, M.; Balabánová, J.; Koštejn, M.; Jirátová, K.; Kovanda, F. Structured cobalt oxide catalysts for VOC abatement: The effect of preparation method. Environ. Sci. Pollut. Res. 2020, 27, 7608–7617. [Google Scholar] [CrossRef]
  40. Matějová, L.; Topka, P.; Jirátová, K.; Šolcová, O. Total oxidation of model volatile organic compounds over some commercial catalysts. Appl. Catal. A 2012, 443, 40–49. [Google Scholar] [CrossRef]
  41. Dvořáková, M.; Perekrestov, R.; Kšírová, P.; Balabánová, J.; Jirátová, K.; Maixner, J.; Topka, P.; Rathouský, J.; Koštejn, M.; Čada, M.; et al. Preparation of cobalt oxide catalysts on stainless steel wire mesh by combination of magnetron sputtering and electrochemical deposition. Catal. Today 2019, 334, 13–23. [Google Scholar] [CrossRef]
  42. Topka, P.; Jirátová, K.; Soukup, K.; Goliáš, J. Device for Measuring Specific Surface of Large Samples, Method of Measurement and Its Use. Czech Patent CZ308606, 30 December 2020. [Google Scholar]
Figure 1. SEM images of the Ni-Cu oxide layers with various Ni:Cu molar ratios deposited on stainless steel meshes by plasma jet sputtering.
Catalysts 13 00595 g001aCatalysts 13 00595 g001b
Figure 2. Powder XRD patterns of granular (left) and sputtered (right) Ni-Cu oxide catalysts; B–NiO (bunsenite), T—CuO (tenorite), *—stainless steel support.
Catalysts 13 00595 g002
Figure 3. TPR profiles of granular (left) and sputtered Ni-Cu oxide catalysts (right). In both cases, the TCD intensities are per gram of oxides.
Catalysts 13 00595 g003
Figure 4. Raman spectra (λ = 532 nm) of the granular (left) and sputtered (right) Ni-Cu catalysts in dependence on Ni:Cu molar ratio. The dashed spectrum corresponds to the pelletized NiCu11pel catalyst.
Catalysts 13 00595 g004
Figure 5. Raman spectra (λ = 532 nm) of NiO deposited in various amounts on the stainless steel meshes (taken at two or three different points).
Catalysts 13 00595 g005
Figure 6. Peak fitting of XPS Ni 2p spectra (top left) and Cu 2p spectra (bottom left) of granular catalysts and Ni 2p spectra (top right) and Cu 2p spectra (bottom right) of sputtered catalysts.
Catalysts 13 00595 g006
Figure 7. Conversion curves of ethanol (left) and toluene (right) obtained during their oxidation over granular and sputtered catalysts. Catalysts Cu (black), NiCu14 (red), NiCu11 (blue), NiCu41 (green), and Ni (magenta). Reaction conditions: 0.2 g of granular catalyst or 3.8 g of sputtered catalysts, 760 ppm of ethanol or 780 ppm of toluene, GHSV 21 L gcat−l h−l, temperature ramp 2 °C min−l.
Catalysts 13 00595 g007
Figure 8. Catalytic activity of granular catalysts expressed as specific reaction rate R130 in the oxidation of ethanol (left), and specific reaction rate R270 in the oxidation of toluene (right) in dependence on Ni/(Ni + Cu) molar ratio.
Catalysts 13 00595 g008
Figure 9. Catalytic activity of sputtered catalysts expressed as specific reaction rate R250 in the oxidation of ethanol (left), and specific reaction rate R350 in the oxidation of toluene (right) in dependence on Ni/(Ni + Cu) molar ratio.
Catalysts 13 00595 g009
Figure 10. Scheme of the hollow cathode sputtering system used for the active phase deposition on the stainless steel meshes.
Catalysts 13 00595 g010
Table 1. Composition of the granular oxide catalyst (prepared from coprecipitated precursors) in wt.% and resulting Ni:Cu molar ratio according to atomic absorption spectroscopy results.
SampleNiCuNaNi:CuAAS
Cug-77.20.20:1
NiCu14g14.455.60.41:3.7
NiCu11g36.636.60.21:0.9
NiCu41g58.016.20.14:1.0
Nig77.1-0.41:0
Table 2. Ni and Cu concentrations in the layers deposited on meshes in at.% (determined by EDX).
SampleNi aFe aNi Correction bNilayer cCu dNi eNi:CuEDX
Cus1.920.1-0.027.900:1
NiCu14s5.714.10.74.125.3140.65:4
NiCu11s14.920.40.912.713.4490.96:1
NiCu41s21.220.20.918.96.6742.8:1
Nis14.534.20.710.60.2981:0
a Average atomic concentration in the sputtered catalysts (at. %), b Ni correction ratio in the catalyst determined from Ni/Fe ratio, c corrected atomic Ni concentration (at. %) originated from the layer after subtracting of Ni originated from the mesh, d Cu concentration in the layers (at. %) (Ni/(Ni + Cu)) (at. %), e Ni concentration (%) in the layer calculated as Nilayer/(Nilayer + Cu).
Table 3. Crystallite sizes and lattice parameters of oxide phases (NiO and CuO) in the granular and sputtered Ni-Cu catalysts.
NiO (Bunsenite)
SampleLattice Parameter a (nm)Crystallite Size* (nm)SampleLattice Parameter a (nm)Crystallite Size * (nm)
NiCu14g0.418612.1NiCu14sn.d.n.d.
NiCu11g0.418313.1NiCu11 s0.419913.7
NiCu41g0.418318.5NiCu41 s0.418511.7
Nig0.417933.1Ni s0.41739.0
CuO (tenorite)
Lattice parameters (nm)Crystallite size (nm) *
Sampleabcβ (°)
Cu g0.46850.34270.513699.47233.9
NiCu14 g0.46830.34270.513399.42619.1
NiCu11g0.46880.34330.512499.33015.8
NiCu41g0.4690034380.512099.27019.7
Cus0.47300.34310.511099.45227.7
NiCu14s0.46900.34880.515399.32618.3
NiCu11s0.46840.34220.510799.23111.7
NiCu41s0.46860.34380.510599.33319.1
* Calculated from integral width (Bobs) value of the diffraction lines according to the Scherrer equation; n.d.—not determined due to poorly defined diffraction peaks of very low intensity.
Table 4. Tonset and H2 consumption during TPR measurements together with surface area SBET and total pore volume Vtot of the granular and sputtered Ni-Cu catalysts.
SampleTonset,
°C
mmol H2 goxides−1SBET, m2 goxides−1Vtot, mm3g−1SampleTonset,
°C
mmol H2 goxides−1SBET, m2 goxides−1Vtot, mm3g−1
Cug17213.6715Cus11418.89.4-
NiCu14g14013.42271NiCu14s15513.13.3-
NiCu11g14013.528180NiCu11s20516.910.1-
NiCu41g13813.333116NiCu41s22617.110.2-
Nig23414.11480Nis34211.817.8-
Table 5. XPS data (concentration of elements in at. %) of granular and sputtered catalysts and comparison of the XPS data of Ni and Cu elements with the chemical analysis of the catalysts by AAS (labelled as bulk) and EDX.
SampleC 1sO 1sNa 1sNi 2pCu 2pNi/
(Ni + Cu)XPS
Ni/
(Ni + Cu)bulk
XPS/
bulk
Cug54.5232.692.750.19.940.01--
NiCu14g69.7225.930.331.742.280.430.212.0
NiCu11g40.235.231.3116.796.470.720.531.4
NiCu41g45.5531.840.3115.826.470.710.800.9
Nig37.8236.42.0523.7201--
SampleC 1sO 1sNa 1sNi 2pCu 2pNi/
(Ni + Cu)XPS
Ni/
(Ni + Cu)EDX
XPS/
EDX
Cus69.225.8-05.00--
NiCu14s62.228.2-4.15.40.430.740.6
NiCu11s57.729.8-7.25.20.580.491.2
NiCu41s56.530.0-8.25.30.600.144.3
Nis69.926.8-3.301--
Table 6. Fractions of different oxygen species on the surface (%) according to O1s peaks after deconvolution.
SampleCugNiCu14gNiCu11gNiCu41gNig
eV
529.625.418.645.449.051.8
531.968.651.836.641.320.7
533.36.029.618.09.727.4
SampleCusNiCu14sNiCu11sNiCu41sNis
eV
529.616.3130.6043.0443.2711.08
531.773.3565.3256.9656.7380.95
533.810.344.08 7.98
Table 7. Temperatures T50 and T90CO2, °C, and specific reaction rate RT observed in the oxidation of ethanol and toluene over granular and sputtered catalysts. Reaction conditions: 0.2 g of granular catalyst or 3.8 g of sputtered catalysts, 760 ppm of ethanol or 780 ppm of toluene, GHSV 21 L gcat−l h−l, temperature ramp 2 °C min−l.
CatalystGranular Sputtered
Ethanol Toluene Ethanol Toluene
T50T90CO2R130T50T90CO2R270T50R250T90CO2T50R350
Cu1702290.102813000.242637842542526
NiCu141282120.412722890.292529839639632
NiCu111312130.352732840.2624714839838036
NiCu411262120.382742850.242589339939821
Ni1482270.232973080.082808542039918
Table 8. T50 temperatures and specific reaction rates RT, mmol goxides−1 h−1, for the sputtered, granular and pelletized NiCu11 catalysts in ethanol and toluene oxidation.
ParameterReactantCatalyst
GranularSputteredPelletized
T50, °CEthanol131247160
Toluene273380266
R130Ethanol0.35-0.31
R200 -6.020.87
R270Toluene0.26-0.36
R350 -36.30.60
Table 9. Experimental conditions used for the preparation of Ni-Cu oxide catalysts (substrate temperature < 60 °C; three layers deposited at pressure 2, 80, and 2 Pa), and the average amount of oxides deposited on a single mesh.
SampleNozzle MaterialTime,
min
Deposition,
mg
CusCu12; 5; 121.65
NiCu14sCu + Ni (80:20)14; 6; 141.62
NiCu11sCu + Ni (50:50)18; 8; 181.30
NiCu41sCu + Ni (20:80)21; 8; 211.27
NisNi24;10; 240.88
Disclaimer/Publisher’s Note: The statements, opinions and data contained in all publications are solely those of the individual author(s) and contributor(s) and not of MDPI and/or the editor(s). MDPI and/or the editor(s) disclaim responsibility for any injury to people or property resulting from any ideas, methods, instructions or products referred to in the content.

