
Biochemical Background in Mitochondria Affects 2HG Production by IDH2 and ADHFE1 in Breast Carcinoma

 , , , , , and
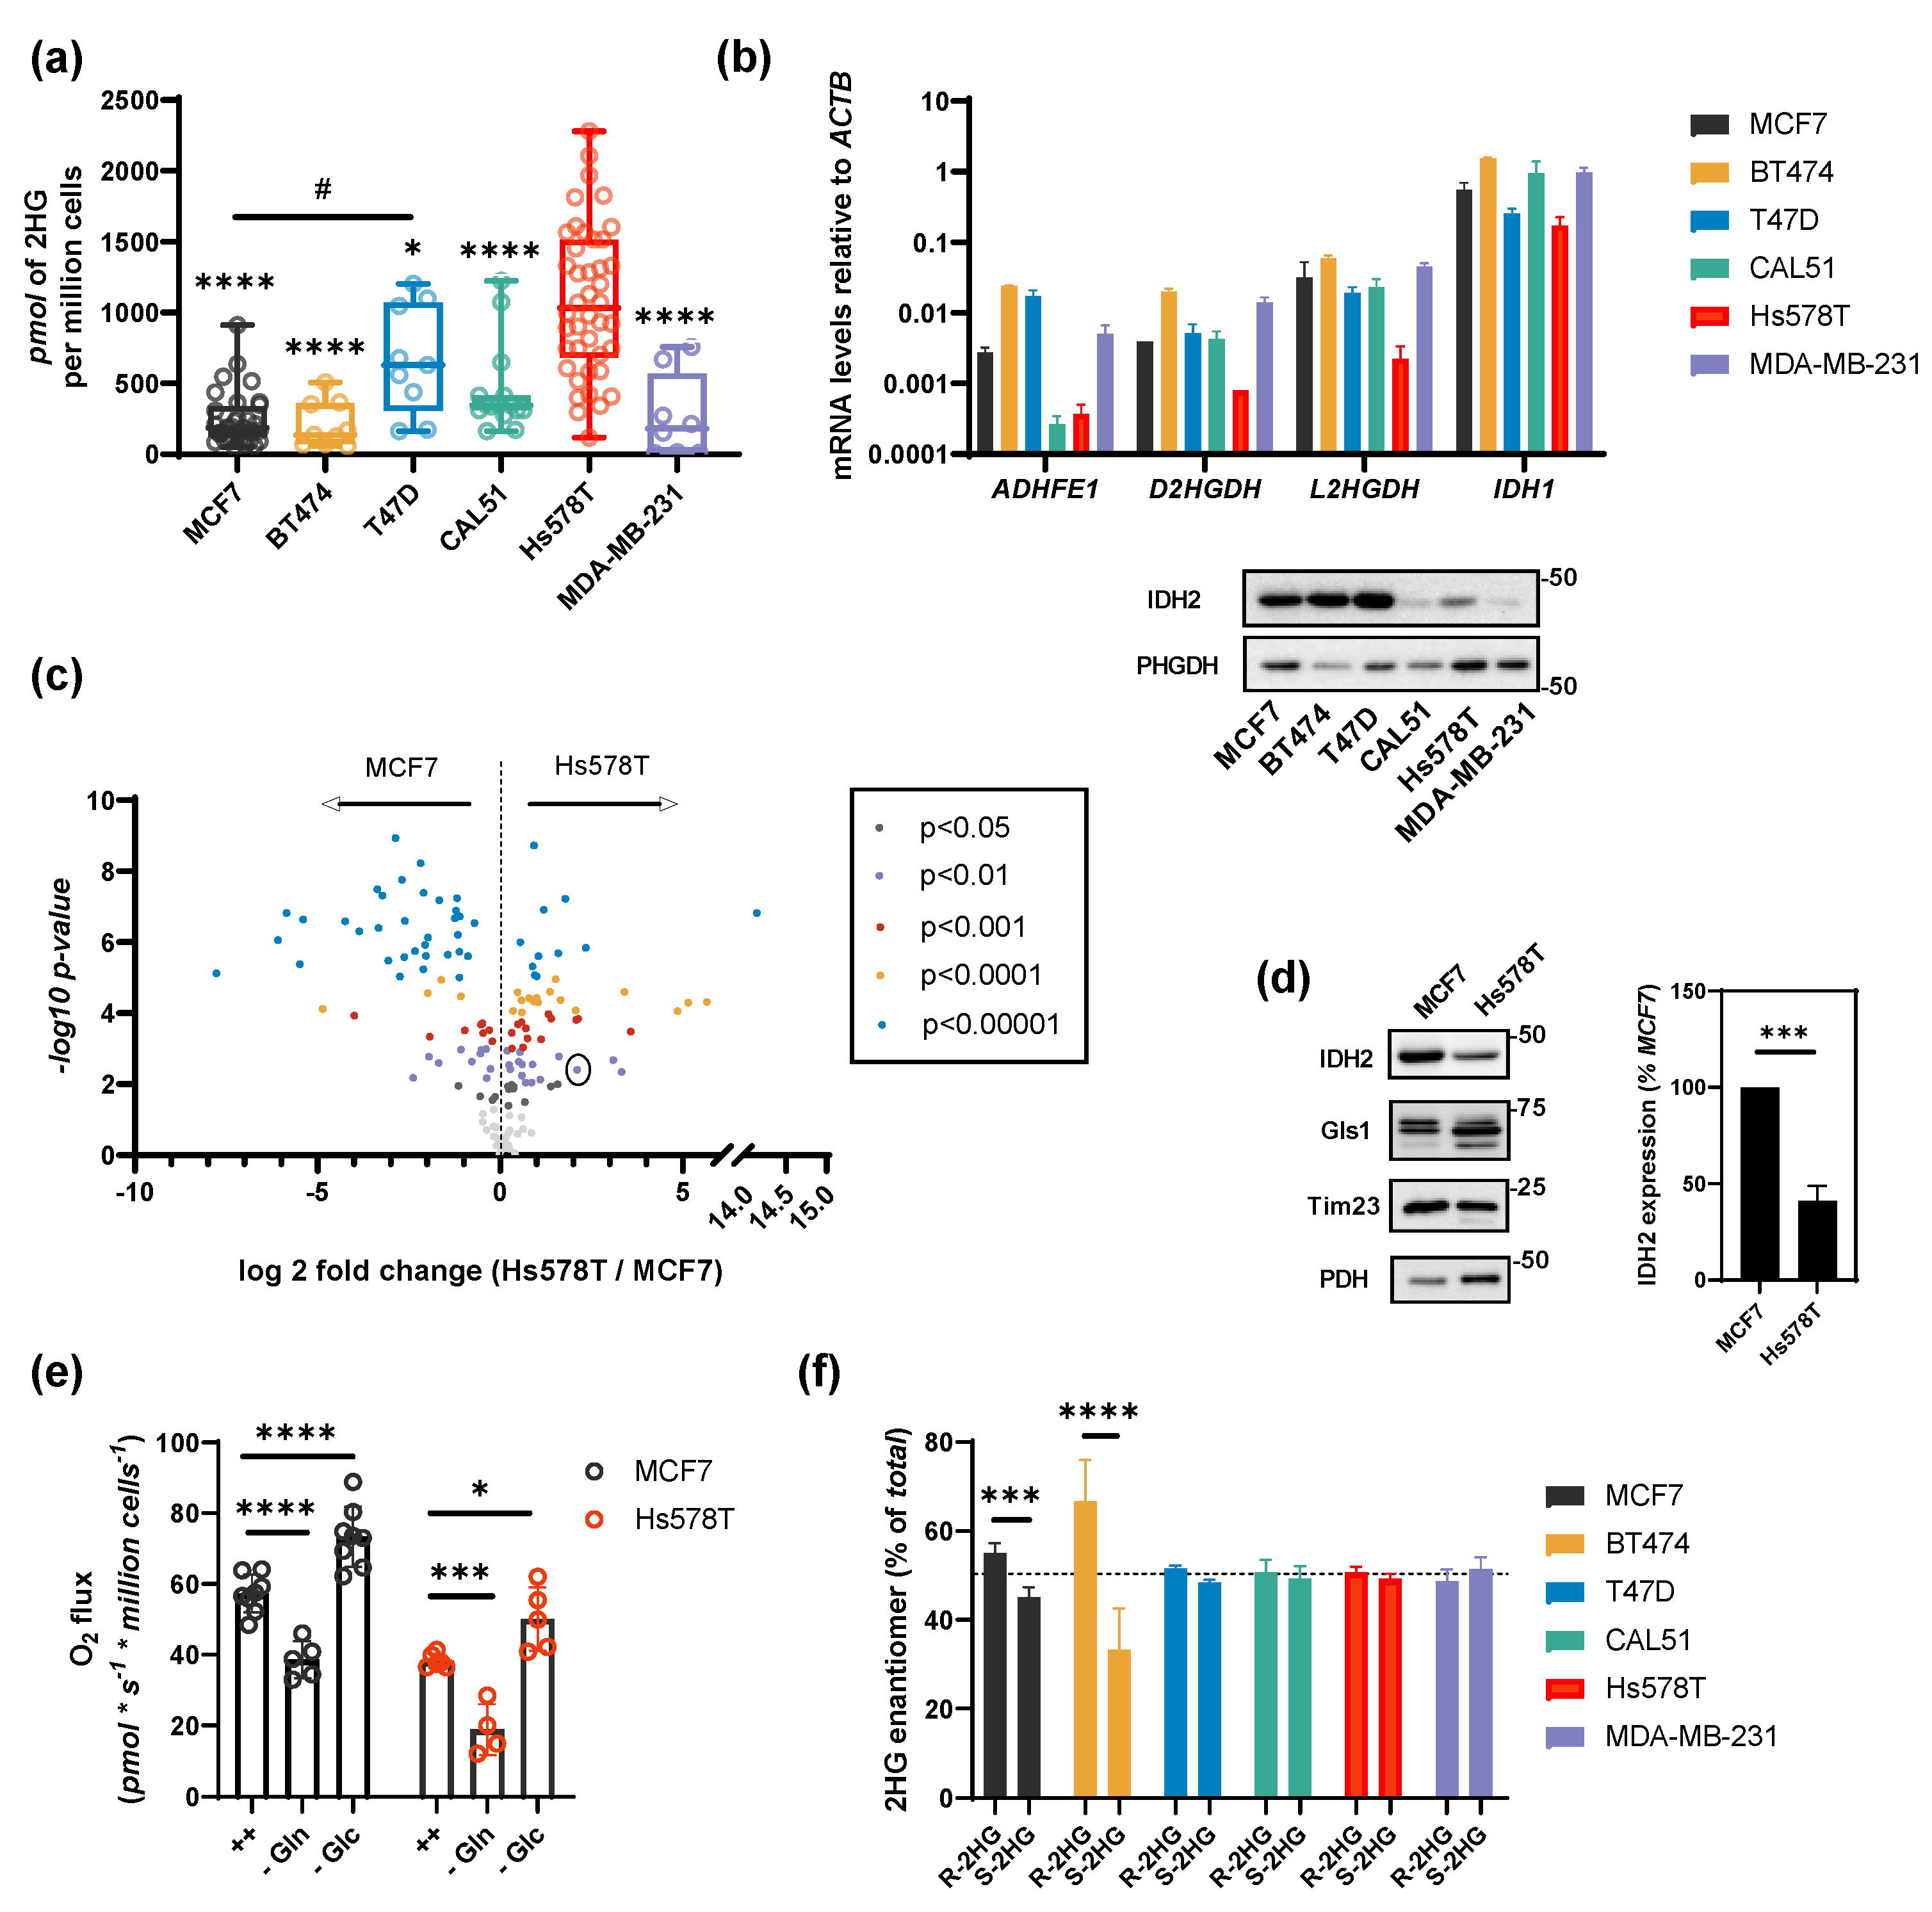
Abstract
:Simple Summary
Abstract
1. Introduction
2. Results
2.1. HG Production in Breast Cancer Cells
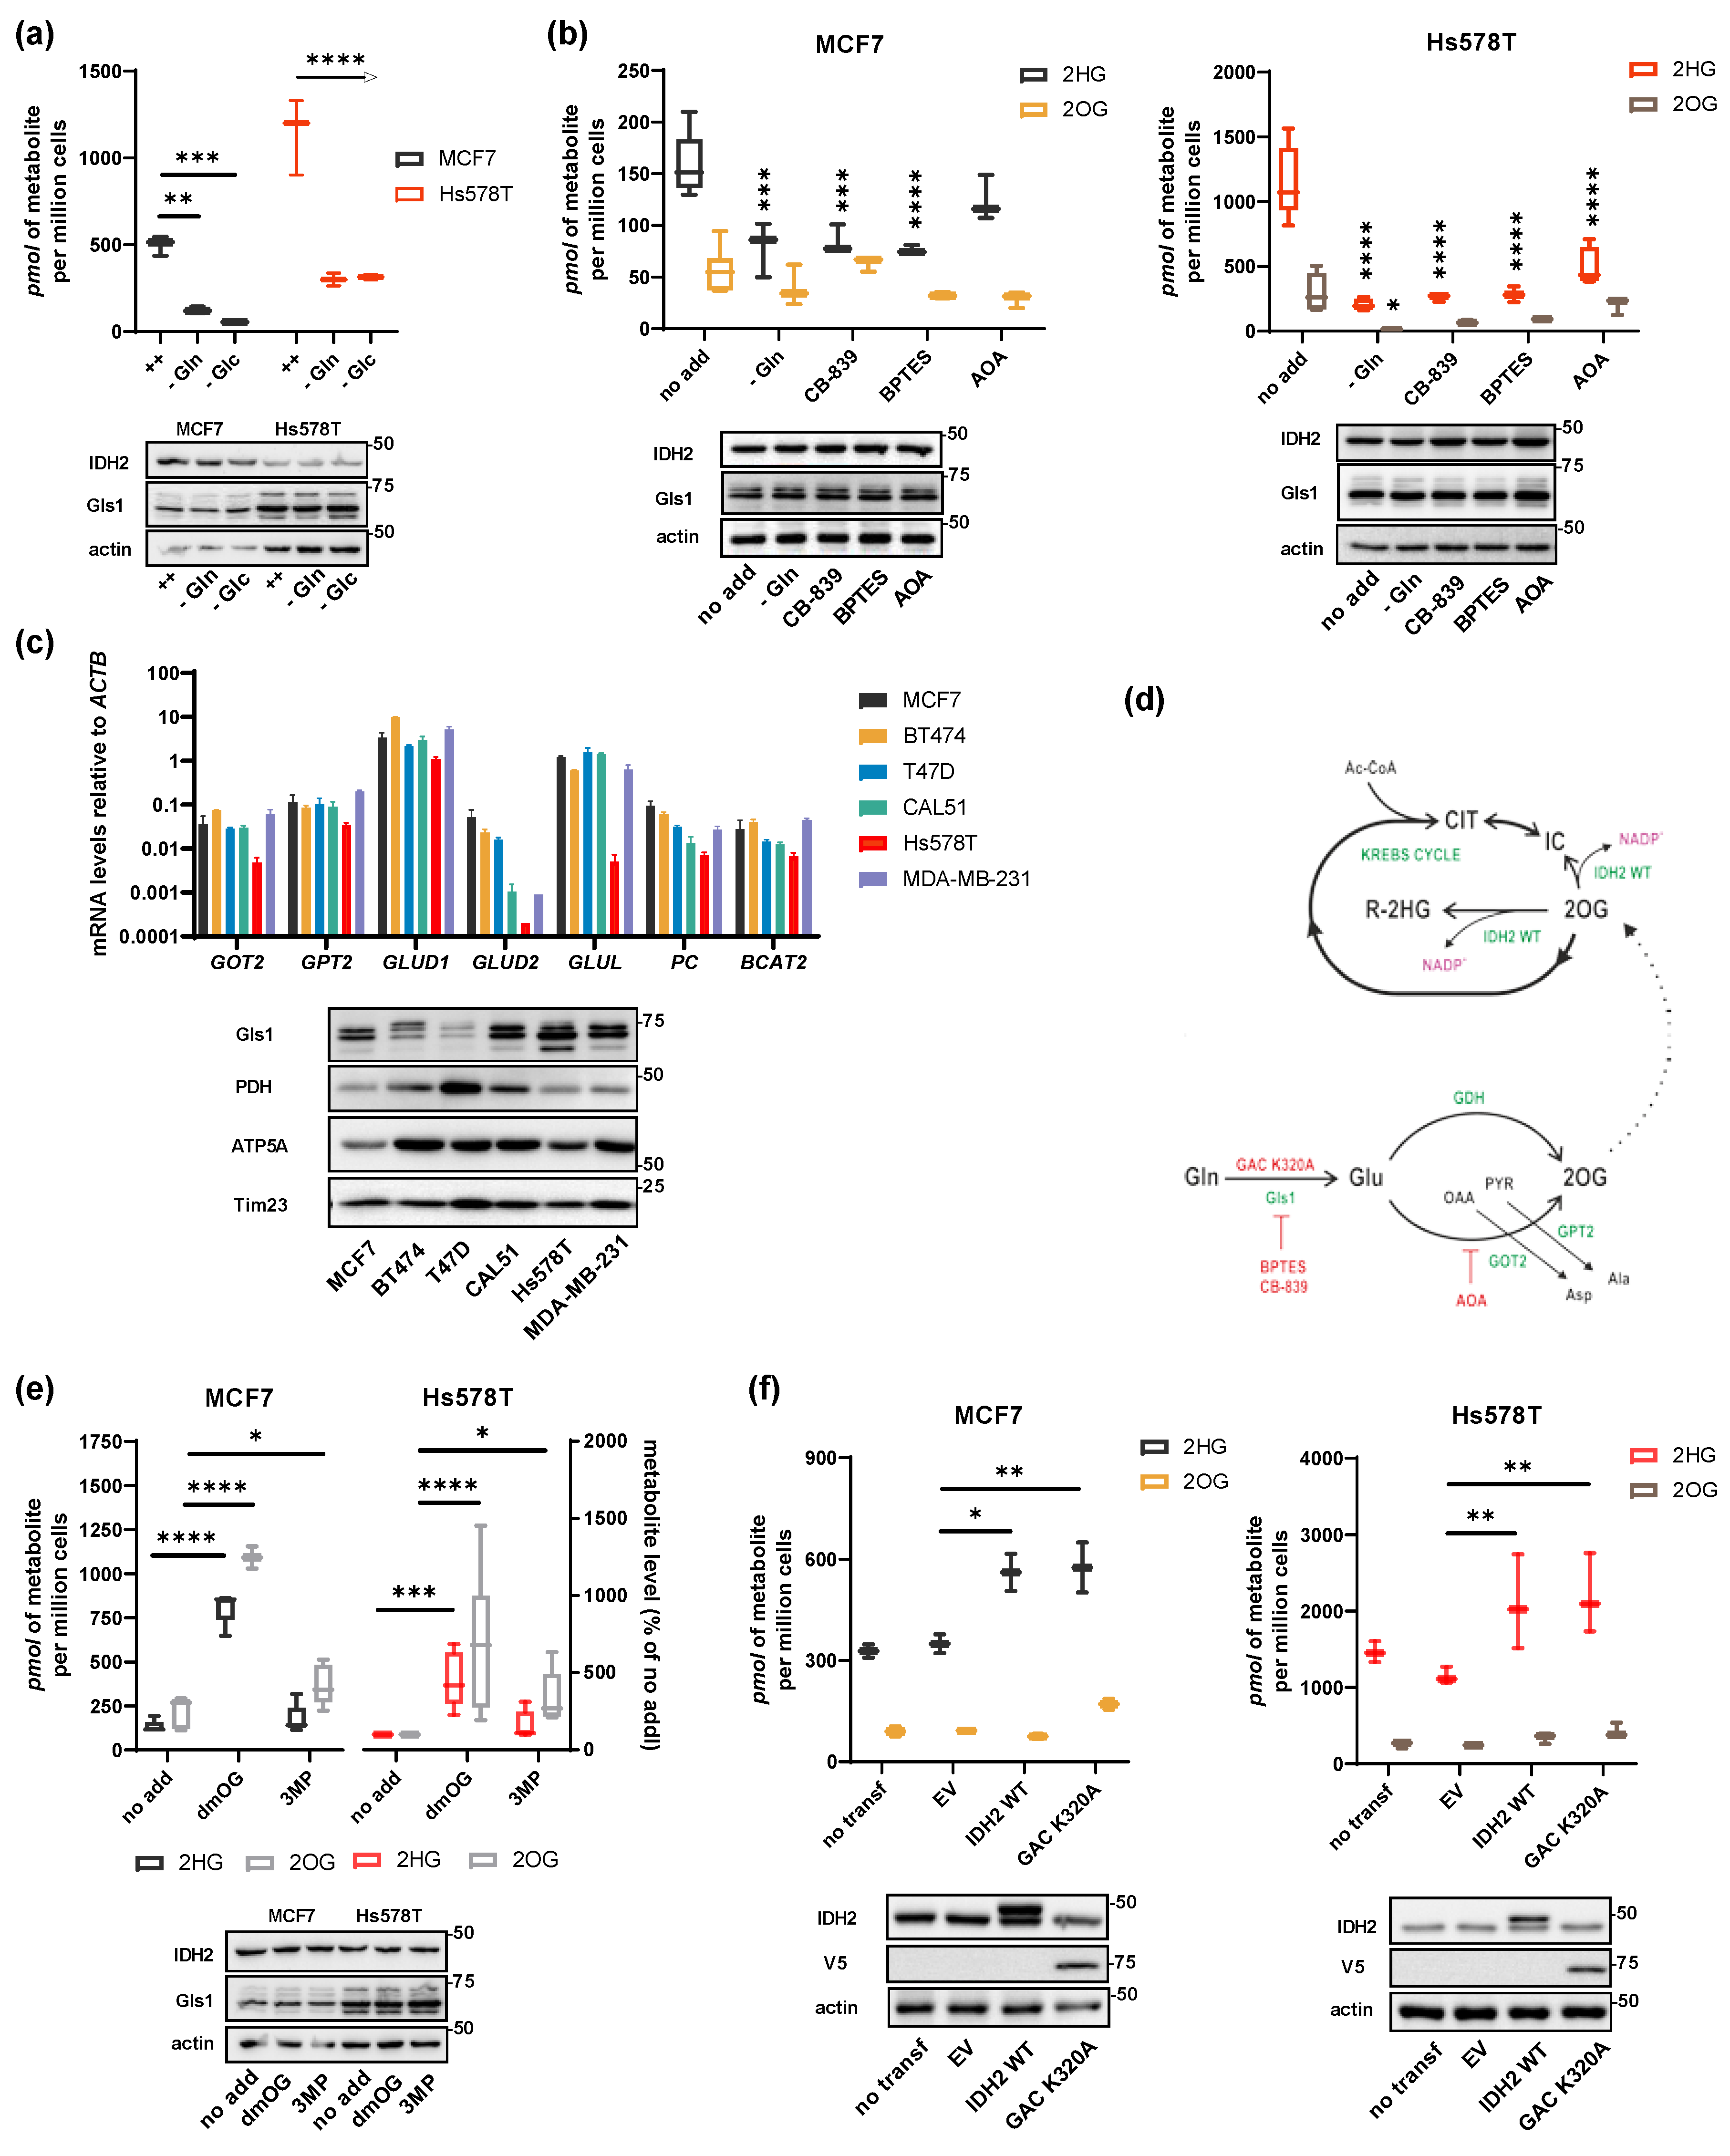
2.2. Substrate Flux Determines 2HG Production in Breast Cancer Cells
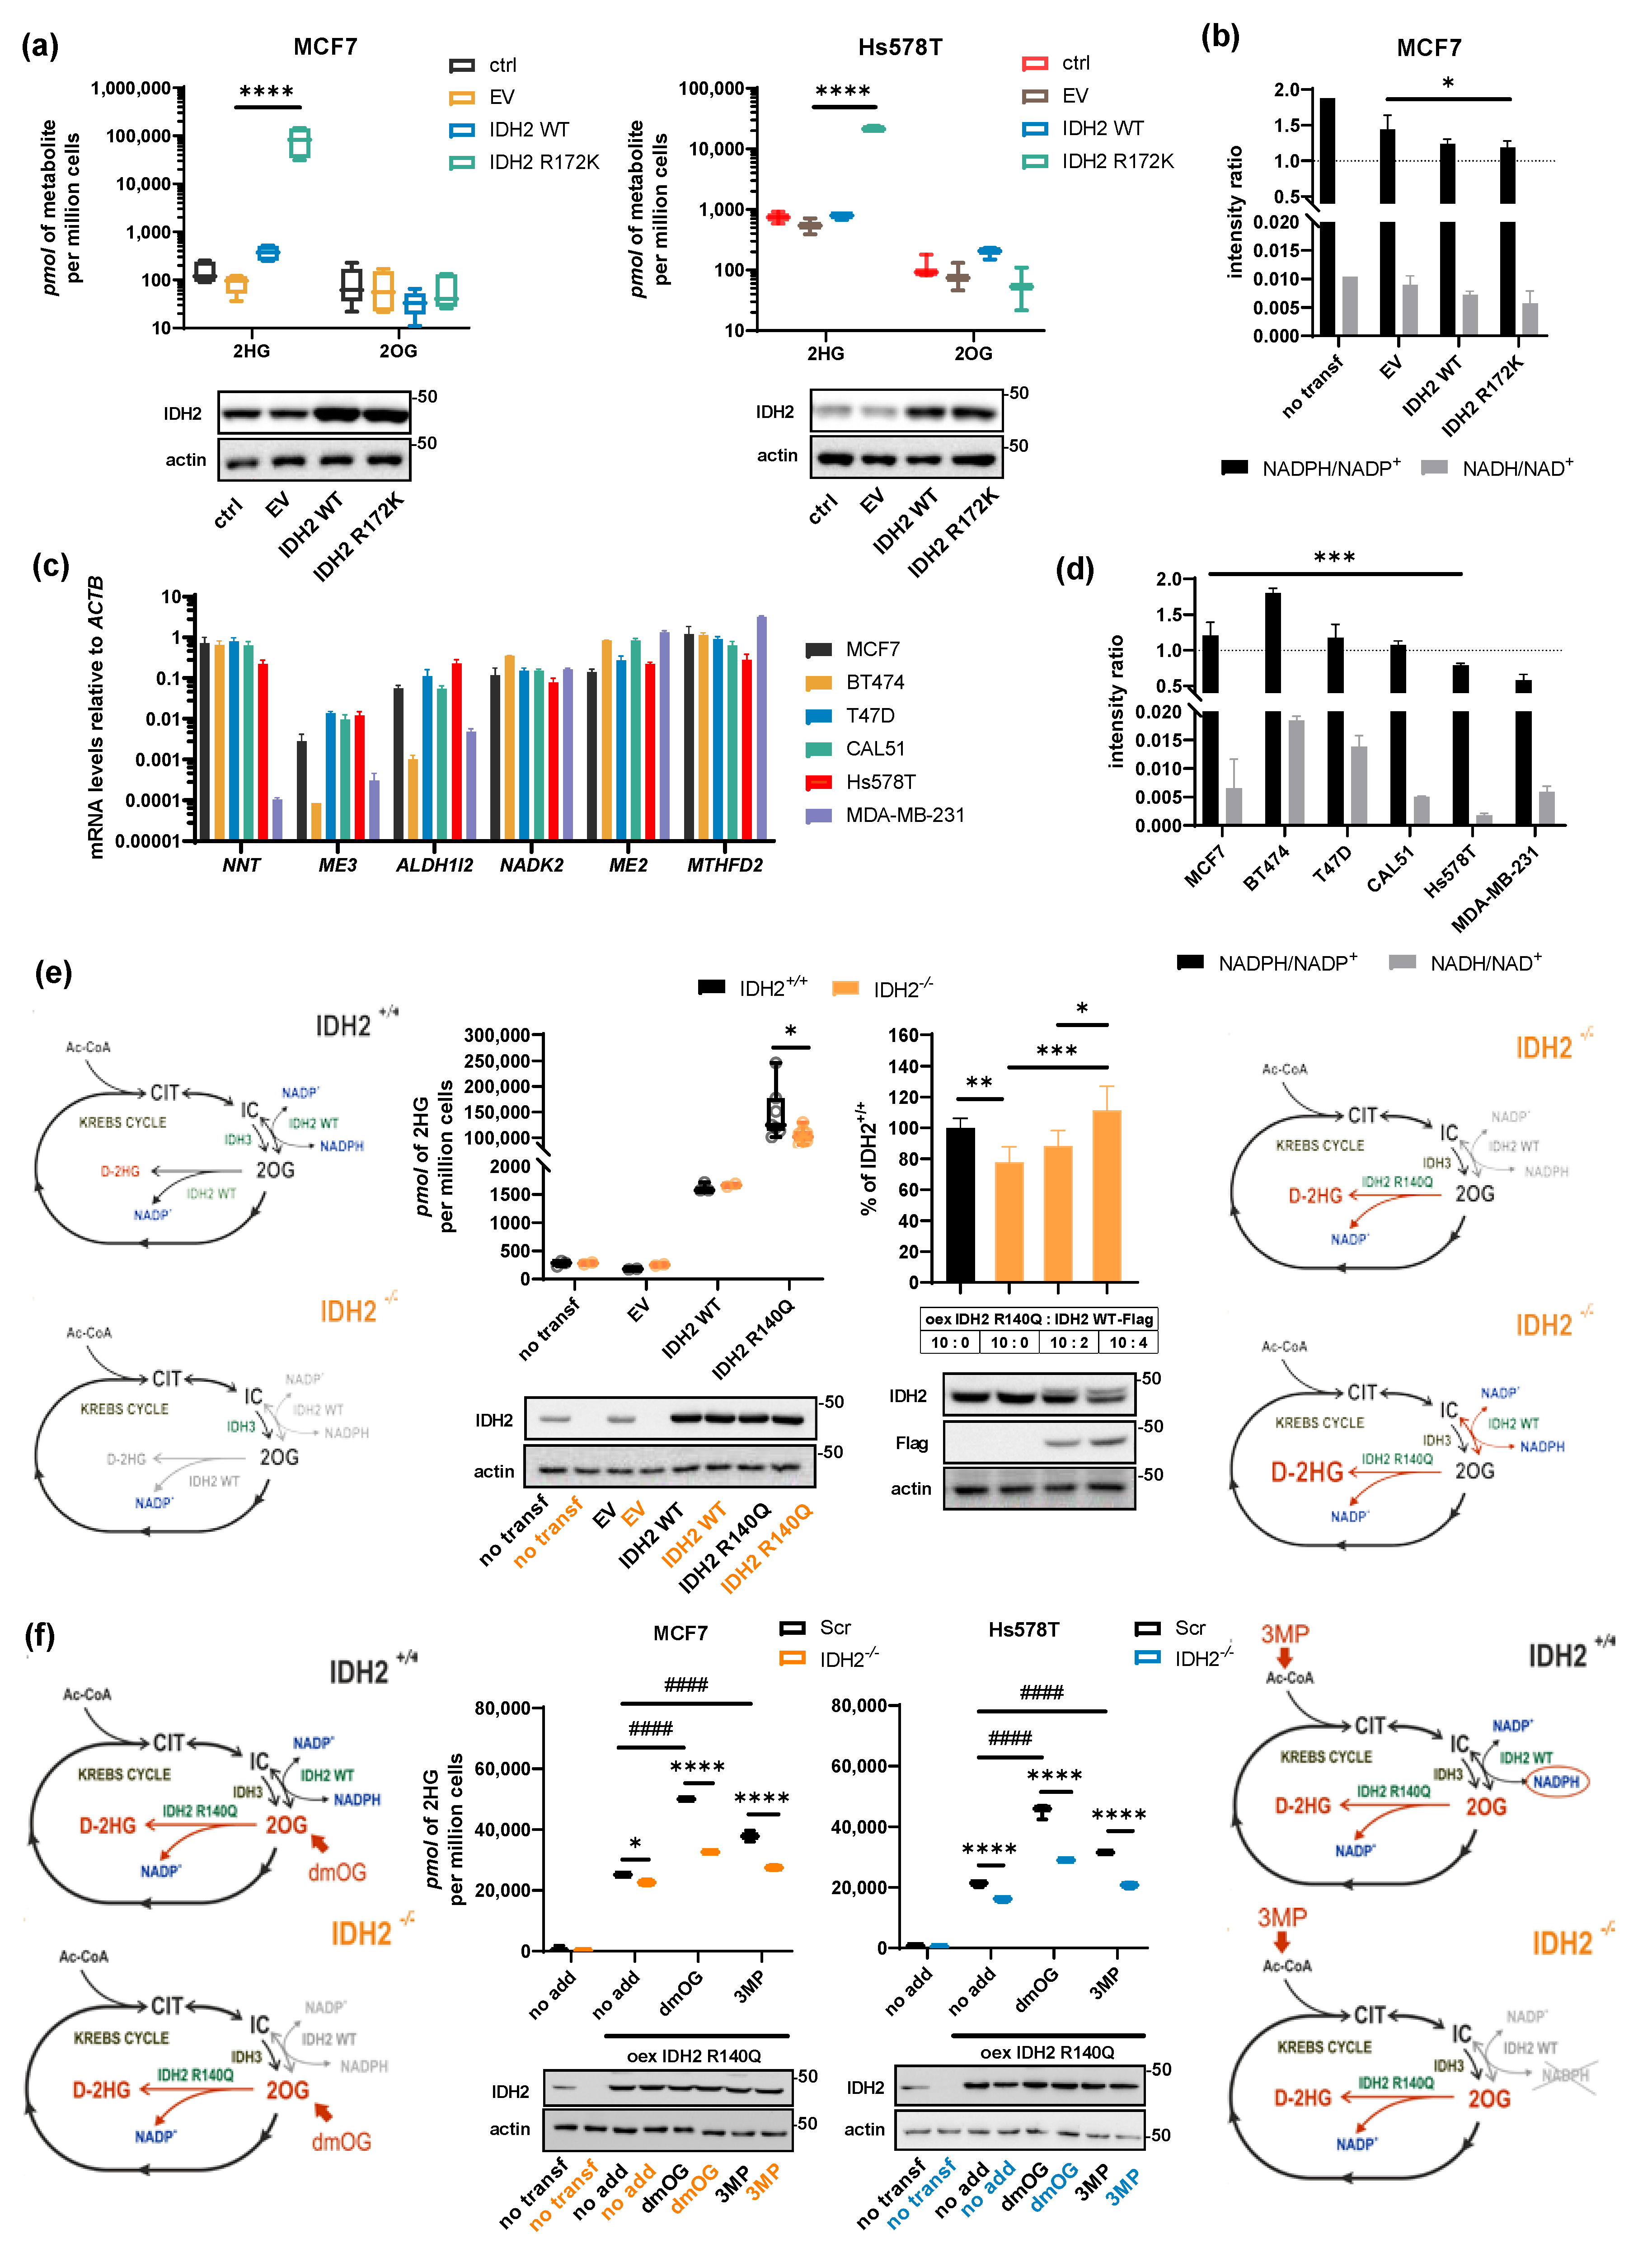
2.3. Shared 2HG Production by ADHFE1 and IDH2 in Breast Cancer Cells
2.4. Role of NADPH Balance in IDH2-Produced 2HG, Substrate, and Cofactor Flux
2.5. HG Is Released from Cells and Is Detectable in Urine and Plasma of Breast Cancer Patients
3. Discussion
4. Materials and Methods
4.1. Cell Cultures
4.2. Crispr-Cas9
4.3. Analytical Techniques
4.4. Chemicals
4.5. Real-Time PCR
4.6. Clinical Study
4.7. Statistical Analysis
5. Conclusions
Supplementary Materials
Author Contributions
Funding
Institutional Review Board Statement
Informed Consent Statement
Acknowledgments
Conflicts of Interest
References
- Smolková, K.; Mikó, E.; Kovács, T.; Leguina-Ruzzi, A.; Sipos, A.; Bai, P. Nuclear Factor Erythroid 2-Related Factor 2 in Regulating Cancer Metabolism. Antioxid. Redox Signal. 2020, 33, 966–997. [Google Scholar] [CrossRef] [PubMed] [Green Version]
- Losman, J.-A.; Looper, R.E.; Koivunen, P.; Lee, S.; Schneider, R.K.; McMahon, C.; Cowley, G.S.; Root, D.E.; Ebert, B.L., Jr. (R)-2-Hydroxyglutarate Is Sufficient to Promote Leukemogenesis and Its Effects Are Reversible. Science 2013, 339, 1621–1625. [Google Scholar] [CrossRef]
- Koivunen, P.; Lee, S.; Duncan, C.G.; Lopez, G.Y.; Lu, G.; Ramkissoon, S.H.; Losman, J.A.; Joensuu, P.; Bergmann, U.; Gross, S.; et al. Transformation by the (R)-enantiomer of 2-hydroxyglutarate linked to EGLN activation. Nature 2012, 483, 484–488. [Google Scholar] [CrossRef] [PubMed]
- Figueroa, M.E.; Abdel-Wahab, O.; Lu, C.; Ward, P.S.; Patel, J.; Shih, A.; Li, Y.; Bhagwat, N.; VasanthaKumar, A.; Fernandez, H.F.; et al. Leukemic IDH1 and IDH2 Mutations Result in a Hypermethylation Phenotype, Disrupt TET2 Function and Impair Hematopoietic Differentiation. Cancer Cell 2010, 18, 553–567. [Google Scholar] [CrossRef] [PubMed] [Green Version]
- Lu, C.; Ward, P.S.; Kapoor, G.S.; Rohle, D.; Turcan, S.; Abdel-Wahab, O.; Edwards, C.R.; Khanin, R.; Figueroa, M.E.; Melnick, A.; et al. IDH mutation impairs histone demethylation and results in a block to cell differentiation. Nature 2012, 483, 474–478. [Google Scholar] [CrossRef] [PubMed] [Green Version]
- Borger, D.R.; Goyal, L.; Yau, T.; Poon, R.T.; Ancukiewicz, M.; Deshpande, V.; Christiani, D.C.; Liebman, H.M.; Yang, H.; Kim, H.; et al. Circulating Oncometabolite 2-Hydroxyglutarate Is a Potential Surrogate Biomarker in Patients with Isocitrate Dehydrogenase-Mutant Intrahepatic Cholangiocarcinoma. Clin. Cancer Res. 2014, 20, 1884–1890. [Google Scholar] [CrossRef] [PubMed] [Green Version]
- Ježek, P. 2-Hydroxyglutarate in Cancer Cells. Antioxid. Redox Signal. 2020, 33, 903–926. [Google Scholar] [CrossRef] [Green Version]
- Smolková, K.; Dvorak, A.; Zelenka, J.; Vítek, L.; Jezek, P. Reductive carboxylation and 2-hydroxyglutarate formation by wild-type IDH2 in breast carcinoma cells. Int. J. Biochem. Cell Biol. 2015, 65, 125–133. [Google Scholar] [CrossRef]
- Smolková, K.; Špačková, J.; Gotvaldová, K.; Dvořák, A.; Křenková, A.; Hubálek, M.; Holendová, B.; Vítek, L.; Ježek, P. SIRT3 and GCN5L regulation of NADP+ and NADPH-driven reactions of mitochondrial isocitrate dehydrogenase IDH2. Sci. Rep. 2020, 10, 1–12. [Google Scholar] [CrossRef]
- Dvořák, A.; Zelenka, J.; Smolková, K.; Vítek, L.; Ježek, P. Background levels of neomorphic 2-hydroxyglutarate facilitate proliferation of primary fibroblasts. Physiol. Res. 2017, 66. [Google Scholar] [CrossRef]
- Terunuma, A.; Putluri, N.; Mishra, P.; Mathé, E.A.; Dorsey, T.H.; Yi, M.; Wallace, T.A.; Issaq, H.J.; Zhou, M.; Killian, J.K.; et al. MYC-driven accumulation of 2-hydroxyglutarate is associated with breast cancer prognosis. J. Clin. Investig. 2014, 124, 398–412. [Google Scholar] [CrossRef] [PubMed] [Green Version]
- Struys, E.A.; Verhoeven, N.M.; Brink, H.J.T.; Wickenhagen, W.V.; Gibson, K.M.; Jakobs, C. Kinetic characterization of human hydroxyacid-oxoacid transhydrogenase: Relevance toD-2-hydroxyglutaric and γ-hydroxybutyric acidurias. J. Inherit. Metab. Dis. 2005, 28, 921–930. [Google Scholar] [CrossRef] [PubMed]
- Mishra, P.; Tang, W.; Putluri, V.; Dorsey, T.H.; Jin, F.; Wang, F.; Zhu, D.; Amable, L.; Deng, T.; Zhang, S.; et al. ADHFE1 is a breast cancer oncogene and induces metabolic reprogramming. J. Clin. Investig. 2017, 128, 323–340. [Google Scholar] [CrossRef] [PubMed] [Green Version]
- Nadtochiy, S.M.; Schafer, X.; Fu, D.; Nehrke, K.; Munger, J.; Brookes, P.S. Acidic pH Is a Metabolic Switch for 2-Hydroxyglutarate Generation and Signaling. J. Biol. Chem. 2016, 291, 20188–20197. [Google Scholar] [CrossRef] [PubMed] [Green Version]
- Intlekofer, A.M.; Dematteo, R.G.; Venneti, S.; Finley, L.W.; Lu, C.; Judkins, A.R.; Rustenburg, A.S.; Grinaway, P.B.; Chodera, J.D.; Cross, J.R.; et al. Hypoxia Induces Production of L-2-Hydroxyglutarate. Cell Metab. 2015, 22, 304–311. [Google Scholar] [CrossRef] [Green Version]
- Kranendijk, M.; Struys, E.A.; Salomons, G.S.; Van Der Knaap, M.S.; Jakobs, C. Progress in understanding 2-hydroxyglutaric acidurias. J. Inherit. Metab. Dis. 2012, 35, 571–587. [Google Scholar] [CrossRef] [Green Version]
- Fendt, S.-M.; Bell, E.L.; Keibler, M.A.; Olenchock, B.A.; Mayers, J.R.; Wasylenko, T.M.; Vokes, N.I.; Guarente, L.; Heiden, M.G.V.; Stephanopoulos, G. Reductive glutamine metabolism is a function of the α-ketoglutarate to citrate ratio in cells. Nat. Commun. 2013, 4, 1–11. [Google Scholar] [CrossRef] [Green Version]
- Gameiro, P.A.; Yang, J.; Metelo, A.M.; Pérez-Carro, R.; Baker, R.; Wang, Z.; Arreola, A.; Rathmell, W.K.; Olumi, A.; López-Larrubia, P.; et al. In Vivo HIF-Mediated Reductive Carboxylation Is Regulated by Citrate Levels and Sensitizes VHL-Deficient Cells to Glutamine Deprivation. Cell Metab. 2013, 17, 372–385. [Google Scholar] [CrossRef] [Green Version]
- Sazanov, L.A.; Jackson, J.B. Proton-translocating transhydrogenase and NAD-and NADP-linked isocitrate dehydrogenases operate in a substrate cycle which contributes to fine regulation of the tricarboxylic acid cycle activity in mitochondria. FEBS Lett. 1994, 344, 109–116. [Google Scholar] [CrossRef] [Green Version]
- Mullen, A.R.; Hu, Z.; Shi, X.; Jiang, L.; Boroughs, L.K.; Kovacs, Z.; Boriack, R.; Rakheja, D.; Sullivan, L.B.; Linehan, W.M.; et al. Oxidation of Alpha-Ketoglutarate Is Required for Reductive Carboxylation in Cancer Cells with Mitochondrial Defects. Cell Rep. 2014, 7, 1679–1690. [Google Scholar] [CrossRef] [Green Version]
- Gameiro, P.A.; Laviolette, L.A.; Kelleher, J.K.; Iliopoulos, O.; Stephanopoulos, G. Cofactor balance by nicotinamide nucleotide transhydrogenase (NNT) coordinates reductive carboxylation and glucose catabolism in the tricarboxylic acid (TCA) cycle. J. Biol. Chem. 2013, 288, 12967–12977. [Google Scholar] [CrossRef] [PubMed] [Green Version]
- Dlasková, A.; Špaček, T.; Engstová, H.; Špačková, J.; Schröfel, A.; Holendová, B.; Smolková, K.; Plecitá-Hlavatá, L.; Ježek, P. Mitochondrial cristae narrowing upon higher 2-oxoglutarate load. Biochim. Biophys. Acta Bioenerg. 2019, 1860, 659–678. [Google Scholar] [CrossRef] [PubMed]
- Ferreira, A.P.S.; Cassago, A.; Gonçalves, K.A.; Dias, M.M.; Adamoski, D.; Ascenção, C.F.R.; Honorato, R.V.; Oliveira, J.F.; Ferreira, I.M.; Fornezari, C.; et al. Active Glutaminase C Self-assembles into a Supratetrameric Oligomer that Can be Disrupted by an Allosteric Inhibitor. J. Biol. Chem. 2013, 288, 28009. [Google Scholar] [CrossRef] [PubMed] [Green Version]
- Wise, D.R.; Ward, P.S.; Shay, J.E.S.; Cross, J.R.; Gruber, J.J.; Sachdeva, U.M.; Platt, J.M.; DeMatteo, R.G.; Simon, M.C.; Thompson, C.B. Hypoxia promotes isocitrate dehydrogenase-dependent carboxylation of α-ketoglutarate to citrate to support cell growth and viability. Proc. Natl. Acad. Sci. USA 2011, 108, 19611–19616. [Google Scholar] [CrossRef] [PubMed] [Green Version]
- Yang, L.; Moss, T.; Mangala, L.S.; Marini, J.; Zhao, H.; Wahlig, S.; Armaiz-Pena, G.; Jiang, D.; Achreja, A.; Win, J.; et al. Metabolic shifts toward glutamine regulate tumor growth, invasion and bioenergetics in ovarian cancer. Mol. Syst. Biol. 2014, 10, 728. [Google Scholar] [CrossRef]
- Ward, P.S.; Lu, C.; Cross, J.R.; Abdel-Wahab, O.; Levine, R.L.; Schwartz, G.K.; Thompson, C.B. The potential for isocitrate dehydrogenase mutations to produce 2-hydroxyglutarate depends on allele specificity and subcellular compartmentalization. J. Biol. Chem. 2013, 288, 3804–3815. [Google Scholar] [CrossRef] [Green Version]
- Dexter, J.P.; Ward, P.S.; Dasgupta, T.; Hosios, A.M.; Gunawardena, J.; Vander Heiden, M.G. Lack of evidence for substrate channeling or flux between wildtype and mutant isocitrate dehydrogenase to produce the oncometabolite 2-hydroxyglutarate. J. Biol. Chem. 2018, 293, 20051–20061. [Google Scholar] [CrossRef] [Green Version]
- Yu, W.; Dittenhafer-Reed, K.E.; Denu, J.M. SIRT3 Protein Deacetylates Isocitrate Dehydrogenase 2 (IDH2) and Regulates Mitochondrial Redox Status. J. Biol. Chem. 2012, 287, 14078–14086. [Google Scholar] [CrossRef] [Green Version]
- Lu, W.; Wang, L.; Chen, L.; Hui, S.; Rabinowitz, J.D. Extraction and Quantitation of Nicotinamide Adenine Dinucleotide Redox Cofactors. Antioxid. Redox Signal. 2018, 28, 167–179. [Google Scholar] [CrossRef]
- Cajka, T.; Smilowitz, J.T.; Fiehn, O. Validating quantitative untargeted lipidomics across nine liquid chromatography-high-resolution mass spectrometry platforms. Anal. Chem. 2017, 89, 12360–12368. [Google Scholar] [CrossRef]
- Janovska, P.; Melenovsky, V.; Svobodova, M.; Havlenova, T.; Kratochvilova, H.; Haluzik, M.; Hoskova, E.; Pelikanova, T.; Kautzner, J.; Monzo, L.; et al. Dysregulation of epicardial adipose tissue in cachexia due to heart failure: The role of natriuretic peptides and cardiolipin. J. Cachexia Sarcopenia Muscle 2020, 11, 1614–1627. [Google Scholar] [CrossRef] [PubMed]
- Cheng, Q.Y.; Xiong, J.; Huang, W.; Ma, Q.; Ci, W.; Feng, Y.Q.; Yuan, B.F. Sensitive Determination of Onco-metabolites of D-and L-2-hydroxyglutarate Enantiomers by Chiral Derivatization Combined with Liquid Chromatography/Mass Spectrometry Analysis. Sci. Rep. 2015, 5, 1–11. [Google Scholar] [CrossRef] [PubMed] [Green Version]


Publisher’s Note: MDPI stays neutral with regard to jurisdictional claims in published maps and institutional affiliations. |
© 2021 by the authors. Licensee MDPI, Basel, Switzerland. This article is an open access article distributed under the terms and conditions of the Creative Commons Attribution (CC BY) license (https://creativecommons.org/licenses/by/4.0/).
Share and Cite
Špačková, J.; Gotvaldová, K.; Dvořák, A.; Urbančoková, A.; Pospíšilová, K.; Větvička, D.; Leguina-Ruzzi, A.; Tesařová, P.; Vítek, L.; Ježek, P.; et al. Biochemical Background in Mitochondria Affects 2HG Production by IDH2 and ADHFE1 in Breast Carcinoma. Cancers 2021, 13, 1709. https://doi.org/10.3390/cancers13071709
Špačková J, Gotvaldová K, Dvořák A, Urbančoková A, Pospíšilová K, Větvička D, Leguina-Ruzzi A, Tesařová P, Vítek L, Ježek P, et al. Biochemical Background in Mitochondria Affects 2HG Production by IDH2 and ADHFE1 in Breast Carcinoma. Cancers. 2021; 13(7):1709. https://doi.org/10.3390/cancers13071709
Chicago/Turabian StyleŠpačková, Jitka, Klára Gotvaldová, Aleš Dvořák, Alexandra Urbančoková, Kateřina Pospíšilová, David Větvička, Alberto Leguina-Ruzzi, Petra Tesařová, Libor Vítek, Petr Ježek, and et al. 2021. "Biochemical Background in Mitochondria Affects 2HG Production by IDH2 and ADHFE1 in Breast Carcinoma" Cancers 13, no. 7: 1709. https://doi.org/10.3390/cancers13071709