
Leaf Surface Reflectance Does Not Affect Biophysical Traits Modelling from VIS-NIR Spectra in Plants with Sparsely Distributed Trichomes


Abstract
:1. Introduction
2. Materials and Methods
2.1. Plant Material and Anatomical Structure Assessment
2.1.1. Plant Material and Cultivation
2.1.2. Anatomical Structure Assessment
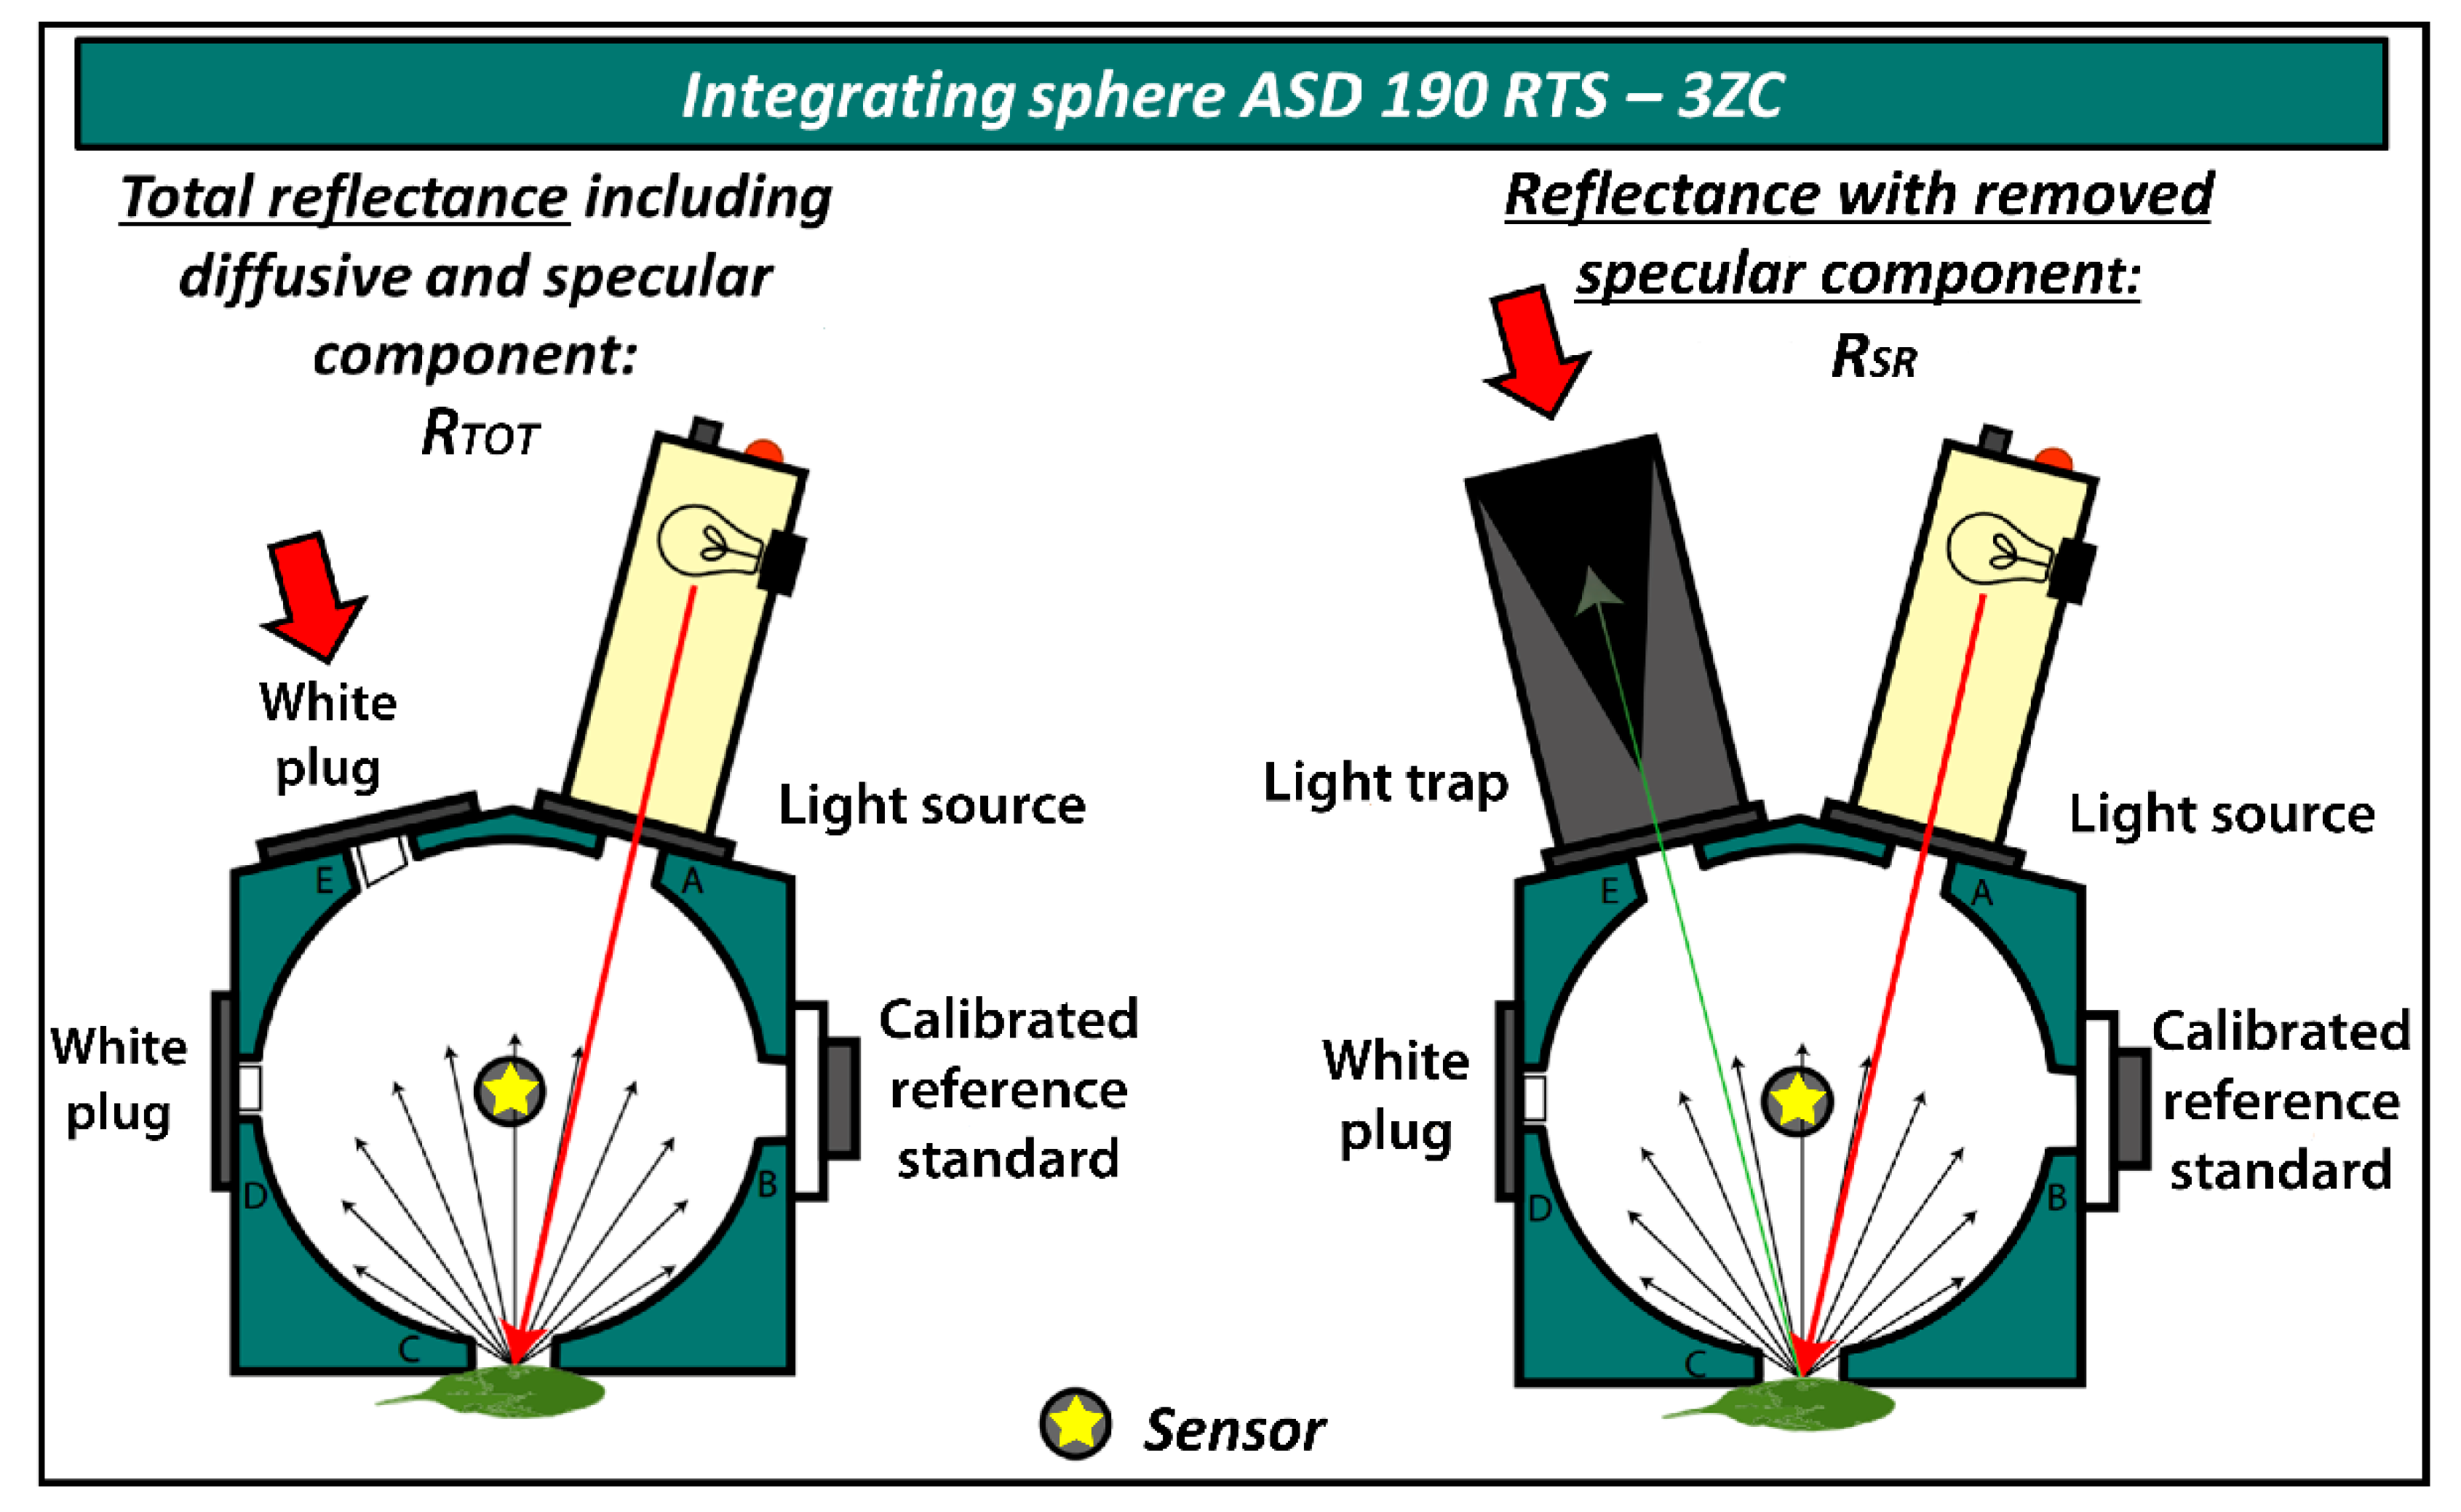
2.2. Leaf Optical Properties Assessment
2.3. Biochemical Assessment of Leaf Chlorophyll and Carotenoids Contents
2.4. Data Processing and Statistical Analysis
2.4.1. Biophysical Properties
2.4.2. Visualisation of Spectral Curves
2.4.3. Exploring of Leaf Specular Reflectance by Using PCA
2.4.4. PLSR Modelling
3. Results
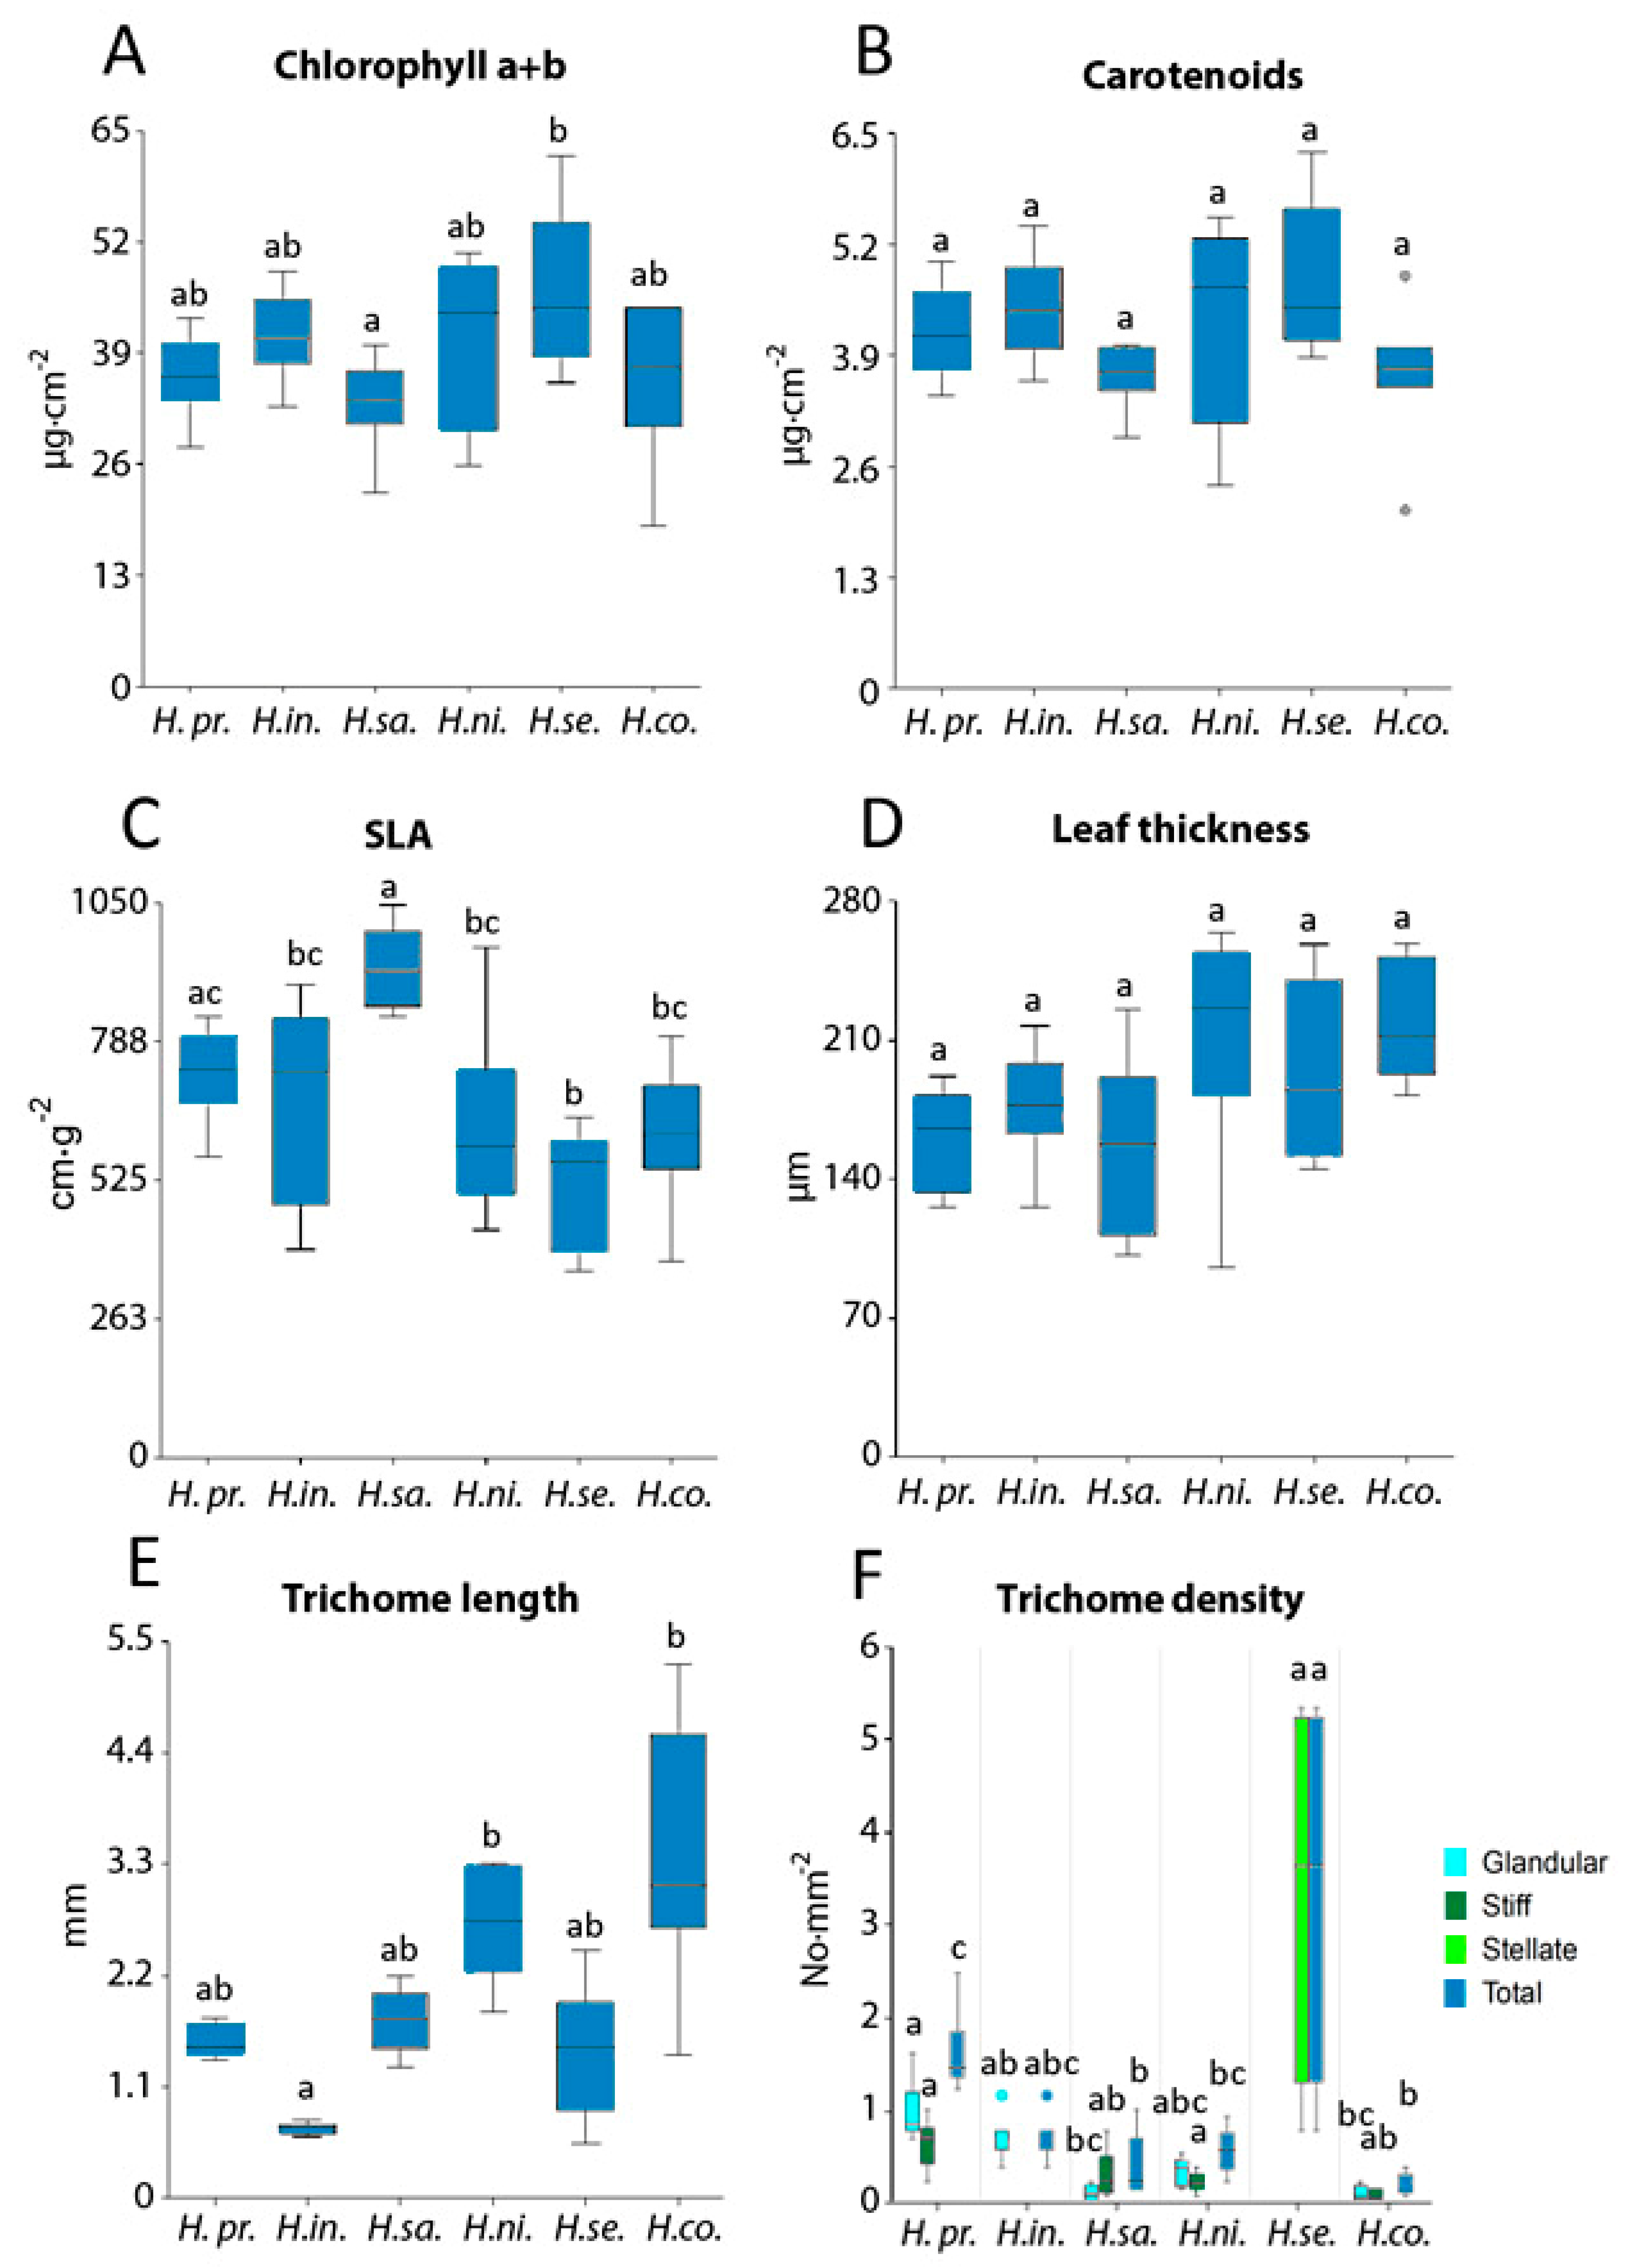
3.1. Leaf Biochemical and Structural Traits
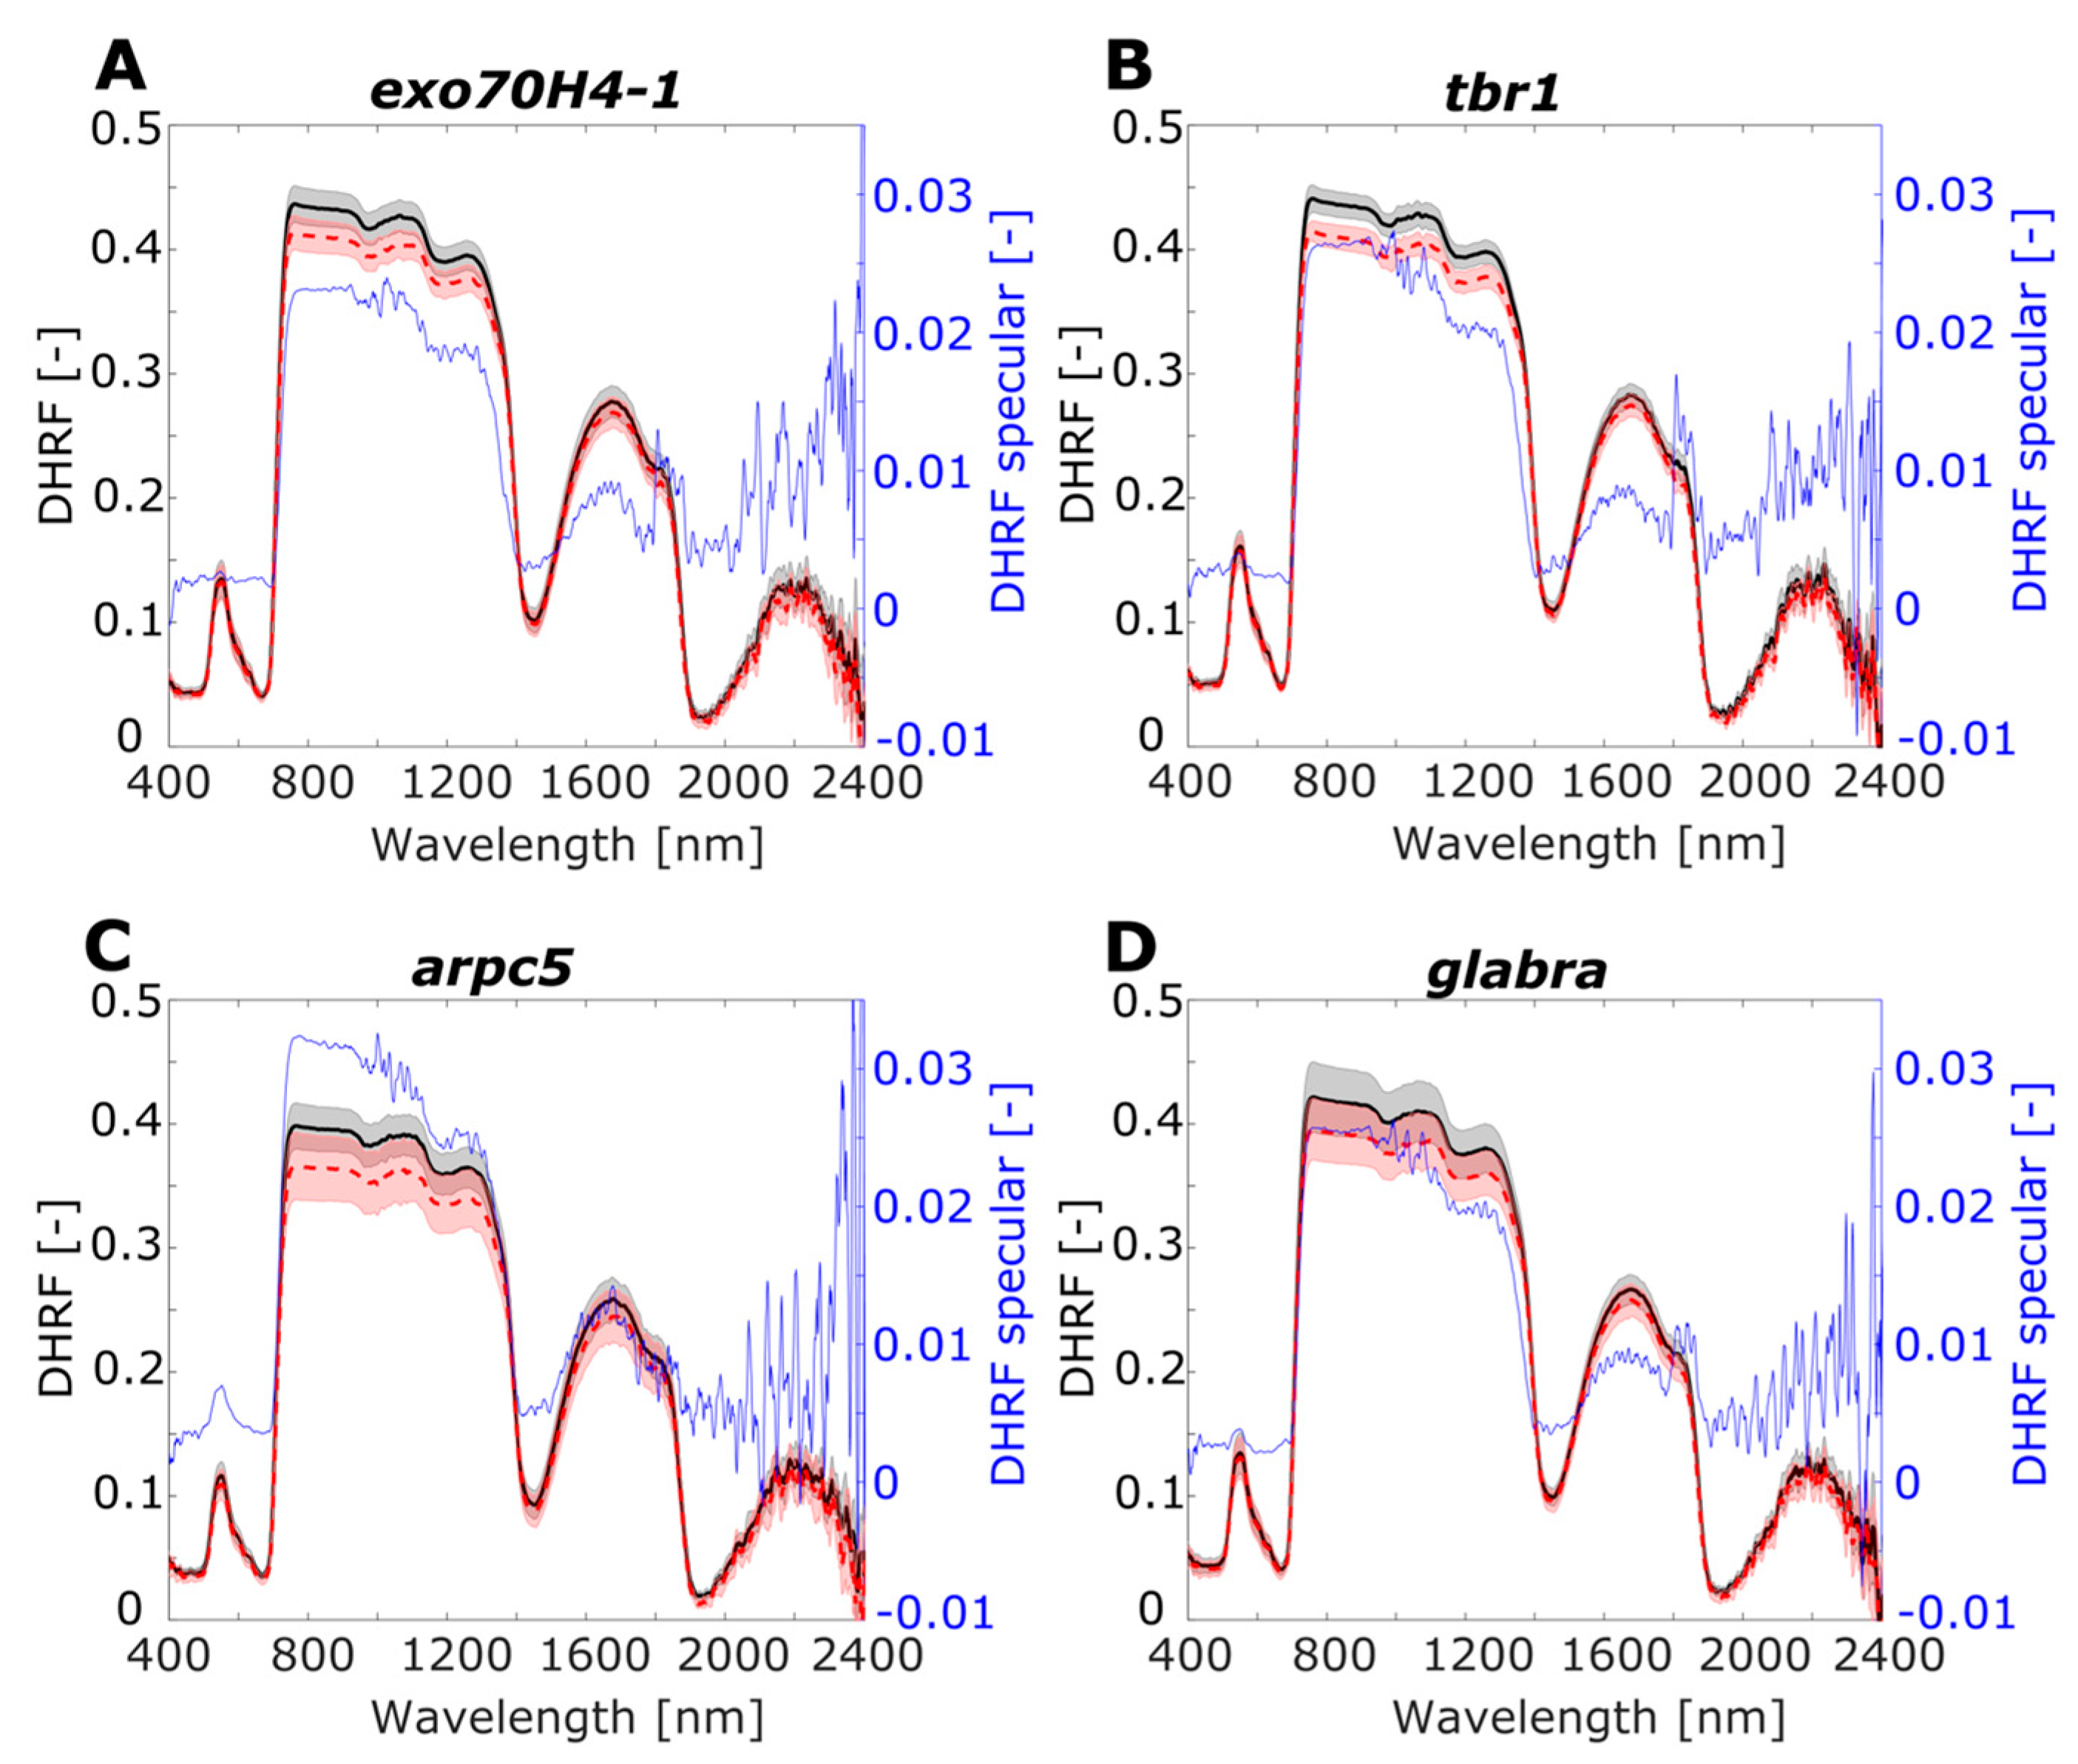
3.2. Leaf Optical Properties: Total, Diffuse, and Specular Reflectance
3.3. PCA of Specular Reflectance—Effect of Leaf Surface Properties
3.4. Predicting Leaf Biochemical and Structural Traits by PLSR Models
4. Discussion
4.1. Structural and Biochemical Parameters Variation
4.1.1. Trichome Density
4.1.2. Ecophysiological Function of Leaf Surface
4.1.3. Leaf Biochemical Traits
4.2. Optical Properties Related to Leaf Surface Traits
4.3. PLSR Modelling of Structural and Biochemical Traits
5. Conclusions
Author Contributions
Funding
Institutional Review Board Statement
Informed Consent Statement
Data Availability Statement
Acknowledgments
Conflicts of Interest
References
- Ustin, S.L.; Gitelson, A.A.; Jacquemoud, S.; Schaepman, M.; Asner, G.P.; Gamon, J.A.; Zarco-Tejada, P. Retrieval of Foliar Information about Plant Pigment Systems from High Resolution Spectroscopy. Remote Sens. Environ. 2009, 113, S67–S77. [Google Scholar] [CrossRef] [Green Version]
- Flood, P.J.; Kruijer, W.; Schnabel, S.K.; van der Schoor, R.; Jalink, H.; Snel, J.F.H.; Harbinson, J.; Aarts, M.G.M. Phenomics for Photosynthesis, Growth and Reflectance in Arabidopsis Thaliana Reveals Circadian and Long-Term Fluctuations in Heritability. Plant Methods 2016, 12, 1–14. [Google Scholar] [CrossRef] [Green Version]
- Cotrozzi, L.; Peron, R.; Tuinstra, M.R.; Mickelbart, M.V.; Couture, J.J. Spectral Phenotyping of Physiological and Anatomical Leaf Traits Related with Maize Water Status. Plant Physiol. 2020, 184, 1363–1377. [Google Scholar] [CrossRef] [PubMed]
- Nicodemus, F.E.; Richmond, J.C.; Hsia, J.J. Geometrical Considerations and Nomenclature for Reflectance; Institute for Basic Standards, National Bureau of Standards: Washington, DC, USA, 1977.
- Jacquemoud, S.; Ustin, S. Leaf Optical Properties; Cambridge University Press: Cambridge, UK, 2019; ISBN 978-1-108-48126-7. [Google Scholar]
- Breece, H.T.; Holmes, R.A. Bidirectional Scattering Characteristics of Healthy Green Soybean and Corn Leaves in Vivo. Appl. Opt. 1971, 10, 119. [Google Scholar] [CrossRef]
- Gates, D.M.; Keegan, H.J.; Schleter, J.C.; Weidner, V.R. Spectral Properties of Plants. Appl. Opt. 1965, 4, 11–20. [Google Scholar] [CrossRef]
- Grant, L. Diffuse and Specular Characteristics of Leaf Reflectance. Remote Sens. Environ. 1987, 22, 309–322. [Google Scholar] [CrossRef]
- Kokaly, R.F.; Asner, G.P.; Ollinger, S.V.; Martin, M.E.; Wessman, C.A. Characterizing Canopy Biochemistry from Imaging Spectroscopy and Its Application to Ecosystem Studies. Remote Sens. Environ. 2009, 113, S78–S91. [Google Scholar] [CrossRef]
- Allen, W.A.; Gausman, H.W.; Richardson, A.J. Willstätter-Stoll Theory of Leaf Reflectance Evaluated by Ray Tracing. Appl. Opt. AO 1973, 12, 2448–2453. [Google Scholar] [CrossRef]
- Xiao, Y.; Tholen, D.; Zhu, X.-G. The Influence of Leaf Anatomy on the Internal Light Environment and Photosynthetic Electron Transport Rate: Exploration with a New Leaf Ray Tracing Model. J. Exp. Bot. 2016, 67, 6021–6035. [Google Scholar] [CrossRef] [Green Version]
- Sinclair, T.R.; Schreiber, M.M.; Hoffer, R.M. Diffuse Reflectance Hypothesis for the Pathway of Solar Radiation Through Leaves1. Agron. J. 1973, 65, 276–283. [Google Scholar] [CrossRef]
- Vanderbilt, V.C.; Grant, L.; Daughtry, C.S.T. Polarization of Light Scattered by Vegetation. Proc. IEEE 1985, 73, 1012–1024. [Google Scholar] [CrossRef]
- Greiner, M.A.; Duncan, B.D.; Dierking, M.P. Bidirectional Scattering Distribution Functions of Maple and Cottonwood Leaves. Appl. Opt. 2007, 46, 6485. [Google Scholar] [CrossRef] [PubMed]
- Grant, L.; Daughtry, C.S.T.; Vanderbilt, V.C. Polarized and Specular Reflectance Variation with Leaf Surface Features. Physiol. Plant. 1993, 88, 1–9. [Google Scholar] [CrossRef]
- Schaepman-Strub, G.; Schaepman, M.E.; Painter, T.H.; Dangel, S.; Martonchik, J.V. Reflectance Quantities in Optical Remote Sensing—Definitions and Case Studies. Remote Sens. Environ. 2006, 103, 27–42. [Google Scholar] [CrossRef]
- Brakke, T.W.; Smith, J.A.; Harnden, J.M. Bidirectional Scattering of Light from Tree Leaves. Remote Sens. Environ. 1989, 29, 175–183. [Google Scholar] [CrossRef]
- Li, Y.; Chen, Y.; Huang, J. An Approach to Improve Leaf Pigment Content Retrieval by Removing Specular Reflectance Through Polarization Measurements. IEEE Trans. Geosci. Remote Sens. 2019, 57, 2173–2186. [Google Scholar] [CrossRef]
- Vanderbilt, V.C.; Grant, L. Polarization Photometer to Measure Bidirectional Reflectance Factor R(55°, 0°; 55°,180°) of Leaves. Opt. Eng. 1986, 24, 566–571. [Google Scholar] [CrossRef]
- McClendon, J.H. The Micro-Optics of Leaves. I. Patterns of Reflection from the Epidermis. Am. J. Bot. 1984, 71, 1391–1397. [Google Scholar] [CrossRef]
- ASD Inc. Integrating Sphere User Manual. Available online: https://www.mapping-solutions.co.uk/downloads/data/ASD/Accessories_Brochure/A1A15.pdf (accessed on 15 October 2021).
- Datt, B. Remote Sensing of Chlorophyll a, Chlorophyll b, Chlorophyll A+ b, and Total Carotenoid Content in Eucalyptus Leaves. Remote Sens. Environ. 1998, 66, 111–121. [Google Scholar] [CrossRef]
- Datt, B. A New Reflectance Index for Remote Sensing of Chlorophyll Content in Higher Plants: Tests Using Eucalyptus Leaves. J. Plant Physiol. 1999, 154, 30–36. [Google Scholar] [CrossRef]
- Sims, D.A.; Gamon, J.A. Relationships between Leaf Pigment Content and Spectral Reflectance across a Wide Range of Species, Leaf Structures and Developmental Stages. Remote Sens. Environ. 2002, 81, 337–354. [Google Scholar] [CrossRef]
- Jay, S.; Bendoula, R.; Hadoux, X.; Féret, J.-B.; Gorretta, N. A Physically-Based Model for Retrieving Foliar Biochemistry and Leaf Orientation Using Close-Range Imaging Spectroscopy. Remote Sens. Environ. 2016, 177, 220–236. [Google Scholar] [CrossRef] [Green Version]
- Qiu, F.; Chen, J.; Croft, H.; Li, J.; Zhang, Q. Retrieving Leaf Chlorophyll Content by Incorporating Variable Leaf Surface Reflectance in the PROSPECT Model. Remote Sens. 2019, 11, 1572. [Google Scholar] [CrossRef] [Green Version]
- Bousquet, L.; Lachérade, S.; Jacquemoud, S.; Moya, I. Leaf BRDF Measurements and Model for Specular and Diffuse Components Differentiation. Remote Sens. Environ. 2005, 98, 201–211. [Google Scholar] [CrossRef]
- Vogelmann, T.C.; Gorton, H.L. Leaf: Light Capture in the Photosynthetic Organ. In The Structural Basis of Biological Energy Generation; Springer: Berlin/Heidelberg, Germany, 2014. [Google Scholar]
- Woolley, J.T. Reflectance and Transmittance of Light by Leaves. Plant Physiol. 1971, 47, 656–662. [Google Scholar] [CrossRef] [PubMed] [Green Version]
- Li, W.; Sun, Z.; Lu, S.; Omasa, K. Estimation of the Leaf Chlorophyll Content Using Multiangular Spectral Reflectance Factor. Plant Cell Environ. 2019, 42, 3152–3165. [Google Scholar] [CrossRef]
- Berry, Z.C.; Goldsmith, G.R. Diffuse Light and Wetting Differentially Affect Tropical Tree Leaf Photosynthesis. New Phytol. 2020, 225, 143–153. [Google Scholar] [CrossRef] [Green Version]
- Vanderbilt, V.C.; Grant, L.; Biehl, L.L.; Robinson, B.F. Specular, Diffuse, and Polarized Light Scattered by Two Wheat Canopies. Appl. Opt. 1985, 24, 2408. [Google Scholar] [CrossRef]
- Smith, W.K.; McClean, T.M. Adaptive Relationship Between Leaf Water Repellency, Stomatal Distribution, and Gas Exchange. Am. J. Bot. 1989, 76, 465–469. [Google Scholar] [CrossRef]
- van de Kerkhof, G.T.; Schertel, L.; Poon, R.; Jacucci, G.; Glover, B.J.; Vignolini, S. Disordered Wax Platelets on Tradescantia Pallida Leaves Create Golden Shine. Faraday Discuss. 2020, 223, 207–215. [Google Scholar] [CrossRef]
- Gates, D.M.; Tantraporn, W. The Reflectivity of Deciduous Trees and Herbaceous Plants in the Infrared to 25 Microns. Science 1952, 115, 613–616. [Google Scholar] [CrossRef] [PubMed]
- Holmes, M.G.; Keiller, D.R. Effects of Pubescence and Waxes on the Reflectance of Leaves in the Ultraviolet and Photosynthetic Wavebands: A Comparison of a Range of Species: Ultraviolet Leaf Reflectance. Plant Cell Environ. 2002, 25, 85–93. [Google Scholar] [CrossRef]
- Gausman, H.W.; Cardenas, R. Effect of Leaf Pubescence of Gynura Aurantiaca on Light Reflectance. Bot. Gaz. 1969, 130, 158–162. [Google Scholar] [CrossRef]
- Levizou, E.; Drilias, P.; Psaras, G.K.; Manetas, Y. Nondestructive Assessment of Leaf Chemistry and Physiology through Spectral Reflectance Measurements May Be Misleading When Changes in Trichome Density Co-Occur. New Phytol. 2005, 165, 463–472. [Google Scholar] [CrossRef]
- Buschmann, C.; Lenk, S.; Lichtenthaler, H.K. Reflectance Spectra and Images of Green Leaves with Different Tissue Structure and Chlorophyll Content. Isr. J. Plant Sci. 2012, 60, 49–64. [Google Scholar] [CrossRef]
- Meyerowitz, E.M.; Pruitt, R.E. Arabidopsis Thaliana and Plant Molecular Genetics. Sci. New Ser. 1985, 229, 1214–1218. [Google Scholar] [CrossRef]
- Kulich, I.; Vojtíková, Z.; Glanc, M.; Ortmannová, J.; Rasmann, S.; Žárský, V. Cell Wall Maturation of Arabidopsis Trichomes Is Dependent on Exocyst Subunit EXO70H4 and Involves Callose Deposition. Plant Physiol. 2015, 168, 120–131. [Google Scholar] [CrossRef] [PubMed] [Green Version]
- Potikha, T.; Delmer, D.P. A Mutant of Arabidopsis Thaliana Displaying Altered Patterns of Cellulose Deposition. Plant J. 1995, 7, 453–460. [Google Scholar] [CrossRef]
- Li, S.; Blanchoin, L.; Yang, Z.; Lord, E.M. The Putative Arabidopsis Arp2/3 Complex Controls Leaf Cell Morphogenesis. Plant Physiol. 2003, 132, 2034–2044. [Google Scholar] [CrossRef] [Green Version]
- McKelvie, A.D. A list of mutant genes in arabldopsis thaliana (l.) heynh. Radiat. Bot. 1961, 1, 233–241. [Google Scholar] [CrossRef]
- Marks, M.D.; Feldmann, K.A. Trichome Development in Arabidopsis Thaliana. 1. T-DNA Tagging GLABROUS1 Gene. Plant Cell 1989, 1, 1043–1050. [Google Scholar] [CrossRef]
- Monnier, A. Essai Monographique Sur Les Hieracium Et Quelques Genres Voisins; Hissette: Nancy, France, 1829. [Google Scholar]
- Zahradníček, J.; Chrtek, J. Cytotype Distribution and Phylogeography of Hieracium Intybaceum (Asteraceae): Cyto and Phylogeography of Hieracium Intybaceum. Bot. J. Linn. Soc. 2015, 179, 487–498. [Google Scholar] [CrossRef] [Green Version]
- Grass, S.; Zidorn, C.; Ellmerer, E.P.; Stuppner, H. Eudesmane Derivatives from Hieracium Intybaceum. Chem. Biodivers. 2004, 1, 353–360. [Google Scholar] [CrossRef]
- Haveman, R. Enkele opmerkelijke vondsten van Hieracium sabaudum L. s. str. op de Veluwe. Gorteria 2010, 34, 137–143. [Google Scholar]
- Chrtek, J. Hieracium Decipientiforme (the H. Nigrescens Group)—An Interesting Species of the Ukrainian Carpathians. Folia Geobot. 1997, 69, 121–128. [Google Scholar]
- Szeląg, Z. Taxonomic and Nomenclatural Notes on Hieracium Tubulare (Asteraceae) with Description of a New Species from the Eastern Carpathians. Ann. Bot. Fennici. 2006, 43, 310–314. [Google Scholar]
- Albrechtová, J.; Kubínová, Z.; Soukup, A.; Janáček, J. Image Analysis: Basic Procedures for Description of Plant Structures. In Plant Cell Morphogenesis: Methods and Protocols; Cvrčková, F., Žárský, V., Eds.; Springer: New York, NY, USA, 2019; pp. 109–119. ISBN 978-1-4939-9469-4. [Google Scholar]
- Gundersen, H.J.G.; Jensen, E.B. The Efficiency of Systematic Sampling in Stereology and Its Prediction. J. Microsc. 1987, 147, 229–263. [Google Scholar] [CrossRef]
- O’Brien, T.P.; Feder, N.; McCully, M.E. Polychromatic Staining of Plant Cell Walls by Toluidine Blue O. Protoplasma 1964, 59, 368–373. [Google Scholar] [CrossRef]
- Potůčková, M.; Červená, L.; Kupková, L.; Lhotáková, Z.; Lukeš, P.; Hanuš, J.; Novotný, J.; Albrechtová, J. Comparison of Reflectance Measurements Acquired with a Contact Probe and an Integration Sphere: Implications for the Spectral Properties of Vegetation at a Leaf Level. Sensors 2016, 16, 1801. [Google Scholar] [CrossRef] [Green Version]
- Porra, R.; Thompson, W.; Kriedemann, P. Determination of Accurate Extinction Coefficients and Simultaneous-Equations for Assaying Chlorophyll-a and Chlorophyll-B Extracted with 4 Different Solvents—Verification of the Concentration. Biochim. Biophys. Acta 1989, 975, 384–394. [Google Scholar] [CrossRef]
- Wellburn, A.R. The Spectral Determination of Chlorophylls a and b, as Well as Total Carotenoids, Using Various Solvents with Spectrophotometers of Different Resolution. J. Plant Physiol. 1994, 144, 307–313. [Google Scholar] [CrossRef]
- Esbensen, K.; Swarbrick, B.; Westad, F.; Whitcomb, P.J.; Anderson, M.J. Multivariate Data Analysis: An Introduction to Multivariate Analysis, Process Analytical Technology and Quality by Design; CAMO Software AS: Oslo, Norway, 2018; ISBN 978-82-691104-0-1. [Google Scholar]
- Zhao, N.; Wu, Z.; Zhang, Q.; Shi, X.; Ma, Q.; Qiao, Y. Optimization of Parameter Selection for Partial Least Squares Model Development. Sci. Rep. 2015, 5, 11647. [Google Scholar] [CrossRef] [Green Version]
- Kopačková, V.; Ben-Dor, E.; Carmon, N.; Notesco, G. Modelling Diverse Soil Attributes with Visible to Longwave Infrared Spectroscopy Using PLSR Employed by an Automatic Modelling Engine. Remote Sens. 2017, 9, 134. [Google Scholar] [CrossRef] [Green Version]
- Heise, H.M.; Damm, U.; Lampen, P.; Davies, A.N.; McIntyre, P.S. Spectral Variable Selection for Partial Least Squares Calibration Applied to Authentication and Quantification of Extra Virgin Olive Oils Using Fourier Transform Raman Spectroscopy. Appl. Spectrosc. AS 2005, 59, 1286–1294. [Google Scholar] [CrossRef]
- Telfer, A.; Bollman, K.M.; Poethig, R.S. Phase Change and the Regulation of Trichome Distribution in Arabidopsis Thaliana. Development 1997, 124, 645–654. [Google Scholar] [CrossRef]
- Hauser, M.-T.; Harr, B.; Schlötterer, C. Trichome Distribution in Arabidopsis Thaliana and Its Close Relative Arabidopsis Lyrata: Molecular Analysis of the Candidate Gene GLABROUS1. Mol. Biol. Evol. 2001, 18, 1754–1763. [Google Scholar] [CrossRef] [Green Version]
- Schreuder, M.D.J.; Brewer, C.A.; Heine, C. Modelled Influences of Non-Exchanging Trichomes on Leaf Boundary Layers and Gas Exchange. J. Theor. Biol. 2001, 210, 23–32. [Google Scholar] [CrossRef]
- Gottschlich, G.; Drenckhahn, D. Iconography of the Genus Hieracium in Central Europe—Part 1 General Description and Morphotypes. Forum Geobot. 2005, 2, 1–7. [Google Scholar]
- Chrtek, J.; Mráz, P.; Belyayev, A.; Paštová, L.; Mrázová, V.; Caklová, P.; Josefiová, J.; Zagorski, D.; Hartmann, M.; Jandová, M.; et al. Evolutionary History and Genetic Diversity of Apomictic Allopolyploids in Hieracium s.Str.: Morphological versus Genomic Features. Am. J. Bot. 2020, 107, 66–90. [Google Scholar] [CrossRef] [Green Version]
- Krak, K.; Mráz, P. Trichomes in the Tribe Lactuceae (Asteraceae)—Taxonomic Implications. Biologia 2008, 63, 616–630. [Google Scholar] [CrossRef]
- Billings, W.D.; Morris, R.J. Reflection of Visible and Infrared Radiation from Leaves of Different Ecological Groups. Am. J. Bot. 1951, 38, 327–331. [Google Scholar] [CrossRef]
- Shull, C.A. A Spectrophotometric Study of Reflection of Light from Leaf Surfaces. Bot. Gaz. 1929, 87, 583–607. [Google Scholar] [CrossRef]
- Mershon, J.P.; Becker, M.; Bickford, C.P. Linkage between Trichome Morphology and Leaf Optical Properties in New Zealand Alpine Pachycladon (Brassicaceae). N. Z. J. Bot. 2015, 53, 175–182. [Google Scholar] [CrossRef] [Green Version]
- Bell, C.C.; Curran, P.J. The Effect of Specular Reflectance on the Relationship between Reflectance and Vegetation Amount. Int. J. Remote Sens. 1992, 13, 2751–2757. [Google Scholar] [CrossRef]


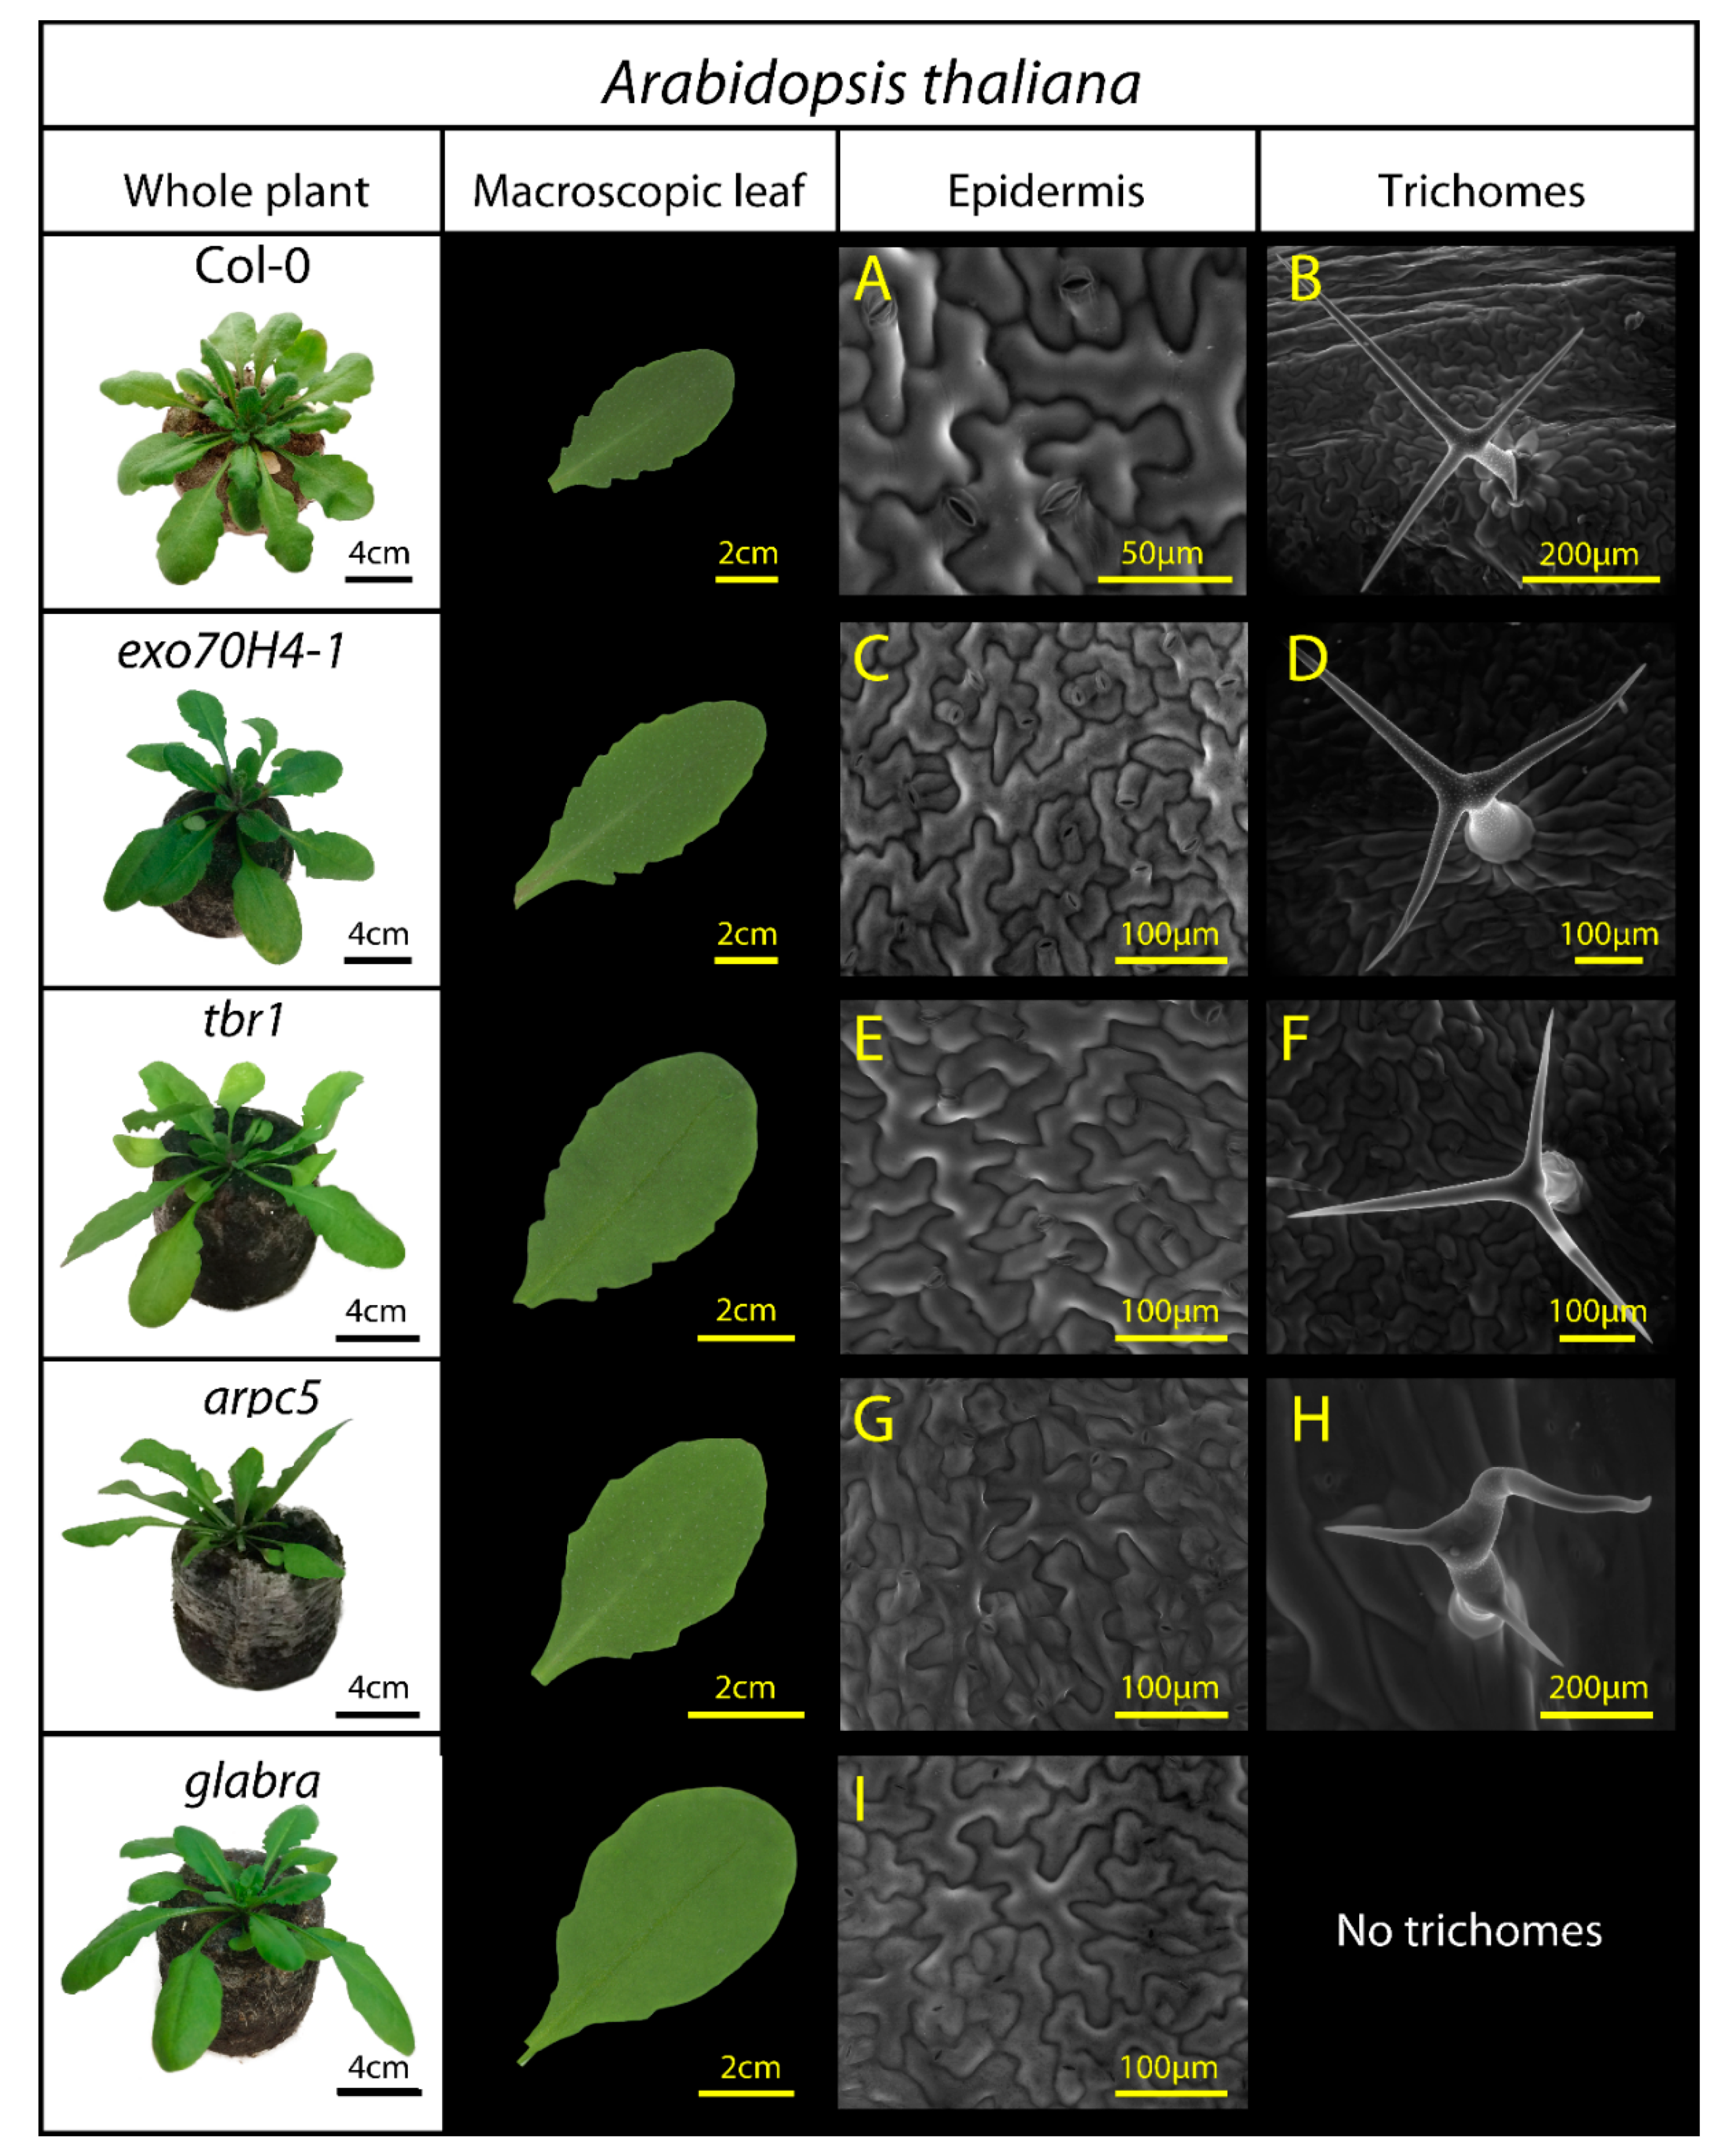
| A. thaliana Mutants | Name/Specification of Surface Structural Mutation | Reference |
|---|---|---|
| Col-0 | Arabidopsis thaliana L., wild type Columbia-0, Family: Brassicaceae; Small flowering plant with various properties that make it an excellent model organism. | [40] |
| exo70H4-1 | Exocyst 70H4-1 subunit/The secondary cell wall layer in trichomes is absent. | [41] |
| tbr1 | Trichome birefringence/reduced crystalline cellulose in trichomes. | [42] |
| arpc5 | Mutation in ARP2/3 complex subunit/Defects in the shape and adhesion of epidermal pavement cells and trichomes. Morphology with short branches. | [43] |
| glabra (gl1) | Few hairs occasionally on leaf margins or stems Glabra-mutation, only affects the trichome development pathway, i.e., trichomes are almost not present. | [44,45] |
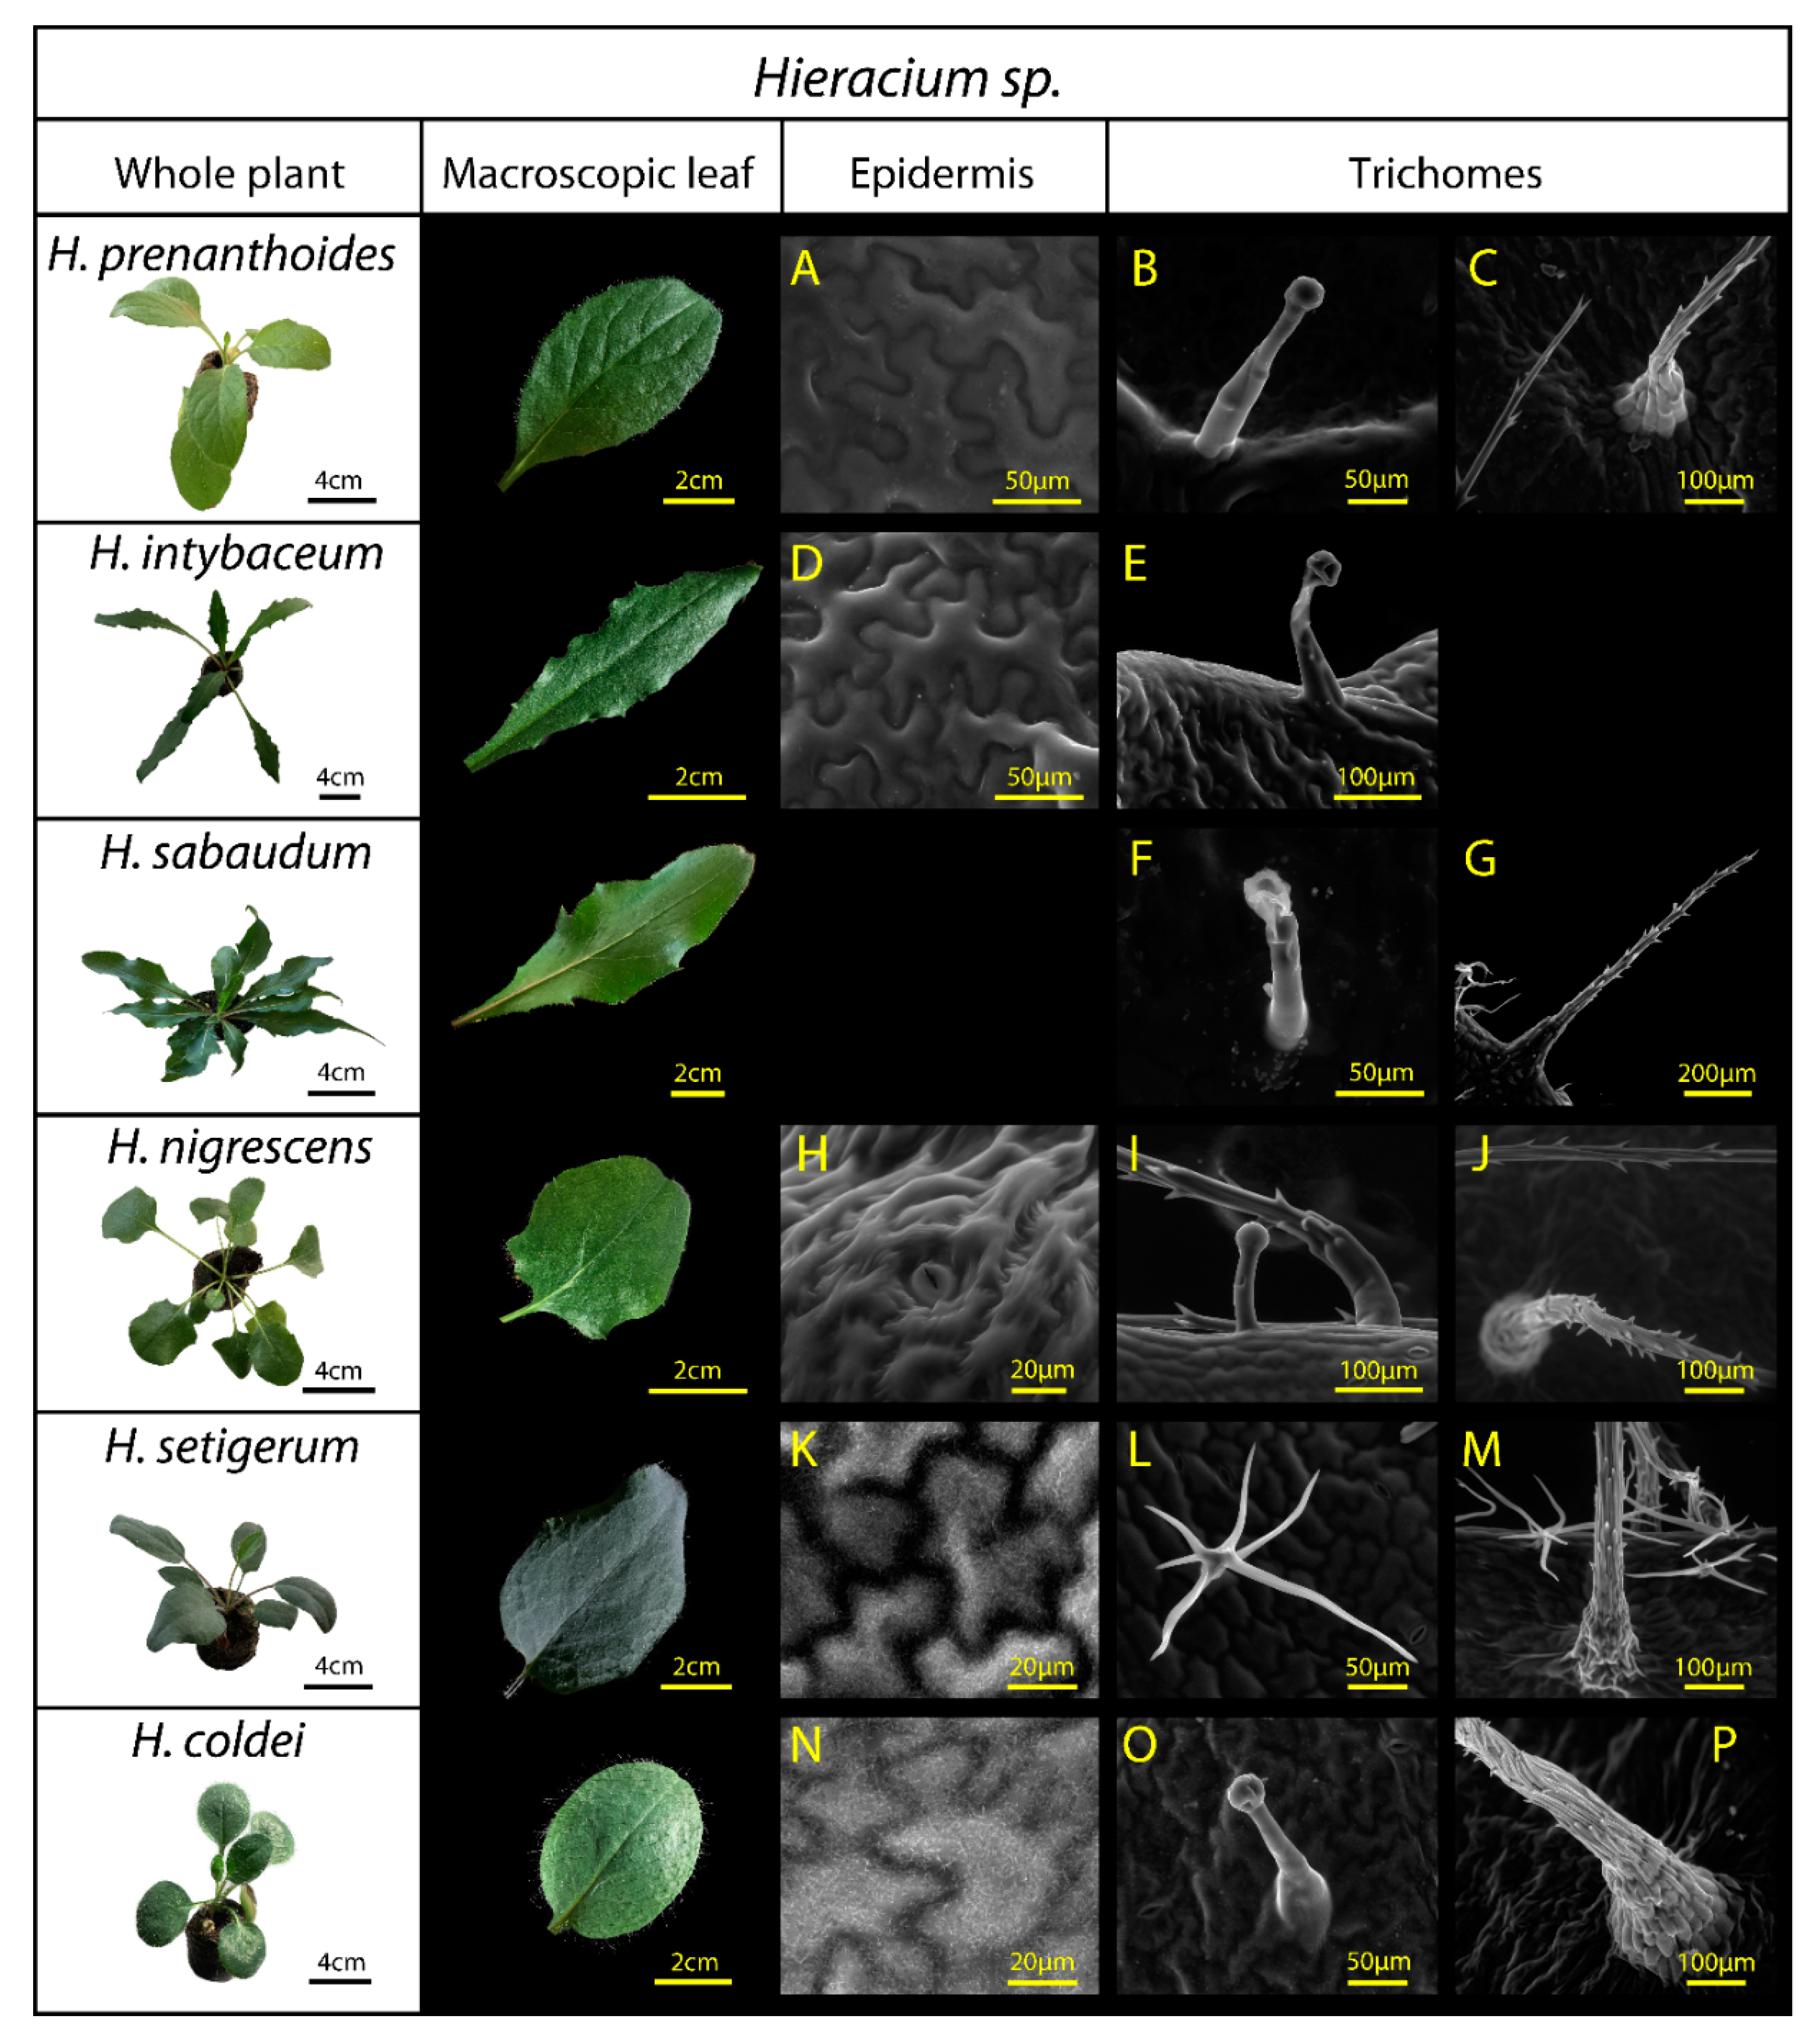
| Hieracium sp. | Leaf Description, Including Epidermal Surface Structure | Species Ecology | Reference |
|---|---|---|---|
| H. prenanthoides | Dark green adaxial side, lighter grey-green abaxial side. No info on trichomes available in literature. | Montane and submontane wild species, growing above timberline | [46] |
| H. intybaceum | Soft leaves covered with glandular trichomes that produce a sticky resinous exudate. | Alpine species sometimes considered as alpine endemite. | [47,48] |
| H. sabaudum | Tough leathery leaves, glabrous on adaxial side and dark green, abaxial side with scattered short trichomes. | European species growing in light deciduous and pine forests, rocky and anthropogenic stands | [49] |
| H. nigrescens | Hairy leaves, particularly on the abaxial side, trichomes usually localised on the midrib and petiole, short stalky trichomes on the leaf margins. | Subalpine and supramontane part of Krkonoše Mts. (Giant Mountains, Czechia), montane grasslands dominated by Nardus stricta | [50] |
| H. setigerum | Green-grey (waxes) leaf colour, rarely long simple scattered trichomes and branched trichomes on the adaxial leaf side, dendritically branched dense trichomes on the abaxial leaf side | Isolated stands in central and southeastern Europe, up to 1000 m a.s.l. | [46] |
| H. coldei | Green-grey (waxes) varying leaf colour, long simple scattered trichomes on the adaxial leaf side. | Relict habitats in crevices of andesite rock in the Harghita Mountains (East Carpathians) | [51] |
| RTOT | RSR | |||||||||||||
|---|---|---|---|---|---|---|---|---|---|---|---|---|---|---|
| Calibration | Validation | Calibration | Validation | |||||||||||
| Factors | RMSE | RMSE% | R2 | RMSE | RMSE% | R2 | Factors | RMSE | RMSE% | R2 | RMSE | RMSE% | R2 | |
| Arabidopsis | ||||||||||||||
| Chlorophyll a + b | 4 | 1.07 | 3.65 | 0.93 | 1.62 | 5.52 | 0.85 | 3 | 1.37 | 4.67 | 0.88 | 1.69 | 5.76 | 0.83 |
| Carotenoids | 3 | 0.23 | 6.47 | 0.72 | 0.27 | 7.59 | 0.64 | 3 | 0.22 | 6.19 | 0.74 | 0.26 | 7.31 | 0.70 |
| SLA | 6 | 38.88 | 4.93 | 0.91 | 110.58 | 14.02 | 0.27 | 5 | 52.88 | 6.70 | 0.83 | 98.35 | 12.47 | 0.46 |
| DW/FW | 4 | 0.01 | 11.47 | 0.65 | 0.01 | 11.47 | 0.47 | 4 | 0.01 | 11.47 | 0.66 | 0.01 | 11.47 | 0.50 |
| Trichome density | 1 | 0.35 | 84.17 | 0.10 | 0.37 | 88.98 | 0.02 | 5 | 0.16 | 38.48 | 0.79 | 0.35 | 84.17 | 0.12 |
| Hieracium | ||||||||||||||
| Chlorophyll a + b | 4 | 6.45 | 16.38 | 0.39 | 7.34 | 18.64 | 0.23 | 4 | 5.94 | 15.09 | 0.48 | 7.04 | 17.88 | 0.32 |
| Carotenoids | 4 | 0.72 | 16.99 | 0.28 | 0.80 | 18.87 | 0.15 | 4 | 0.66 | 15.57 | 0.39 | 0.74 | 17.46 | 0.24 |
| SLA | 5 | 74.29 | 11.09 | 0.82 | 103.30 | 15.42 | 0.66 | 5 | 69.00 | 10.30 | 0.84 | 91.79 | 13.70 | 0.73 |
| DW/FW | 5 | 0.01 | 10.44 | 0.79 | 0.01 | 10.44 | 0.67 | 5 | 0.01 | 10.44 | 0.82 | 0.01 | 10.44 | 0.74 |
| Trichome density | 4 | 0.82 | 54.85 | 0.55 | 0.97 | 64.89 | 0.42 | 4 | 0.78 | 52.18 | 0.59 | 0.93 | 62.21 | 0.43 |
| Leaf thickness | 3 | 28.62 | 15.37 | 0.57 | 30.59 | 16.43 | 0.53 | 3 | 29.58 | 15.89 | 0.54 | 32.55 | 17.48 | 0.45 |
| Palisade parench. | 4 | 14.93 | 24.74 | 0.63 | 17.45 | 28.91 | 0.53 | 4 | 14.44 | 23.93 | 0.65 | 16.90 | 28.00 | 0.57 |
| Spongy parench. | 5 | 16.75 | 22.52 | 0.75 | 20.61 | 27.71 | 0.63 | 4 | 18.39 | 24.73 | 0.70 | 21.85 | 29.38 | 0.58 |
| Trichome length | 2 | 0.73 | 39.97 | 0.37 | 0.84 | 45.99 | 0.16 | 2 | 0.74 | 40.52 | 0.35 | 0.90 | 49.28 | 0.10 |
Publisher’s Note: MDPI stays neutral with regard to jurisdictional claims in published maps and institutional affiliations. |
© 2021 by the authors. Licensee MDPI, Basel, Switzerland. This article is an open access article distributed under the terms and conditions of the Creative Commons Attribution (CC BY) license (https://creativecommons.org/licenses/by/4.0/).
Share and Cite
Neuwirthová, E.; Lhotáková, Z.; Lukeš, P.; Albrechtová, J. Leaf Surface Reflectance Does Not Affect Biophysical Traits Modelling from VIS-NIR Spectra in Plants with Sparsely Distributed Trichomes. Remote Sens. 2021, 13, 4144. https://doi.org/10.3390/rs13204144
Neuwirthová E, Lhotáková Z, Lukeš P, Albrechtová J. Leaf Surface Reflectance Does Not Affect Biophysical Traits Modelling from VIS-NIR Spectra in Plants with Sparsely Distributed Trichomes. Remote Sensing. 2021; 13(20):4144. https://doi.org/10.3390/rs13204144
Chicago/Turabian StyleNeuwirthová, Eva, Zuzana Lhotáková, Petr Lukeš, and Jana Albrechtová. 2021. "Leaf Surface Reflectance Does Not Affect Biophysical Traits Modelling from VIS-NIR Spectra in Plants with Sparsely Distributed Trichomes" Remote Sensing 13, no. 20: 4144. https://doi.org/10.3390/rs13204144