Uncovering Demographic Trends and Recent Urban Expansion in Metropolitan Regions: A Paradigmatic Case Study

 , ,
, ,
Abstract
:1. Introduction
2. Methodology
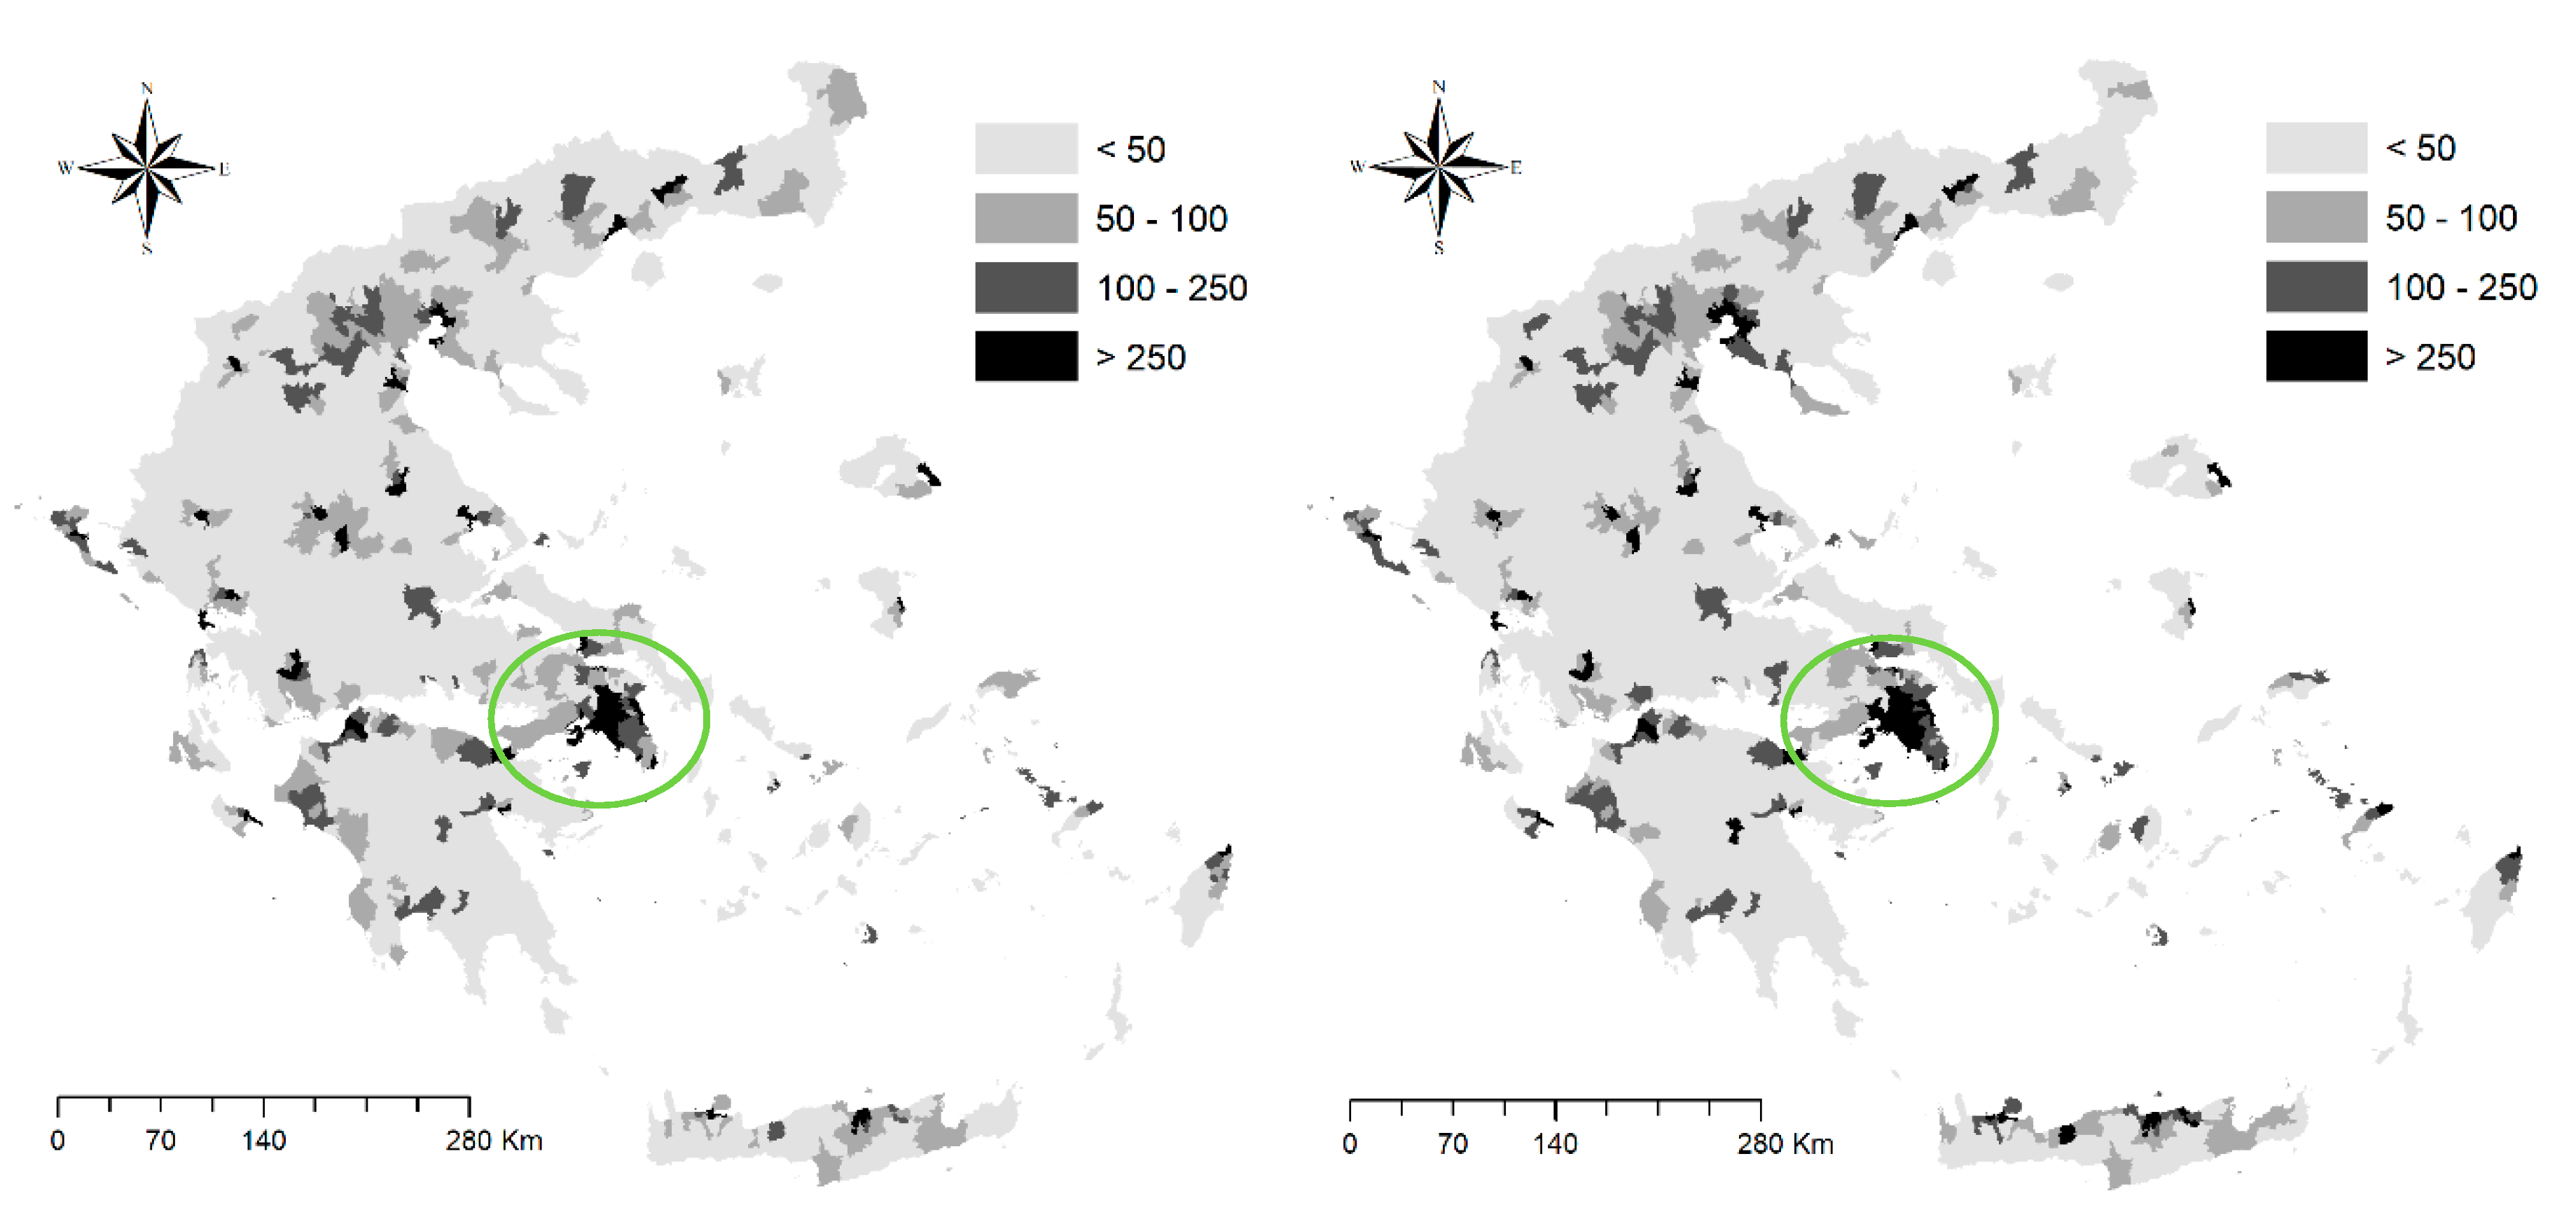
2.1. Study Area
2.2. Data Sources and Demographic Variables
2.3. Statistical Analysis
3. Results
3.1. Descriptive Analysis of Population Changes in Athens
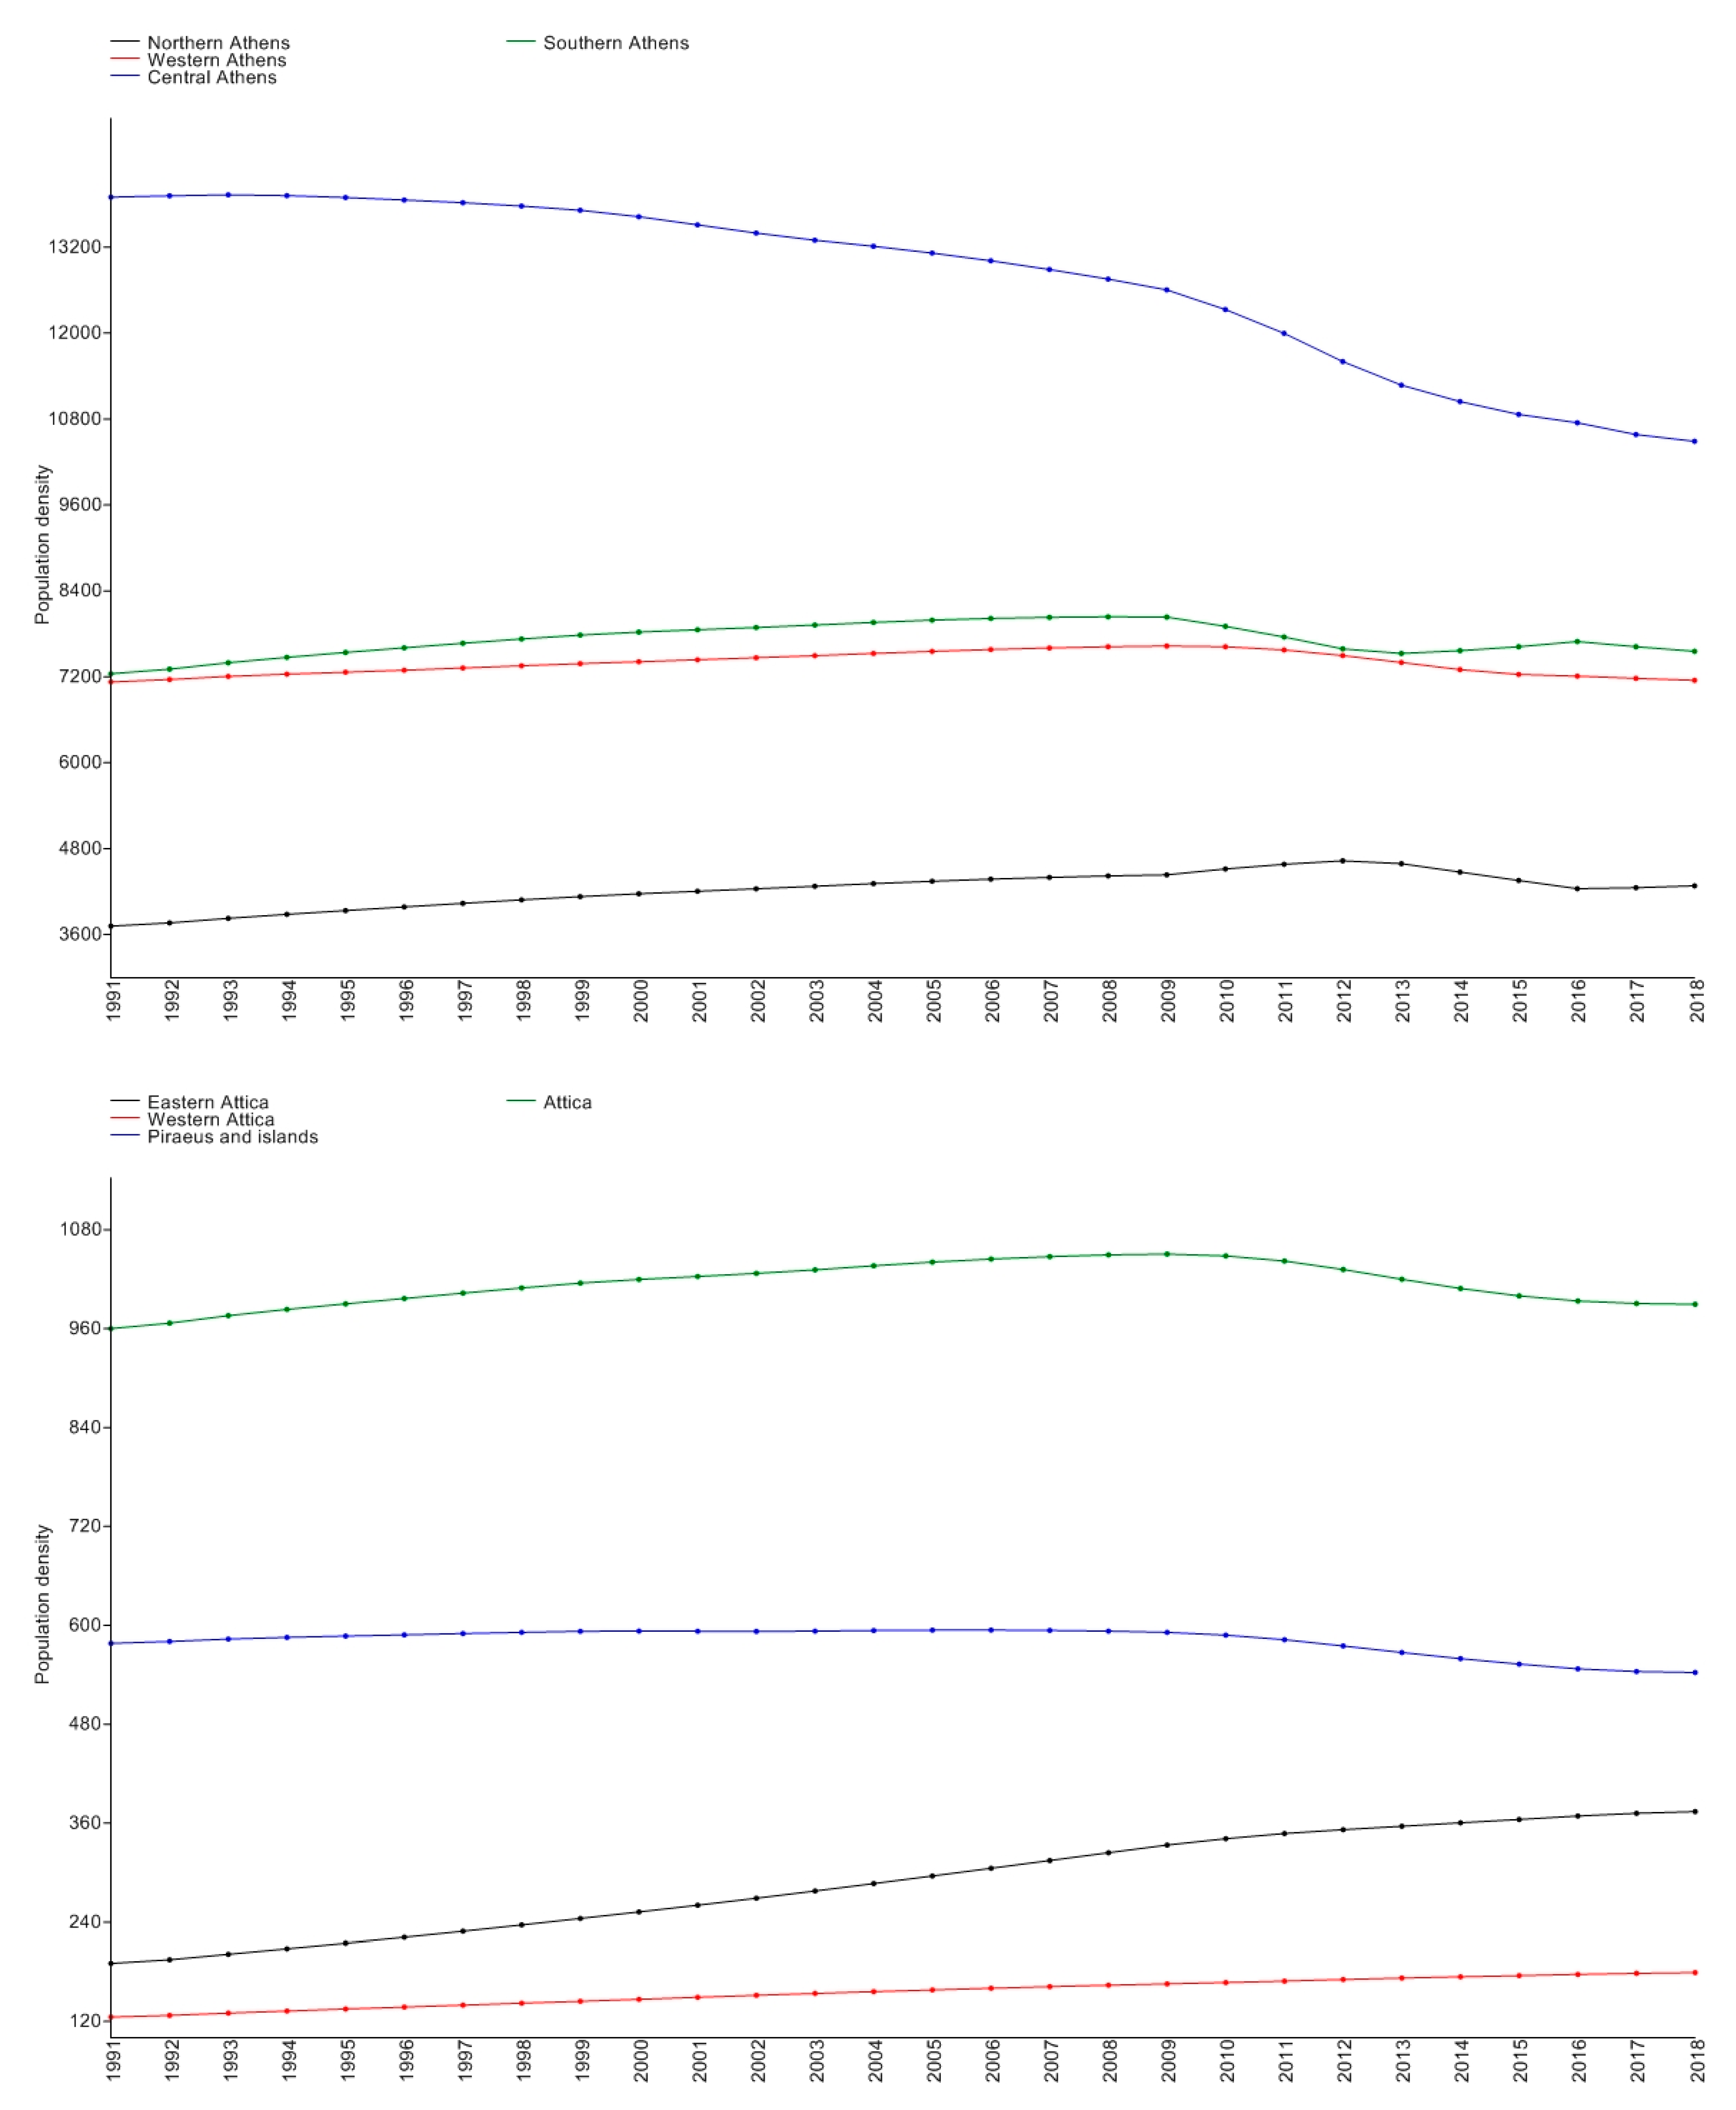
3.1.1. Population Increase
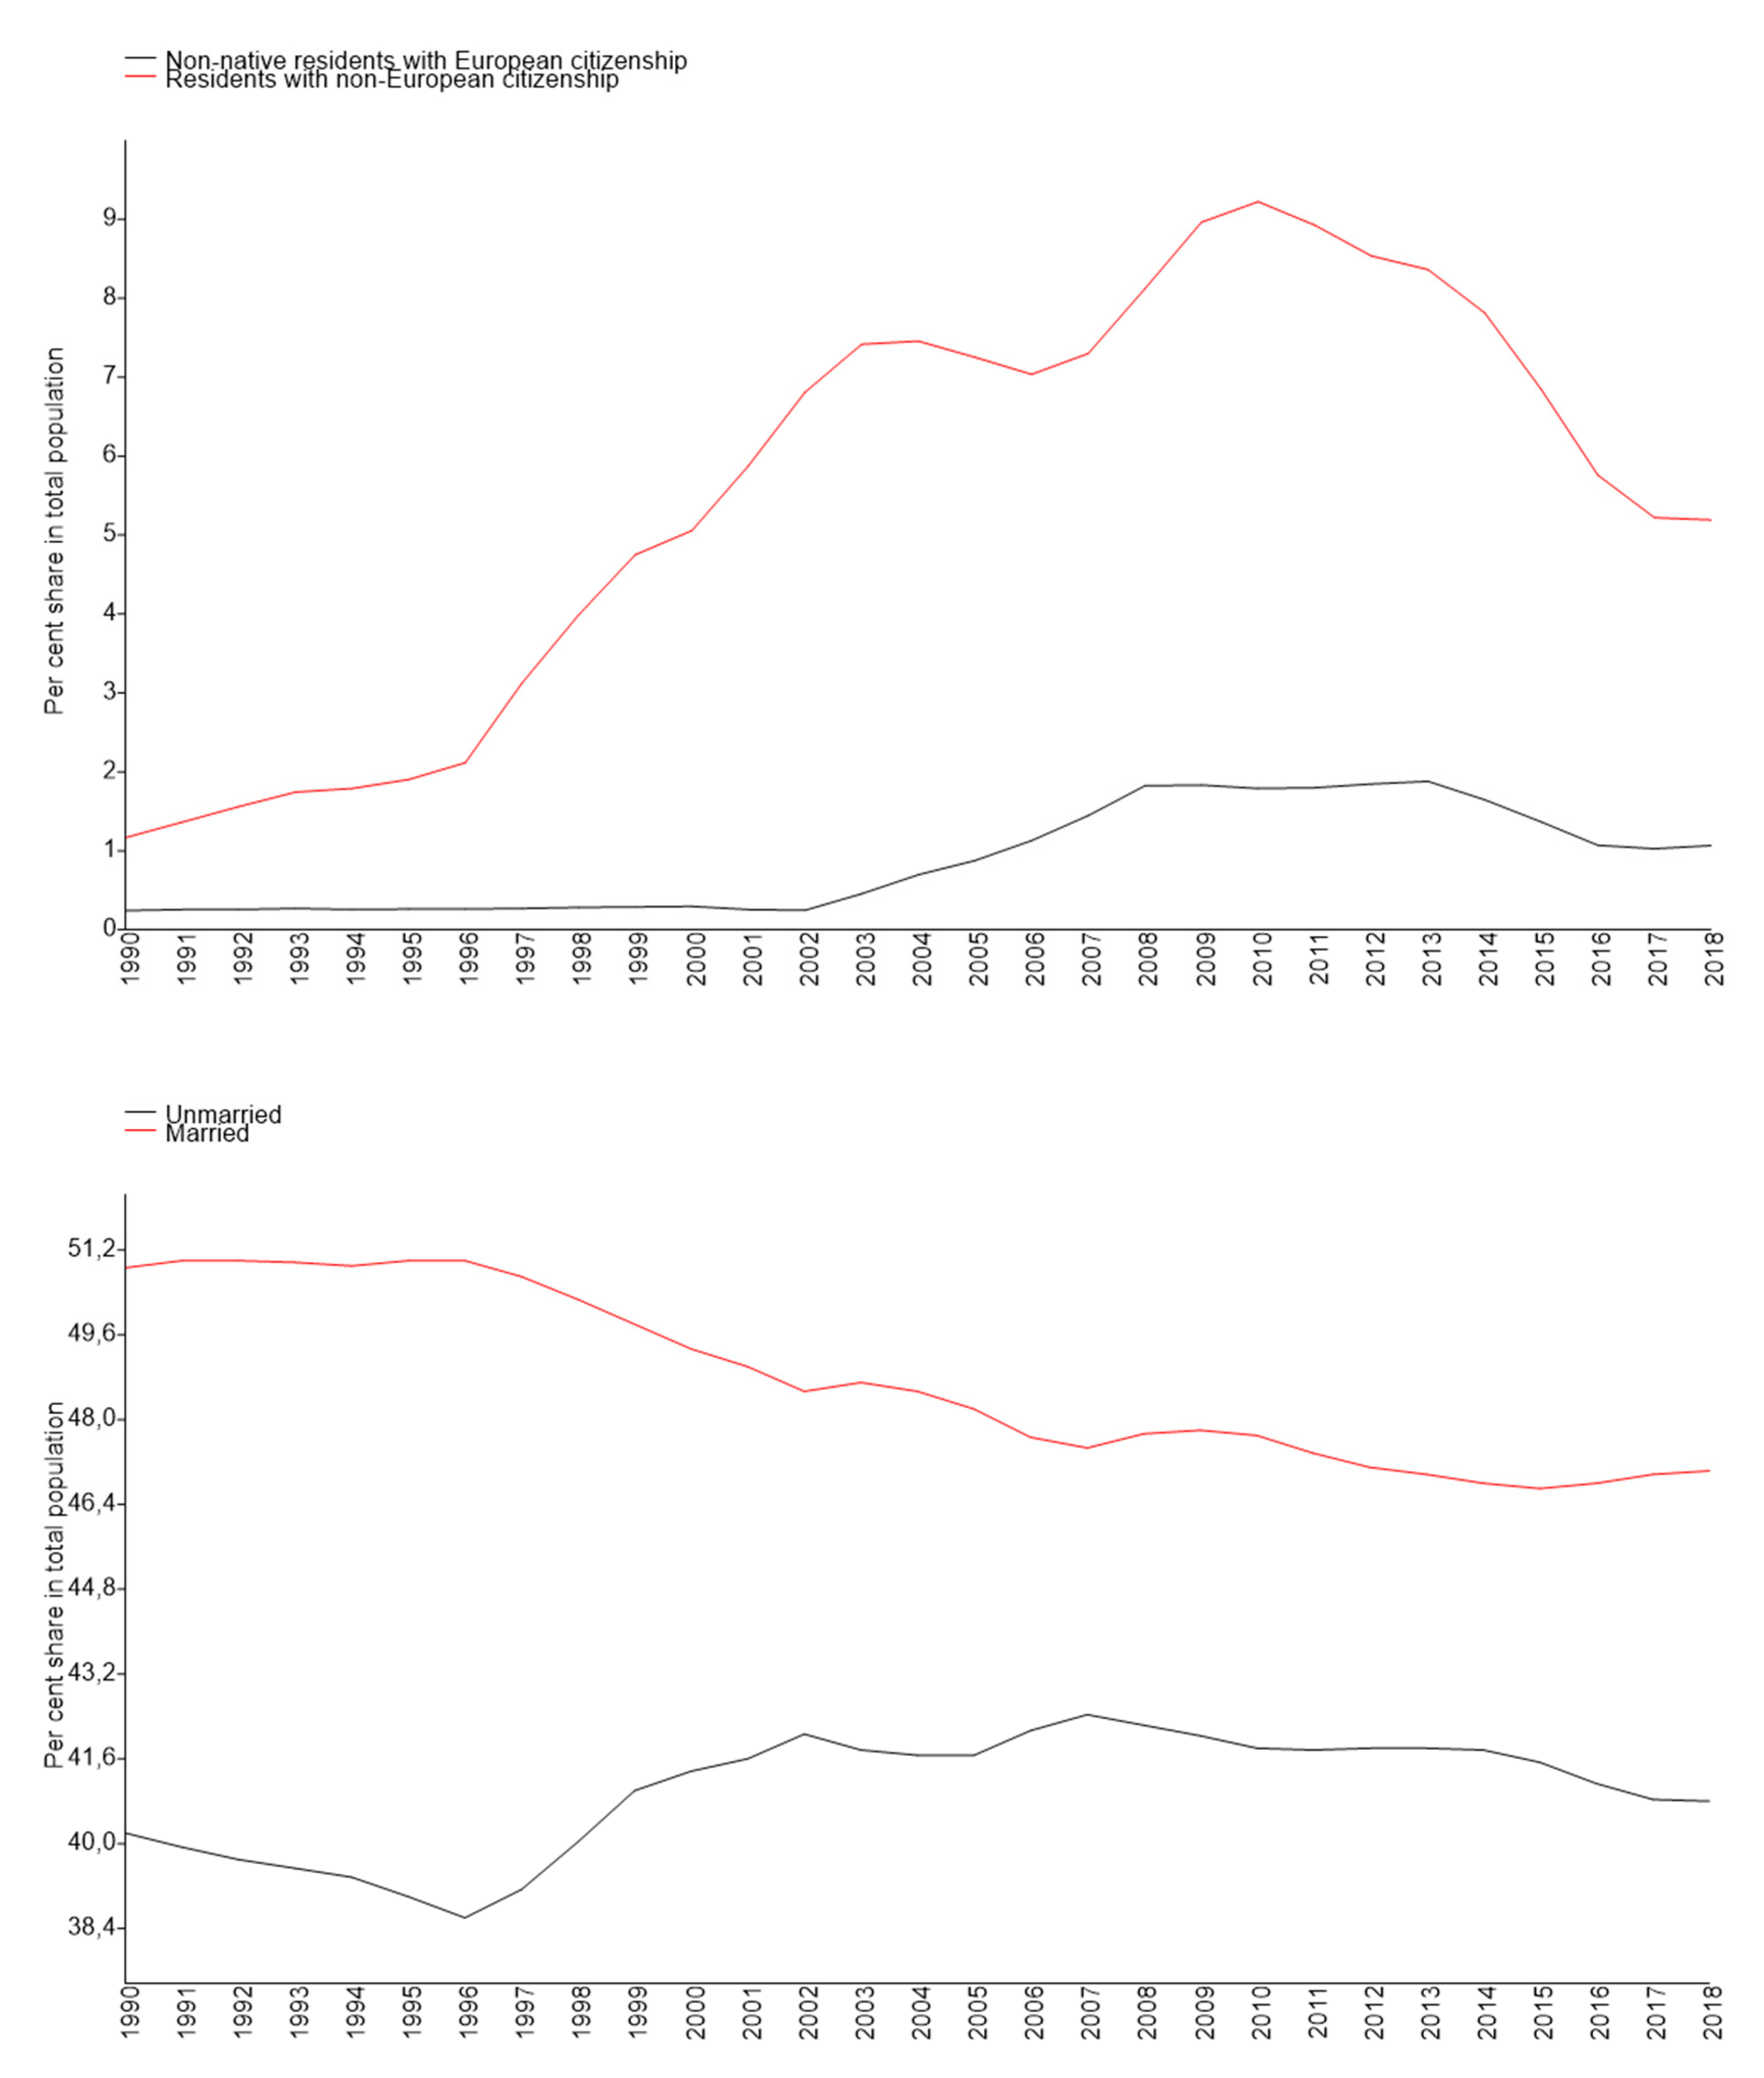
3.1.2. Trend of Selected Population Components
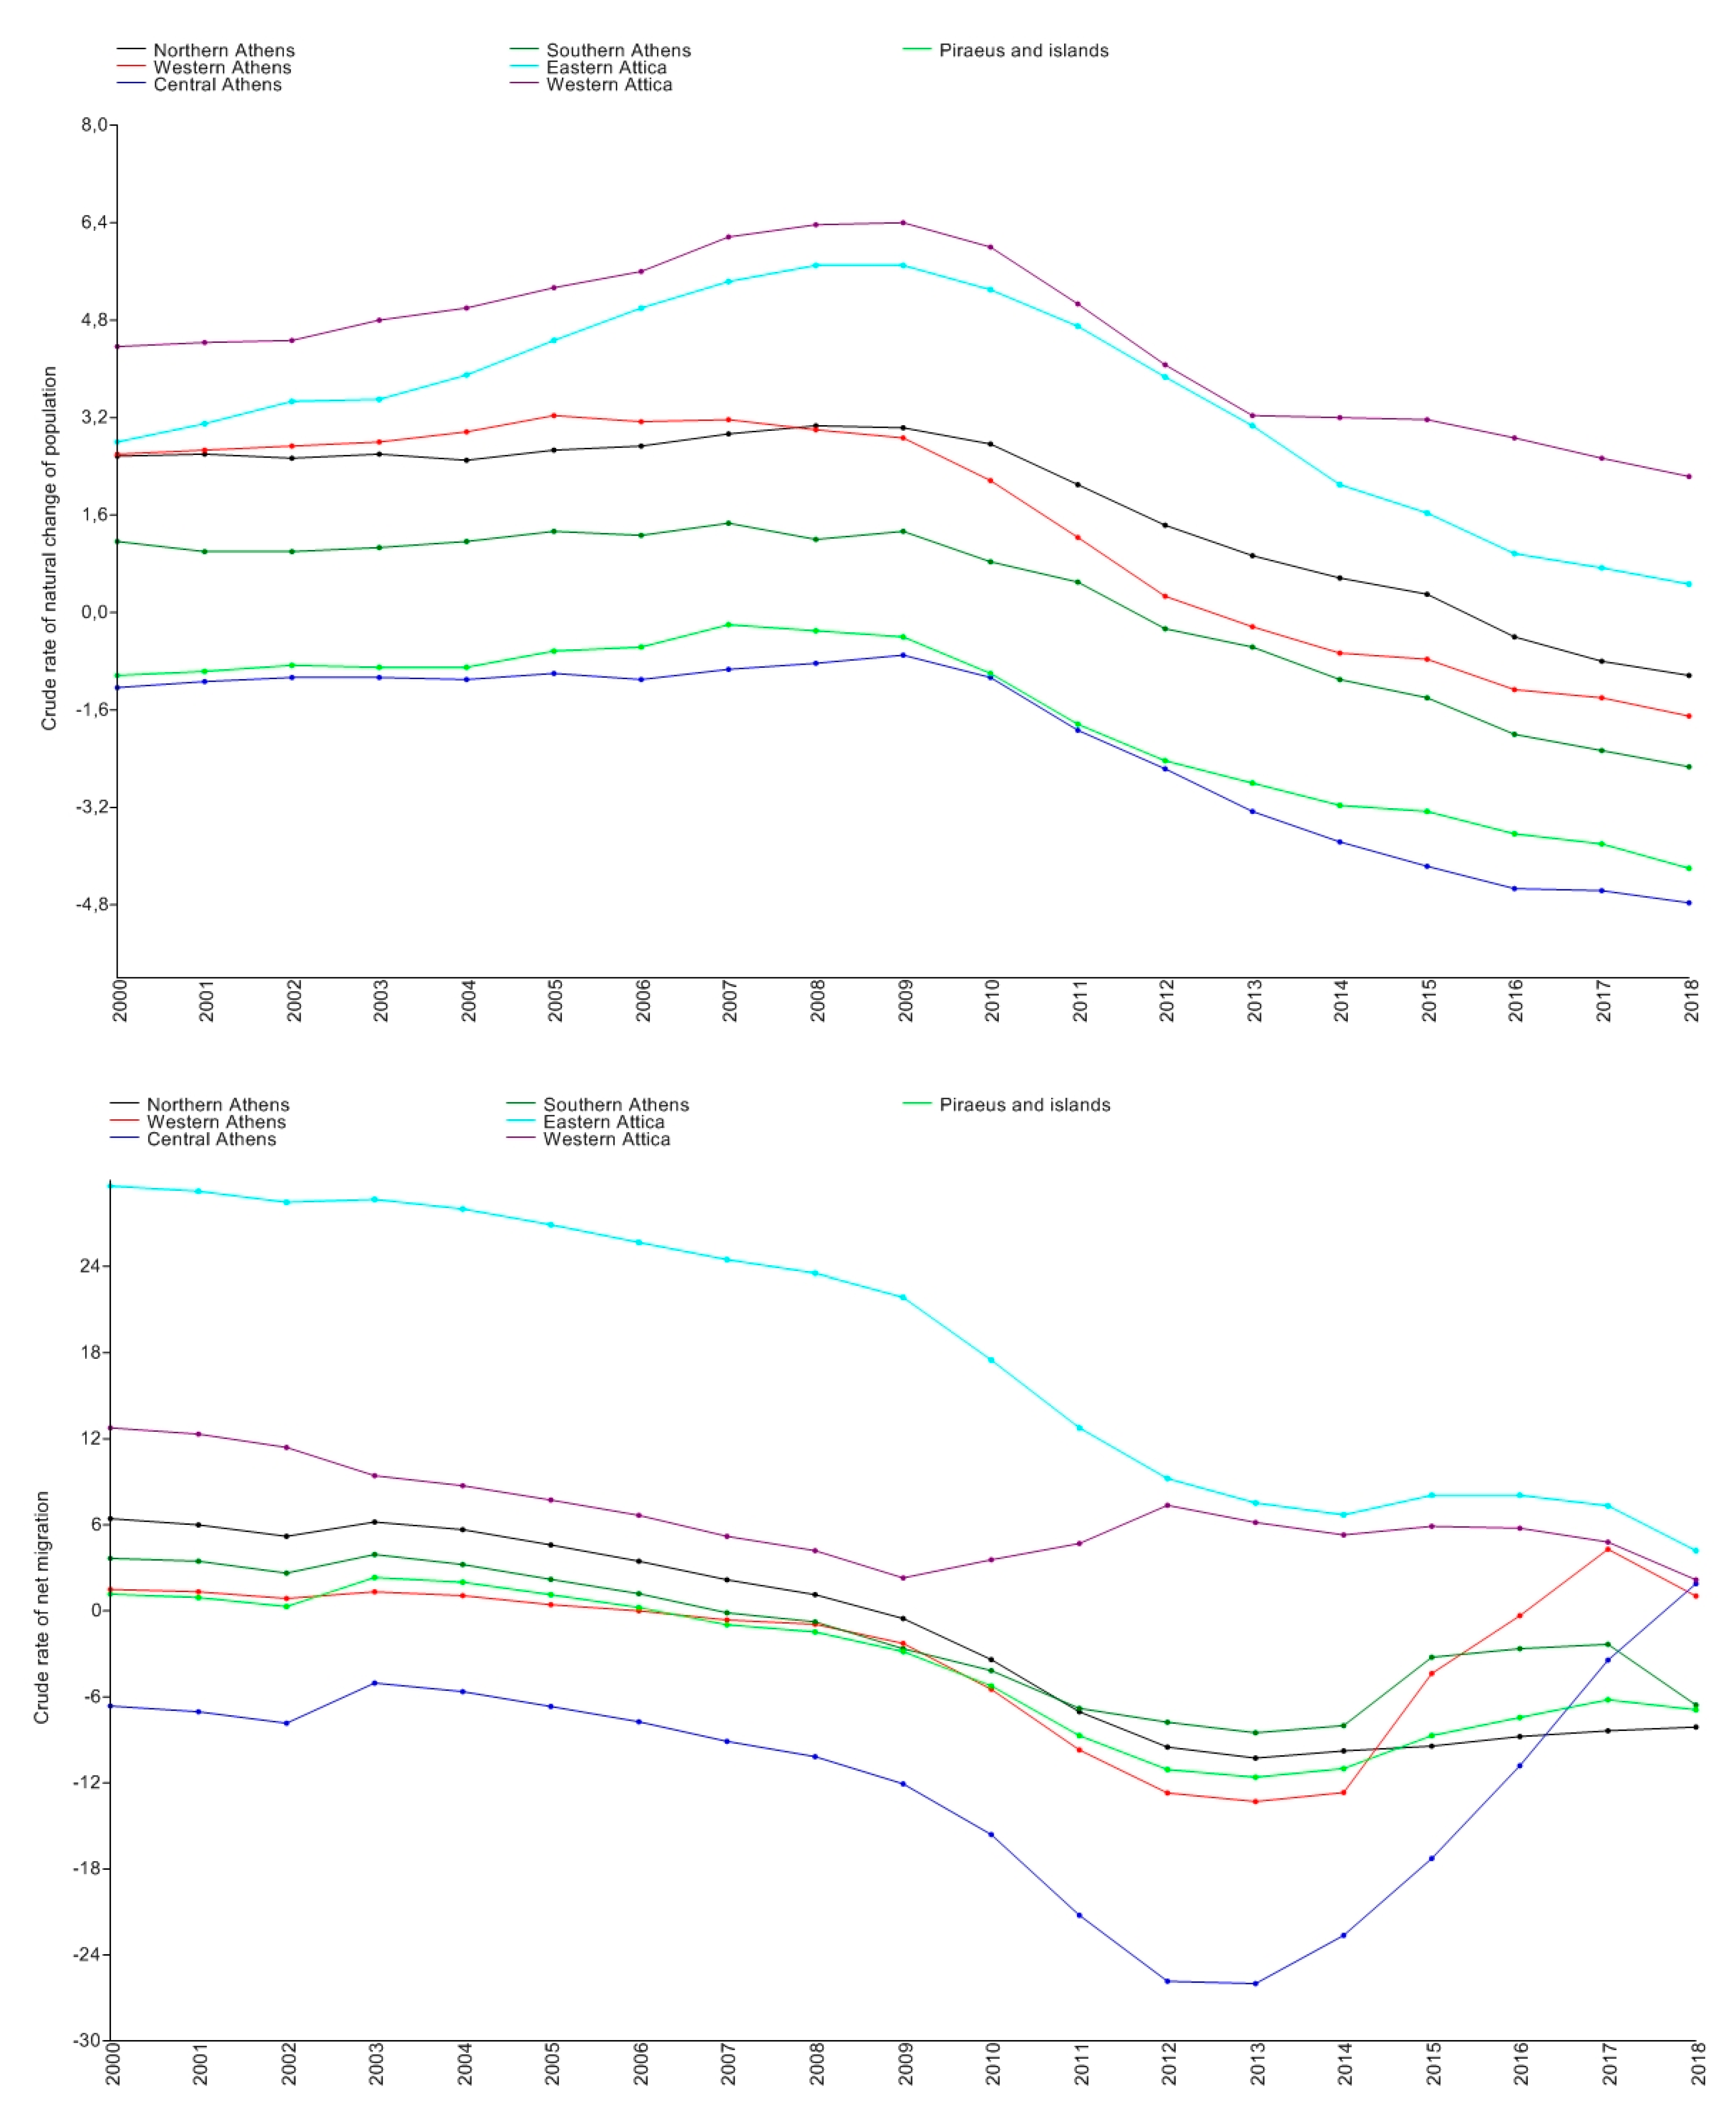
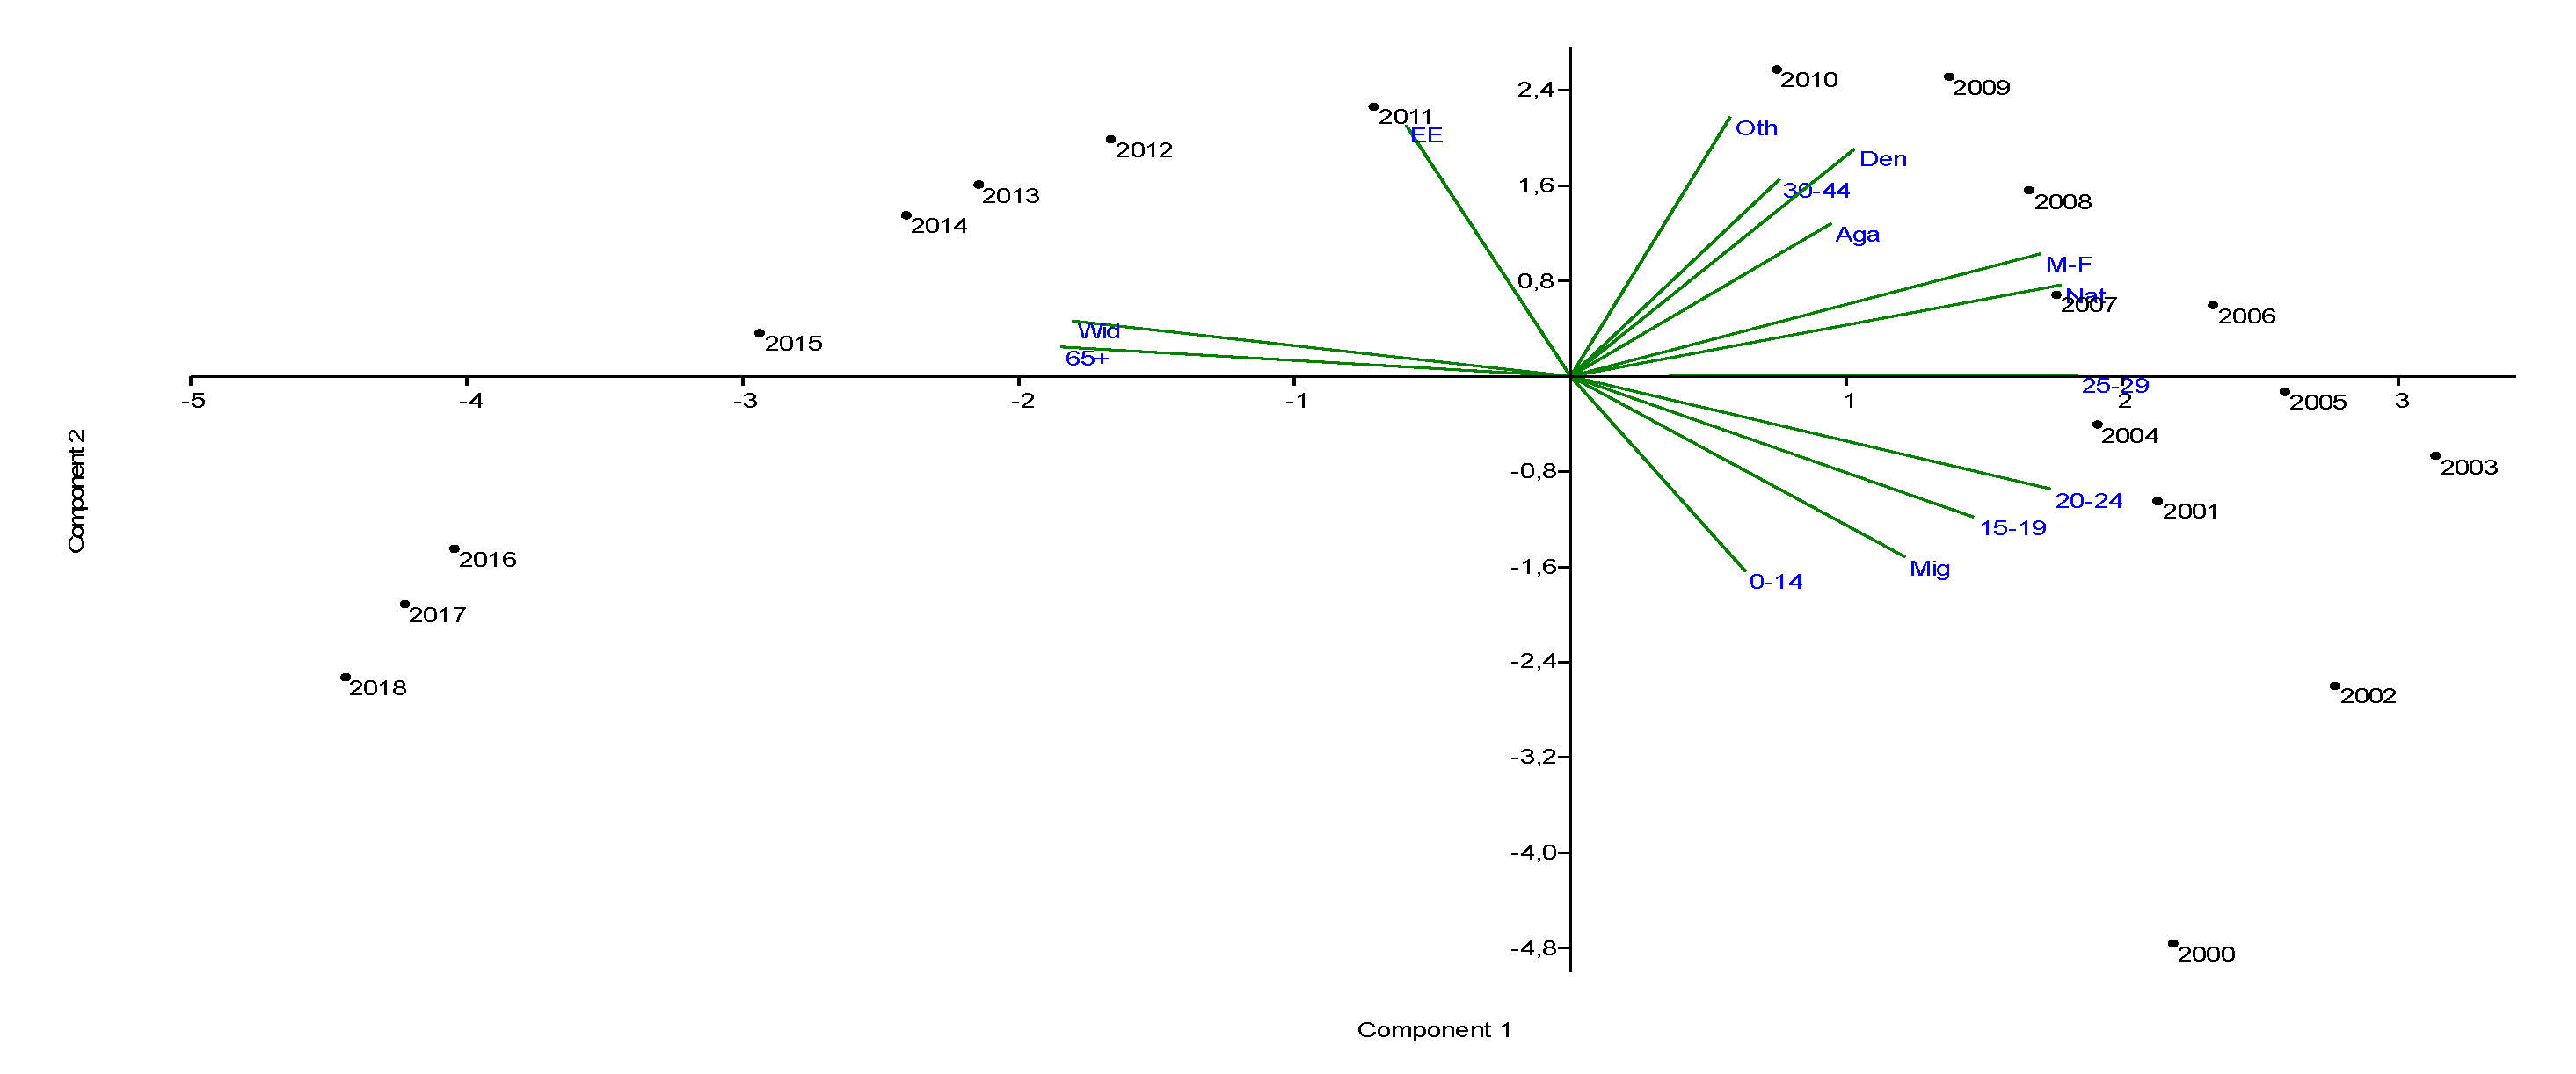
3.2. Uncovering Metropolitan Dynamics: A Summary Analysis of Demographic Indicators, 2000–2018
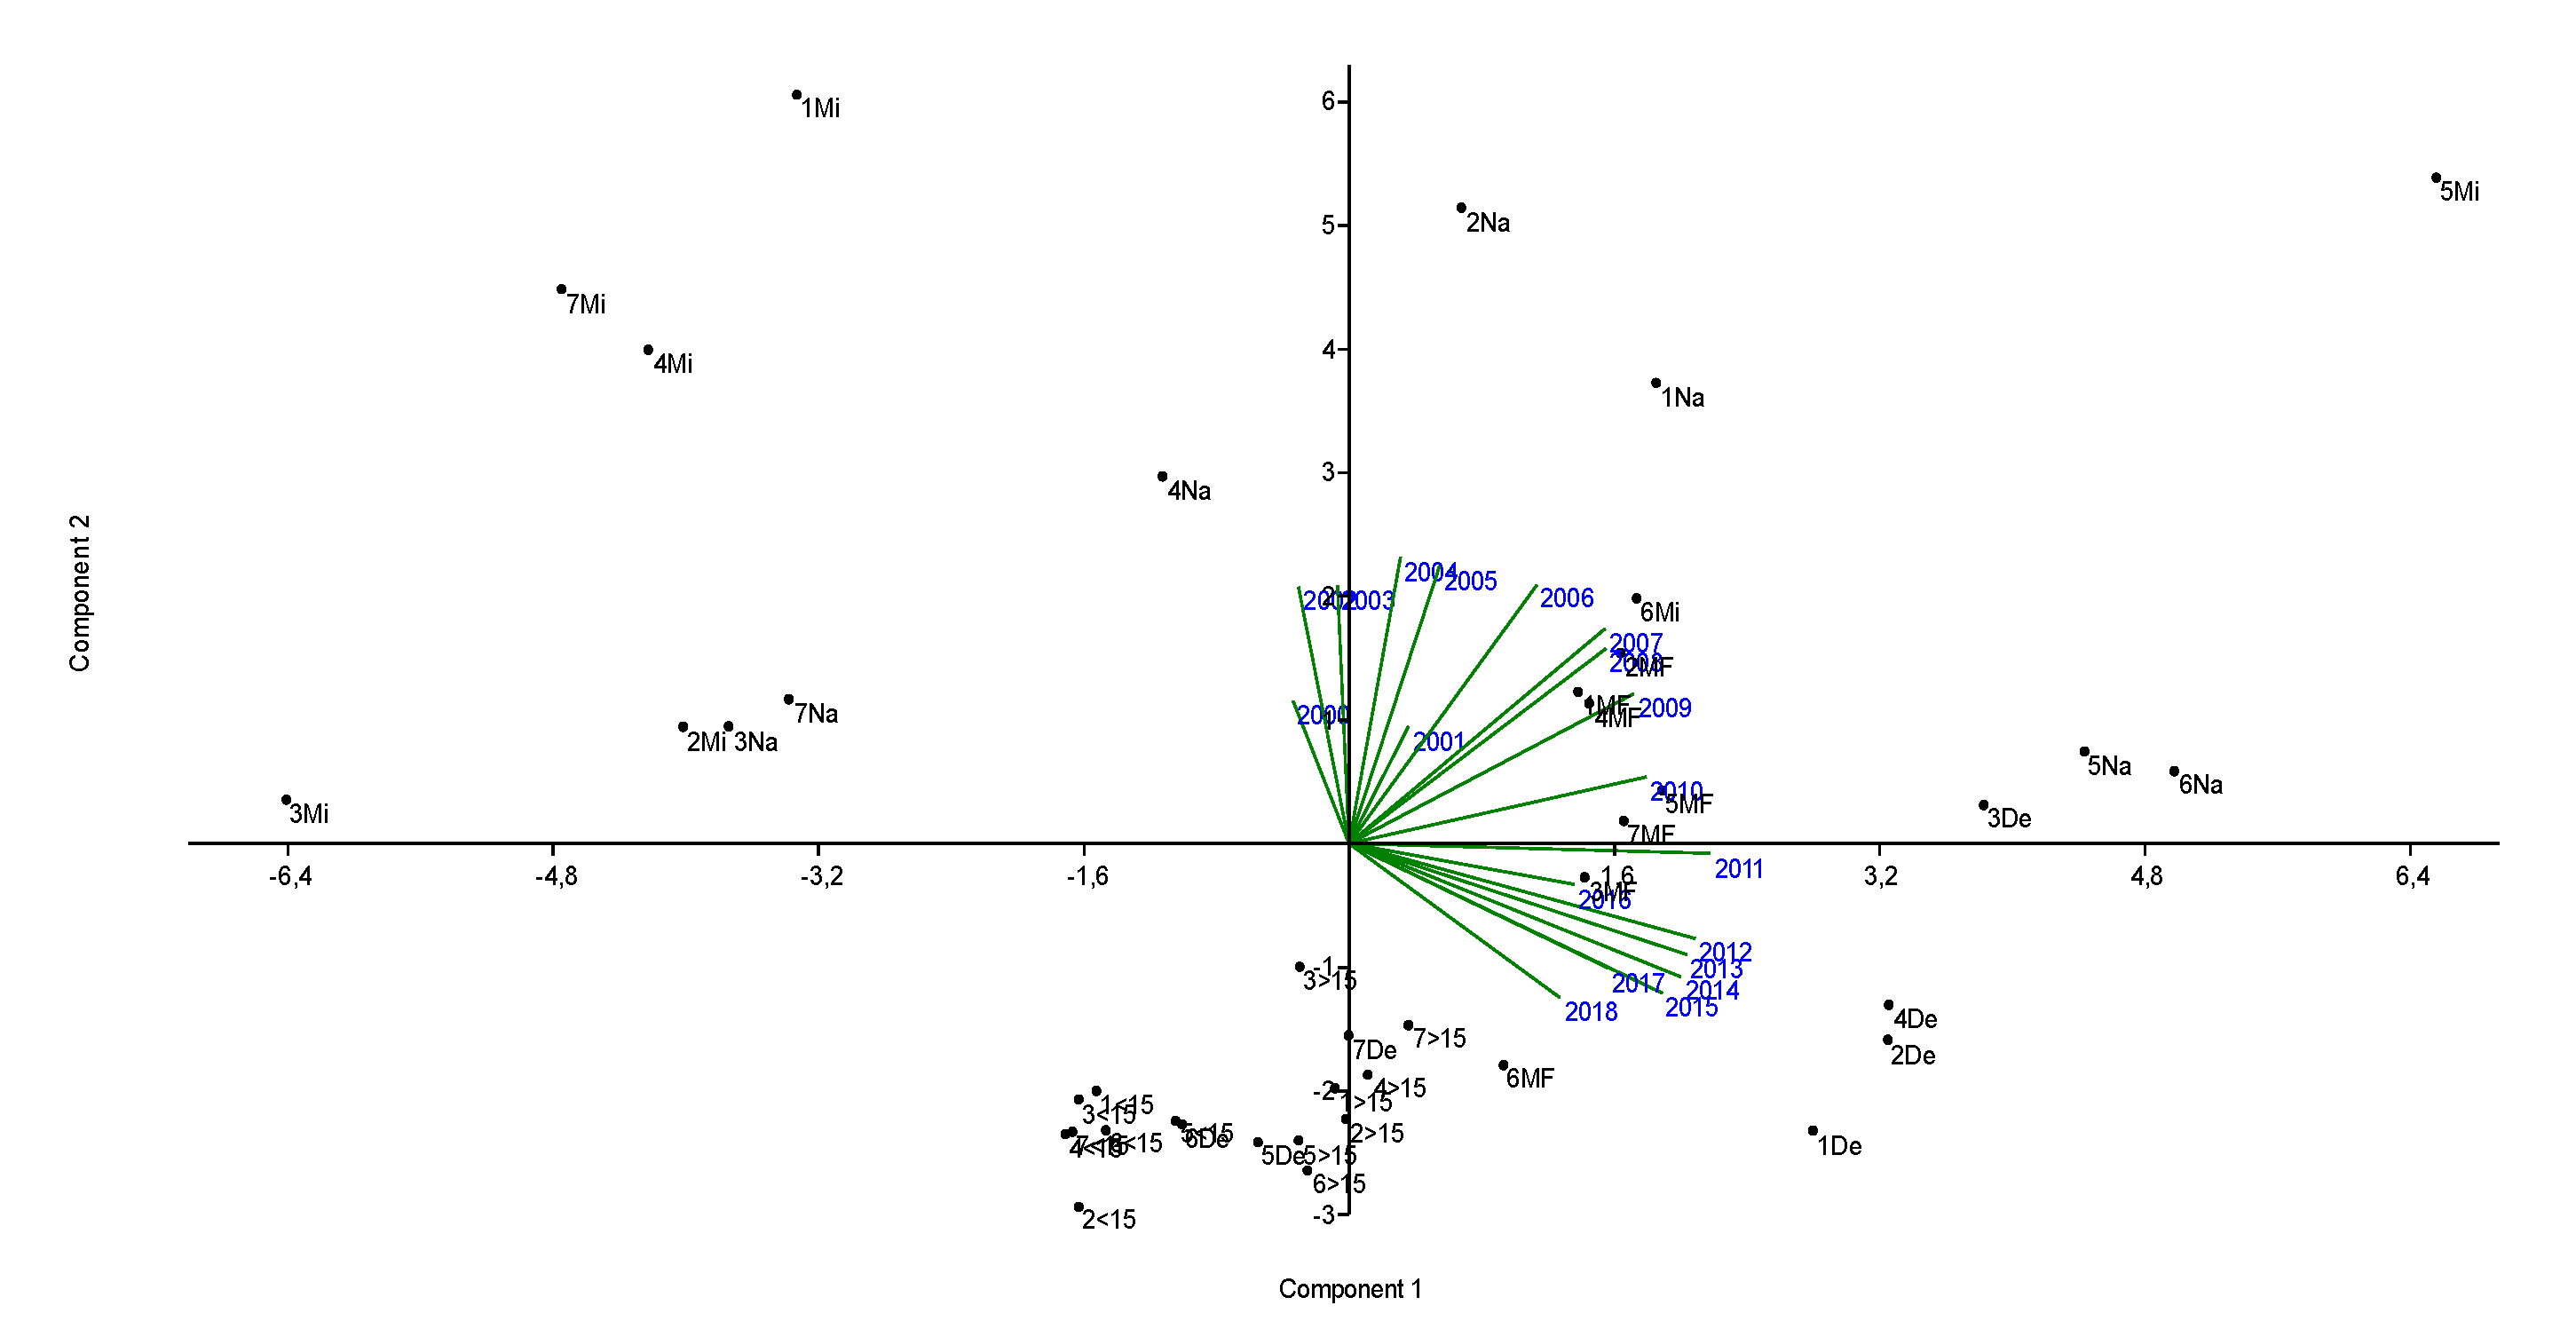
Population Structure and Dynamics at District Level, 2000–2018
3.3. Inferring Future Scenarios of Urban Growth from Changes in Population Structure, 2014–2018
4. Discussion
5. Conclusions
Author Contributions
Funding
Conflicts of Interest
References
- Bocquier, P.; Costa, R. Which transition come first? Urban and demographic transitions in Belgium and Sweden. Demogr. Res. 2015, 33, 1297–1332. [Google Scholar] [CrossRef] [Green Version]
- Bocquier, P.; Bree, S. A regional perspective on the economic determinants of urban transition in 19th-century France. Demogr. Res. 2018, 38, 1535–1576. [Google Scholar] [CrossRef] [Green Version]
- Allen, J.; Barlow, J.; Leal, J.; Maloutas, T.; Padovani, L. Housing in Southern Europe; Blackwell: London, UK, 2004. [Google Scholar]
- Champion, A.G. A changing demographic regime and evolving polycentric urban regions: Consequences for the size, composition and distribution of city populations. Urban Stud. 2001, 38, 657–677. [Google Scholar] [CrossRef]
- Champion, A.; Hugo, G.; Lattes, A. Towards a new conceptualization of settlement for demography: Beyond the urban/rural dichotomy. Popul. Dev. Rev. 2003, 29, 277–297. [Google Scholar]
- Schneider, A.; Woodcock, C.E. Compact, dispersed, fragmented, extensive? A comparison of urban growth in twenty-five global cities using remotely sensed data, pattern metrics and census information. Urban Stud. 2008, 45, 659–692. [Google Scholar] [CrossRef]
- Vobecká, J.; Piguet, V. Fertility, natural growth, and migration in the Czech Republic: An urban–suburban–rural gradient analysis of long-term trends and recent reversals. Popul. Space Place 2012, 18, 225–240. [Google Scholar] [CrossRef]
- Westerink, J.; Haase, D.; Bauer, A.; Ravetz, J.; Jarrige, F.; Aalbers, C.B.E.M. Dealing with sustainability trade-offs of the compact city in peri-urban planning across European city regions. Eur. Plan. Stud. 2013, 21, 473–497. [Google Scholar] [CrossRef]
- Zambon, I.; Benedetti, A.; Ferrara, C.; Salvati, L. Soil matters? A multivariate analysis of socioeconomic constraints to urban expansion in Mediterranean Europe. Ecol. Econ. 2018, 146, 173–183. [Google Scholar] [CrossRef]
- Hoekveld, J.J. Spatial differentiation of population development in a declining region: The case of Saarland. Geogr. Ann. Ser. B Hum. Geogr. 2015, 97, 47–68. [Google Scholar] [CrossRef]
- Findlay, A.M.; Hoy, C. Global population issues: Towards a geographical research agenda. Appl. Geogr. 2000, 20, 207–219. [Google Scholar] [CrossRef]
- Di Feliciantonio, C.; Salvati, L. ‘Southern’ Alternatives of Urban Diffusion: Investigating Settlement Characteristics and Socio-Economic Patterns in Three Mediterranean Regions. Tijdschr. Voor Econ. Soc. Geogr. 2015, 106, 453–470. [Google Scholar] [CrossRef]
- Dura-Guimera, A. Population deconcentration and social restructuring in Barcelona, a European Mediterranean city. Cities 2003, 20, 387–394. [Google Scholar] [CrossRef]
- Neuman, M. The compact city fallacy. J. Plan. Educ. Res. 2005, 25, 11–26. [Google Scholar] [CrossRef]
- Parr, J. The polycentric urban region: A closer inspection. Reg. Stud. 2004, 38, 231–240. [Google Scholar] [CrossRef]
- Muñoz, F. Lock living: Urban sprawl in Mediterranean cities. Cities 2003, 20, 381–385. [Google Scholar] [CrossRef]
- Morelli, V.G.; Rontos, K.; Salvati, L. Between suburbanisation and re-urbanisation: Revisiting the urban life cycle in a Mediterranean compact city. Urban Res. Pract. 2014, 7, 74–88. [Google Scholar] [CrossRef]
- Pili, S.; Grigoriadis, E.; Carlucci, M.; Clemente, M.; Salvati, L. Towards sustainable growth? A multi-criteria assessment of (changing) urban forms. Ecol. Indic. 2017, 76, 71–80. [Google Scholar] [CrossRef]
- Gilli, F. Sprawl or Reagglomeration? The dynamics of employment deconcentration and industrial transformation in greater Paris. Urban Stud. 2009, 46, 1385–1420. [Google Scholar] [CrossRef] [Green Version]
- Kurek, S.; Wójtowicz, M.; Gałka, J. The changing role of migration and natural increase in suburban population growth: The case of a non-capital post-socialist city (The Krakow Metropolitan Area, Poland). Morav. Geogr. Rep. 2015, 23, 59–70. [Google Scholar] [CrossRef] [Green Version]
- Kroll, F.; Kabisch, N. The Relation of Diverging Urban Growth Processes and Demographic Change along an Urban–Rural Gradient. Popul. Space Place 2012, 18, 260–276. [Google Scholar] [CrossRef]
- Kabisch, N.; Haase, D.; Haase, A. Urban population development in Europe 1991–2008: The examples of Poland and UK. Int. J. Urban Reg. Res. 2012, 36, 1326–1348. [Google Scholar] [CrossRef]
- Kabisch, N.; Haase, D. Diversifying European agglomerations: Evidence of urban population trends for the 21st century. Popul. Space Place 2011, 17, 236–253. [Google Scholar] [CrossRef]
- Biasi, R.; Colantoni, A.; Ferrara, C.; Ranalli, F.; Salvati, L. In-between sprawl and fires: Long-term forest expansion and settlement dynamics at the wildland–urban interface in Rome, Italy. Int. J. Sustain. Dev. World Ecol. 2015, 22, 467–475. [Google Scholar] [CrossRef]
- Colantoni, A.; Grigoriadis, E.; Sateriano, A.; Venanzoni, G.; Salvati, L. Cities as selective land predators? A lesson on urban growth, deregulated planning and sprawl containment. Sci. Total Environ. 2016, 545, 329–339. [Google Scholar] [CrossRef] [PubMed]
- Paul, V.; Tonts, M. Containing urban sprawl: Trends in land-use and spatial planning in the Metropolitan Region of Barcelona. J. Environ. Plan. Manag. 2005, 48, 7–35. [Google Scholar] [CrossRef]
- Oueslati, W.; Alvanides, S.; Garrod, G. Determinants of urban sprawl in European cities. Urban Stud. 2015, 52, 1594–1614. [Google Scholar] [CrossRef] [Green Version]
- Richardson, H.W.; Chang-Hee, C.B. Urban Sprawl in Western Europe and the United States; Ashgate: London, UK, 2004. [Google Scholar]
- Turok, I.; Mykhnenko, V. The trajectories of European cities, 1960–2005. Cities 2007, 24, 165–182. [Google Scholar] [CrossRef]
- Helbich, M. Beyond Postsuburbia? Multifunctional Service Agglomeration in Vienna’s Urban Fringe. Tijdschr. Voor Econ. Soc. Geogr. 2012, 103, 39–52. [Google Scholar] [CrossRef] [Green Version]
- Buzar, S.; Ogden, P.E.; Hall, R.; Haase, A.; Kabisch, S.; Steinführer, A. Splintering urban populations: Emergent landscapes of reurbanisation in four European cities. Urban Stud. 2007, 44, 651–677. [Google Scholar] [CrossRef]
- Camagni, R.; Capello, R.; Caragliu, A. Static vs. dynamic agglomeration economies: Spatial context and structural evolution behind urban growth. Pap. Reg. Sci. 2017, 94, 133–159. [Google Scholar] [CrossRef]
- Salvati, L. The dark side of the crisis: Disparities in per-capita income (2000–2012) and the urban-rural gradient in Greece. Tijdschr. Voor Econ. Soc. Geogr. 2016, 107, 628–641. [Google Scholar] [CrossRef]
- Serra, P.; Vera, A.; Tulla, A.F.; Salvati, L. Beyond urban–rural dichotomy: Exploring socioeconomic and land-use processes of change in Spain (1991–2011). Appl. Geogr. 2014, 55, 71–81. [Google Scholar] [CrossRef]
- Lerch, M. The role of migration in the urban transition: A demonstration from Albania. Demography 2014, 51, 1527–1550. [Google Scholar] [CrossRef] [PubMed] [Green Version]
- Longhi, C.; Musolesi, A. European cities in the process of economic integration: Towards structural convergence. Ann. Reg. Sci. 2007, 41, 333–351. [Google Scholar] [CrossRef]
- Van Nimwegen, N. Population change in Europe: Turning challenges into opportunities. Genus 2013, 69, 103–125. [Google Scholar]
- Dijkstra, L.; Garcilazo, E.; McCann, P. The effects of the global financial crisis on European regions and cities. J. Econ. Geogr. 2015, 15, 935–949. [Google Scholar] [CrossRef]
- Garcia, M. The breakdown of the Spanish urban growth model: Social and territorial effects of the global crisis. Int. J. Urban Reg. Res. 2010, 34, 967–980. [Google Scholar] [CrossRef] [Green Version]
- Gospodini, A. Post-industrial trajectories of Mediterranean European cities: The case of post-Olympics Athens. Urban Stud. 2009, 46, 1157–1186. [Google Scholar] [CrossRef] [Green Version]
- Lerch, M. Internal and international migration across the urban hierarchy in Albania. Popul. Res. Policy Rev. 2016, 35, 851–876. [Google Scholar] [CrossRef] [Green Version]
- Muniz, J.O. Spatial dependence and heterogeneity in ten years of fertility decline in Brazil. Popul. Rev. 2009, 48, 32–65. [Google Scholar]
- Pérez, J.M.G. The real estate and economic crisis: An opportunity for urban return and rehabilitation policies in Spain. Sustainability 2010, 2, 1571–1601. [Google Scholar] [CrossRef] [Green Version]
- Salvati, L.; Sateriano, A.; Grigoriadis, S. Crisis and the City: Profiling Urban Growth under Economic Expansion and Stagnation. Lett. Spat. Resour. Sci. 2016, 9, 329–342. [Google Scholar] [CrossRef]
- Arapoglou, V.P.; Sayas, J. New facets of urban segregation in southern Europe. Eur. Urban Reg. Stud. 2009, 16, 345–362. [Google Scholar] [CrossRef]
- Carlucci, M.; Grigoriadis, E.; Rontos, K.; Salvati, L. Revisiting an Hegemonic Concept: Long-term ‘Mediterranean Urbanization’ in between city re-polarization and metropolitan decline. Appl. Spat. Anal. Policy 2017, 10, 347–362. [Google Scholar] [CrossRef]
- De Rosa, S.; Salvati, L. Beyond a ‘side street story’? Naples from spontaneous centrality to entropic polycentricism, towards a ‘crisis city’. Cities 2016, 51, 74–83. [Google Scholar] [CrossRef]
- Rontos, K.; Grigoriadis, S.; Sateriano, A.; Syrmali, M.; Vavouras, I.; Salvati, L. Lost in Protest, Found in Segregation: Divided Cities in the Light of the 2015 ‘Oki’ Referendum in Greece. City Cult. Soc. 2016, 7, 139–148. [Google Scholar] [CrossRef]
- Zitti, M.; Ferrara, C.; Perini, L.; Carlucci, M.; Salvati, L. Long-term urban growth and land use efficiency in Southern Europe: Implications for sustainable land management. Sustainability 2015, 7, 3359–3385. [Google Scholar] [CrossRef] [Green Version]
- Duvernoy, I.; Zambon, I.; Sateriano, A.; Salvati, L. Pictures from the other side of the fringe: Urban growth and peri-urban agriculture in a post-industrial city (Toulouse, France). J. Rural Stud. 2018, 57, 25–35. [Google Scholar] [CrossRef]
- Salvati, L.; Serra, P. Estimating rapidity of change in complex urban systems: A multidimensional, local-scale approach. Geogr. Anal. 2016, 48, 132–156. [Google Scholar] [CrossRef]
- Salvati, L.; Carlucci, M. Urban growth, population, and recession: Unveiling multiple spatial patterns of demographic indicators in a Mediterranean City. Popul. Space Place 2017, 23, e2079. [Google Scholar] [CrossRef]
- Zambon, I.; Serra, P.; Sauri, D.; Carlucci, M.; Salvati, L. Beyond the ‘Mediterranean city’: Socioeconomic disparities and urban sprawl in three Southern European cities. Geogr. Ann. Ser. B Hum. Geogr. 2017, 99, 319–337. [Google Scholar] [CrossRef]
- Couch, C.; Petschel-Held, G.; Leontidou, L. Urban Sprawl in Europe: Landscapes, Land-Use Change and Policy; Blackwell: London, UK, 2007. [Google Scholar]
- Cuadrado-Ciuraneta, S.; Durà-Guimerà, A.; Salvati, L. Not Only Tourism: Unravelling Suburbanization, Second-home Expansion and ‘Rural’ Sprawl in Catalonia, Spain. Urban Geogr. 2017, 38, 66–89. [Google Scholar] [CrossRef]
- Gil-Alonso, F.; Bayona-i-Carrasco, J.; Pujadas-i-Rúbies, I. From boom to crash: Spanish urban areas in a decade of change (2001–2011). Eur. Urban Reg. Stud. 2016, 23, 198–216. [Google Scholar] [CrossRef]
- Domingo, A.; Gil-Alonso, F. Immigration and Changing Labour Force Structure in the Southern European Union. Population 2007, 62, 709–727. [Google Scholar] [CrossRef]
- Hatz, G. Features and dynamics of socio-spatial differentiation in Vienna and the Vienna metropolitan region. Tijdschr. Voor Econ. Soc. Geogr. 2009, 100, 485–501. [Google Scholar] [CrossRef]
- Bayona-Carrasco, J.; Gil-Alonso, F. Suburbanisation and international immigration: The case of the Barcelona Metropolitan Region (1998–2009). Tijdschr. Voor Econ. Soc. Geogr. 2012, 103, 312–329. [Google Scholar] [CrossRef] [Green Version]
- Carbonaro, G.; Leanza, E.; McCann, P.; Medda, F. Demographic decline, population aging, and modern financial approaches to urban policy. Int. Reg. Sci. Rev. 2018, 41, 210–232. [Google Scholar] [CrossRef]
- Vitali, A.; Billari, F.C. Changing determinants of low fertility and diffusion: A spatial analysis for Italy. Popul. Space Place 2017, 23, e1998. [Google Scholar] [CrossRef] [Green Version]
- Gavalas, V.S.; Rontos, K.; Salvati, L. Who becomes an unwed mother in Greece? Socio-demographic and geographical aspects of an emerging phenomenon. Popul. Space Place 2014, 20, 250–263. [Google Scholar] [CrossRef]
- Cherlin, A.; Cumberworth, E.; Morgan, S.P.; Wimer, C. The effects of the Great Recession on family structure and fertility. Ann. Am. Acad. Political Soc. Sci. 2013, 650, 214–231. [Google Scholar] [CrossRef]
- Sabater, A.; Graham, E. International migration and fertility variation in Spain during the economic recession: A spatial Durbin approach. Appl. Spat. Anal. Policy 2019, 12, 515–546. [Google Scholar] [CrossRef] [Green Version]
- Liu, P.; Wu, C.; Chen, M.; Ye, X.; Peng, Y.; Li, S. A Spatiotemporal Analysis of the Effects of Urbanization’s Socio-Economic Factors on Landscape Patterns Considering Operational Scales. Sustainability 2020, 12, 2543. [Google Scholar] [CrossRef] [Green Version]
- Lucy, W.H.; Phillips, D.L. Suburban decline: The next urban crisis. Issues Sci. Technol. 2000, 17, 55–62. [Google Scholar]
- Salvati, L.; Carlucci, M. A composite index of sustainable development at the local scale: Italy as a case study. Ecol. Indic. 2014, 43, 162–171. [Google Scholar] [CrossRef]


| District | 2014 | 2015 | 2016 | 2017 | 2018 | 2019 | 2014 | 2015 | 2016 | 2017 | 2018 | 2019 |
|---|---|---|---|---|---|---|---|---|---|---|---|---|
| Median age of population | Proportion of population aged 0–19 years | |||||||||||
| Attica | 42.4 | 43.0 | 43.5 | 43.8 | 44.1 | 44.4 | 18.8 | 18.7 | 18.7 | 19.0 | 19.1 | 19.2 |
| Central Athens | 43.4 | 44.1 | 44.7 | 45.1 | 45.2 | 45.1 | 16.2 | 16.2 | 16.3 | 16.7 | 17.2 | 17.8 |
| Northern Athens | 43.7 | 44.3 | 44.9 | 45.4 | 45.9 | 46.5 | 19.2 | 19.1 | 19.1 | 19.0 | 19.0 | 18.9 |
| Western Athens | 41.6 | 42.2 | 42.7 | 42.7 | 43.0 | 43.3 | 19.7 | 19.6 | 19.6 | 20.1 | 20.3 | 20.4 |
| Southern Athens | 43.6 | 44.1 | 44.6 | 44.8 | 45.3 | 45.8 | 18.4 | 18.3 | 18.3 | 18.6 | 18.6 | 18.6 |
| Eastern Attica | 40.2 | 40.6 | 41.1 | 41.3 | 41.7 | 42.2 | 21.7 | 21.4 | 21.2 | 21.2 | 21.0 | 20.8 |
| Western Attica | 36.6 | 36.9 | 37.1 | 37.3 | 37.5 | 37.8 | 24.0 | 23.6 | 23.3 | 23.2 | 23.0 | 22.8 |
| Piraeus and islands | 42.9 | 43.5 | 44.0 | 44.4 | 44.8 | 45.2 | 18.3 | 18.2 | 18.2 | 18.4 | 18.5 | 18.6 |
| Age dependency ratio | Proportion of population aged 20–39 years | |||||||||||
| Attica | 49.4 | 50.5 | 51.5 | 52.5 | 53.4 | 54.1 | 27.3 | 26.5 | 25.7 | 25.0 | 24.4 | 23.7 |
| Central Athens | 48.4 | 50.0 | 51.4 | 53.0 | 54.4 | 55.3 | 28.5 | 27.4 | 26.4 | 25.4 | 24.6 | 24.1 |
| Northern Athens | 53.0 | 54.3 | 55.7 | 57.0 | 58.1 | 59.3 | 24.8 | 23.9 | 23.1 | 22.2 | 21.4 | 20.6 |
| Western Athens | 46.9 | 47.7 | 48.5 | 49.4 | 50.0 | 50.3 | 27.7 | 26.8 | 25.9 | 25.5 | 24.9 | 24.3 |
| Southern Athens | 50.3 | 51.4 | 52.6 | 53.8 | 54.9 | 55.8 | 25.9 | 25.1 | 24.4 | 23.8 | 23.0 | 22.2 |
| Eastern Attica | 49.0 | 49.6 | 50.0 | 50.5 | 50.6 | 50.8 | 28.1 | 27.6 | 27.0 | 26.7 | 26.2 | 25.7 |
| Western Attica | 46.3 | 46.2 | 46.3 | 46.4 | 46.4 | 46.4 | 31.3 | 31.4 | 31.4 | 31.3 | 31.1 | 30.7 |
| Piraeus and islands | 50.2 | 51.1 | 52.0 | 53.0 | 53.8 | 54.5 | 27.1 | 26.3 | 25.4 | 24.6 | 23.7 | 22.9 |
| Young-age dependency ratio | Proportion of population aged 40–59 years | |||||||||||
| Attica | 21.2 | 21.3 | 21.4 | 21.8 | 22.0 | 22.1 | 29.1 | 29.4 | 29.7 | 29.8 | 30.0 | 30.1 |
| Central Athens | 18.0 | 18.2 | 18.4 | 19.1 | 19.9 | 20.6 | 28.8 | 29.2 | 29.4 | 29.6 | 29.6 | 29.4 |
| Northern Athens | 22.3 | 22.5 | 22.6 | 22.7 | 22.8 | 22.8 | 29.8 | 30.1 | 30.3 | 30.6 | 30.8 | 31.0 |
| Western Athens | 21.8 | 21.9 | 21.9 | 22.6 | 22.8 | 22.8 | 30.2 | 30.6 | 30.9 | 30.7 | 30.9 | 31.0 |
| Southern Athens | 20.8 | 20.9 | 21.0 | 21.6 | 21.8 | 21.7 | 29.9 | 30.2 | 30.3 | 30.2 | 30.4 | 30.6 |
| Eastern Attica | 24.7 | 24.4 | 24.2 | 24.1 | 23.7 | 23.2 | 28.3 | 28.6 | 28.9 | 29.1 | 29.3 | 29.6 |
| Western Attica | 26.0 | 25.7 | 25.6 | 25.5 | 25.4 | 25.1 | 26.2 | 26.3 | 26.4 | 26.4 | 26.6 | 26.8 |
| Piraeus and islands | 20.7 | 20.8 | 20.9 | 21.2 | 21.4 | 21.5 | 29.0 | 29.4 | 29.8 | 30.1 | 30.4 | 30.7 |
| Old dependency ratio | Proportion of population aged 60 years and more | |||||||||||
| Attica | 43.7 | 45.2 | 46.6 | 47.8 | 48.8 | 50.0 | 24.7 | 25.3 | 25.8 | 26.2 | 26.5 | 26.9 |
| Central Athens | 46.2 | 48.1 | 50.0 | 51.7 | 52.7 | 53.4 | 26.5 | 27.2 | 27.9 | 28.4 | 28.6 | 28.6 |
| Northern Athens | 48.0 | 49.8 | 51.6 | 53.6 | 55.2 | 57.2 | 26.2 | 26.9 | 27.6 | 28.2 | 28.8 | 29.5 |
| Western Athens | 38.7 | 40.0 | 41.5 | 42.1 | 43.0 | 44.0 | 22.4 | 23.0 | 23.6 | 23.7 | 24.0 | 24.3 |
| Southern Athens | 46.2 | 47.8 | 49.5 | 50.6 | 52.1 | 54.0 | 25.8 | 26.4 | 27.1 | 27.4 | 27.9 | 28.6 |
| Eastern Attica | 38.9 | 39.9 | 40.8 | 41.4 | 42.3 | 43.4 | 21.9 | 22.4 | 22.8 | 23.1 | 23.5 | 24.0 |
| Western Attica | 32.1 | 32.4 | 32.8 | 33.2 | 33.5 | 34.2 | 18.5 | 18.7 | 18.9 | 19.2 | 19.3 | 19.7 |
| Piraeus and islands | 45.5 | 46.8 | 48.0 | 49.2 | 50.4 | 51.8 | 25.5 | 26.1 | 26.5 | 26.9 | 27.3 | 27.8 |
© 2020 by the authors. Licensee MDPI, Basel, Switzerland. This article is an open access article distributed under the terms and conditions of the Creative Commons Attribution (CC BY) license (http://creativecommons.org/licenses/by/4.0/).
Share and Cite
Halbac-Cotoara-Zamfir, R.; Egidi, G.; Mosconi, E.M.; Poponi, S.; Alhuseen, A.; Salvati, L. Uncovering Demographic Trends and Recent Urban Expansion in Metropolitan Regions: A Paradigmatic Case Study. Sustainability 2020, 12, 3937. https://doi.org/10.3390/su12093937
Halbac-Cotoara-Zamfir R, Egidi G, Mosconi EM, Poponi S, Alhuseen A, Salvati L. Uncovering Demographic Trends and Recent Urban Expansion in Metropolitan Regions: A Paradigmatic Case Study. Sustainability. 2020; 12(9):3937. https://doi.org/10.3390/su12093937
Chicago/Turabian StyleHalbac-Cotoara-Zamfir, Rares, Gianluca Egidi, Enrico Maria Mosconi, Stefano Poponi, Ahmed Alhuseen, and Luca Salvati. 2020. "Uncovering Demographic Trends and Recent Urban Expansion in Metropolitan Regions: A Paradigmatic Case Study" Sustainability 12, no. 9: 3937. https://doi.org/10.3390/su12093937