
Combining Tree-Ring Width and Density to Separate the Effects of Climate Variation and Insect Defoliation
by
 , , ,
, , ,
Marcel Kunz
1,*,
Jan Esper
1,2 ,
,
Eileen Kuhl
1,
Lea Schneider
3,
Ulf Büntgen
2,4,5,6 and
Claudia Hartl
7 1
Department of Geography, Johannes Gutenberg-University Mainz, 55099 Mainz, Germany
2
Global Change Research Institute (CzechGlobe), Czech Academy of Sciences, 60300 Brno, Czech Republic
3
Department of Geography, Justus-Liebig-University, 35390 Gießen, Germany
4
Department of Geography, University of Cambridge, Cambridge CB2 1BY, UK
5
Department of Geography, Faculty of Science, Masaryk University, 61137 Brno, Czech Republic
6
Swiss Federal Research Institute (WSL), 8903 Birmensdorf, Switzerland
7
Nature Rings—Environmental Research and Education, 55118 Mainz, Germany
*
Author to whom correspondence should be addressed.
Forests 2023, 14(7), 1478; https://doi.org/10.3390/f14071478
Submission received: 6 June 2023
/
Revised: 29 June 2023
/
Accepted: 16 July 2023
/
Published: 19 July 2023
(This article belongs to the Special Issue Forest Health: Forest Insect Population Dynamics)
Abstract
:Though frequently used in dendroclimatology, European larch (Larix decidua Mill.) is regularly defoliated by mass outbreaks of the larch budmoth (Zeiraphera griseana Hb., LBM). The near-cyclic growth depressions are unrelated to but possibly coincide with cold summers, which challenges signal detection on interannual timescales. LBM defoliation events cause sharp maximum latewood density declines and irregular earlywood/latewood ratios in the outbreak year, followed by one or two anomalously narrow rings. Here, we present a process-based method integrating these diverse response patterns to identify and distinguish LBM-related signals from climate-induced deviations. Application to larch sites along elevational transects in the Swiss Alps reveals the algorithm to perform better than existing extreme event detection methods, though our approach enables additional differentiation between insect- and climate-induced signatures. The new process-based multi-parameter algorithm is a suitable tool to identify different causes of growth disturbances and will therefore help to improve both tree-ring-based climate and insect defoliation reconstructions.
1. Introduction
Tree-ring chronologies are considered a powerful proxy to reconstruct past climate variability at annual resolution [1,2,3]. Reconstructions of climatic variables like summer temperature are performed at sites where it is the main factor limiting tree growth according to Liebig’s law of the minimum [4,5,6,7,8,9]. Even though summer temperature is the most limiting aspect in these locations, short-lived disturbances in the ecosystem can perturb the climate-growth relationship and bias final reconstructions [10]. Event detection is an important process not only in dendroclimatology but also for questions related to ecology. Disturbance factors can increase growth when thinning or similar processes remove competitive pressure [11,12], but typically result in growth reductions. Insect mass outbreaks [13,14] are a common example of a biotic disturbance causing such growth reductions.
The European Alps are home to extensive amounts of living trees and historical timber usable for dendroclimatic reconstructions [15,16,17]. Samples from high elevations are predominantly temperature-sensitive, and a combination of samples from living trees and historical construction wood enabled the development of well-replicated composite chronologies [7,15,16]. Strong negative temperature anomalies like the volcanic-induced “year without a summer” in 1816 [17,18,19] are clearly captured by the tree-ring chronologies [20]. Temperature reconstructions based on Larix decidua Mill. [21,22,23] are frequently used. However, larch growth is regularly affected by outbreaks of the larch budmoth [Zeiraphera griseana Hb., hereafter referred to as LBM] [24,25,26,27,28]. Cyclic mass outbreaks cause strong growth depressions every eight to ten years, which have been used to reconstruct LBM activity over the past 1200 years [29]. Their impact on climate reconstruction in the Valais has recently been demonstrated by [7,13].
Former studies have shown that LBM outbreaks can affect tree-ring width (TRW) and maximum latewood density (MXD) with a slight temporal offset (Figure 1C–E) [7,29,30]. During LBM outbreaks, the population peak of larvae tends to occur during May and June, depending on prevailing weather conditions [25], causing defoliation and the possible formation of new needles in late summer. As a consequence, earlywood formation in the LBM outbreak year is largely unaffected, as larvae feeding follows earlywood cell formation [31]. The latewood, however, is immediately affected since the trees cannot accumulate resources while defoliated, and latewood formation is dependent on current-year assimilation [29,32]. In the following, second year of a typical outbreak, earlywood formation is substantially reduced due to the shortage of previous year assimilates, while latewood formation can already benefit from the restored canopy conditions and regular photosynthesis throughput. The resulting pattern might be reflected in the relationship between TRW (which is mostly controlled by earlywood width (EWW)) and MXD, which depends on latewood formation. The ratio between EWW and latewood width (LWW) should be similarly affected, and thus, both combinations of parameters might serve as an indicator for LBM-induced growth depressions [30]. Since ring width has a larger memory effect compared to density [20,33], depressions of the former also usually extend over several years, while the response of MXD is limited to the initial outbreak year.
Whereas several approaches for detecting insect outbreaks in tree-ring data have been applied over the last few years [22,25,29,34], only comparisons between host and non-host information potentially enable the differentiation between defoliation and cooling events. However, such techniques may have their own limitations, such as differing temperature responses between species, secondary effects of outbreak events, or simply a lack of availability of non-host material [35]. Building on previous results, we present a process-based multi-parameter approach combining the temporally varying information from TRW, MXD, and EWW/LWW ratios to fill this gap. We apply our method to elevational gradients in two valleys of the European Alps and compare the detections with existing methods and literature evidence. This procedure provides us with a complete picture of LBM outbreak variations on a regional and elevational scale over two centuries. The results enable us to evaluate the advantages and shortcomings of each detection approach when distinguishing LBM from temperature events.
2. Materials and Methods
Larch samples were taken along two elevational transects in the Matter (3 sites) and Simplon Valleys (4 sites) of the Swiss Alps (Figure 1 and Table 1). Site abbreviations combine a letter for the respective valley (M = Matter Valley and S = Simplon) and a number for the elevational distance (in meters) from the local treeline derived from satellite images to account for varying exposures and microclimates. A Swiss stone pine (Pinus cembra L.) site (M40NH) was additionally included as a non-host site, representing tree growth unaffected by the LBM but under equal climatic conditions. Pinus cembra has been used in former studies as a non-host reference for LBM-affected stands [26,36]. Our pine site is located at treeline and directly adjacent to host site M40, providing optimal conditions for such comparisons.
A total of 230 increment cores were collected for TRW and MXD measurements. Cores were prepared with a sliding microtome, and TRW was measured at an accuracy of 0.01 mm using a LINTAB 6 measurement device (Rinntech, Germany) in combination with TSAP-WIN software [37]. After visual cross-dating, assigned calendar dates were confirmed through the COFECHA software [38]. MXD measurements were conducted using the DENDRO2003 X-ray microdensitometer (WALESCH Electronic GmbH, Switzerland) as described in [39]. Thereby, EWW and LWW measurements were also obtained. Due to the increase in overall stem diameter and stagnant tree productivity with biological age, annual radial growth is generally subject to an age-related decline. To uncover external effects on growth, such as climate variation or insect defoliation, this trend needs to be removed [3]. Here, cubic-smoothing splines with a 50% frequency cutoff at 30 years were applied to all series to eliminate low-frequency trends and preserve high-frequency variability related to LBM cyclicity. The detrending was performed using the ARSTAN software [40], and the resulting timeseries were standardized to z-scores to compare among parameters and sites. Red-noise corrected spectra were calculated to demonstrate the presence of LBM cyclicity in our larch timeseries using the “redfit” function of the “dplR” package [41,42].
Tree-ring series were cut off before 1800 and after 2009, during which all site chronologies exceeded a sample replication of four series. Four methods were applied to identify LBM outbreaks (1–4):
- Standard deviation (SD): The first method selects strong negative outliers exceeding 1.5 SD in both TRW and the MXD index chronologies;
- Normalized growth-suppression index (NGSI): This method was applied to single TRW and MXD larch series using the pine chronology from M40NH as a non-host reference to represent variability unrelated to LBM outbreaks. Outbreak duration was set to five years to account for the cyclicity of the LBM and avoid the identification of several events within the same cycle. The method detects outbreaks by selecting events that exceed an NGSI threshold value of −1.28, which has seen use across different species [43]. Two event years are defined per outbreak: the year in which the most single trees were defoliated according to their NGSI, and the year of the strongest outbreak-related growth departure represented by a minimum of the mean NGSI. Since the year of the minimum mean NGSI showed a higher agreement with the external defoliation data, these years were chosen for further analysis. This analysis was performed using the “dfoliatR” package in R [44];
- Impulse Indicator Saturation (IIS): Here, a regression model to detect structural breaks in time series is saturated with a maximum number of indicators, from which the non-significant ones are removed. 0.1 was chosen as the significance level for the t-tests, and the non-host pine chronology was used as an additional regressor in the model to support differentiating LBM- and non-LBM-related growth reductions. If several consecutive years were detected by this method, the one with the lowest coefficient (i.e., the strongest negative outlier) among them was chosen. This method is mainly used in econometrics but has also been successfully applied to tree-ring data [45]. We used the “gets” package in R [46];
- Our new process-based approach (PBA, Figure 2): Based on the characteristic LBM pattern in tree rings (cf. Figure 1C–E), we developed a stepwise procedure for LBM detection. First, the TRW series are analyzed to identify values exceeding 0.5 SD below the chronology mean in two consecutive years. TRW has been shown to be strongly affected for only one year in some cases and to recover already in the second year after the initial outbreak, albeit still being below average [36]. The relatively small threshold was chosen to account for these different outbreak patterns and to disregard as few actual outbreaks as possible. Any selected year that occurred within four years of the previous events was removed to account for the LBM cyclicity. As LBM populations decrease by a factor of many thousands after a mass outbreak [47,48], an LBM event cannot be followed by an additional outbreak in such a short time. Next, the residuals of a linear regression between TRW and MXD for the same years were calculated. They were checked for negative outliers exceeding 1 SD below the mean along with a reduction compared to the previous year to find the strongest outlier if consecutive years crossed the threshold. The same was done for the ratios between EWW and LWW. Outlier years in both parameters were then checked for coinciding TRW deviations. At this stage, two cases were considered an outbreak: if a negative TRW deviation year coincided with an outlier of either TRW-MXD residuals or EWW/LWW ratios, this year was defined as the first year of an LBM outbreak. Occasionally, such a TRW-MXD residual or EWW/LWW ratio event occurs one year after the onset of a negative TRW deviation period. In these cases, the year with the lowest MXD value was chosen since we considered MXD to be the most characteristic parameter for the start of an outbreak period. Moreover, we removed events occurring within four years after an existing event to obtain one initial year for each outbreak period.
The defoliation records and underlying sources published by [49] were used as external references for LBM outbreaks in the Valais. They include different defoliation intensities (light, medium, and heavy) applied to two consecutive years in some cases, while we focus on the year of strongest defoliation. When evaluating if a detected year coincides with an observed LBM year, a margin of two years in both directions was chosen to account for temporal offsets within and between valleys and delays among various tree-ring parameters. Therefore, if an event was originally recorded in 1865, a possible detection in 1863 would be considered a match in our approach, whereas a detection in 1862 would be outside the temporal range.
Superposed epoch analysis (SEA) [50] was used to evaluate growth deviations of the site chronologies in response to LBM outbreaks and compare detections among methods and sites. Five years preceding the LBM event were scaled to a mean of zero to emphasize growth changes during and after defoliation. In the SEA, we only considered detections that occurred at two or more sites during the same or two consecutive years to avoid local growth disturbances. If consecutive outbreak years were identified between the sites, only the first was included in the SEA, which was conducted using R version 4.1.1 [51].
3. Results
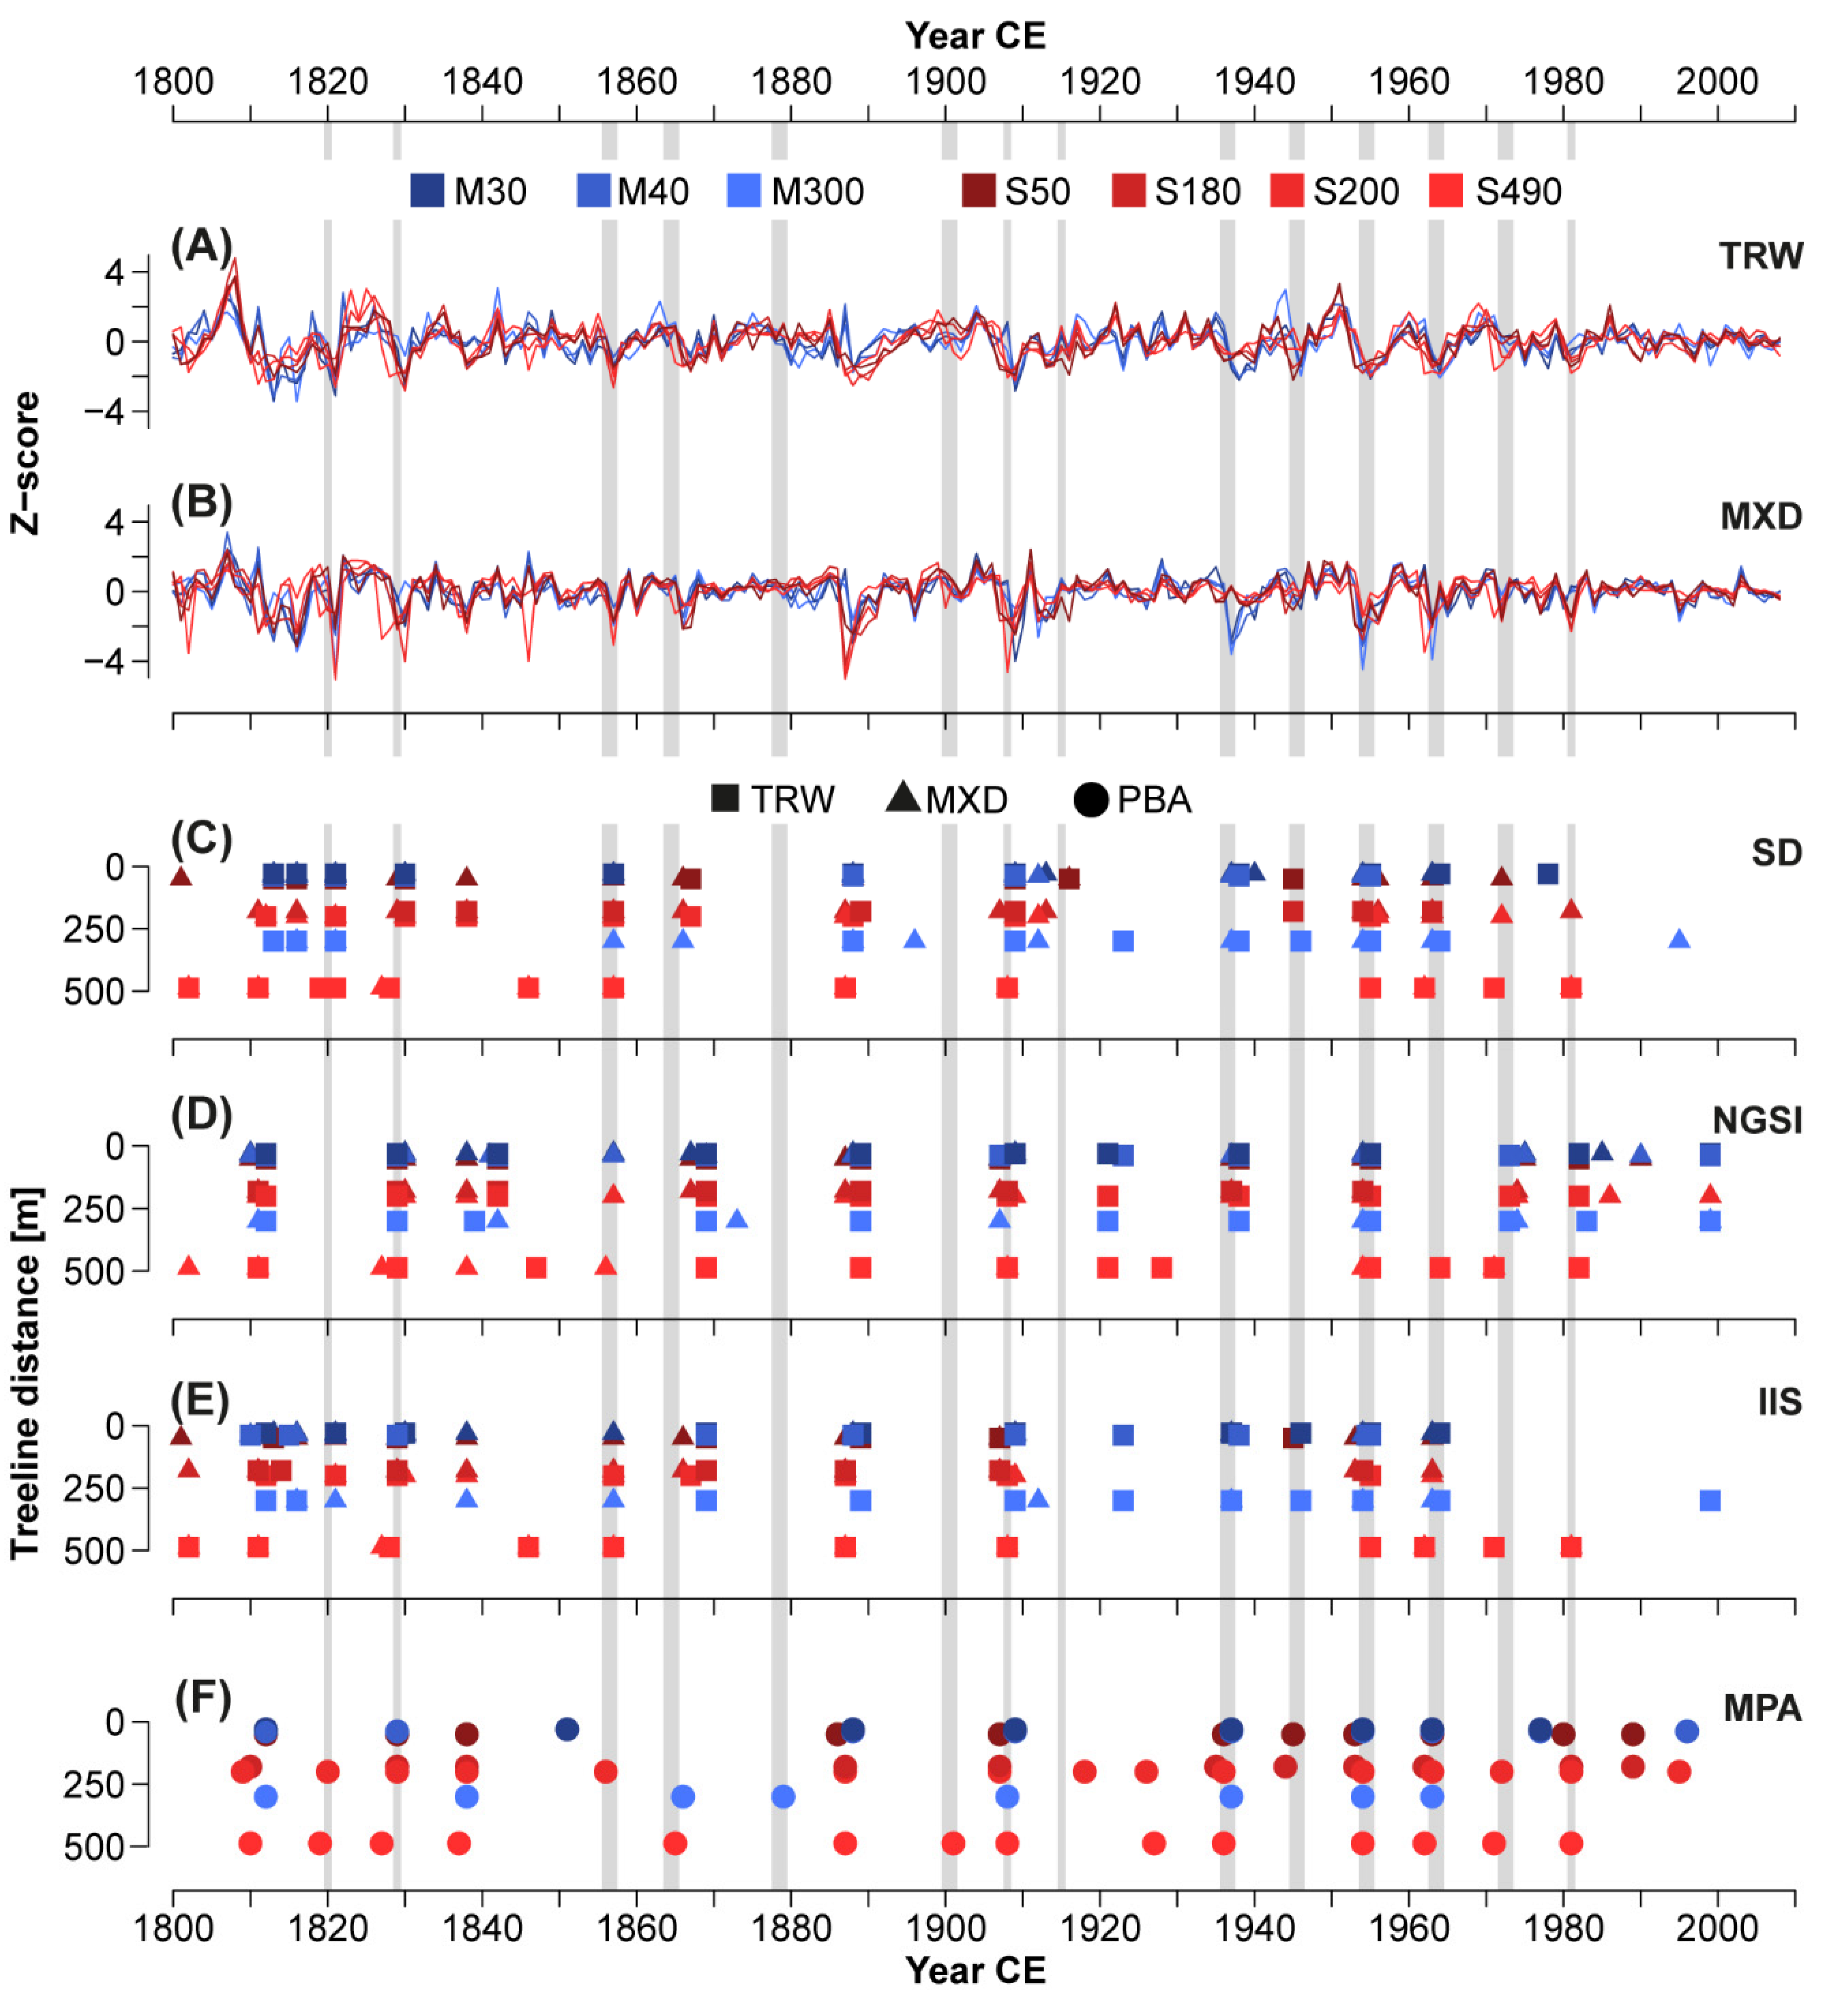
Between 1820 and 1981, 14 LBM defoliation events were observed and recorded in the Valais according to [49,52], which includes an additional event missing in the aforementioned compilation: 1820, 1829, 1856/57, 1865, 1878/79, 1900/01, 1908, 1915, 1936/37, 1945/46, 1954/55, 1963/64, 1972/73, and 1981 (Figure 3, grey bars). The presence of LBM outbreaks in the larch chronologies is visually evident from the regular and distinct negative TRW and MXD anomalies (Figure 3A,B). These downturns are typically stronger in MXD than in TRW, hinting at a higher potential for detecting outbreaks using the former parameter. The redfit spectra further underline the cyclic occurrence of LBM events in our data, as all larch chronologies indicate spectral peaks at a periodicity of eight to ten years (p < 0.05; Figure S1). M30 reveals the least significant cyclicity, hinting at mitigated LBM fingerprints at this high-elevation site, while the highest spectral peak appears in the S490 data. The non-host M40NH record, on the other hand, shows no distinct feature at this frequency. The spectral peak periodicities of the seven Matter and Simplon Valley larch chronologies all range from 8.9–9.7 years.
Considering both TRW and MXD, the application of the four methods (SD, NGSI, IIS, and PBA) resulted in a total of 471 detections, of which 286 were in accordance with one of the literature events (Figure 3). None of the methods detected all 14 of the literature events [49], but each method identified at least half of them at at least one site. The number of identified literature events ranged from seven using NGSI for both TRW and MXD to 13 using our PBA, which integrates a combination of TRW and MXD information. When examining the seven larch site chronologies individually during our period, including 14 documented events, a total of 98 detections would ideally result from each of the methods. However, using SD, only 44 and 48 detections that overlap with a recorded event occur with TRW and MXD, respectively. For other methods, these values are 36 and 35 for NGSI, 35 and 41 for IIS, and 47 using PBA. This translates into 36–49% of all documented events, with the highest values reached with PBA and SD applied to MXD. (Figure S2). When evaluating the suitability of the detection methods with our TRW and MXD data from different elevations and valleys, we found two types of errors: false-negatives, i.e., missing a documented outbreak, and false-positives, i.e., event detection when there was no outbreak.
How often the recorded defoliation events were detected varies considerably between the methods. Only 1829, 1908, 1936/37, and 1954/55 were detected by all methods in at least one site, with 1908 and 1954/55 reaching 94% and 88% of all potential detections, respectively. Contrarily, the literature events of 1878/79 and 1900/01 were only detected with PBA, and 1915 only with SD of TRW and MXD at one site. 1820 and 1945/46 remained undetected with NGSI but were recognized with all other method types. Most recorded events were detected in both valleys to a similar extent, albeit often with a slight temporal offset of the Simplon sites preceding those in the Matter Valley. The 1936/37 event, however, was detected in only 36% of all cases in the Simplon but 90% of all cases in the Matter Valley. This difference mainly results from SD and IIS, which only detected it in the three Matter Valley sites, while PBA detected it in all seven sites and NGSI in all but the Simplon site furthest from treeline (S490). The event of 1963/64 was detected by SD, IIS, and PBA at all sites, while NGSI only identified it in the TRW of S490. Conversely, NGSI detected the LBM outbreaks of 1972/73 and 1981 in all seven host sites, but IIS indicates only one (again, S490), and SD and PBA have three sites each, which are all located in the Simplon Valley.
185 out of the 471 total detections were not consistent with a literature event, thus potentially indicating false-positive errors. Most of these detections arise from nine growth deviations that were each detected by more than one method (1812/13, 1816, 1838, 1842, 1869, 1887/88, 1921/23, 1990, 1999). These were studied in more detail to assess possible sources of misdetection but also to critically reflect on the strength of the documented evidence. For instance, some of them might correspond to actual LBM events that remained unrecorded, at least in the Valais, where only two defoliation events were observed before 1850 [49].
1812/13, 1838, and 1887/88 were each detected by all four method types (SD, NGSI, IIS, and PBA). During the potential 1812/13 event, the high-elevation larch sites behaved similarly to the pine sites. S490 and S180 in particular contained low TRW and MXD values in 1811 already, whereas both the non-host and high-elevation host sites declined in 1813, indicating a drop in summer temperature during a decade of already exceptionally cold conditions [53] that might have coincided with an LBM mass outbreak. Since defoliation was reported in 1811 further west in the French Alps, the missing documentation in the Valais is likely caused by a lack of records from this early period of forestry research. In view of the recorded defoliation in the Valais in 1820, the event would also fit the LBM cyclicity.
The growth disturbance in 1838 appeared weaker in the tree-ring record but was still detected by all four method types and fits LBM cyclicity regarding the documented event of 1829. All host sites, including the directly adjacent M40, show contrasting growth to M40NH, while at the same time, the growth decline is far more pronounced in sites of lower elevation compared to the two closest to treeline. Both observations suggest a non-climatic cause for the decline in TRW and MXD.
During the growth decline in 1887/88, none of the host sites resembled the growth pattern of M40NH. Instead, there is a clear distinction between the two Swiss valleys. While the Simplon sites had already dropped in 1887, the Matter sites displayed above-average TRW and MXD data in 1887 but then sharply reduced values in 1888. Similar to the development during the observed events in 1908 and 1936/37, the lag implies a delayed occurrence of an LBM mass outbreak in the neighboring valley, indicating a real but unobserved LBM event in this case. Regarding the observed 1878/79 outbreak, it would also fit and complete the 9-year cyclicity of LBM activity. While not being recorded in the Valais, 1887/88 is in line with observations from the neighboring Engadine, approx. 140 km further east.
Detections in the remaining years were not as widespread but rather limited to particular methods and sites that might indicate misidentifications. 1816 was only detected with SD and IIS and coincides with an exceptionally cool summer in the region [54]. 1842 was only detected with NGSI for both TRW (five sites) and MXD (two sites). Similarly, 1869 was widely detected with NGSI (seven sites) and IIS (five sites) but did not appear with SD or PBA. NGSI also detected 1921 at four sites across both valleys. 1923 was detected only at Matter Valley sites by SD, NGSI, and IIS. 1990 was detected with NGSI and PBA, and 1999 with NGSI and IIS.
SEA was applied to the event years resulting from all detection methods and the literature evidence to assess differences in the timing and intensity of outbreaks among elevations and valleys. We found overall strong declines in both larch TRW and MXD during the initial (0) and following (1) years of a detected event, while the non-host (M40NH) appears unaffected (Figure 4). All methods reveal a prolonged response in TRW compared to MXD. However, they show both the lag between TRW and MXD and the lag between sites in the two valleys to different extents. Overall, the PBA indicates the most distinct pattern of all Simplon Valley sites being affected earlier and stronger than those in the Matter Valley for the TRW chronologies. The MXD appears to respond more synchronously among the sites to the events detected by NGSI and IIS. However, SD and PBA, as well as the documented events, display earlier MXD reductions in the lower-elevation Simplon sites and delayed reductions in the Matter sites.
4. Discussion
4.1. Differentiation of Temperature Events from LBM Outbreaks
Studying individual LBM events enables a detailed investigation of the advantages and limitations of each detection method (Figure 5). The severe LBM outbreak in 1954/55 is characterized by an earlier and more pronounced minimum in MXD, whereas TRW is reduced later, weaker, and over two or more years with the typical growth pattern (Figure 5A). Larch chronology means we reached it again in 1958. The regional non-host reference M40NH does not show this pattern, i.e., there is neither the sharp decline of 1954/55 nor the strong subsequent rise. Instead, non-host values remain close to the average in 1954/55 and decline more (TRW) or less strongly (MXD) in 1956/57. In the Matter and Simplon Valleys, this outbreak was captured by all methods in both TRW and MXD, demonstrating that such ideal examples do not pose a problem for any of the detection approaches.
Outbreaks that produce a less distinct fingerprint in the tree-ring data, such as 1900/01, are harder to detect (Figure 5B). In this case, only the PBA method recognized the event at one site (S490), where it produced two relatively narrow rings that were not significant enough to be detected by the other methods. Nevertheless, there is strong evidence that this outbreak took place in the study area, as severe defoliation has been reported from a non-specified location in the Valais in 1900 and from the Matter Valley in 1901 [49,55]. A similar situation occurred in 1878/79, during a recorded defoliation event in the Valais, which was again only detected using PBA. The detections of these less distinct outbreaks reveal the PBA to be particularly suitable for events during which only light defoliation occurred in the initial outbreak year and overall weak effects persisted into subsequent years [49]. At the same time, PBA may also detect event years that were not caused by insect defoliations when its thresholds are too lenient. Conversely, if the persistence of LBM effects is limited by, e.g., favorable weather patterns, a significant growth reduction may only occur in one year [24]. Such shorter events like 1820 and 1865 are more likely to be detected by methods that focus on strong negative outliers in a single year, such as SD and IIS. PBA detected these outbreaks at fewer sites.
A different challenge arises when severe cooling causes a distinct reduction in tree-ring growth. A good example is the 1816 “year without a summer” following the Tambora eruption [56,57] that led to strong negative outliers in both TRW and MXD [20,54] and was therefore also only detected by the SD and, to a lesser extent, IIS methods that only focus on distinct short-term variations (Figure 5C). 1816 was not detected by PBA, which identified 1812 as the onset of a mass outbreak. Therefore, it had to ignore any subsequent deviation in the following four years, even if 1816 had fulfilled the multi-parameter criteria necessary for detection.
According to instrumental records, a cold summer temperature anomaly of a magnitude similar to that of 1816 occurred again in 1821 [54]. However, tree growth this year was simultaneously affected by an LBM outbreak [58]. Since the growth of both the host and the non-host trees was reduced, the event remained undetected with NGSI, whereas PBA indicated an outbreak in two sites. Detection at other sites was probably prevented by the atypical nature of the event, characterized by a sharp but short reduction in TRW. However, it remains unclear to what extent this reduction was induced by defoliation or cooling. Aside from their dependence on late winter and spring conditions, LBM outbreaks have been shown to have co-occurred with low summer temperatures in many cases during the past centuries [59], further complicating such distinctions. The support from PBA to distinguish between these two features will improve both insect defoliation and temperature reconstructions.
For some events, misdetections can also be attributed to the use of the M40NH pine chronology as a proxy for external, non-LBM growth variability. This mainly affects the NGSI method, which does not rely on absolute TRW deviations but considers residuals between host and non-host timeseries. Whereas this approach has been proven skillful in past studies [59,60], strong positive deviations in non-host chronologies can lead to erroneous detections of negative outliers in host chronologies. Although our pine site is located near treeline and in close proximity to the larch sites, the non-host growth variability differs substantially (r between M40 and M40NH is 0.45 for the TRW and 0.46 for the MXD chronologies with p ≤ 0.001). For instance, the 1842, 1869, and 1921 events were mainly identified as LBM outbreaks by those methods that use the pine chronology as an additional benchmark. These events do, however, not fit the LBM cyclicity but occurred thirteen, four, and six years after documented defoliation events, respectively. The 1869 event coincides with a TRW maximum in the non-host site, while S490 indicates an average and all other larch sites have slightly negative TRW, resulting in detection by NGSI in all cases (Figure 5D). For MXD, the differences between larch and pine are smaller but still large enough for NGSI to detect an event at one out of seven sites. In 1869, March temperatures were 3.6 °C and June temperatures were 2.1 °C below the 1864–1893 mean recorded at the nearby Graechen meteorological station [61]. These deviations might have triggered a growth reduction in larch, while pine remained less affected. Since M40NH is located closer to the treeline than most of the larch sites, the differing growing season lengths could have biased the comparison along elevational transects [31].
Other events that do not appear in the documentary records of the Valais but were detected at various tree-ring sites occurred in 1926/27 and 1990. PBA identified 1926/27 at two sites, and the event fits nicely into the LBM cycle and observations from the neighboring Engadine region. However, we do not definitively regard it as an LBM outbreak at our sites, as we do not consider the sum of our observations clear enough. In the 1990 case, the initial larvae counts in the Swiss Alps matched the growth reduction, but a mass outbreak finally failed and no visible defoliation was recorded, most probably due to too warm winter temperatures [10,62]. In our data, the 1990 event was only detected at sites close to the treeline, which is corroborated by the fact that LBM epicenters would move upward in a warmer climate [63]. Due to the colder conditions in high-elevation environments, a potential temporal mismatch between early larvae and late needle development might have been mitigated so that only these sites experienced substantial defoliation. This might have restricted a mass outbreak with defoliation and growth reduction to M40, S50, and S180, where the event was detected.
Overall, all the detection methods tested here failed in ≥50% of the type I false-negative errors. This score may appear low, but it reflects the circumstance that LBM outbreaks are spatially heterogenous and were likely too weak in the tested sites and respective years to have a significant enough effect on wood formation. Methods relying on non-host information also missed event years that coincided with a cold summer and therefore showed similar patterns in host and non-host growth. On the other hand, only 74 out of the total 471 detections occurred independently from LBM events (type II error). These misdetections mainly result from methods that focus only on negative outliers in host data and from uncertainty arising from varying climate sensitivities inherent to the non-host data. Our new PBA demonstrated its ability to overcome some of these limitations, as the combination of tree-ring parameters and lag times mitigates type I and II errors in many cases and supports the detection of the documented events.
4.2. Elevational and Valley Differences
Overall, two major findings appear most clearly if LBM years are detected using our new PBA approach: the Simplon Valley sites are affected earlier and stronger than those in the Matter Valley, and the sites closer to the treeline are less affected than those 200–500 m below. The difference from established methods arises from PBA’s skill to distinguish LBM outbreaks from severe cooling that simultaneously affects both valleys and would presumably have caused the opposite patterns on the elevational gradients [7]. In contrast, the other methods seem to be more prone to misdetections caused by such temperature anomalies.
LBM events have been shown to spread in waves in an easterly direction across the Alps, causing asynchronous appearances in different regions along the mountain chain [64]. The cyclicity of outbreaks appears to be controlled by several factors, including the negative feedback in needle quality and parasitic insects (e.g., ichneumon and tachinid flies) that act as natural predators and control LBM population density [48,65]. Applying SEA to event years derived from the four methods tested here as well as the observed events indicates an earlier response in the Simplon Valley sites compared to those in the Matter Valley, which are located further southwest. This spatial pattern is particularly striking in the TRW data. While this contradicts the findings of [64] and [66], showing a northeastern direction of propagation in the Swiss Alps, the observed temporal shift is rather small-scale and likely affected by local topography. The massive Weisshorngruppe west of the Matter Valley, which barely falls short of 3500 m a.s.l., very likely acts as a natural barrier hindering LBM expansion. LBM populations may therefore first spread eastward, following the deep Rhone Valley, before moving south up the Matter Valley. While the Simplon Valley is also surrounded by mountain chains, the western peaks reach elevations of only ~2500 m a.s.l., and the studied larch sites are located closer to the Rhone Valley.
The general trend of larch sites close to the treeline being less affected within the same valley is in accordance with a previous study across the European Alps [63] and more regionally in the Engadine region. Their results suggested a maximum LBM impact at ~1800 m a.s.l., which equals a treeline distance of around 400 m for our study [36]. However, the lowest Matter site (M300) showed smaller TRW and MXD signals compared to the high-elevation Simplon sites, indicating that the differences between valleys overcompensate the elevational effects, at least in this case. M30 and M40 display the weakest responses to LBM events, even smaller than S50, which is at a similar distance to the treeline. Still, the latter showed the least strong reaction to LBM events compared to the three Simplon Valley sites further away from the treeline.
The cyclic pattern of LBM activity has remained unchanged across the Alps over the past millennium [29]. Its populations have, however, decreased since the 1980s and did not cross the threshold that would lead to widespread larch defoliation except for one event in 2017/18 [10]. This is believed to be an effect of climate change resulting in warmer conditions in the LBM Alpine distribution area. Increased late winter and early spring temperatures likely decoupled the synchronicity of egg hatching and foliage development, causing increased larval mortality [10,63]. In our data, all methods largely cease to detect events after 1990, with a few exceptions. The two most recent LBM events of 1972/73 and 1981 are already detected less frequently in the Matter Valley data compared to the Simplon. The differences between those events detected by the four methods and the events observed and documented in the literature indicate potential gaps in the latter, as originally suggested by the authors themselves [49]. The overall increase in events over time is the result of the growing numbers of our observations and associated literature since the beginning of the 19th century. The large-scale spatial division of the Alps [49] assigns both the Matter and the Simplon Valleys to the same region (Valais), which is a simplification of the actual conditions. The discrepancies in the timing and intensity of growth responses to LBM outbreaks between the Simplon and Matter Valley sites, as shown here, demonstrate that such variability may occur at sub-regional scales. The differences between the two valleys are at least as strong as the differences along the elevational transects, even though the sites are all within 40 km of each other.
5. Conclusions
The Valais in the Swiss Alps represents a unique region to test the performance of LBM detection methods since unprecedented, continuous documentation of larch infestation events is available there. Using this information in combination with multi-parameter tree-ring data along elevational transects, we demonstrate that the timing and intensity of LBM mass outbreaks vary at small spatial scales and thus deviate from defoliation data that typically integrate larger regions. We show that the outbreak history for a certain valley can be skillfully reconstructed over centuries if the information from various tree-ring parameters, including TRW, EWW, LWW, and MXD, is combined in a stepwise detection. The approach presented here, considering multiple physiological effects of insect outbreaks on wood formation, provides additional insight compared to classic detection methods and host vs. non-host comparisons. Further tests appear beneficial to verify the robustness of the approach in other regions with varying LBM and climate conditions.
Supplementary Materials
The following supporting information can be downloaded at: https://www.mdpi.com/article/10.3390/f14071478/s1, Figure S1: Redfit spectral analysis of TRW chronologies; Figure S2: Detection of recorded defoliation events in the Valais, split up by methods and sites.
Author Contributions
M.K.: conceptualization, methodology, data curation, writing—original draft; J.E.: conceptualization, writing—review and editing and supervision; E.K.: writing—review and editing; L.S.: writing—review and editing and methodology; U.B.: writing—review and editing; C.H.: conceptualization, methodology, writing—review and editing, supervision, and resources. All authors have read and agreed to the published version of the manuscript.
Funding
This research was funded by the ERC Advanced Grant Monostar (AdG 882727), SustES (CZ.02.1.01/0.0/0.0/16_019/0000797), the Gutenberg Research College, and the German Research Foundation (HA 8048/1-1).
Data Availability Statement
Tree-ring data will be made available at the International Tree Ring Data Bank.
Acknowledgments
We are grateful to Max Torbenson for his enduring support and valuable scientific input. We thank the local foresters for sampling permissions and Lara Klippel, Birgit Wöste, Markus Kochbeck, Jannes Fischer, Christian Gnaneswaran, Benedikt Lang, Lara Meurer, Bianca Müller, Frederick Reinig, Philipp Schulz, Nora Jubelius, and Sophie Spelsberg for help in the field and/or laboratory.
Conflicts of Interest
The authors declare no conflict of interest.
References
- Esper, J.; Cook, E.R.; Schweingruber, F.H. Low-Frequency Signals in Long Tree-Ring Chronologies for Reconstructing Past Temperature Variability. Science 2002, 295, 2250–2253. [Google Scholar] [CrossRef] [Green Version]
- Esper, J.; Frank, D.C.; Timonen, M.; Zorita, E.; Wilson, R.J.S.; Luterbacher, J.; Holzkämper, S.; Fischer, N.; Wagner, S.; Nievergelt, D.; et al. Orbital Forcing of Tree-Ring Data. Nat. Clim. Chang. 2012, 2, 862–866. [Google Scholar] [CrossRef]
- Fritts, H.C. Tree Rings and Climate; Elsevier Science: Tucson, AZ, USA, 1976. [Google Scholar]
- Affolter, P.; Büntgen, U.; Esper, J.; Rigling, A.; Weber, P.; Luterbacher, J.; Frank, D. Inner Alpine Conifer Response to 20th Century Drought Swings. Eur. J. For. Res. 2010, 129, 289–298. [Google Scholar] [CrossRef] [Green Version]
- Fritts, H.C.; Smith, D.G.; Cardis, J.W.; Budelsky, C.A. Tree-Ring Characteristics Along a Vegetation Gradient in Northern Arizona. Ecology 1965, 46, 394–401. [Google Scholar] [CrossRef]
- Hartl, C.; Düthorn, E.; Tejedor, E.; Kirchhefer, A.J.; Timonen, M.; Holzkämper, S.; Büntgen, U.; Esper, J. Micro-Site Conditions Affect Fennoscandian Forest Growth. Dendrochronologia 2021, 65, 125787. [Google Scholar] [CrossRef]
- Hartl, C.; Schneider, L.; Riechelmann, D.F.C.; Kuhl, E.; Kochbeck, M.; Klippel, L.; Büntgen, U.; Esper, J. The Temperature Sensitivity along Elevational Gradients Is More Stable in Maximum Latewood Density than Tree-Ring Width. Dendrochronologia 2022, 73, 125958. [Google Scholar] [CrossRef]
- Sprengel, P.C. Von Der Substanz der Ackerkrume und Des Untergrundes. J. Tech. Ökon. Chem. 1828, 3, 42–99. [Google Scholar]
- Stine, A.R.; Huybers, P. Implications of Liebig’s Law of the Minimum for Tree-Ring Reconstructions of Climate. Environ. Res. Lett. 2017, 12, 114018. [Google Scholar] [CrossRef]
- Büntgen, U.; Liebhold, A.; Nievergelt, D.; Wermelinger, B.; Roques, A.; Reinig, F.; Krusic, P.J.; Piermattei, A.; Egli, S.; Cherubini, P.; et al. Return of the Moth: Rethinking the Effect of Climate on Insect Outbreaks. Oecologia 2020, 192, 543–552. [Google Scholar] [CrossRef] [PubMed] [Green Version]
- Esper, J.; Benz, M.; Pederson, N. Influence of Wood Harvest on Tree-Ring Time-Series of Picea Abies in a Temperate Forest. For. Ecol. Manag. 2012, 284, 86–92. [Google Scholar] [CrossRef] [Green Version]
- Pretzsch, H. The Emergent Past: Past Natural and Human Disturbances of Trees Can Reduce Their Present Resistance to Drought Stress. Eur. J. For. Res. 2022, 141, 87–104. [Google Scholar] [CrossRef]
- Hartl-Meier, C.; Esper, J.; Liebhold, A.; Konter, O.; Rothe, A.; Büntgen, U. Effects of Host Abundance on Larch Budmoth Outbreaks in the European Alps. Agric. For. Entomol. 2017, 19, 376–387. [Google Scholar] [CrossRef]
- Speer, J.H.; Kulakowski, D. Creating a Buzz: Insect Outbreaks and Disturbance Interactions. In Dendroecology; Amoroso, M.M., Daniels, L.D., Baker, P.J., Camarero, J.J., Eds.; Ecological Studies; Springer International Publishing: Cham, Switzerland, 2017; Volume 231, pp. 231–255. ISBN 978-3-319-61668-1. [Google Scholar]
- Büntgen, U.; Frank, D.C.; Nievergelt, D.; Esper, J. Summer Temperature Variations in the European Alps, a.d. 755–2004. J. Clim. 2006, 19, 5606–5623. [Google Scholar] [CrossRef]
- Kuhl, E.; Zang, C.; Esper, J.; Riechelmann, D.F.C.; Büntgen, U.; Briesch, M.; Reinig, F.; Römer, P.; Konter, O.; Schmidhalter, M.; et al. Using Machine Learning to Provenance the Geographical Origin of Historical Construction Timbers. Ecosphere 2023, 14, e4453. [Google Scholar] [CrossRef]
- Cole-Dai, J.; Ferris, D.; Lanciki, A.; Savarino, J.; Baroni, M.; Thiemens, M.H. Cold Decade (AD 1810–1819) Caused by Tambora (1815) and Another (1809) Stratospheric Volcanic Eruption. Geophys. Res. Lett. 2009, 36, L22703. [Google Scholar] [CrossRef] [Green Version]
- Harington, C.R. The Year without a Summer: World Climate in 1816; Canadian Museum of Nature: Ottawa, ON, USA, 1992; ISBN 978-0-660-13063-7. [Google Scholar]
- Luterbacher, J.; Pfister, C. The Year without a Summer. Nat. Geosci. 2015, 8, 246–248. [Google Scholar] [CrossRef]
- Frank, D.C.; Büntgen, U.; Böhm, R.; Maugeri, M.; Esper, J. Warmer Early Instrumental Measurements versus Colder Reconstructed Temperatures: Shooting at a Moving Target. Quat. Sci. Rev. 2007, 26, 3298–3310. [Google Scholar] [CrossRef]
- Büntgen, U.; Esper, J.; Frank, D.; Nicolussi, K.; Schmidhalter, M. A 1052-Year Tree-Ring Proxy for Alpine Summer Temperatures. Clim. Dyn. 2005, 25, 141–153. [Google Scholar] [CrossRef] [Green Version]
- Büntgen, U.; Frank, D.; Liebhold, A.; Johnson, D.; Carrer, M.; Urbinati, C.; Grabner, M.; Nicolussi, K.; Levanic, T.; Esper, J. Three Centuries of Insect Outbreaks across the European Alps. New Phytol. 2009, 182, 929–941. [Google Scholar] [CrossRef]
- Saulnier, M.; Corona, C.; Stoffel, M.; Guibal, F.; Edouard, J.-L. Climate-Growth Relationships in a Larix Decidua Mill. Network in the French Alps. Sci. Total Environ. 2019, 664, 554–566. [Google Scholar] [CrossRef]
- Baltensweiler, W.; Weber, U.M.; Cherubini, P. Tracing the Influence of Larch-Bud-Moth Insect Outbreaks and Weather Conditions on Larch Tree-Ring Growth in Engadine (Switzerland). Oikos 2008, 117, 161–172. [Google Scholar] [CrossRef]
- Baltensweiler, W.; Fischlin, A. The Larch Budmoth in the Alps. In Dynamics of Forest Insect Populations; Berryman, A.A., Ed.; Springer: Boston, MA, USA, 1988; pp. 331–351. ISBN 978-1-4899-0791-2. [Google Scholar]
- Konter, O.; Esper, J.; Liebhold, A.; Kyncl, T.; Schneider, L.; Düthorn, E.; Büntgen, U. Tree-Ring Evidence for the Historical Absence of Cyclic Larch Budmoth Outbreaks in the Tatra Mountains. Trees 2015, 29, 809–814. [Google Scholar] [CrossRef]
- Schweingruber, F.H. Auswirkungen Des Lärchenwicklerbefalls Auf Die Jahrringstruktur Der Lärche. Schweiz. Z. Forstwes. 1979, 130, 1071–1093. [Google Scholar]
- Weidner, K.; Heinrich, I.; Helle, G.; Löffler, J.; Neuwirth, B.; Schleser, G.H.; Vos, H. Consequences of Larch Budmoth Outbreaks on the Climatic Significance of Ring Width and Stable Isotopes of Larch. Trees 2010, 24, 399–409. [Google Scholar] [CrossRef]
- Esper, J.; Büntgen, U.; Frank, D.C.; Nievergelt, D.; Liebhold, A. 1200 Years of Regular Outbreaks in Alpine Insects. Proc. Biol. Sci. 2007, 274, 671–679. [Google Scholar] [CrossRef]
- Rozenberg, P.; Pâques, L.; Huard, F.; Roques, A. Direct and Indirect Analysis of the Elevational Shift of Larch Budmoth Outbreaks along an Elevation Gradient. Front. For. Glob. Chang. 2020, 3, 86. [Google Scholar] [CrossRef]
- Moser, L.; Fonti, P.; Büntgen, U.; Esper, J.; Luterbacher, J.; Franzen, J.; Frank, D. Timing and Duration of European Larch Growing Season along Altitudinal Gradients in the Swiss Alps. Tree Physiol. 2010, 30, 225–233. [Google Scholar] [CrossRef]
- Pallardy, S. Physiology of Woody Plants; Academic Press: New York, NY, USA, 2018. [Google Scholar]
- Esper, J.; Schneider, L.; Smerdon, J.E.; Schöne, B.R.; Büntgen, U. Signals and Memory in Tree-Ring Width and Density Data. Dendrochronologia 2015, 35, 62–70. [Google Scholar] [CrossRef] [Green Version]
- Arbellay, E.; Jarvis, I.; Chavardès, R.D.; Daniels, L.D.; Stoffel, M. Tree-Ring Proxies of Larch Bud Moth Defoliation: Latewood Width and Blue Intensity Are More Precise than Tree-Ring Width. Tree Physiol. 2018, 38, 1237–1245. [Google Scholar] [CrossRef] [Green Version]
- Ryerson, D.E.; Swetnam, T.W.; Lynch, A.M. A Tree-Ring Reconstruction of Western Spruce Budworm Outbreaks in the San Juan Mountains, Colorado, U.S.A. Can. J. For. Res. 2003, 33, 1010–1028. [Google Scholar] [CrossRef]
- Weber, U.M. Dendroecological Reconstruction and Interpretation of Larch Budmoth (Zeiraphera diniana) Outbreaks in Two Central Alpine Valleys of Switzerland from 1470–1990. Trees 1997, 11, 277–290. [Google Scholar] [CrossRef]
- Rinn, F. TSAP-WinTM; Rinntech: Heidelberg, Germany, 2003. [Google Scholar]
- Holmes, R.L. Computer-Assisted Quality Control in Tree-Ring Dating and Measurement. Tree-Ring Bull. 1983, 43, 69–78. [Google Scholar]
- Björklund, J.; Arx, G.; Nievergelt, D.; Wilson, R.; van den Bulcke, J.; Günther, B.; Loader, N.J.; Rydval, M.; Fonti, P.; Scharnweber, T.; et al. Scientific Merits and Analytical Challenges of Tree–Ring Densitometry. Rev. Geophys. 2019, 57, 1224–1264. [Google Scholar] [CrossRef] [Green Version]
- Cook, E.R. A Time Series Analysis Approach to Tree Ring Standardization; University of Arizona: Tucson, AZ, USA, 1985. [Google Scholar]
- Bunn, A.G. A Dendrochronology Program Library in R (DplR). Dendrochronologia 2008, 26, 115–124. [Google Scholar] [CrossRef]
- Schulz, M.; Mudelsee, M. REDFIT: Estimating Red-Noise Spectra Directly from Unevenly Spaced Paleoclimatic Time Series. Comput. Geosci. 2002, 28, 421–426. [Google Scholar] [CrossRef]
- Lynch, A.M. What Tree-Ring Reconstruction Tells Us about Conifer Defoliator Outbreaks. In Insect Outbreaks Revisited; Blackwell Publishing Ltd.: Hoboken, NJ, USA, 2012; pp. 126–154. ISBN 978-1-118-29520-5. [Google Scholar]
- Guiterman, C.H.; Lynch, A.M.; Axelson, J.N. DfoliatR: An R Package for Detection and Analysis of Insect Defoliation Signals in Tree Rings. Dendrochronologia 2020, 63, 125750. [Google Scholar] [CrossRef]
- Schneider, L.; Smerdon, J.E.; Pretis, F.; Hartl-Meier, C.; Esper, J. A New Archive of Large Volcanic Events over the Past Millennium Derived from Reconstructed Summer Temperatures. Environ. Res. Lett. 2017, 12, 094005. [Google Scholar] [CrossRef]
- Pretis, F.; Reade, J.J.; Sucarrat, G. Automated General-to-Specific (GETS) Regression Modeling and Indicator Saturation for Outliers and Structural Breaks. J. Stat. Softw. 2018, 86, 1–44. [Google Scholar] [CrossRef]
- Baltensweiler, W.; Benz, G.; Bovey, P.; Delucchi, V. Dynamics of Larch Bud Moth Populations. Annu. Rev. Entomol. 1977, 22, 79–100. [Google Scholar] [CrossRef]
- Turchin, P.; Wood, S.N.; Ellner, S.P.; Kendall, B.E.; Murdoch, W.W.; Fischlin, A.; Casas, J.; McCauley, E.; Briggs, C.J. Dynamical Effects of Plant Quality and Parasitism on Population Cycles of Larch Budmoth. Ecology 2003, 84, 1207–1214. [Google Scholar] [CrossRef] [Green Version]
- Baltensweiler, W.; Rübli, D. Dispersal: An Important Driving Force of the Cyclic Population Dynamics of the Larch Bud Moth, Zeiraphera diniana Gn. For. Snow Landsc. Res. 1999, 74, 3–153. [Google Scholar]
- Chree, C. Some Phenomena of Sunspots and of Terrestrial Magnetism at Kew Observatory. Philos. Trans. R. Soc. Lond. Ser. A 1913, 212, 75–116. [Google Scholar]
- R Core Team. R: A Language and Environment for Statistical Computing; R Foundation for Statistical Computing: Vienna, Austria, 2021. [Google Scholar]
- Bieber, A. Die Bekämpfung Des Grauen Lärchenwicklers in Den Wäldern Des Oberengadins. Prism. Illus. Monatsschrift Nat. Forsch. Tech. 1946, 1, 23–27. [Google Scholar]
- Reichen, L.; Burgdorf, A.-M.; Brönnimann, S.; Franke, J.; Hand, R.; Valler, V.; Samakinwa, E.; Brugnara, Y.; Rutishauser, T. A Decade of Cold Eurasian Winters Reconstructed for the Early 19th Century. Nat. Commun. 2022, 13, 2116. [Google Scholar] [CrossRef] [PubMed]
- Büntgen, U.; Trnka, M.; Krusic, P.J.; Kyncl, T.; Kyncl, J.; Luterbacher, J.; Zorita, E.; Ljungqvist, F.C.; Auer, I.; Konter, O.; et al. Tree-Ring Amplification of the Early Nineteenth-Century Summer Cooling in Central Europe. J. Clim. 2015, 28, 5272–5288. [Google Scholar] [CrossRef] [Green Version]
- Barbey, A. Traité D’entomologie Forestière; Berger-Levrault: Nancy, France; Paris, France; Strasbourg, France, 1925. [Google Scholar]
- Esper, J.; Büntgen, U.; Luterbacher, J.; Krusic, P.J. Testing the Hypothesis of Post-Volcanic Missing Rings in Temperature Sensitive Dendrochronological Data. Dendrochronologia 2013, 31, 216–222. [Google Scholar] [CrossRef]
- Esper, J.; Schneider, L.; Krusic, P.J.; Luterbacher, J.; Büntgen, U.; Timonen, M.; Sirocko, F.; Zorita, E. European Summer Temperature Response to Annually Dated Volcanic Eruptions over the Past Nine Centuries. Bull. Volcanol. 2013, 75, 736. [Google Scholar] [CrossRef] [Green Version]
- Coaz, J. Über Das Auftreten des Grauen Lärchenwicklers (Steganoptycha pinicola Zell.) in der Schweiz und Den Angrenzenden Staaten; Stämpfli: Bern, Switzerland, 1894. [Google Scholar]
- Kress, A.; Saurer, M.; Büntgen, U.; Treydte, K.S.; Bugmann, H.; Siegwolf, R.T.W. Summer Temperature Dependency of Larch Budmoth Outbreaks Revealed by Alpine Tree-Ring Isotope Chronologies. Oecologia 2009, 160, 353–365. [Google Scholar] [CrossRef] [Green Version]
- Rolland, C.; Baltensweiler, W.; Petitcolas, V. The Potential for Using Larix Decidua Ring Widths in Reconstructions of Larch Budmoth (Zeiraphera diniana) Outbreak History: Dendrochronological Estimates Compared with Insect Surveys. Trees 2001, 15, 414–424. [Google Scholar] [CrossRef]
- MeteoSchweiz. Available online: https://www.meteoschweiz.admin.ch/service-und-publikationen/applikationen/messwerte-und-messnetze.html (accessed on 14 March 2023).
- Baltensweiler, W. Why the Larch Bud-Moth Cycle Collapsed Why the Larch Bud-Moth Cycle Collapsed in the Subalpine Larch-Cembran Pine Forests in the Year 1990 for the First Time since 1850. Oecologia 1993, 94, 62–66. [Google Scholar] [CrossRef]
- Johnson, D.M.; Büntgen, U.; Frank, D.C.; Kausrud, K.; Haynes, K.J.; Liebhold, A.M.; Esper, J.; Stenseth, N.C. Climatic Warming Disrupts Recurrent Alpine Insect Outbreaks. Proc. Natl. Acad. Sci. USA 2010, 107, 20576–20581. [Google Scholar] [CrossRef] [PubMed]
- Bjørnstad, O.N.; Peltonen, M.; Liebhold, A.M.; Baltensweiler, W. Waves of Larch Budmoth Outbreaks in the European Alps. Science 2002, 298, 1020–1023. [Google Scholar] [CrossRef] [PubMed] [Green Version]
- Wermelinger, B.; Forster, B.; Nievergelt, D. Cycles and Importance of the Larch Budmoth. WSL Fact Sheet 2018, 61, 12. [Google Scholar]
- Johnson, D.M.; Bjørnstad, O.N.; Liebhold, A.M. Landscape Geometry and Travelling Waves in the Larch Budmoth. Ecol. Lett. 2004, 7, 967–974. [Google Scholar] [CrossRef]
Figure 1.
(A) Natural distribution of Larix decidua Mill. and delimitation of larch budmoth (LBM) outbreak regions and tree-ring sampling sites in the Swiss Alps (rectangle); (B) Location of the seven tree sites in the Matter (blue) and Simplon Valleys (red). Values indicate distances to local treelines in meters; (C) Sample showing the typical tree-ring pattern of a LBM mass outbreak (here in 1963/64); (D) X-ray image of the same sample, including TRW and MXD timeseries; (E) Zoom-in and description of the typical pattern of TRW, EWW, LWW, and MXD in the outbreak year (year 0) and the following year (year 1).

Figure 2.
Decision tree of our process-based approach.

Figure 3.
(A) TRW and (B) MXD chronologies of seven larch sites in the Swiss Alps (Simplon = red, Matter Valley = blue) and detected events according to (C) standard deviation (SD), (D) normalized growth-suppression index (NGSI), (E) impulse indicator saturation (IIS), and (F) our newly developed process-based approach (PBA). Grey bars indicate LBM events according to literature data [49], squares refer to results from TRW, triangles from MXD, and circles to a combination of TRW and MXD data.

Figure 4.
Superposed epoch analyses (SEA) of LBM events (=year 0) as indicated by (A) literature evidence [49]; (B) standard deviation (SD),; (C) normalized growth-suppression index (NGSI); (D) impulse indicator saturation (IIS); and (E) our newly developed process-based approach (PBA).
Figure 4.
Superposed epoch analyses (SEA) of LBM events (=year 0) as indicated by (A) literature evidence [49]; (B) standard deviation (SD),; (C) normalized growth-suppression index (NGSI); (D) impulse indicator saturation (IIS); and (E) our newly developed process-based approach (PBA).

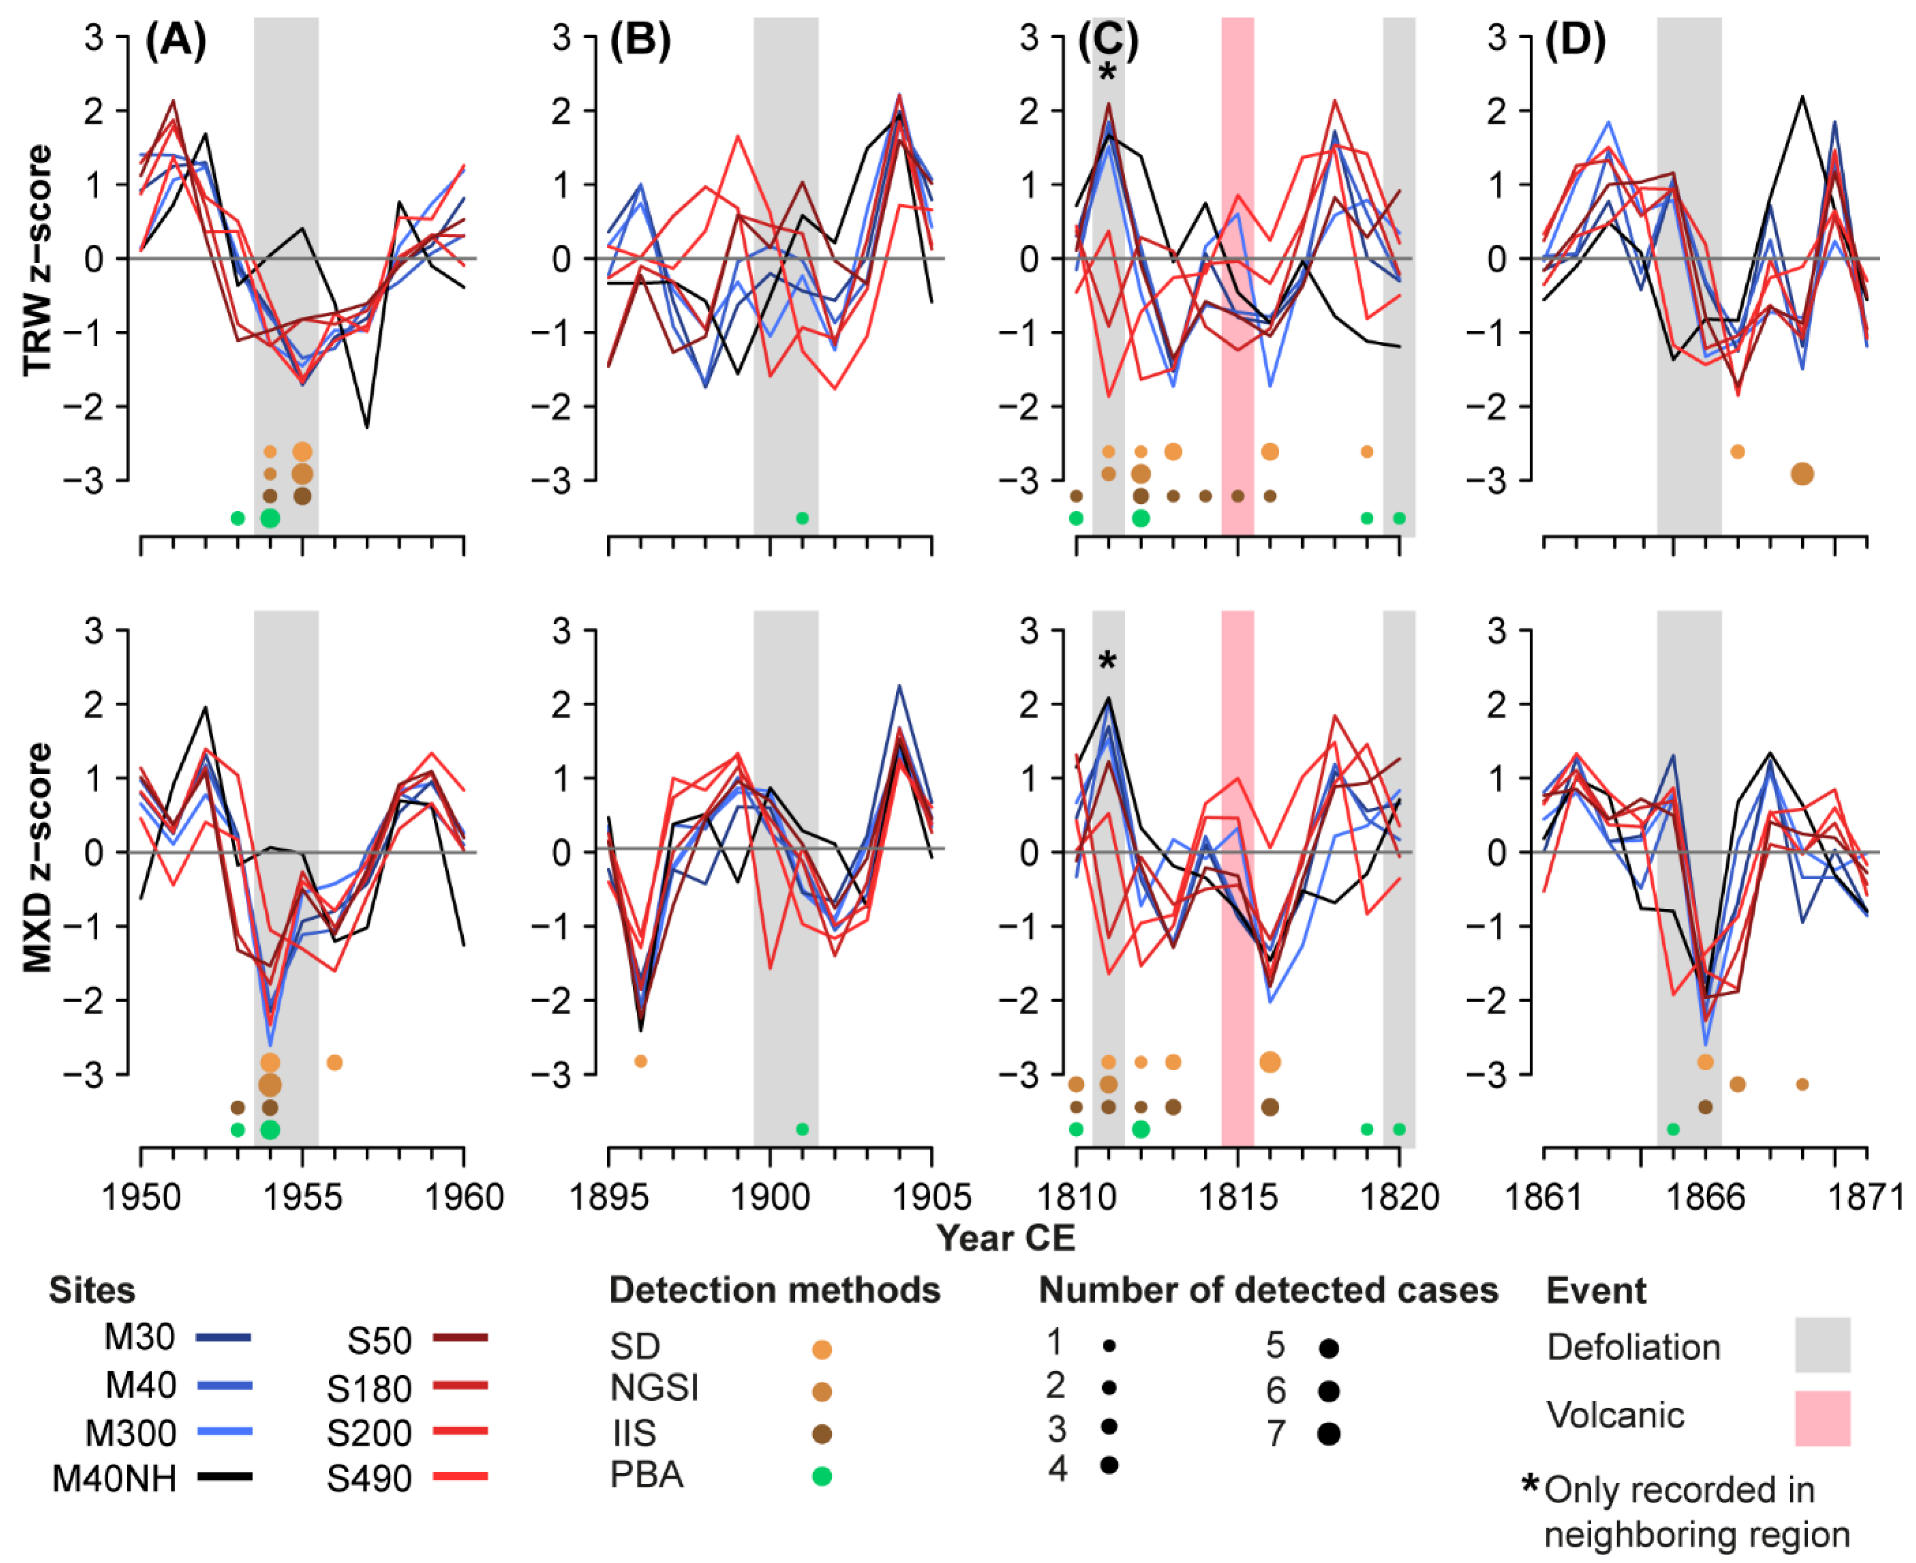
Figure 5.
TRW and MXD chronologies during specific event years. Shown are the number of detected LBM events by each method for (A) the LBM outbreak of 1954/55 that was recorded in the literature and detected by all the methods; (B) the defoliation event of 1900/01 that was only detected by the PBA; (C) the assumed LBM outbreak of 1811/12 that was followed by the “year without a summer” of 1816; and (D) the seeming LBM event of 1869 that was only detected by methods that use non-host data.


Table 1.
Characteristics of the TRW and MXD site chronologies with tree species, sampling region, slope exposure (Exp.), site elevation (Elev.), sample replication (Rep.), mean series length (MSL), average growth rate (AGR), mean MXD, as well as first-order autocorrelation (AR1) and interseries correlation (Rbar).
| Site | Species | Region | Exp. | Elev. [m a.s.l.] | Period | Rep. | MSL | AGR [mm] | Mean MXD [g/cm3] | AR1 TRW | AR1 MXD | Rbar TRW | Rbar MXD |
|---|---|---|---|---|---|---|---|---|---|---|---|---|---|
| M30 | Larix decidua | Matter Valley | NW | 2270 | 1396–2017 | 30 | 342 | 0.55 | 0.79 | 0.25 | 0.14 | 0.66 | 0.4 |
| M40 | Larix decidua | Matter Valley | NE | 2262 | 1430–2017 | 24 | 331 | 0.59 | 0.8 | 0.25 | 0.16 | 0.73 | 0.43 |
| M300 | Larix decidua | Matter Valley | N | 2000 | 1705–2017 | 22 | 154 | 1.45 | 0.9 | 0.35 | 0.12 | 0.76 | 0.39 |
| S50 | Larix decidua | Simplon Valley | W | 2150 | 1542–2009 | 24 | 218 | 0.65 | 0.82 | 0.41 | 0.18 | 0.56 | 0.37 |
| S180 | Larix decidua | Simplon Valley | W | 2020 | 1672–2009 | 22 | 212 | 0.67 | 0.85 | 0.54 | 0.42 | 0.69 | 0.47 |
| S200 | Larix decidua | Simplon Valley | NE | 1900 | 1582–2009 | 23 | 205 | 0.79 | 0.9 | 0.45 | 0.2 | 0.49 | 0.4 |
| S490 | Larix decidua | Simplon Valley | W | 1713 | 1641–2009 | 26 | 169 | 0.81 | 0.93 | 0.57 | 0.3 | 0.6 | 0.34 |
| M40NH | Pinus cembra | Matter Valley | NE | 2262 | 1596–2017 | 31 | 264 | 0.77 | 0.6 | 0.23 | 0.12 | 0.57 | 0.28 |
Disclaimer/Publisher’s Note: The statements, opinions and data contained in all publications are solely those of the individual author(s) and contributor(s) and not of MDPI and/or the editor(s). MDPI and/or the editor(s) disclaim responsibility for any injury to people or property resulting from any ideas, methods, instructions or products referred to in the content. |
© 2023 by the authors. Licensee MDPI, Basel, Switzerland. This article is an open access article distributed under the terms and conditions of the Creative Commons Attribution (CC BY) license (https://creativecommons.org/licenses/by/4.0/).
Share and Cite
MDPI and ACS Style
Kunz, M.; Esper, J.; Kuhl, E.; Schneider, L.; Büntgen, U.; Hartl, C. Combining Tree-Ring Width and Density to Separate the Effects of Climate Variation and Insect Defoliation. Forests 2023, 14, 1478. https://doi.org/10.3390/f14071478
AMA Style
Kunz M, Esper J, Kuhl E, Schneider L, Büntgen U, Hartl C. Combining Tree-Ring Width and Density to Separate the Effects of Climate Variation and Insect Defoliation. Forests. 2023; 14(7):1478. https://doi.org/10.3390/f14071478
Chicago/Turabian StyleKunz, Marcel, Jan Esper, Eileen Kuhl, Lea Schneider, Ulf Büntgen, and Claudia Hartl. 2023. "Combining Tree-Ring Width and Density to Separate the Effects of Climate Variation and Insect Defoliation" Forests 14, no. 7: 1478. https://doi.org/10.3390/f14071478
Note that from the first issue of 2016, this journal uses article numbers instead of page numbers. See further details here.