
Integrating Tree Species Identity and Diversity in Particulate Matter Adsorption


1
Institute of Forest Ecology, Department of Forest and Soil Sciences, University of Natural Resources and Life Sciences, Vienna (BOKU), 1190 Vienna, Austria
2
Department for Environmental Health, Center for Public Health, Medical University of Vienna, 1090 Vienna, Austria
3
Department of Landscape Carbon Deposition, Global Change Research Institute, Academy of Sciences of the Czech Republic, Na Sádkách 7, 370 05 Ceské Budejovice, Czech Republic
*
Author to whom correspondence should be addressed.
Forests 2022, 13(3), 481; https://doi.org/10.3390/f13030481
Submission received: 26 January 2022
/
Revised: 28 February 2022
/
Accepted: 17 March 2022
/
Published: 19 March 2022
(This article belongs to the Section Forest Ecology and Management)
Abstract
:The amount of PM bound by tree canopies depends on leaf traits, but also the leaf area available, both of which are dependent on tree identity. We investigated four species (Acer platanoides L., Tilia cordata Mill., Quercus robur L., Carpinus betulus L.) grown in monocultures and in two and four species polycultures. The amount of PM on the leaves of these species was determined by washing and fractionation of the PM into PM2.5, PM10 and PM100 size classes using a filtering method. The leaf area index was estimated by litter collection. The amount of PM2.5 per m2 leaf area was significantly higher in T. cordata compared to Q. robur and A. platanoides, and in C. betulus compared to A. platanoides. The leaf area index in monocultures was similar for all species except T. cordata which was considerably lower. Overyielding of LAI was shown in the two species polyculture of T. cordata and A. platanoides, and also in the four species polyculture. In polyculture, higher amounts of PM were determined in the two species polyculture of Q. robur and C. betulus and also in the four species polyculture. The result show that both tree identity and mixture influence the amount of PM in the canopy, and this is related to tree leaf traits, and also to overyielding of LAI in the polyculture.
1. Introduction
Ambient air pollution is linked to a plethora of human health problems, and is one of the leading five health risks worldwide, especially affecting urban populations [1,2]. Airborne particulate matter (PM) is an important group of air pollutants composed of particles with a wide range of sizes, from less than 2.5 µm (PM2.5) to up to 100 µm (PM100). In the EU-27 countries, 307,000 premature deaths are caused by PM2.5 pollution alone [3]. Biological effects of these small inhalable particles encompass immune response, cytotoxicity, and mutagenicity, causing stroke, heart disease, lung cancer, chronic obstructive pulmonary disease, and acute respiratory infections [4].
Trees and forest ecosystems have a direct effect on air quality regulation, and can significantly reduce air pollutant concentrations, therefore reducing detrimental effects on human health [5]. Trees can reduce PM through physical binding on leaf surfaces [6,7], but also on structural elements such as branches and stems [8,9]. Between tree species, considerable differences have been shown in the amount of PM bound by leaves [7,10], differing in amount, but also in the size class bound [11,12]. The binding to leaves is regulated by microstructural leaf traits such as the density of leaf trichomes [13], leaf wettability [10,14], high surface roughness and high quantities of epicuticular waxes [15,16]. Macrostructural traits such as shorter petiole length [17,18], leaf size [14,19] and the arrangement of leaves [17,20] also strongly affect PM binding. In addition to micro- and macrostructural leaf traits, the absolute leaf area available for binding of PM [15,21] and the density of leaves within the crown [19,22] affect the PM binding capacity of trees. In the present work, we investigated four tree species: Norway maple (Acer platanoides L.), small leaf lime (Tilia cordata Mill), common oak (Quercus robur L.) and hornbeam (Carpinus betulus L.), grown in monoculture and polycultures. The leaf surface of T. cordata is characterized by a high density of trichomes [10,23,24], and a high number of small leaves [19], characters that should promote binding of PM [4]. However, [7,25,26] considered T. cordata as a less efficient species for PM binding; whereas [27] classified T. cordata as especially good in capturing fine particle matter, but poor in capturing coarse particles. Both Q. robur and C. betulus were rated as high mitigating species [26]; however, another other investigation ranked C. betulus only slightly above the average [7]. A. platanoides has large leaves [28] and smooth epicuticular waxes [18], and accordingly, has been classified as a less efficient PM capturing species [7,26].
The amount of leaves within the canopy is normally expressed as the leaf area index (LAI), the total one-sided leaf area in m2 per m2 ground surface area [29]. The LAI provides information about the forest canopy structure [30] and allows scaling up of leaf level results to local, regional and global levels. Leaf area index can be determined by both direct methods through determination of litter fall [31] and through indirect methods such as remote sensing [32]. The size of the LAI is tree species dependent [33].
Particularly in the face of climate change, interest in tree diverse forests to maintain ecological stability has increased [34,35]. Tree species biodiversity promotes productivity [34,36] and the provision of ecosystem functioning [37]. The promotion of growth is due to both facilitation and reduction of competition between trees [36,38]. Although promotion of productivity, particularly if measured as aboveground productivity, is common [34,36], the outcome of polycultures is environmentally context dependent, and subject to selection effects of tree identity. For young tree diversity experiments, ref. [39] reported that 80% of the diversity effects were driven by selection effects and the remaining 20% were influenced by complementarity effects. Thus, the species identity of trees in polyculture is important, but also the degree of function dissimilarity between the component tree species [40]. Increased productivity in polyculture is often expressed as overyielding [41], determined as the observed productivity against a predicted productivity, and calculated from the component trees grown in monocultures. In tree polycultures, overyielding has been shown for many growth or biomass parameters, such as above ground biomass [42], fine roots [43], but also leaf biomass and thus, LAI [44,45]. However, little is known about whether polyculture, and subsequent potential changes in LAI and canopy structure, could influence binding of PM.
In the work presented, we quantified LAI and PM accumulation on leaf surfaces of four common European tree species with different leaf and crown traits, grown as monocultures or 2 and 4 species polyculture at the biodiversity experimental site B-Tree, Austria. Specifically, we determined whether growth in polyculture influences the amount of PM, in the classes PM100, PM10 and PM2.5, that could be removed from the leaves. We tested the hypotheses: (1) trees with small and rough leaves will have a greater PM accumulation than trees with large, smooth leaves, (2) LAI will greatly modify the total amount of PM accumulated per tree, and (3) growth of trees in polyculture affects LAI and thus, total canopy PM accumulation.
2. Material and Methods
2.1. Study Area
All work was carried out at the B-Tree experimental site (48°19′03.2″ N 16°04′01.0″ E) which is part of the TreeDivNet platform, a worldwide network of tree biodiversity experiments [46]. The B-Tree site was established in 2013 with the tree species Acer platanoides L. (Ap), Tilia cordata Mill. (Tc), Quercus robur L. (Qr), Carpinus betulus L. (Cb), representing a typical warm low-land forest composition. The trees were planted at a density of 10,000 trees ha−1 in a hexagonal pattern, which ensured a 100 cm spacing between all adjacent trees. No thinning or any other treatment has been carried out to date. The tree species were planted in both polycultures and monocultures in four blocks (Figure 1). The mixed stands consist of two species polycultures Ap and Tc (ApTc) or Qr and Cb (QrCb), or a four species (All) polyculture. In two species polycultures, each species contributes 50% of the total number of trees; in the four species plots, each species contributes 25% of the total number of trees. Every combination and monoculture has four replicates, and the replicates are rotated within each block to ensure no one species has a similar position in the blocks. The plot sizes are 81 m2 for single species plots and 196 m2 for two and four species plots (Figure 1). At the time of planting, the saplings were ca. 30–40 cm high. At the time of sampling in September 2020, the mean heights of the trees were 5.5 ± 1.6 m (A. platanoides), 3.6 ± 1.2 m (T. cordata), 4.2 ± 1.1 m (Q. robur) and 4.1 ± 1.0 m (C. betulus). The surrounding area of the B-Tree site is mainly agricultural farmland.
The annual precipitation in Tulln an der Donau is 597 mm, with a mean annual temperature of 9.5 °C [47]. In addition, weather data for the accumulation period of the 7 September until 12 September 2020 were obtained from a local weather station (Adcon A733, Department for Crop Sciences, University for Life Sciences and Natural Resources Vienna) adjacent to the B-Tree site. The recorded wind speed at the site had a mean of 1.9 ± 0.4 m·s−1 with a maximum 2.4 m·s−1. Wind speeds lower than 5 m·s−1 [48] or 11 m·s−1 [49] should not have an effect on leaf accumulated particulate matter. Ambient air temperature was measured 2 m above ground with a mean of 16.1 ± 2.5 °C. Ground level concentration of particulate matter measured at the station Dürnrohr, 12 km from the B-Tree site, was generally low, with a mean 24 h PM10 and PM2.5 concentration of 17 ± 3.1 µg·m−3 and 6.8 ± 2.4 µg·m−3, respectively (accessed at [50]). The last heavy rain event before sampling occurred in the night from 6 to 7 September with a total precipitation of 18.8 mm.
2.2. Leaf Sampling
Leaves were collected on 12 September 2020. To exclude edge effects, leaves were taken from trees located toward the center of each plot. A pair of scissors was used to carefully cut single leaves or small branches from the outermost crown layer [15,19,27]. Three randomly chosen vital, dominating or co-dominating tree individuals, distributed around the center of the plot, were sampled. Sampling height varied based on the different stand height of the sampled plots. Contact between other objects and harvested leaves were avoided or minimized. From each species, sufficient leaves were collected to give a total one-sided leaf area of 300–400 cm2. This range of leaf area was chosen to reduce the risk of filter blockage during particle size fractionation. In the polycultures, one mixed leaf sample per plot was harvested proportional to the number of trees in the plot. In the polycultures, leaves were taken to give a leaf area of 150–200 cm2 or 75–100 cm2 per species for two or four species polycultures, respectively. After the leaf area was determined, the leaf area per species in the two species polycultures deviated 9.6% from the target value of 50% leaf area per species, and 6.6% in the four species polyculture from the target value of 25% per species. The petioles were removed [51] with a pair of scissors before carefully sliding the leaves into the paper bags. The harvested leaves were immediately brought back to the laboratory, and stored in a fridge at 4 °C [19] until further analysis. Leaf washing was carried out two days after sample acquisition. Optically healthy leaves with no sign of insect or disease damage were used whenever possible. However, at the time of sampling, some of the leaves of Q. robur and T. cordata already showed signs of infestation with Erysiphe alphitoides Griffon & Maubl. and Cercospora microsora Sacc., respectively.
2.3. Determination of Leaf Area Index (LAI)
The leaf area index (LAI) was directly estimated from leaves collected in 108 leaf litter traps, similar to the approach of [52]. Litter traps were standard planting pots (Ø 33 cm) with perforated bottoms. Within the monoculture and mixed stands, three and five leaf litter traps representing 0.26 m2 and 0.43 m2, respectively, were randomly distributed throughout each plot. Tent pegs were used to fix the pots to the ground. The leaves were collected biweekly during the main abscission period (August–December), and monthly until budbreak of the next vegetation period, to capture the retained leaves of the marcescent Q. robur and C. betulus. The collected leaf litter was dried at 38 °C. Before further processing, the species identity of the leaves in each trap was checked; only rarely were leaves from neighboring plots found in the leaf litter traps during the whole collecting season.
2.4. Quantitative Analysis of PM
For analysis of PM, the leaves were removed from the paper bag using tweezers and put into glass containers with 250 mL deionized distilled water (18.2 MΩ cm @ 25 °C, 3 ppb TOC). The glass containers were closed with a lid, put into an end-over-end rotating shaker (GFL Rotating Shaker 3040, Gesellschaft für Labortechnik GmbH, Burgwedel, Germany) for 10 min, and were then placed in a 120 Watt ultrasonic bath for another 3 min (BRANSONIC 220, Branson Ultrasonics Corporation, Brookfield, WI, USA) [15,53]. The washing solution samples which could not be analyzed right away were stored in 300 mL plastic bottles in a fridge at 4 °C. Before filtration, the stored solutions were shaken for at least 8 h (170 RPM) on a plate shaker (VWR Incubated Microplate Shaker, VWR International, Radnor, PA, USA) and 20 s with a vortex shaker, and finally 10 s per hand by the same person.
Prior to the first weighing step, the filters were equilibrated in a weighing room, at a temperature of 20 °C and at an 20% relative humidity, for at least 24 h. For each filtration sample, three PM filters and three reference filters of all PM classes (10, 2.5 and 0.2 µm) were prepared. The two filter groups per sample were stored in labelled petri dishes. The filters did not touch each other in the petri dishes. Nitril gloves and tweezers were used for all steps. After stabilization, the filters were sequentially passed through an anti-static ionizer (CEM Anti-static ionizer, CEM Corporation, Matthews, NC, USA) to avoid electrostatic charges on the filters, and then weighed to a precision of 0.00001 g on a balance (Sartorius SECURA125-1S, Sartorius Lab Instruments GmbH & Co., KG, Goettingen, Germany). Each filter was weighed a minimum of 3 times, and the mean of the best corresponding values taken to calculate the final weight.
Particulate matter was divided into 3 diameter classes (10–100 µm, 2.5–10 µm, 0.2–2.5 µm) using a sequential fractionation. In total, four different types of filters were used for the filtration process. First, the solutions were passed through a 100 µm stainless steel sieve to remove coarse particles > 100 µm. Thereafter, the solution was sequentially passed through a 10 µm cellulose filter (Whatman Type 91, GE Healthcare UK Limited, Little Chalfont, UK) to capture the 10–100 µm PM class; third, a 2–3 µm wet-strengthened cellulose filter (Sartorius Grade 1291, Sartorius Stedim Biotech, Goettingen, Germany) for the 2.5–10 µm PM class; and finally, a 0.2 µm cellulose acetate membrane filter (Sartorius Type 111, Sartorius Stedim Biotech, Goettingen, Germany) for the 0.2–2.5 µm PM class. For every filtration step, the filters were placed in a 47 mm glass filter funnel and stopper support assembly (Cytiva, Whatman, Little Chalfont, UK), and placed under vacuum using a vacuum pump (KNF Meter Laboport N820.3, METER Group AG, Munich, Germany) with a distribution manifold. The glass funnels were covered with filter papers to avoid dust contamination during filtering. To avoid additional contamination between filtration steps, the glass funnels and Erlenmeyer flasks were rinsed with deionized distilled water (18.2 MΩ cm @ 25 °C, 3 ppb TOC), which was then added back to the solution for the next filtration step. The leaf washing methods from [16] were adapted according to [13,54,55]. The PM loaded filters were dried and equilibrated for 24 h in the weighing room at constant relative humidity and air temperature, as described above. The equilibrated PM filters and reference filters were passed through the ionizer device again and weighed a second time, as described above. The weight difference was automatically adjusted for the relative humidity bias provided by the reference filters.
To obtain an estimation of the effect of any possible variation due to conditions in the weighing room, the whole weighing procedure was repeated two times. No statistical differences were found between the values obtained on the different days. After final development of the measuring protocol, it was noticed that it is in stark congruence with the protocol from [54]. This means that six filters were weighed two times each to get the weight difference from before and after each filtration process, and the relative humidity bias caused by humidity changes in the weighing room.
2.5. Determination of Leaf Area and Specific Leaf Area
The leaf surface area was determined by scanning the samples with a flatbed scanner using the leaf area analysis software WinFoliaPro (2014). To calculate the SLA, 50 freshly fallen leaves per species were collected in autumn 2020. The leaves were dried for 48 h at 80 °C in a drying chamber, and the dry mass of the leaf samples was determined and used to calculate the specific leaf area (SLA) as leaf area cm2 per g dry mass. The specific leaf area (SLA) was used to calculate plot wise LAI in m2·m−2.
2.6. Calculations
Plot level PM retention was derived from direct double-sided leaf-surface PM retention measurements, upscaled using LAI values from the respective species combination plots. The values correspond to mg·m−2 ground area for the five-day rain free PM accumulation period before leaf sampling.
To determine the effect of growing species in polyculture on LAI, the measure values were compared and a predicted value calculated from the single species plots. For the two species plots, each species was assumed to contribute 50% of the value of the single species plots; for the four species plots, 25% of the value of the single species plots. This calculation is directly analogous to calculation of over-yielding used in biomass calculations [56,57]. For estimation of the effects of polyculture on PM retention on a plot area scale, two values of predicted retention were calculated for the values obtained from the monocultures. One value, predicted nominal leaf area (pn), was calculated using the PM binding per leaf area of the monocultures and a leaf area index of 50:50 for two species polycultures, or 25:25:25:25 for four species polyculture. The value predicted actual leaf area (pa) was calculated using the PM binding per leaf area of the monocultures and the measured leaf area of each species from the polyculture plots.
2.7. Statistical Analysis
Values were entered in a prepared Excel sheet which automatically calculated the humidity bias and the corrected filtered net PM load per sample and PM class. Further data wrangling and analysis was conducted in R [58]. As between the two weighing runs of the loaded filters no statistical differences were found, these two datasets of raw data where then pooled to average the variance of the weighing steps. This pooled dataset was then used for further statistical tests and analysis.
One-way ANOVAs were carried out along a species diversity gradient of 1, 2 and 4 species: Ap, Tc, Qr, Cb, ApTc, QrCb and All, respectively (one-way ANOVA, * p < 0.05; ** p < 0.01; *** p < 0.001). The statistical analysis was carried out in the same way for LAI and PM analysis, latter split up into PM100, PM10, PM2.5 and ΣPM analysis. Tukey’s HSD test (p < 0.05) was used to assess the significance of pairwise comparisons between plot combinations. Residuals of the models were checked for normality using a Shapiro–Wilk test (p < 0.05). To test for homogeneity of variances, a Levene test (p < 0.05) was applied to the datasets. Null hypothesis was not rejected for any test.
Additionally, Student’s t-tests for LAI and all three PM classes between the measured and the predicted nominal values (or/pn) of PM binding of the different PM classes were run, as well as for measured and predicted actual values (or/pa) for the PM classes (unpaired t-test, one-way ANOVA, * p < 0.05; ** p < 0.01; *** p < 0.001). The null hypothesis for Shapiro–Wilk normality tests of the subsamples was not rejected.
3. Results
3.1. Leaf Area Index
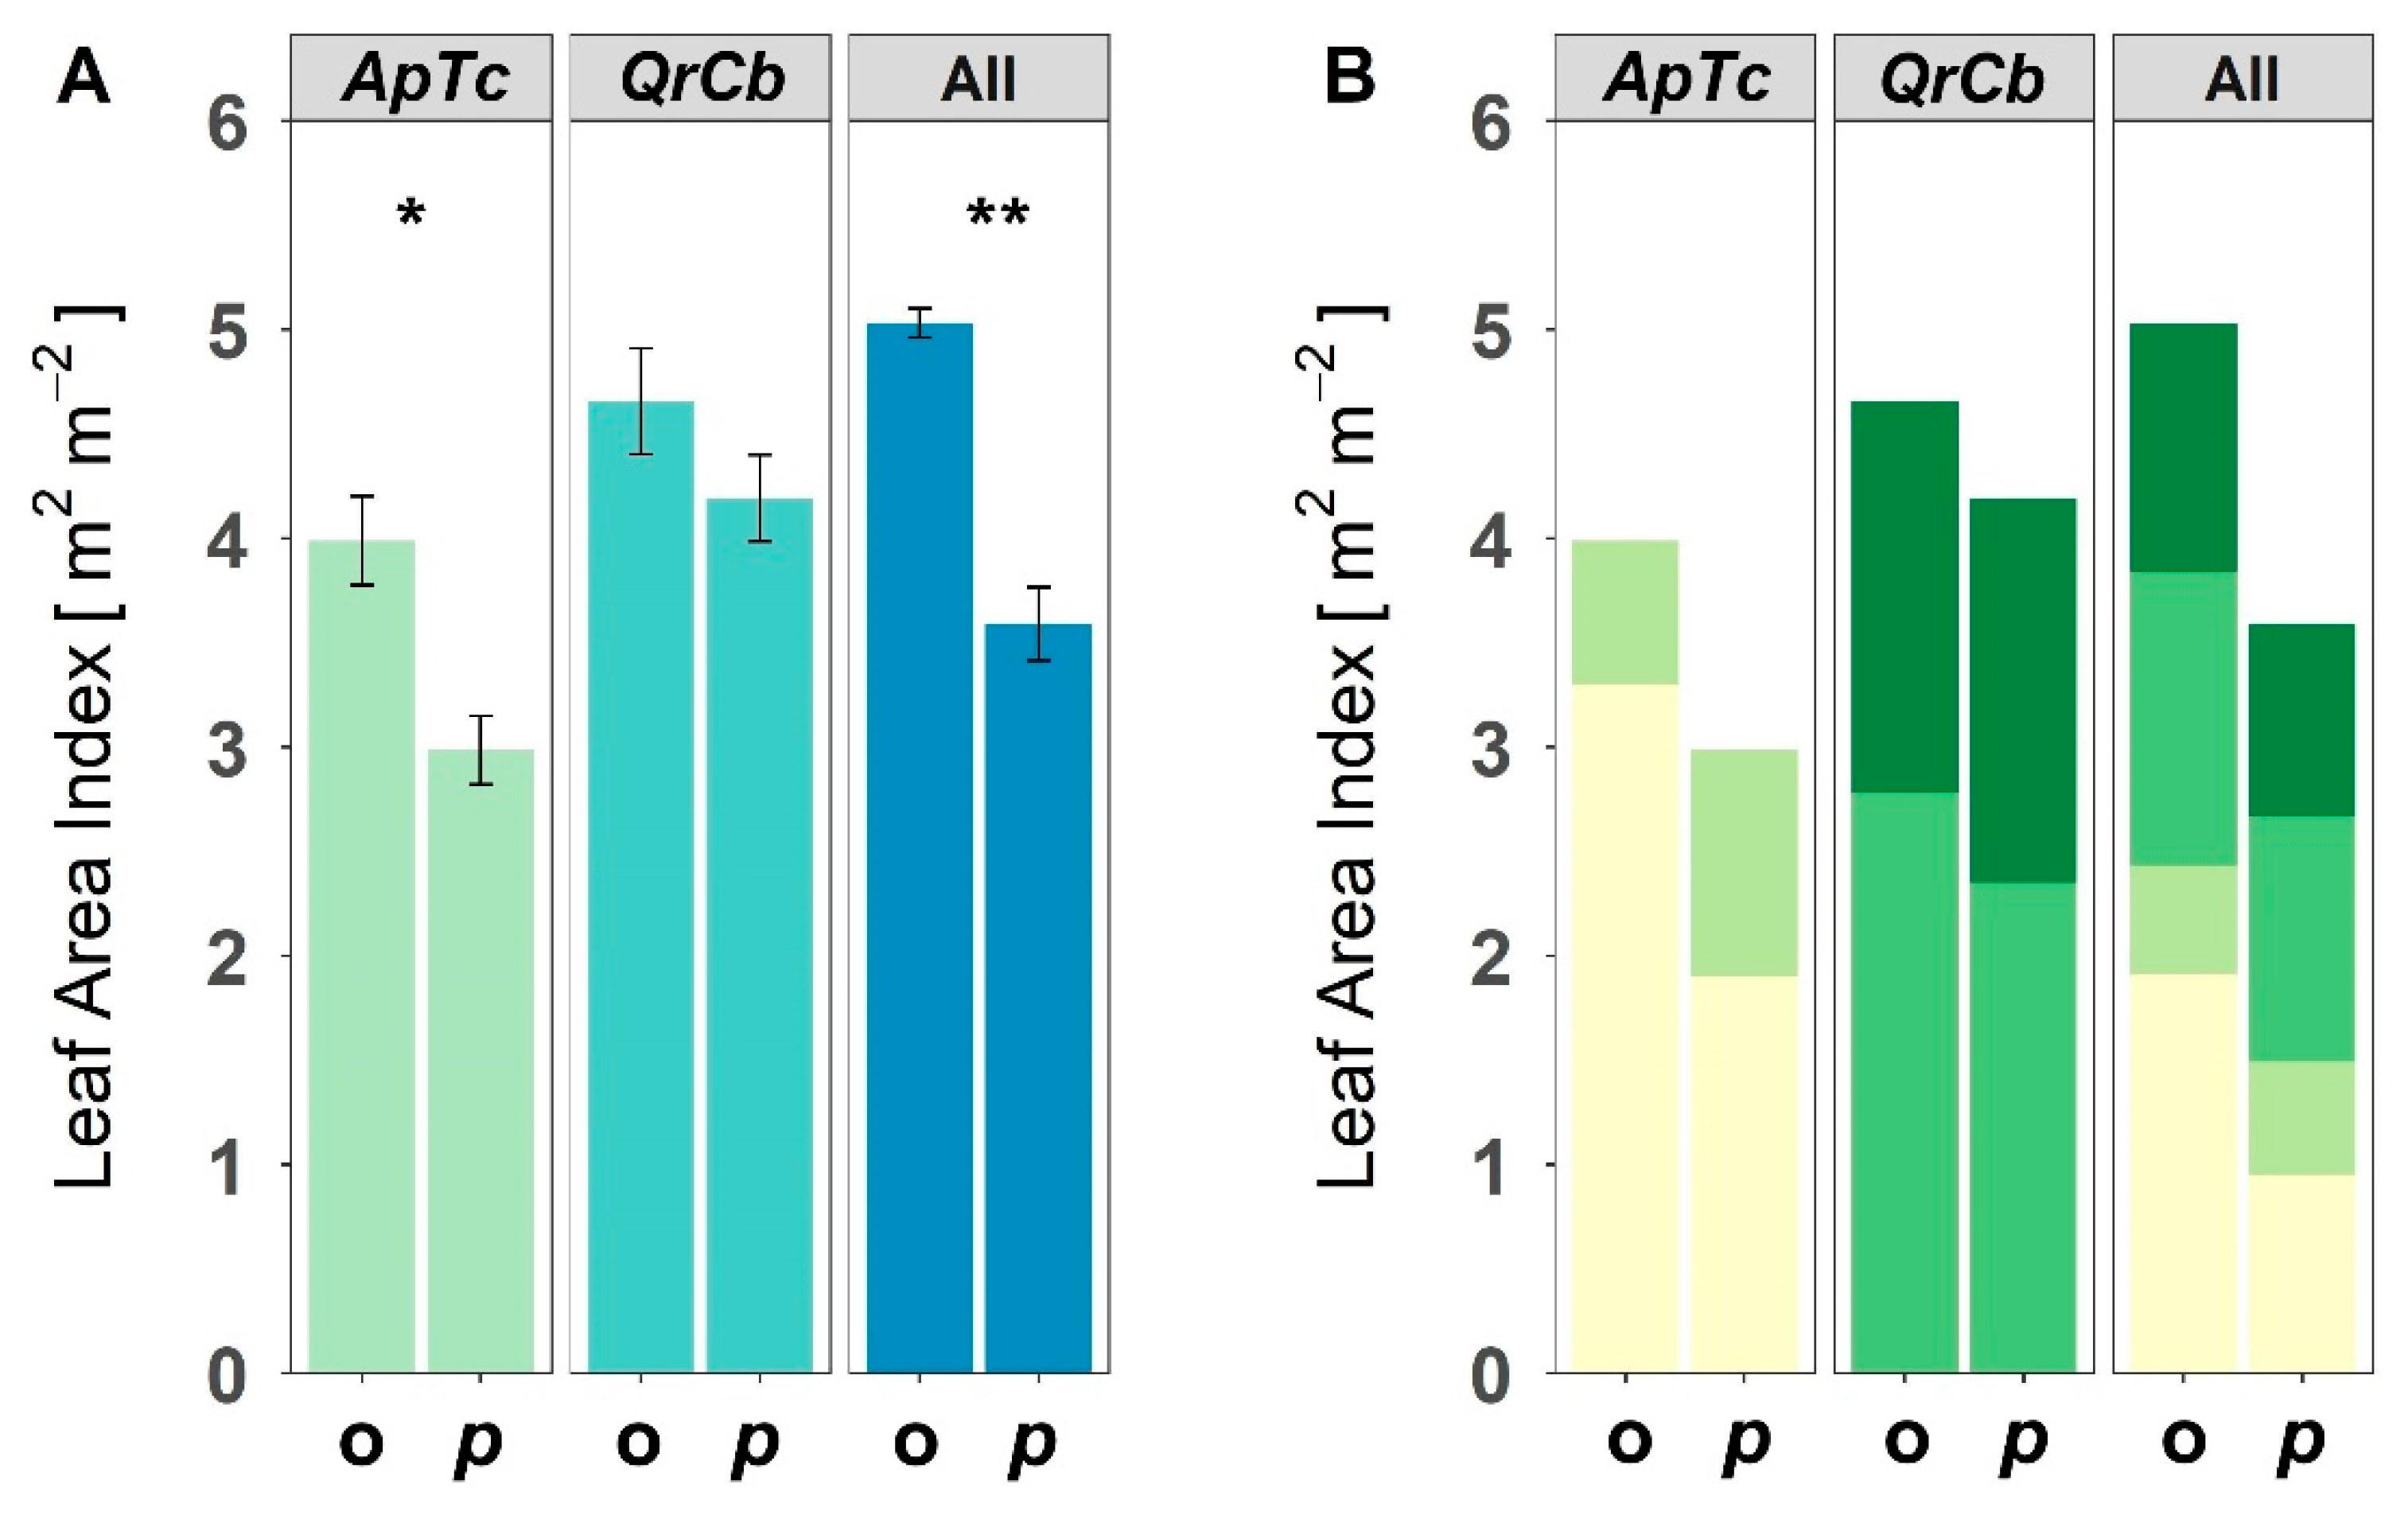
In the monocultures, the leaf area index (LAI) of T. cordata was significantly lower compared to the other three species (Figure 2, Table 1). The two species polycultures of T. cordata and A. platanoides (ApTc) showed a significantly higher LAI than that of the monocultures with T. cordata, but not the monocultures of A. platanoides. In the ApTc poly-culture, the measured total LAI exceeded the predicted (Figure 3A), and the contribution from A. platanoides to the total LAI increased significantly from a predicted 64% to the observed 82% (Figure 3B). In the two species polyculture of Q. robur and C. betulus (QrCb), the total LAI was not different to either of the monocultures (Figure 2) and did not differ to the predicted value (Figure 3A). The four species polycultures (All) showed the highest LAI and were significantly different to all monocultures and polycultures, except those containing Q. robur (Table 1). The measured LAI was 40% higher than the predicted value and was significantly different (Figure 3A). The higher LAI in the four species polyculture is due to a significantly higher contribution of A. platanoides. The observed LAI of Q. robur, C. betulus and T. cordata singly was not greater than the predicted value (Figure 3B). However, the sum LAI of Q. robur and C. betulus in All was significantly higher (p < 0.05) in the observed (2.6 m2·m−2) compared to the predicted (2.1 m2·m−2).
3.2. Particulate Matter
Particulate matter removed from leaves per m2 leaf area of all four species is shown in Table 2. For the PM100 and PM10 size classes, no significant differences were found between the tree species, even though in the PM100 class the amount removed from T. cordata exceeded that of A. platanoides by a factor of 3. In the PM2.5 class, the amount of PM per m2 was significantly higher in T. cordata compared to Q. robur and A. platanoides, and in C. betulus compared to A. platanoides. The amount of PM washed from leaves of T. cordata was twice that of Q. robur, and 3 times that of A. platanoides.
3.3. Particulate Matter Canopy Storage
The amount of PM stored in the canopy of the monocultures and the polycultures is shown in Table 3. For the large particulate matter fraction PM100, for the observed value of PM removed from the leaves, no significant differences between species in the monocultures or within the polycultures could be identified. However, Ap and ApTc showed the lowest values of PM100 removed from the leaves compared to the other species in monocultures or other polycultures. Similarly, no significant differences were shown between the observed, predicted nominal and predicted actual values, indicating that the PM retention function of a single tree species in a polyculture did not differ from its function in a monoculture.
For the PM10 class, again, no significant differences in the amounts of PM removed were shown between species in the monocultures. Similarly, between the monocultures and the respectively polycultures, no significant differences were shown, even though the amount removed for the QrCb polyculture was numerically greater than both of the species in monoculture. The larger amount of PM10 removed from the leaves in the QrCb polyculture is clearly seen when the observed, predicted nominal and predicted actual values are compared. There was a significant difference between observed and predicted nominal and predicted actual in the QrCb polyculture. The observed value was significantly higher than both the predicted values, indicating a higher than expect value of PM in the polyculture compared to the respective monocultures.
For the smallest PM2.5 class, again, no significant differences in the amounts of PM removed were shown between species in the monocultures, even though the amount of PM2.5 removed from the crowns of C. betulus was three times that removed from A. platanoides. In the QrCb and All polycultures, the observed values of PM2.5 where 50% greater than the predicted nominal or predicted actual values. For the All four species polyculture, the increase was significant different, indicating a higher amount of PM2.5 than could be predicted from the monocultures. For the sum of all the PM size classes (ΣPM Table 3), no significant differences between species in the monocultures could be identified. The polyculture QrCb showed the highest value for PM removed from leaves, with significant differences compared to the monoculture Ap and the polyculture ApTc. No differences were found between observed and predicted for any of the polycultures.
4. Discussion
4.1. PM per Unit Leaf Area
The amount of PM retained in the crowns of trees is a function of the leaf area [15,27], and the macromorphological and micromorphological properties of leaves [13,18,19,59]. At a unit leaf level, in the four species investigated in our study, there were few differences in the amount of PM removed from the leaves for the total PM, and the different size classes. The most striking difference was the higher amounts of PM2.5 removed from the leaves of T. cordata and C. betulus compared to A. platanoides. In a study of 22 tree species in Norway and Poland, ref. [7] showed that both T. cordata and A. platanoides were among the species with the lowest PM accumulation levels. In contrast, ref. [60] rated A. platanoides and T. cordata as moderate, C. betulus and Q. robur as high air pollution mitigation species. Ref. [19] investigated the same four species as in this study. Contradictorily, they identified C. betulus as one of the lowest PM retaining species after Q. robur, T. cordata and A. platanoides. In the wind tunnel experiment of [61], T. cordata was among the best species capturing NaCl and talcum particles. The leaf saturation isothermal remanent magnetization (SIRM) analysis of [10] showed T. cordata and Q. robur with high, and C. betulus with low magnetic particle deposition. These comparisons indicate that often, which species binds the highest amount of PM is context dependent. In our study, the trees have been exposed to a relatively low atmospheric level of PM.
Again, at the unit leaf area level, ref. [27] reported high accumulation of PM2.5 on leaves of T. cordata, which was related to the presence of a high number of trichomes on the leaves. It is known that leaf hairiness increases PM capture efficiency [10,23,24]. In contrast to T. cordata, leaf epicuticular waxes on A. platanoides are relatively smooth [28], and the leaves relatively large (mean area 56.8 cm2), which could explain the lower levels of PM found on this species. Broadleaf species with smooth surfaces, such as A. platanoides, tend to have lower PM accumulation [18] than species with rough leaf surface properties [13,23,62,63]. High leaf wettability, as shown for Q. robur, also positively influences PM retention [10], but is a debatable factor [19]. Tree species with a large number of small leaves have been shown to have the highest PM retention [19]. PM capture also increases with a finer and more complex structure of the foliage [13,23,64]; thus, PM capture tends to be greater in conifers. In the four species we investigated, C. betulus had the smallest individual leaf area (20.8 cm2) compared to the other species. The arrangement of leaf veins has also been shown to influence PM accumulation. Ref. [19] stated that most PM captured on the leaf surfaces of Q. robur and T. cordata, was concentrated close to the leaf midribs. Thus, the deep ridges of the leaf veins [65,66,67] in C. betulus may also contribute to the high PM accumulation in all diameter classes in this species.
4.2. Leaf Area Index
The leaf area available to capture PM was quantified through the leaf area index. In the monocultures, the LAI was similar in all species except T. cordata, which had almost only half the LAI of the other species. In polyculture, overyielding of LAI was shown in both the ApTc mixture and the four species mixture (All). In both polycultures, the overyielding was driven by an increase in the leaf area of A. platanoides, but in All, also by an increase in C. betulus and Q. robur. Overyielding of leaf biomass has been shown in other studies in subtropical [45] and tropical forests [44]. Overyielding in mixtures is a relatively common phenomenon for a number of biomass parameters [43,68]. However, overyielding does not always occur [52] as diversity effects are strongly driven by functional identity of the component species in the polyculture [39], but also trait differences between the species [68]. Overyielding occurs due to (i) reduced competition and (ii) facilitation between species [41,68]. Mixtures containing species enabling ecological coalescence due to having different traits in crown, root and growth characteristics results in facilitation and competition reduction. This can clearly be seen in the overyielding of LAI in the ApTc and All polycultures, but not in the QrCb polyculture where the species have similar traits.
4.3. PM and LAI
On the basis of leaf area among the tree species, the highest amount of PM2.5 was removed from leaves of T. cordata and C. betulus. However, when the amount of PM in the crowns of the trees is calculated on the basis of LAI, there were no significant differences among the species, due to the equalizing effect of the different LAI of the species. For example, the low levels of PM retained on the smooth leaves of A. platanoides is compensated by the higher LAI compared to the other species. A similar compensator effect of LAI has been shown for other tree species growing in urban environments [15]. Ref. [15] showed that the trees with the high canopy density removed the highest amounts of PM. At the B-Tree site, A. platanoides is the height dominant species with a mean height of 5.5 m across the plots, and the monoculture LAI of 3.8 m2·m−2 is composed of ca. 670 individual leaves. In comparison, the average height of C. betulus is 3.6 m and LAI (3.7 m2·m−2) is composed of ca. 1800 individual leaves, thus having a much denser and more complex crown.
The importance of considering LAI is clearly seen in the polycultures, where over-yielding and competition or facilitation between the tree species affects the contribution of each species. The four species polyculture had a higher than predicted amount of PM2.5, which may be due to the LAI overyielding particularly of C. betulus. However, the two species polyculture of Q. robur and C. betulus had the highest levels of total PM and higher than predicted amount of PM10, without a significant change in LAI. In the Q. robur and C. betulus polyculture, the two species partition the crown space with Q. robur in the upper crown and C. betulus in the lower crown, thus increasing the complexity and density of the effective crown volume. The amount of PM in the crowns of the QrCb polyculture was significantly higher than the ApTc, thus emphasizing the importance of species identity in mixtures [39].
4.4. Species Selection and Human Health
In the polycultures, the most significant increase in removal of PM occurred in PM2.5 class, which is considered to be the most detrimental for human health [69]. Airborne PM2.5 are of practical relevance to ambient air quality management worldwide, given the vast epidemiological and toxicological evidence on adverse health effects [1,2]. Thus, the correct choice of trees for PM removal has direct human health implications. In this study, leaves were collected 5 days after a heavy rain event (18.8 mm). Even rainfall events of 10 mm or less can remove a significant amounts of PM loading [70,71,72], thus resetting the system to allow new accumulation. During the vegetation period 2020, at Tulln rainfall events of more than 10 mm occurred 13 times; thus, the potential PM removal is greater than the 5-day value calculated. To date, most frequently occurring tree species in global cities are commonly not the best choice in removing PM2.5 [73]. However, there is great potential for using selected tree species and mixtures to yield the most effective air cleaning potential in condensed urban areas, suggesting the need to rethink traditional urban greening projects accompanying climate change mitigation strategies. So far, species-specific canopy structures have hardly been integrated in considerations in urban vegetation planning and air quality management.
5. Conclusions
Trees play a vital role in removing PM and are ultimately an aid to human health and wellbeing. Leaf properties and canopy architectural trait of the leaf area index (LAI) have a significant influence on PM retention, the degree of which differs between the PM classes. Our work shows that estimation of the amount of PM retained on leaves does not truly reflect the potential PM binding of trees, as the LAI strongly influences the amount of PM retained per tree. An example of this can be seen for A. platanoides, which has a low binding capacity per leaf area, but a high LAI. In polycultures, LAI is influenced by competition or facilitation of the component tree species in the polyculture. LAI overyielding can result in greater PM removal. In addition, PM retention appears to be increased by the complexity of the crown, the reasons for which are currently unknown, as shown in the Q. robur and C. betulus polyculture.
Author Contributions
M.S. carried out all of the experimental work, developed the methodology of measuring PM and co-wrote the manuscript. D.L.G. advised on the experimental work, designed the B-Tree site and co-wrote the manuscript. D.H. advised on the public health issues and co-wrote the manuscript. All authors have read and agreed to the published version of the manuscript.
Funding
This research was supported through the 2018–2019 BiodivERsA joint call for research proposals, under the BiodivERsA3 ERA-Net COFUND program, and with the funding organizations DFG (Germany), ANR (France), FWO (Belgium), FWF (Austria) and NCN (Poland). The work was funded by the FWF project I 4372-B to DLG and by the Dr. Forest project I 4411 to DH. DLG was also supported by the Ministry of Education, Youth and Sports of CR within the National Sustainability Program NPU I, grant No. LO1415.
Data Availability Statement
Supporting is available at the Fundiveurope database after obtaining permission. https://data.botanik.uni-halle.de/fundiveurope/ (accessed on 12 November 2021).
Conflicts of Interest
The authors declare no conflict of interest.
References
- Pascal, M.; Corso, M.; Chanel, O.; Declercq, C.; Badaloni, C.; Cesaroni, G.; Henschel, S.; Meister, K.; Haluza, D.; Martin-Olmedo, P.; et al. Assessing the public health impacts of urban air pollution in 25 European cities: Results of the Aphekom project. Sci. Total Environ. 2013, 449, 390–400. [Google Scholar] [CrossRef] [PubMed]
- Perez, L.; Declercq, C.; Inĩguez, C.; Aguilera, I.; Badaloni, C.; Ballester, F.; Bouland, C.; Chanel, O.; Cirarda, F.B.; Forastiere, F.; et al. Chronic burden of near-roadway traffic pollution in 10 European cities (APHEKOM network). Eur. Respir. J. 2013, 42, 594–605. [Google Scholar] [CrossRef] [Green Version]
- European Environment Agency. Air quality in Europe—2021; European Environment Agency: Copenhagen, Denmark, 2021. [Google Scholar]
- WHO World Health Organization. Available online: https://www.who.int/health-topics/air-pollution#tab=tab_1 (accessed on 12 December 2021).
- Smith, P.; Ashmore, M.R.; Black, H.I.J.; Burgess, P.J.; Evans, C.D.; Quine, T.A.; Thomson, A.M.; Hicks, K.; Orr, H.G. REVIEW: The role of ecosystems and their management in regulating climate, and soil, water and air quality. J. Appl. Ecol. 2013, 50, 812–829. [Google Scholar] [CrossRef]
- Speak, A.F.; Rothwell, J.J.; Lindley, S.J.; Smith, C.L. Urban particulate pollution reduction by four species of green roof vegetation in a UK city. Atmos. Environ. 2012, 61, 283–293. [Google Scholar] [CrossRef]
- Sæbø, A.; Popek, R.; Nawrot, B.; Hanslin, H.M.; Gawronska, H.; Gawronski, S.W. Plant species differences in particulate matter accumulation on leaf surfaces. Sci. Total Environ. 2012, 427–428, 347–354. [Google Scholar] [CrossRef]
- Lin, M.; Katul, G.G.; Khlystov, A. A branch scale analytical model for predicting the vegetation collection efficiency of ultra fine particles. Atmos. Environ. 2012, 51, 293–302. [Google Scholar] [CrossRef]
- Xu, X.; Yu, X.; Mo, L.; Xu, Y.; Bao, L.; Lun, X. Atmospheric particulate matter accumulation on trees: A comparison of boles, branches and leaves. J. Clean. Prod. 2019, 226, 349–356. [Google Scholar] [CrossRef]
- Muhammad, S.; Wuyts, K.; Samson, R. Atmospheric net particle accumulation on 96 plant species with contrasting morphological and anatomical leaf characteristics in a common garden experiment. Atmos. Environ. 2019, 202, 328–344. [Google Scholar] [CrossRef]
- Popek, R.; Gawrońska, H.; Wrochna, M.; Gawroński, S.W.; Sæbø, A. Particulate Matter on Foliage of 13 Woody Species: Deposition on Surfaces and Phytostabilisation in Waxes—A 3-Year Study. Int. J. Phytoremediat. 2013, 15, 245–256. [Google Scholar] [CrossRef]
- Cai, M.; Xin, Z.; Yu, X. Spatio-temporal variations in PM leaf deposition: A meta-analysis. Environ. Pollut. 2017, 231, 207–218. [Google Scholar] [CrossRef]
- Chen, L.; Liu, C.; Zhang, L.; Zou, R.; Zhang, Z. Variation in Tree Species Ability to Capture and Retain Airborne Fine Particulate Matter (PM2.5). Sci. Rep. 2017, 7, 3206. [Google Scholar] [CrossRef] [PubMed]
- Räsänen, J.V.; Holopainen, T.; Joutsensaari, J.; Ndam, C.; Pasanen, P.; Rinnan, Å.; Kivimäenpää, M. Effects of species-specific leaf characteristics and reduced water availability on fine particle capture efficiency of trees. Environ. Pollut. 2013, 183, 64–70. [Google Scholar] [CrossRef] [PubMed] [Green Version]
- Kwak, M.J.; Lee, J.; Kim, H.; Park, S.; Lim, Y.; Kim, J.E.; Baek, S.G.; Seo, S.M.; Kim, K.N.; Woo, S.Y. The removal efficiencies of several temperate tree species at adsorbing airborne particulate matter in urban forests and roadsides. Forests 2019, 10, 960. [Google Scholar] [CrossRef] [Green Version]
- Dzierzanowski, K.; Popek, R.; Gawrońska, H.; Saebø, A.; Gawroński, S.W. Deposition of particulate matter of different size fractions on leaf surfaces and in waxes of urban forest species. Int. J. Phytoremediat. 2011, 13, 1037–1046. [Google Scholar] [CrossRef]
- Leonard, R.J.; McArthur, C.; Hochuli, D.F. Particulate matter deposition on roadside plants and the importance of leaf trait combinations. Urban For. Urban Green. 2016, 20, 249–253. [Google Scholar] [CrossRef]
- Prusty, B.A.K.; Mishra, P.C.; Azeez, P.A. Dust accumulation and leaf pigment content in vegetation near the national highway at Sambalpur, Orissa, India. Ecotoxicol. Environ. Saf. 2005, 60, 228–235. [Google Scholar] [CrossRef]
- He, C.; Qiu, K.; Pott, R. Reduction of urban traffic–related particulate matter—Leaf trait matters. Environ. Sci. Pollut. Res. 2020, 27, 5825–5844. [Google Scholar] [CrossRef]
- Weerakkody, U.; Dover, J.W.; Mitchell, P.; Reiling, K. Particulate matter pollution capture by leaves of seventeen living wall species with special reference to rail-traffic at a metropolitan station. Urban For. Urban Green. 2017, 27, 173–186. [Google Scholar] [CrossRef]
- Bottalico, F.; Travaglini, D.; Chirici, G.; Garfì, V.; Giannetti, F.; De Marco, A.; Fares, S.; Marchetti, M.; Nocentini, S.; Paoletti, E.; et al. A spatially-explicit method to assess the dry deposition of air pollution by urban forests in the city of Florence, Italy. Urban For. Urban Green. 2017, 27, 221–234. [Google Scholar] [CrossRef]
- Janhäll, S. Review on urban vegetation and particle air pollution—Deposition and dispersion. Atmos. Environ. 2015, 105, 130–137. [Google Scholar] [CrossRef]
- Beckett, K.P.; Freer-Smith, P.H.; Taylor, G. Particulate pollution capture by urban trees: Effect of species and windspeed. Glob. Chang. Biol. 2000, 6, 995–1003. [Google Scholar] [CrossRef]
- Rai, A.; Kulshreshtha, K.; Srivastava, P.K.; Mohanty, C.S. Leaf surface structure alterations due to particulate pollution in some common plants. Environmentalist 2010, 30, 18–23. [Google Scholar] [CrossRef]
- Przybysz, A.; Nersisyan, G.; Gawroński, S.W. Removal of particulate matter and trace elements from ambient air by urban greenery in the winter season. Environ. Sci. Pollut. Res. 2019, 26, 473–482. [Google Scholar] [CrossRef] [Green Version]
- Samson, R.; Grote, R.; Calfapietra, C.; Cariñanos, P.; Fares, S.; Paoletti, E.; Tiwary, A. Urban Trees and Their Relation to Air Pollution BT. In The Urban Forest: Cultivating Green Infrastructure for People and the Environment; Pearlmutter, D., Calfapietra, C., Samson, R., O’Brien, L., Krajter Ostoić, S., Sanesi, G., Alonso del Amo, R., Eds.; Springer International Publishing: Cham, Switzerland, 2017; pp. 21–30. ISBN 978-3-319-50280-9. [Google Scholar]
- Sgrigna, G.; Baldacchini, C.; Dreveck, S.; Cheng, Z.; Calfapietra, C. Relationships between air particulate matter capture efficiency and leaf traits in twelve tree species from an Italian urban-industrial environment. Sci. Total Environ. 2020, 718, 137310. [Google Scholar] [CrossRef] [PubMed]
- Mohtashamian, M.; Attar, F.; Kavousi, K.; Masoudi-nejad, A.L.I. Micromorphological studies of leaf epidermal features in populations of maples (Acer L.) from Iran. Phytotaxa 2017, 299, 36–54. [Google Scholar] [CrossRef]
- Watson, D.J. Comparative Physiological Studies on the Growth of Field Crops: I. Variation in Net Assimilation Rate and Leaf Area between Species and Varieties, and within and between Years. Ann. Bot. 1947, 11, 41–76. [Google Scholar] [CrossRef]
- Mussche, S.; Samson, R.; Nachtergale, L.; De Schrijver, A.; Lemeur, R.; Lust, N. A comparison of optical and direct methods for monitoring the seasonal dynamics of leaf area index in deciduous forests. Silva Fenn. 2001, 35, 373–384. [Google Scholar] [CrossRef] [Green Version]
- Neumann, H.H.; Den Hartog, G.; Shaw, R.H. Leaf area measurements based on hemispheric photographs and leaf-litter collection in a deciduous forest during autumn leaf-fall. Agric. For. Meteorol. 1989, 45, 325–345. [Google Scholar] [CrossRef]
- Bréda, N.J.J. Ground-based measurements of leaf area index: A review of methods, instruments and current controversies. J. Exp. Bot. 2003, 54, 2403–2417. [Google Scholar] [CrossRef] [PubMed]
- Gower, S.T.; Reich, P.B.; Son, Y. Canopy dynamics and aboveground production of five tree species with different leaf longevities. Tree Physiol. 1993, 12, 327–345. [Google Scholar] [CrossRef] [PubMed]
- Liang, J.; Crowther, T.W.; Picard, N.; Wiser, S.; Zhou, M.; Alberti, G.; Schulze, E.D.; McGuire, A.D.; Bozzato, F.; Pretzsch, H.; et al. Positive biodiversity-productivity relationship predominant in global forests. Science 2016, 354, aaf8957. [Google Scholar] [CrossRef] [Green Version]
- Pretzsch, H.; Schütze, G. Tree species mixing can increase stand productivity, density and growth efficiency and attenuate the trade-off between density and growth throughout the whole rotation. Ann. Bot. 2021, 128, 767–786. [Google Scholar] [CrossRef] [PubMed]
- Pretzsch, H. Facilitation and competition reduction in tree species mixtures in Central Europe: Consequences for growth modeling and forest management. Ecol. Model. 2022, 464, 109812. [Google Scholar] [CrossRef]
- Ratcliffe, S.; Wirth, C.; Jucker, T.; van der Plas, F.; Scherer-Lorenzen, M.; Verheyen, K.; Allan, E.; Benavides, R.; Bruelheide, H.; Ohse, B.; et al. Biodiversity and ecosystem functioning relations in European forests depend on environmental context. Ecol. Lett. 2017, 20, 1414–1426. [Google Scholar] [CrossRef] [PubMed]
- Forrester, D.I.; Bauhus, J.; Cowie, A.L. On the success and failure of mixed-species tree plantations: Lessons learned from a model system of Eucalyptus globulus and Acacia mearnsii. For. Ecol. Manag. 2005, 209, 147–155. [Google Scholar] [CrossRef]
- Tobner, C.M.; Paquette, A.; Gravel, D.; Reich, P.B.; Williams, L.J.; Messier, C. Functional identity is the main driver of diversity effects in young tree communities. Ecol. Lett. 2016, 19, 638–647. [Google Scholar] [CrossRef] [PubMed]
- Díaz, S.; Cabido, M. Vive la différence: Plant functional diversity matters to ecosystem processes. Trends Ecol. Evol. 2001, 16, 646–655. [Google Scholar] [CrossRef]
- Kelty, M.J. Comparative productivity of monocultures and mixed-species stands BT. In The Ecology and Silviculture of Mixed-Species Forests: A Festschrift for David M. Smith; Kelty, M.J., Larson, B.C., Oliver, C.D., Eds.; Springer: Dordrecht, The Netherlands, 1992; pp. 125–141. ISBN 978-94-015-8052-6. [Google Scholar]
- Zhang, Y.; Chen, H.Y.H.; Reich, P.B. Forest productivity increases with evenness, species richness and trait variation: A global meta-analysis. J. Ecol. 2012, 100, 742–749. [Google Scholar] [CrossRef]
- Göransson, H.; Bambrick, M.T.; Godbold, D.L. Overyielding of temperate deciduous tree mixtures is maintained under throughfall reduction. Plant Soil 2016, 408, 285–298. [Google Scholar] [CrossRef] [Green Version]
- Scherer-Lorenzen, M.; Bonilla, J.L.; Potvin, C. Tree species richness affects litter production and decomposition rates in a tropical biodiversity experiment. Oikos 2007, 116, 2108–2124. [Google Scholar] [CrossRef]
- Huang, Y.; Ma, K.; Niklaus, P.A.; Schmid, B. Leaf-litter overyielding in a forest biodiversity experiment in subtropical China. For. Ecosyst. 2018, 5, 38. [Google Scholar] [CrossRef] [Green Version]
- Verheyen, K.; Vanhellemont, M.; Auge, H.; Baeten, L.; Baraloto, C.; Barsoum, N.; Bilodeau-Gauthier, S.; Bruelheide, H.; Castagneyrol, B.; Godbold, D.; et al. Contributions of a global network of tree diversity experiments to sustainable forest plantations. Ambio 2016, 45, 29–41. [Google Scholar] [CrossRef] [PubMed] [Green Version]
- ZAMG Klimadaten von Österreich 1971–2000. Available online: https://www.zamg.ac.at/fix/klima/oe71-00/klima2000/klimadaten_oesterreich_1971_frame1.htm (accessed on 15 January 2022).
- Ould-Dada, Z.; Baghini, N.M. Resuspension of small particles from tree surfaces. Atmos. Environ. 2001, 35, 3799–3809. [Google Scholar] [CrossRef]
- Wang, H.; Shi, H.; Wang, Y. Effects of Weather, Time, and Pollution Level on the Amount of Particulate Matter Deposited on Leaves of Ligustrum lucidum. Sci. World J. 2015, 2015, 935942. [Google Scholar] [CrossRef] [PubMed] [Green Version]
- Umweltbundesamt Aktuelle Luftgütemesswerte des Bundes und der Länder. Available online: https://luft.umweltbundesamt.at/pub/gmap/start.html (accessed on 5 January 2022).
- Popek, R.; Łukowsk, A.; Karolewski, P. Particulate matter accumulation-further differences between native Prunus padus and non-native P. serotina. Dendrobiology 2017, 78, 85–95. [Google Scholar] [CrossRef] [Green Version]
- Ahmed, I.U.; Smith, A.R.; Godbold, D.L. Polyculture affects biomass production of component species but not total standing biomass and soil carbon stocks in a temperate forest plantation. Ann. For. Sci. 2019, 76, 91. [Google Scholar] [CrossRef] [Green Version]
- Liu, J.; Cao, Z.; Zou, S.; Liu, H.; Hai, X.; Wang, S.; Duan, J.; Xi, B.; Yan, G.; Zhang, S.; et al. An investigation of the leaf retention capacity, efficiency and mechanism for atmospheric particulate matter of five greening tree species in Beijing, China. Sci. Total Environ. 2018, 616–617, 417–426. [Google Scholar] [CrossRef] [PubMed]
- Hofman, J.; Wuyts, K.; Van Wittenberghe, S.; Brackx, M.; Samson, R. On the link between biomagnetic monitoring and leaf-deposited dust load of urban trees: Relationships and spatial variability of different particle size fractions. Environ. Pollut. 2014, 189, 63–72. [Google Scholar] [CrossRef] [PubMed]
- Zhang, L.; Zhang, Z.; Chen, L.; McNulty, S. An investigation on the leaf accumulation-removal efficiency of atmospheric particulate matter for five urban plant species under different rainfall regimes. Atmos. Environ. 2019, 208, 123–132. [Google Scholar] [CrossRef]
- Ahmed, N.; Atzberger, C.; Zewdie, W. Integration of remote sensing and bioclimatic data for prediction of invasive species distribution in data-poor regions: A review on challenges and opportunities. Environ. Syst. Res. 2020, 9, 32. [Google Scholar] [CrossRef]
- Smith, A.R.; Lukac, M.; Hood, R.; Healey, J.R.; Miglietta, F.; Godbold, D.L. Elevated CO2 enrichment induces a differential biomass response in a mixed species temperate forest plantation. New Phytol. 2013, 198, 156–168. [Google Scholar] [CrossRef] [PubMed] [Green Version]
- R Core Team R: A Language and Environment for Statistical Computing. 2020. Available online: https://www.r-project.org/ (accessed on 1 May 2020).
- Sgrigna, G.; Sæbø, A.; Gawronski, S.; Popek, R.; Calfapietra, C. Particulate Matter deposition on Quercus ilex leaves in an industrial city of central Italy. Environ. Pollut. 2015, 197, 187–194. [Google Scholar] [CrossRef] [PubMed]
- Samson, R.; Ningal, T.F.; Tiwary, A.; Grote, R.; Fares, S.; Saaroni, H.; Hiemstra, J.A.; Zhiyanski, M.; Vilhar, U.; Cariñanos, P.; et al. Species-Specific Information for Enhancing Ecosystem Services BT. In The Urban Forest: Cultivating Green Infrastructure for People and the Environment; Pearlmutter, D., Calfapietra, C., Samson, R., O’Brien, L., Krajter Ostoić, S., Sanesi, G., Alonso del Amo, R., Eds.; Springer International Publishing: Cham, Switzerland, 2017; pp. 111–144. ISBN 978-3-319-50280-9. [Google Scholar]
- Blanusa, T.; Fantozzi, F.; Monaci, F.; Bargagli, R. Leaf trapping and retention of particles by holm oak and other common tree species in Mediterranean urban environments. Urban For. Urban Green. 2015, 14, 1095–1101. [Google Scholar] [CrossRef]
- Beckett, K.P.; Freer-Smith, P.; Taylor, G. Effective Tree Species for Local Air-Quality Management. J. Arboric. 2000, 26, 12–19. [Google Scholar]
- Hwang, H.-J.; Yook, S.-J.; Ahn, K.-H. Experimental investigation of submicron and ultrafine soot particle removal by tree leaves. Atmos. Environ. 2011, 45, 6987–6994. [Google Scholar] [CrossRef]
- Freer-Smith, P.H.; Beckett, K.P.; Taylor, G. Deposition velocities to Sorbus aria, Acer campestre, Populus deltoides × trichocarpa “Beaupré”, Pinus nigra and × Cupressocyparis leylandii for coarse, fine and ultra-fine particles in the urban environment. Environ. Pollut. 2005, 133, 157–167. [Google Scholar] [CrossRef] [PubMed]
- Kardel, F.; Wuyts, K.; Maher, B.A.; Hansard, R.; Samson, R. Leaf saturation isothermal remanent magnetization (SIRM) as a proxy for particulate matter monitoring: Inter-species differences and in-season variation. Atmos. Environ. 2011, 45, 5164–5171. [Google Scholar] [CrossRef]
- Kardel, F.; Wuyts, K.; Maher, B.A.; Samson, R. Intra-urban spatial variation of magnetic particles: Monitoring via leaf saturation isothermal remanent magnetisation (SIRM). Atmos. Environ. 2012, 55, 111–120. [Google Scholar] [CrossRef]
- Mitchell, R.; Maher, B.A. Evaluation and application of biomagnetic monitoring of traffic-derived particulate pollution. Atmos. Environ. 2009, 43, 2095–2103. [Google Scholar] [CrossRef]
- Schmid, B.; Hector, A.; Saha, P.; Loreau, M. Biodiversity effects and transgressive overyielding. J. Plant Ecol. 2008, 1, 95–102. [Google Scholar] [CrossRef] [Green Version]
- Alemayehu, Y.A.; Asfaw, S.L.; Terfie, T.A. Exposure to urban particulate matter and its association with human health risks. Environ. Sci. Policy 2020, 27, 27491–27506. [Google Scholar] [CrossRef] [PubMed]
- Xu, X.; Zhang, Z.; Bao, L.; Mo, L.; Yu, X.; Fan, D.; Lun, X. Influence of rainfall duration and intensity on particulate matter removal from plant leaves. Sci. Total Environ. 2017, 609, 11–16. [Google Scholar] [CrossRef] [PubMed]
- Przybysz, A.; Sæbø, A.; Hanslin, H.M.; Gawro, S.W. Accumulation of particulate matter and trace elements on vegetation as affected by pollution level, rainfall and the passage of time. Sci. Total Environ. 2014, 481, 360–369. [Google Scholar] [CrossRef] [PubMed]
- Weerakkody, U.; Dover, J.W.; Mitchell, P.; Reiling, K. The impact of rainfall in remobilising particulate matter accumulated on leaves of four evergreen species grown on a green screen and a living wall. Urban For. Urban Green. 2018, 35, 21–31. [Google Scholar] [CrossRef]
- Yang, J.; Chang, Y.; Yan, P. Ranking the suitability of common urban tree species for controlling PM2.5. Atmos. Pollut. Res. 2015, 6, 267–277. [Google Scholar] [CrossRef] [Green Version]
Figure 1.
Schematic overview of the plot arrangement of the TreeDivNet experimental site B-Tree. The four species, Acer platanoides L. (Ap), Tilia cordata Mill. (Tc), Quercus robur L. (Qr), Carpinus betulus L. (Cb), are replicated as monocultures, two species polycultures ApTc and QrCb and as four species polycultures All. Numbers show the block number.

Figure 2.
Differences in mean Leaf Area Index (LAI) in m2·m−2 of monocultures (Ap, Tc, Qr, Cb), two species polycultures (ApTc, QrCb) and a four species polyculture (All) consisting of the four species Acer platanoides (Ap), Tilia cordata (Tc), Quercus robur (Qr), Carpinus betulus (Cb). Each bar represents the mean LAI of four replicates. Error bars refer to the standard error (SE) of the mean. Letters mark significant differences of the mean LAI between compositions (Table 1). Significant differences in the monocultures occurred only between T. cordata and the other species, see Table 1.

Figure 3.
(A) Observed (o) and predicted (p) leaf area index (LAI) and (B) the contribution of each species to the LAI in two species polycultures (ApTc, QrCb), and the four species polyculture (All) of the four species A. platanoides (Ap), T. cordata (Tc), Q. robur (Qr), C. betulus (Cb). Shown are means and standard error of the LAI. Asterisks show significant differences determined using an unpaired t-test (* p < 0.05; ** p < 0.01).


Table 1.
Corresponding ANOVA results for the plot-wise LAI results shown in Figure 2 (one-way ANOVA).
Table 1.
Corresponding ANOVA results for the plot-wise LAI results shown in Figure 2 (one-way ANOVA).
| Pairs | p-Value | Pairs | p-Value |
|---|---|---|---|
| Tc–Ap | <0.001 | Ap–All | <0.05 |
| Tc–Qr | <0.001 | Tc–All | <0.001 |
| Tc–Cb | <0.01 | Cb–All | <0.01 |
| Tc–QrCb | <0.001 | ApTc–All | <0.05 |
| Tc–ApTc | <0.001 |
Table 2.
Particulate matter (PM) fractions removed from leaves of A. platanoides (Ap), T. cordata (Tc), Q. robur (Qr), C. betulus (Cb) for the PM classes PM100, PM10, PM2.5. Data shown in mg PM·m−2 leaf area ± standard error (SE). The letters mark the significant differences of an ANOVA performed within each PM class (one-way ANOVA, p < 0.05).
| Ap | Tc | Qr | Cb | |
|---|---|---|---|---|
| PM100 | 38.0 ± 6.5 | 130.9 ± 40.0 | 60.4 ± 8.8 | 91.4 ± 20.7 |
| PM10 | 9.7 ± 3.3 | 11.7 ± 5.1 | 15.9 ± 2.9 | 22.0 ± 3.9 |
| PM2.5 | 4.1 ± 1.3 a | 14.2 ± 2.4 b | 6.7 ± 1.5 a,c | 12.9 ± 1.6 b,c |
Table 3.
Mean PM100, PM10, PM2.5 and ΣPM removed from leaves per square meter stand area (mg·m−2) and standard error (SE) of the monocultures and polycultures. The row observed shows measured values of PM removed from leaves of the monocultures and an approximately 50:50 leaf area mixture of the two species in two species polyculture or 25:25:25:25 in 4 species polyculture (All). Predicted nominal shows values of PM binding calculated for the polycultures from PM binding of the monocultures Ap, Tc, Qr and Cb and using the same leaf areas as in observed. Predicted actual shows values of PM binding calculated for the polycultures from PM binding of monospecific plots and the measured LAI values in the polyculture plots. Within a PM class, in rows, different lower-case letters indicate significant differences between monocultures and polycultures. In columns, different capital letters indicate significant differences between the observed and predicted values. (one-way ANOVA, p < 0.05). A. platanoides (Ap), T. cordata (Tc), Q. robur (Qr), C. betulus (Cb).
| PM100 | Monocultures | Polycultures | ||||||
| Ap | Tc | Qr | Cb | ApTc | QrCb | All | ||
| observed | 144 ± 26 a | 279 ± 84 a | 277 ± 24 a | 333 ± 68 a | 148 ± 35 a/A | 358 ± 67 a/A | 288 ± 50 a/A | |
| predicted nominal | 215 ± 39 A | 316 ± 45 A | 318 ± 47 A | |||||
| predicted actual | 210 ± 23 A | 353 ± 77 A | 327 ± 40 A | |||||
| PM10 | Monocultures | Polycultures | ||||||
| Ap | Tc | Qr | Cb | ApTc | QrCb | All | ||
| observed | 36 ± 10 a | 23 ± 10 a | 74 ± 14 ab | 81 ± 15 ab | 52 ± 21 ab/A | 114 ± 8 b/A | 58 ± 20 ab/A | |
| predicted nominal | 31 ± 5 A | 82 ± 4 B | 66 ± 6 A | |||||
| predicted actual | 43 ± 13 A | 88 ± 7 B | 71 ± 8 A | |||||
| PM2.5 | Monocultures | Polycultures | ||||||
| Ap | Tc | Qr | Cb | ApTc | QrCb | All | ||
| observed | 16 ± 6 b | 32 ± 9 ab | 32 ± 9 ab | 48 ± 7ab | 35 ± 13 ab/A | 61 ± 12 a/A | 62 ± 3 a/A | |
| predicted nominal | 24 ± 5 A | 41 ± 8 A | 37 ± 4 B | |||||
| predicted actual | 24 ± 5 A | 43 ± 9 A | 40 ± 6 B | |||||
| ΣPM | Monocultures | Polycultures | ||||||
| Ap | Tc | Qr | Cb | ApTc | QrCb | All | ||
| observed | 196 ± 18 a | 344 ± 96 ab | 382 ± 27 ab | 463 ± 76 ab | 235 ± 49 a/A | 533 ± 75 b/A | 407 ± 52 b/A | |
| predicted nominal | 270 ± 44 A | 439 ± 47 A | 421 ± 48 A | |||||
| predicted actual | 277 ± 19 A | 484 ± 85 A | 437 ± 37 A | |||||
Publisher’s Note: MDPI stays neutral with regard to jurisdictional claims in published maps and institutional affiliations. |
© 2022 by the authors. Licensee MDPI, Basel, Switzerland. This article is an open access article distributed under the terms and conditions of the Creative Commons Attribution (CC BY) license (https://creativecommons.org/licenses/by/4.0/).
Share and Cite
MDPI and ACS Style
Steinparzer, M.; Haluza, D.; Godbold, D.L. Integrating Tree Species Identity and Diversity in Particulate Matter Adsorption. Forests 2022, 13, 481. https://doi.org/10.3390/f13030481
AMA Style
Steinparzer M, Haluza D, Godbold DL. Integrating Tree Species Identity and Diversity in Particulate Matter Adsorption. Forests. 2022; 13(3):481. https://doi.org/10.3390/f13030481
Chicago/Turabian StyleSteinparzer, Matthias, Daniela Haluza, and Douglas L. Godbold. 2022. "Integrating Tree Species Identity and Diversity in Particulate Matter Adsorption" Forests 13, no. 3: 481. https://doi.org/10.3390/f13030481
Note that from the first issue of 2016, this journal uses article numbers instead of page numbers. See further details here.