
Growth and Morphological Patterns of Norway Spruce (Picea abies (L.) Karst.) Juveniles in Response to Light Intensities

1
Research Station of Silviculture in Opočno, Forestry and Game Management Research Institute, Na Olivě 550, 517 73 Opočno, Czech Republic
2
Department of Forest Ecology, Faculty of Forestry and Wood Technology, Mendel University in Brno, Zemědělská 3, 613 00 Brno, Czech Republic
3
Global Change Research Institute of the Czech Academy of Sciences, Bělidla 4a, 603 00 Brno, Czech Republic
*
Author to whom correspondence should be addressed.
Forests 2022, 13(11), 1804; https://doi.org/10.3390/f13111804
Submission received: 26 August 2022
/
Revised: 21 October 2022
/
Accepted: 21 October 2022
/
Published: 29 October 2022
(This article belongs to the Section Forest Ecology and Management)
Abstract
:(1) Background: The growth and morphology of Norway spruce (Picea abies (L.) Karst.) juveniles were observed under different light conditions due to overstory canopy openness. The aim was to investigate the photo-morphological responses of juveniles for the development of a desirable forest structure. The research was located in a higher altitude zone in central Europe. (2) Methods: Light was estimated using hemispherical photographs. Eight different parameters of natural regeneration were measured on individuals within 1 × 1 m around each point on a 3 × 3 m grid. A total of 1214 sapling measurements (from 10 to 431 cm in height) were taken. (3) Results: Light affected the growth and morphological development of juveniles, resulting in variation in the lateral crown growth and crown length. Acclimations manifested as trade-offs between height and lateral crown growth. Similar shifts were found within relative height growth (the terminal length to the total height) and apical dominance ratio (the terminal length to the branch length). The crown length was proven to be highly capable to acclimation. Light influenced the density weakly, however, when a regeneration index (density × median height) was considered, significant relations with light conditions were discovered.
1. Introduction
Forest regeneration and establishment are critical stages during which considerable losses in species diversity can often occur [1]. Natural regeneration (or natural regeneration in conjunction with artificial regeneration) often results in a large initial seedling bank. This is favored by a high proportion of unoccupied growing space and a diversity of microsite characteristics. As the plants increase in size and fill in the available space, competition becomes more intense and the growing conditions become more homogeneous. As the initial seedling bank progressively declines, species diversity may dramatically decrease as less competitive species are eliminated [2]. These competitive relationships must be considered in silvicultural techniques [3,4,5]. When the transformation of pure Norway spruce (Picea abies (L.) Karst.) stands is adopted, natural regeneration of Norway spruce (combined with planting of reintroduced tree species) must be controlled to prevent reintroduced species from being overtopped and out-competed [6]. One of the main silvicultural tools for this purpose is adjusting light intensities through overstory canopy openness. Thus, forest structure and heterogeneity are encouraged [7,8].
Uneven-aged forest management is characterized by silvicultural practices that create or maintain stands made up of trees of different age classes [9,10]. Different terms and definitions are used for the numerous forms of uneven-aged silviculture [10,11]; however, all these silvicultural systems are based on the creation of canopy openings or gaps to allow light to reach the floor of the stand [5,7,8]. The degree of growth heterogeneity, and structure of the understory induced by the variability of light levels, can be as variable and advanced as the shade tolerance of particular tree species is high [12,13]. In similar studies of forest ecology where light is an independent variable, it is important to consider reference levels of other site conditions, such as nutrients and water supply. This is because shade tolerance is shifted by the availability or scarcity of other site factors [14,15,16]. It is therefore advantageous to perform such an investigation on nutrient-poor sites as a basic level of nutrient resources in combination with average water supply, which can then be used as a reference compared to more optimal conditions (such as nutrient-enriched conditions) where shade tolerance is generally increased [14,15].
Tree species with different levels of shade tolerance show different levels of both morphological and physiological plasticity under various light conditions [4,8,17]. The response of crown morphology and height growth depending on shade tolerance or intolerance has been described in different studies [3,18,19]. In general, the conclusion of those studies is that shade-tolerant tree species can adapt their crown morphology more acutely and in more morphological traits (such as crown length, width, and projection or terminal length) along the light gradient compared to shade-intolerant tree species. Shade-tolerant tree species can effectively reduce their growth and survive under low light intensities due to their diminished growth rate and photo-morphological responses resulting in lower mortality rate in shaded conditions; after their release, they react immediately to increased light intensities with an increased growth rate [15,20,21]. However, they do not reach the same growth rate under canopy-open conditions as shade-intolerant tree species [22].
The three following objects of interest related to photo-morphological patterns of Norway spruce juveniles were analyzed in this paper:
- The existence and intensity of morphological plasticity (i.e., the ability to respond to the different availability of resources by acclimation of the morphological traits) as a response to different light intensities;
- The definition of microsites where the morphological plasticity was realized most distinctly;
- The influence of light intensities on the general development of Norway spruce juveniles (including, for instance, their density) and a consideration of all observed patterns for further use in silvicultural guidelines.
2. Materials and Methods
2.1. Research Sites
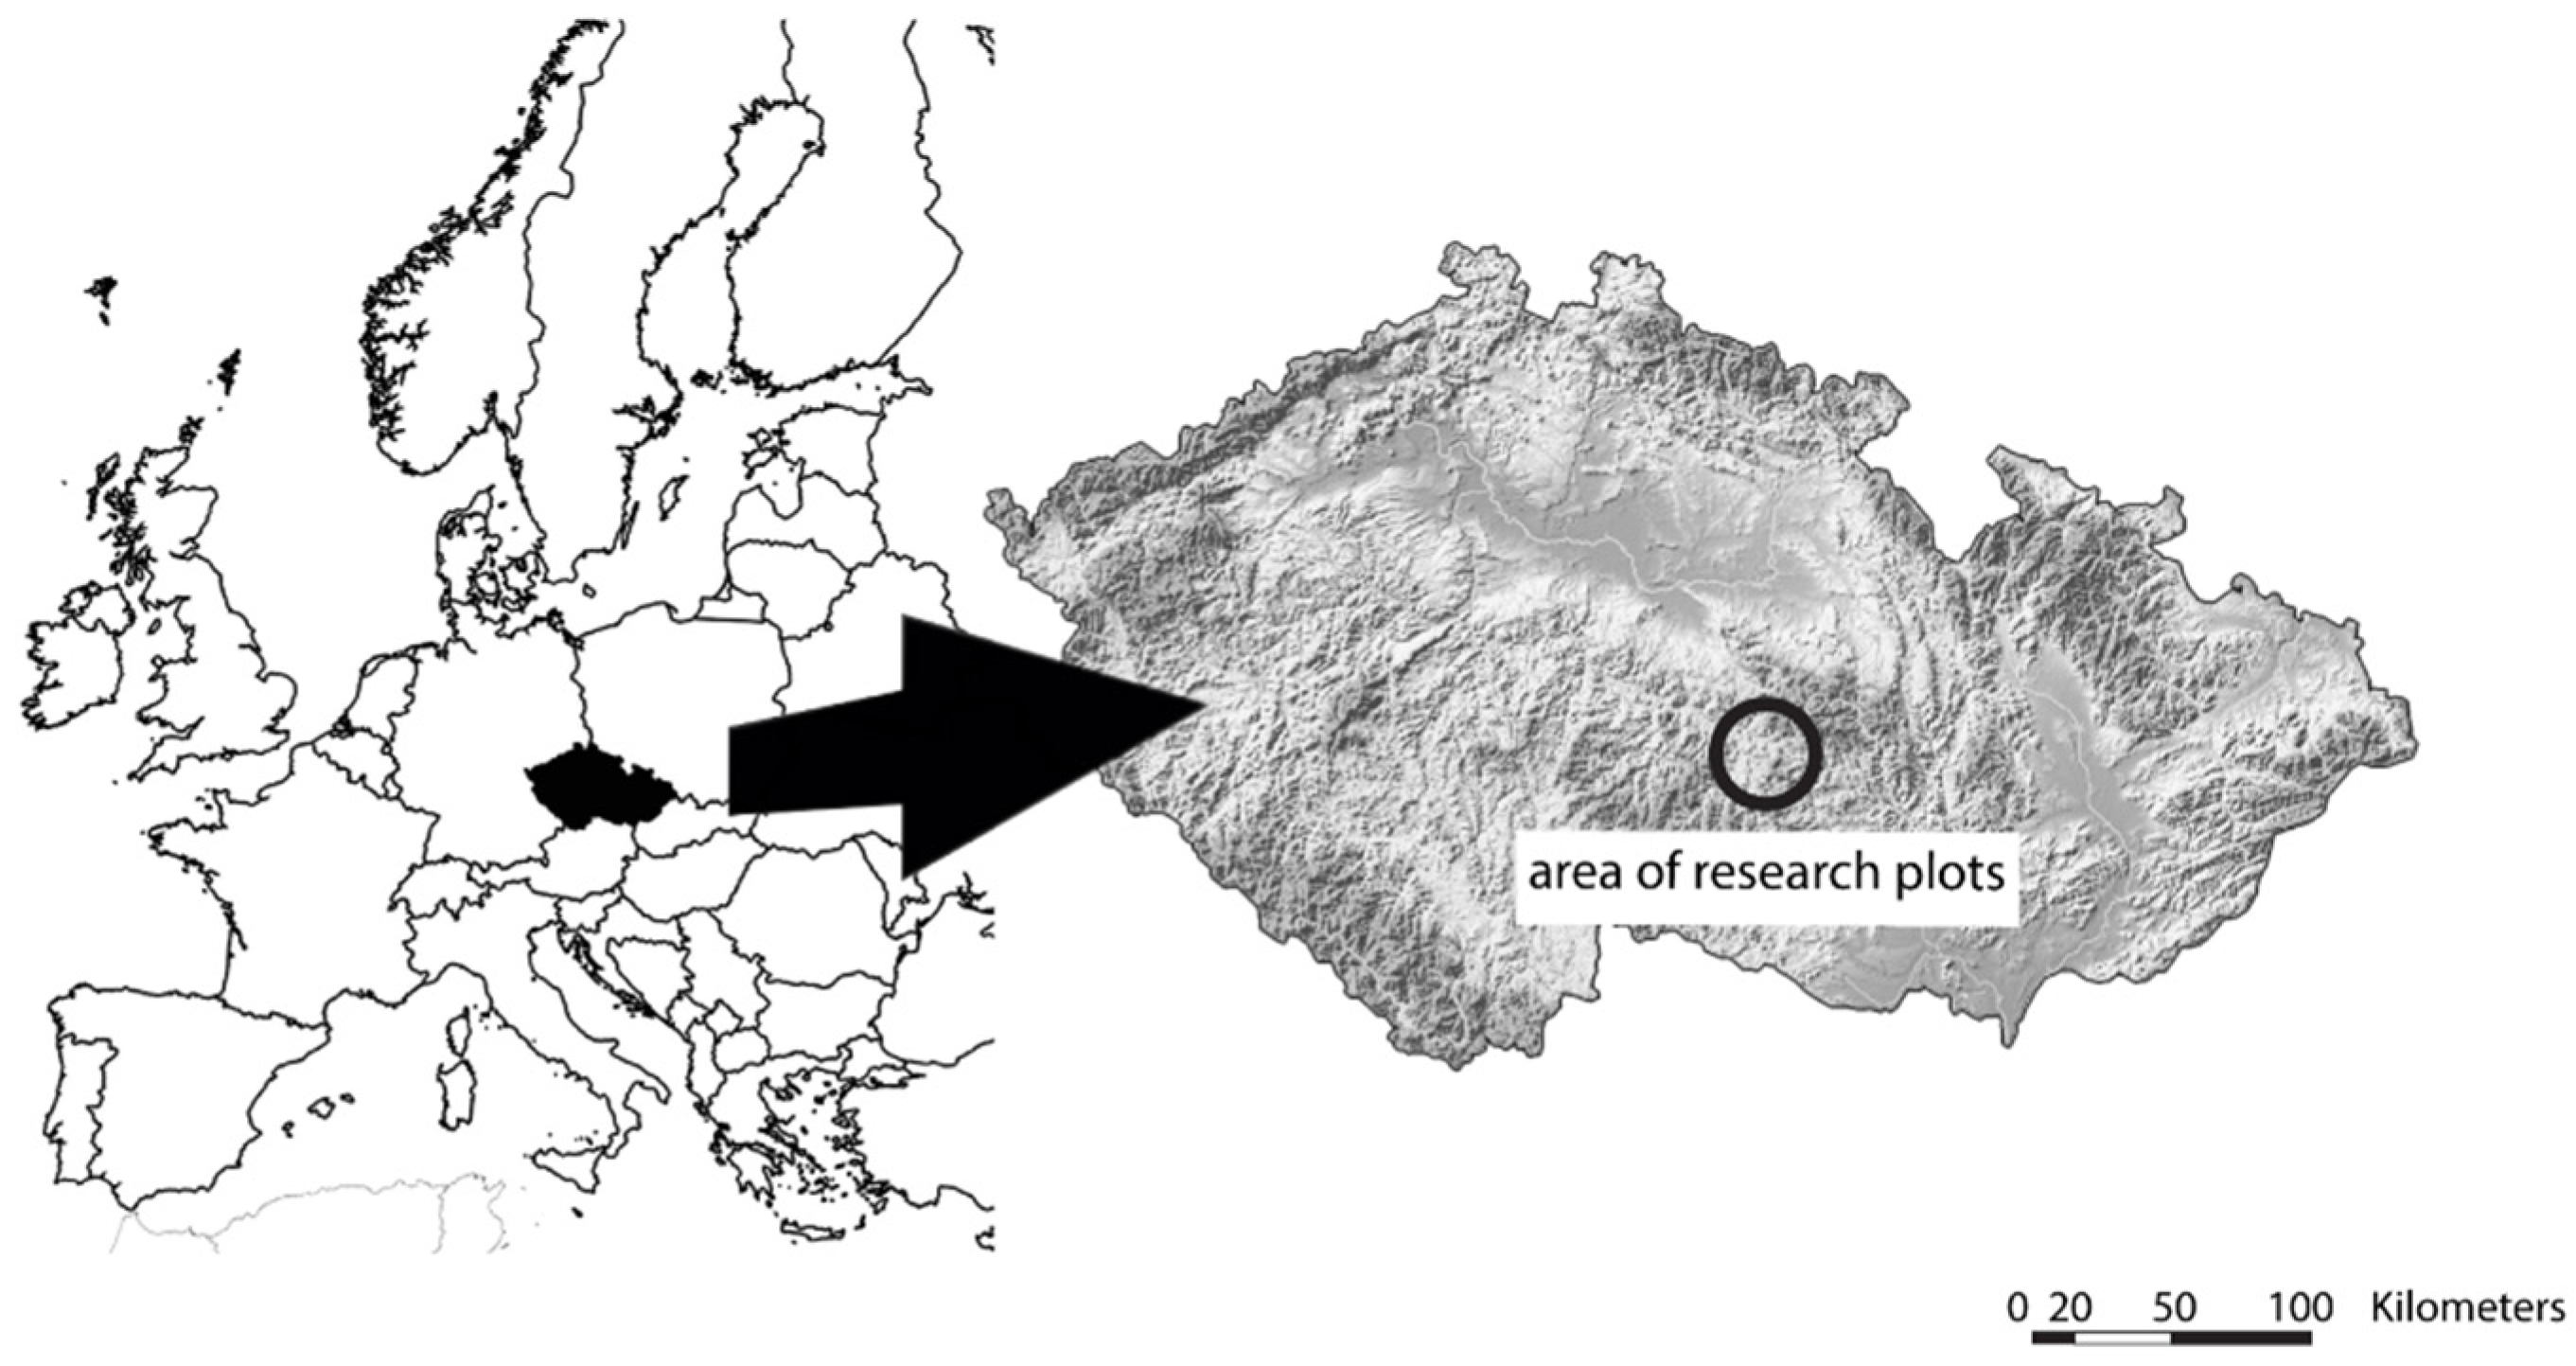
The research was conducted on acidic sites, i.e., Fageta piceoso-abietina or Fageta abietina-piceosa, due to the fact that a large proportion of these sites were occupied by secondary Norway spruce monocultures [23]. Selected research plots were represented by forest stands with a pure even-aged Norway spruce overstory that was tended by thinnings from below in young and mid-aged growing stages. Then in the growing stage of forest maturity, shelter-wood cuts of different intensities or gaps were created 15–25 years ago with no further silvicultural interventions since that time. The observations took place in the central part of the Czech Republic in the Bohemian–Moravian Highlands within altitudes of ca. 670–770 m above sea level (Figure 1). The soils of the research plots were determined as cambisols (mainly Eutric Cambisol; less often Dystric Cambisol or Areno-dystric Cambisol). The whole area lies in the geological entity of Moldanubikum with the typically prevailing acidic bedrocks of mainly amphibolite with veins of granodiorite or granite [24]. The mean annual air temperature is 4.9 °C; the mean annual precipitation is 850 mm with 55%–60% falling in the growing season [24,25], and the number of days when the snow cover is present usually ranges between 100 and 120 days [26].
2.2. Experiment Design
Three research plots were established for this study (Table 1), taking into account experimental conditions as follows:
- Overstory, consisting of pure mature even-aged Norway spruce stands (approximately 100 years old);
- A gradient of overstory canopy openness characterized by a significant gradient of light intensity within the plots ranging from complete canopy closure up to open sky conditions of a forest gap; the maximum size of a gap in the study was considered as ca. 16 m in diameter (i.e., ca. 2/3 of overstory mature tree height) and thus ca. 200–220 m2 (ca. 2 ares) of the total size; thus, the light conditions ranged from 0.04 to 0.46 of the total site factor (TSF);
- No further silvicultural interventions were carried out within natural regeneration (once it started) or within the mature overstory once the initial regeneration cut (shelter-wood cut or gaps) occurred.
Field-Map technology (IFER, Prague, Czech Republic) was utilized to identify the position of the mature overstory for both tree positions and their crown projections and to locate borders of research plots. All present mature trees within the plot areas and all neighbors whose crown projections intervened in the area of the plot were included. Afterward, the same equipment was used to cover the research plots in a grid of 3 m × 3 m squares. Every segment (3 m × 3 m) of the grid was permanently marked at its central point (centroid) (Figure S1). Centroids were then targeted for subsequent measurements when hemispherical photos were taken here and the number of Norway spruce juveniles was measured within 1 m × 1 m sub-plots around the centroids.
2.3. Natural Regeneration Measurements
Around each centroid (within the 1 × 1 m sub-plot), the number of all present Norway spruce individuals was counted (individuals both below and over 10 cm in height were included), and the morphological parameters were measured for all seedlings and saplings over 10 cm in height (according to [3]).
Seven different morphological parameters of Norway spruce juveniles were measured, as listed in Table 2. The chosen morphological parameters were employed in studies of the photo-morphological plasticity of different tree species in the past [27,28,29].
Stem diameter was taken as an average from two mutually perpendicular measurements, and it was measured using a digital caliper with an accuracy of 0.1 cm. It was measured 5 cm above the ground, due to the possible occurrence of morphological anomalies within the root collar [30,31]. Other morphological parameters were measured using a telescopic tape measure or a Messfix telescopic measuring stick (NEDO, Switzerland) with an attached level and a precision of 1 cm. In total, 1214 juveniles of Norway spruce were measured with heights ranging from 10 to 431 cm within 166 sub-plots on three different research plots.
2.4. Indirect Estimation of Light Intensities
We used color hemispherical photography evaluation as an indirect method to estimate the potential light intensity [5,32]. This method is also fully compatible with instantaneous direct methods, such as photon flux density measurement [5,33]. A self-leveling platform (Régent Instruments Inc., Quebec City, QC, Canada) with a remote-triggered Nikon Coolpix 995 digital camera (Nikon, Tokyo, Japan) with a fine-quality, calibrated fish-eye lens was employed. The whole self-leveling platform was fixed atop a Manfrotto 269 HDBU tripod (Manfrotto, Cassola, Italy) with a maximum height of 8 m; this enabled photos to be taken from 1.7 m (the essential height of the tripod) to 4.5 m for photographing the tallest juveniles. Photographs were taken during windless weather and standard overcast sky conditions—i.e., when the solar disk was completely obscured (according to Čater et al. 2013 [5]). The camera was leveled and the fish-eye lens oriented toward magnetic north using a compass.
The standardized post-processing and evaluation of the photos were performed with WinSCANOPY 2012 (Régent Instruments Inc., Quebec City, QC, Canada). The quality of photos was controlled visually, and batches (of maximally 20) of similar photos (mainly based on features of exposure and contrast) were created. Then the process of distinguishing sky vs. canopy was performed by selecting different colors of a picture and sorting them into one of these categories. Finally, black and white thresholding was tested for several random pictures of the batch to check the accuracy of the thresholding visually. The value of 60° as a zenith angle detecting an evaluated sector of the picture view was used as the most accurate and effective [5]. The growing season was considered from 1 May to 30 September, according to Löf et al. (2007) [21] and Čater et al. (2013) [5]. Other required values, such as the geographical coordinates, the elevation, and the magnetic declination, were considered. Five different characteristics (two classifying the openness of the canopy and three classifying light intensities (Table 3)) were taken into account for subsequent analysis of this study according to the manual of WinSCANOPY software [34].
2.5. Data Evaluation
2.5.1. The Effect of Light Intensities on the Density of Natural Regeneration
First, all individuals of all sub-plots in the research plots were considered for the density evaluation. Then, to determine if there was a relationship between light intensity and density along the dimension of natural regression (i.e., height), height classes determined by the tallest juvenile within a sub-plot were created and only those sub-plots were subsequently tested. The height classes were as follows: up to 15 cm, 20 cm, 30 cm, 40 cm, 50 cm, 60 cm, 70 cm, 80 cm, 90 cm, 100 cm, 110 cm, 120 cm, 130 cm, and 140 cm.
2.5.2. Morphological Patterns of Juveniles under Size-Independent Evaluation
The influence of light intensities on two measured parameters (H and D (Table 2)) and six calculated indexes (Table 4) was analyzed. The size (i.e., height classes) was not considered here; the exact value of a parameter or index for a sub-plot was calculated as the median of all present juveniles occurring within a particular sub-plot, according to Dai (1996) [35]. However, to make this size-independent evaluation useful for individuals of varying heights, parameters and indexes involving the parameters of total height (H) or terminal length (Tl) were used. For calculation of the regeneration index (RI), the number of juveniles higher than 10 cm was considered as the total number of juveniles in the equation for which the height was being measured.
2.5.3. Morphological Patterns of Juveniles under Size-Dependent Evaluation
Natural regeneration was divided into height classes according to Lundquist and Fridman (1996) [36], Duchesneau et al. (2001) [37], and Chrimes and Nilson (2005) [19]. The regular height classes concerning a range of heights in this study were as follows: 10–50 cm, 51–100 cm, 101–150 cm, and >151 cm.
The exact value of a parameter or an index of a height class was calculated within a sub-plot as a median of values of all juveniles falling into a particular height class. Thus, when more height classes were present within one certain sub-plot, more values of the same parameter (or index) were obtained, but for different height classes (Table 4). In total, for size-dependent evaluation, the influence of light intensities on all seven measured morphological parameters (Table 2) and eight calculated indexes was tested (Table 4).
2.6. Statistical Analysis
All statistical analyses were performed with p < 0.05. William’s test was employed using QC Expert version 3.3 (Trilobyte Statistica Software Ltd., Pardubice, Czech Republic) to detect outlying values. The software STATISTICA version 10.0 (StatSoft Inc., Tulsa, OK, USA) was used to test the significance of models of light intensities and morphological features; quadratic polynomials were used to intersperse the values. When a model was found to be significant, the Spearman correlation coefficient (rs) was tested (to test the robustness of correlation against the effect of extreme values, nonlinear correlation, and non-normality). For the visualization of certain indexes within the largest research plot, Wafer plots were constructed in STATISTICA software, and then those outputs were overlaid on the schema of the plot with 50% transparency in a freeware piece of graphics software.
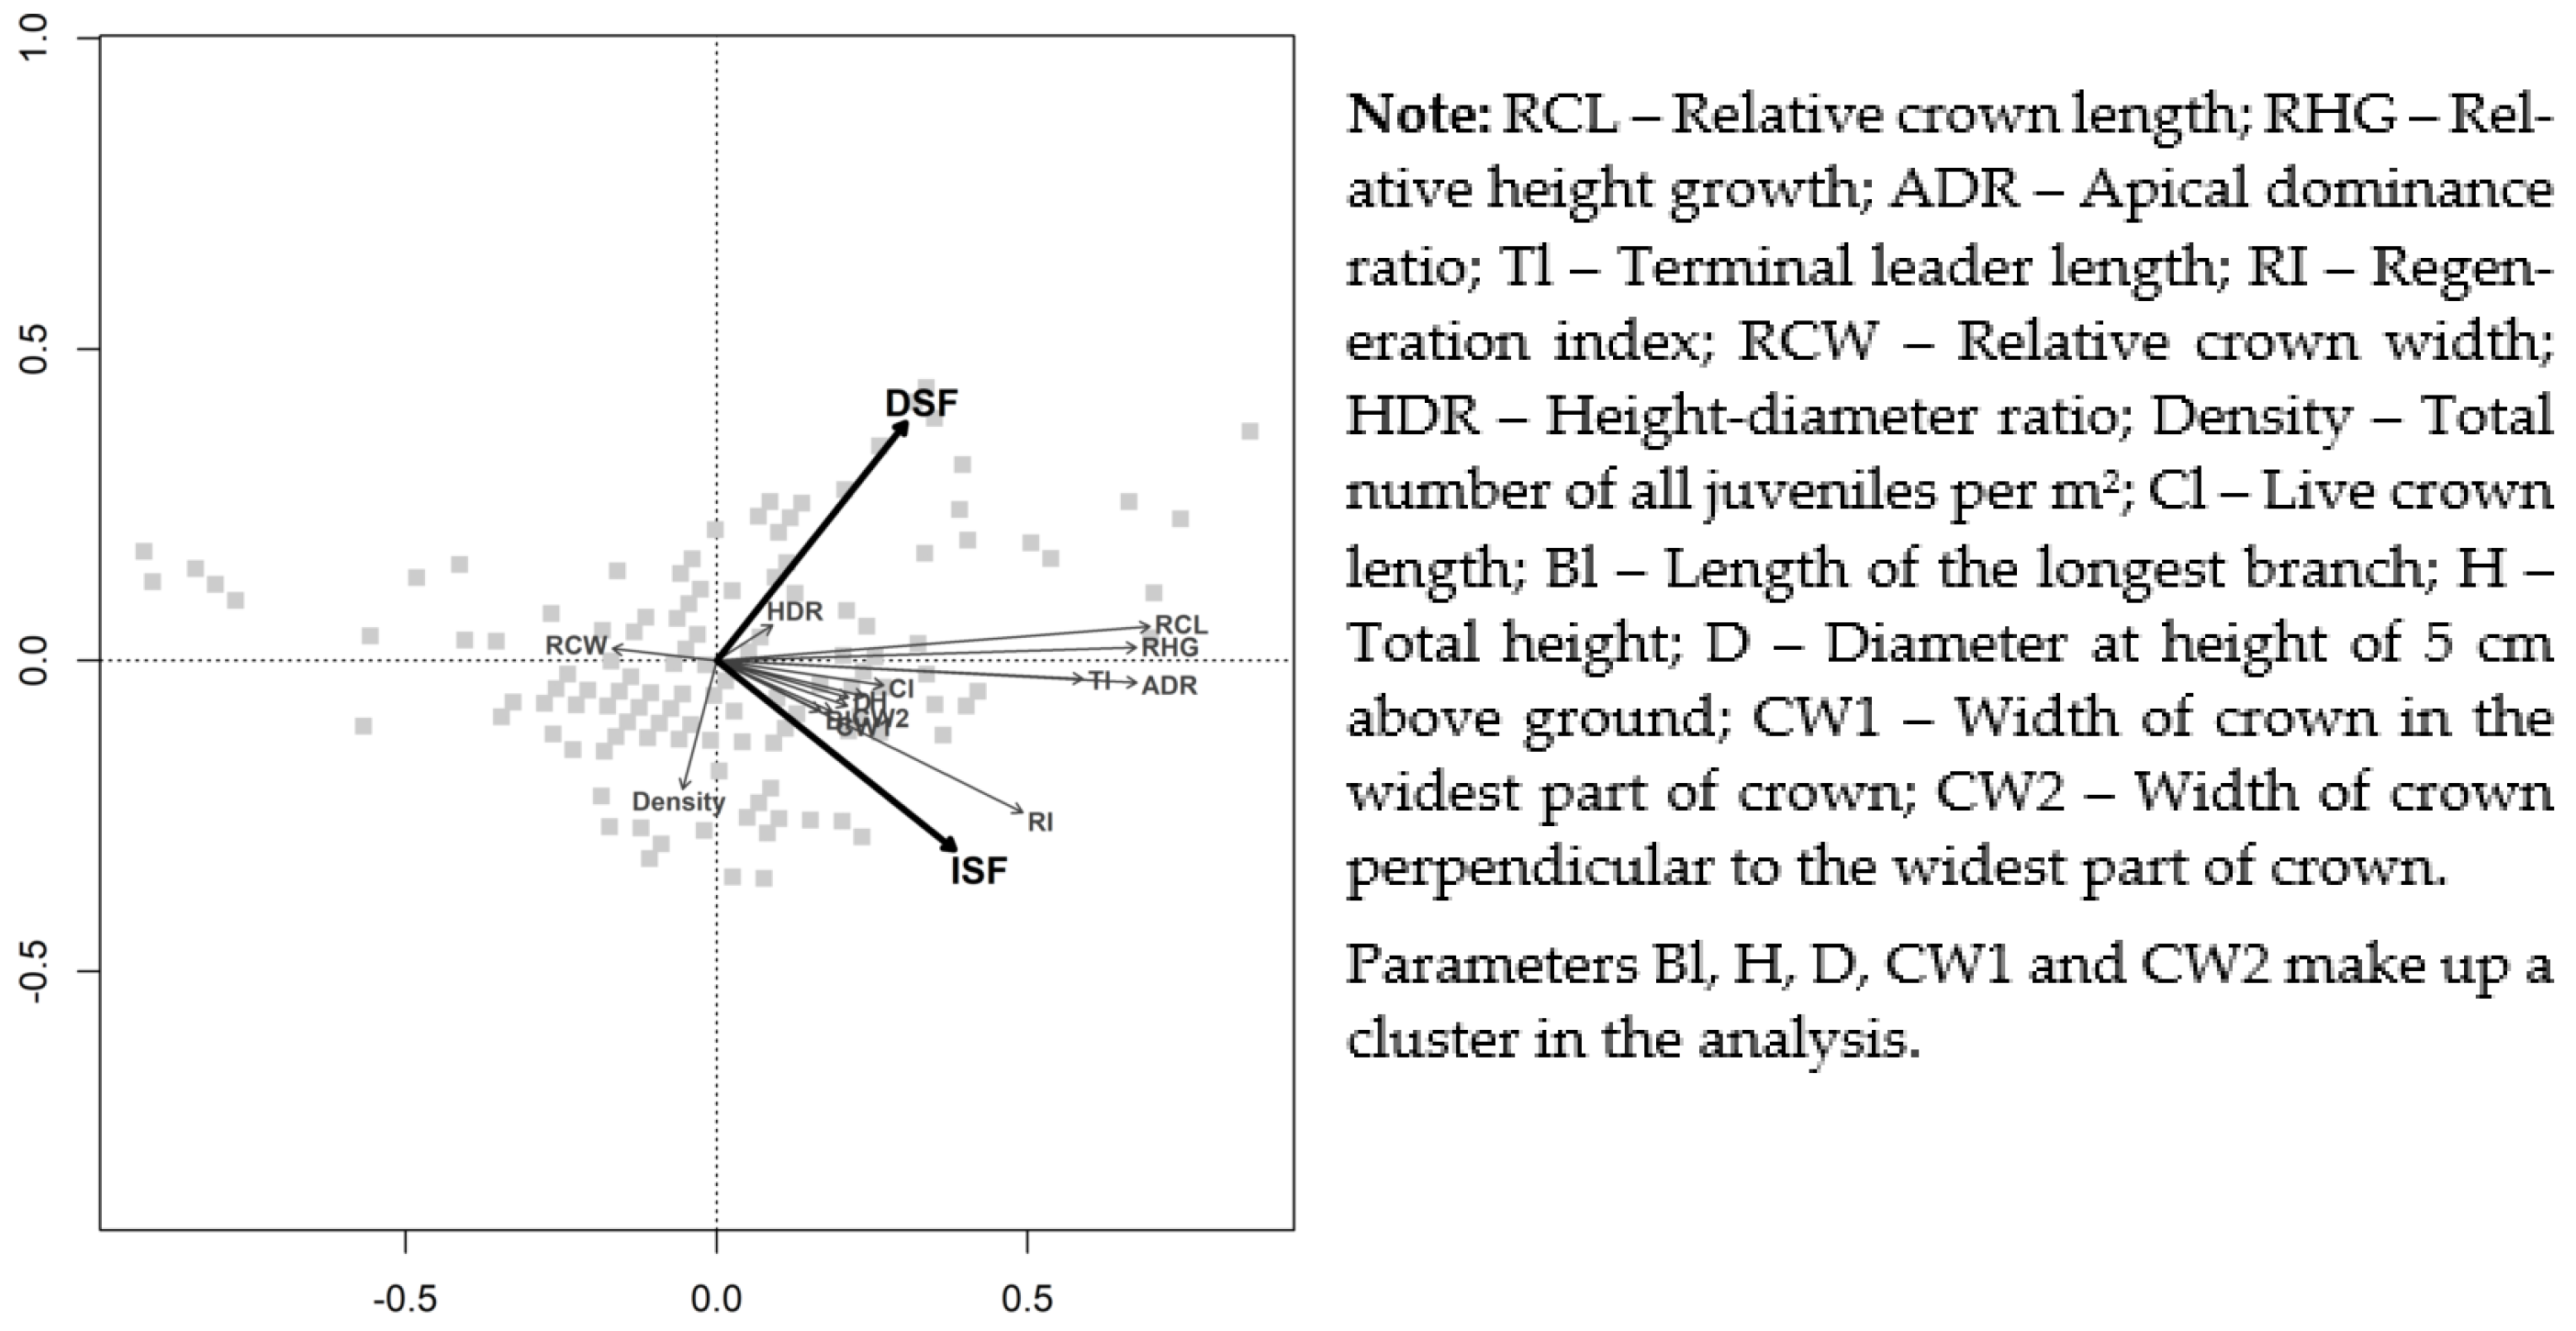
Redundancy analysis (RDA) was performed to investigate the effect of the main light components (direct and indirect—DSF and ISF) and the similarities within intensities of photo-morphological plasticity of different observed parameters and indexes. In this analysis, all measured parameters were included, as were indexes calculated for size-independent evaluation (i.e., regardless of height classes); the density was also included. RDA was performed with R software version 3.6.0 [38] in R Studio version 1.2.1335 [39] using the R package vegan [40].

Table 4.
Photo-morphological indexes calculated for Norway spruce juveniles considered within two different approaches of data evaluation.
Table 4.
Photo-morphological indexes calculated for Norway spruce juveniles considered within two different approaches of data evaluation.
| Indexes Used for Testing of Photo-Morphology of Norway Spruce Juveniles under Size-Independent Evaluation * | ||
| Title of Index | Acronym | Equation |
| Relative height growth | RHG | Tl/H |
| Apical dominance ratio | ADR | Tl/Bl |
| Relative crown length | RCL | Cl/H |
| Relative crown width | RCW | (CW1 + CW2)/2 × H |
| Height–diameter ratio | HDR | H/D |
| Regeneration index ** | RI (cm/m2) | juveniles’ number * median height |
| Indexes used for testing of photo-morphology of Norway spruce juveniles under size-dependent evaluation *** | ||
| Title of index | Acronym | Equation |
| Height–diameter ratio | HDR | H/D |
| Relative crown length | RCL | Cl/H |
| Relative crown width | RCW | (CW1 + CW2)/2 × H |
| Crown width–length ratio | CWLR | (CW1 + CW2)/2 × Cl |
| Crown projection | CP (cm2) | ((CW1 + CW2)/4)2 × π |
| Index of spatial distribution | ISD | (CW1 + CW2)/2 × D |
| Crown volume according to equilateral cone | CVEC (cm3) | π/12 × (CW1 + CW2)2/4 × Cl |
| Crown volume according to quadratic paraboloid | CVQP (cm3) | π/8 × (CW1 + CW2)2/4 × Cl |
H: total height (cm); Cl: live crown length (cm); Tl: terminal leader length (cm); Bl: length of the longest branch (cm); CW1: width of crown in the widest part of crown (cm); CW2: width of crown perpendicular to the widest part of crown (cm); D: diameter at height of 5 cm above ground (mm); * Indexes were calculated according to Messier et al. (1999) [27], Duchesneau et al. (2001) [37], Robakowski et al. (2004) [41], Grassi and Giannini (2005) [18], and Szymura (2005) [29]. ** The number of individuals in this equation was considered as the total number of juveniles that were higher than 10 cm for which the total height (H) was measured and then used to calculate a median of heights. *** Indexes were calculated according to Šebík and Polák (1990) [42], Takahashi (1996) [43], Messier et al. (1999) [27], Claveau et al. (2002) [44], Duchesneau et al. (2001) [37], Grassi and Giannini (2005) [18], and Szymura (2005) [29].
3. Results
3.1. The Effect of Light Intensities on the Regeneration Density
Only a weak relationship between light intensities and the density of Norway spruce natural regeneration was found. No significant effect was demonstrated when gap fraction (GFr), openness (Op), or indirect site factor (ISF) was considered through all tested classes of the maximal height. However, when direct site factor (DSF) or total site factor (TSF) was contemplated, a few significant relations were shown. For both light variables, significant (p < 0.05) relations were found when height classes up to 30, 40, 50, and 70 cm were investigated. Significance was also proven for DSF when height classes up to 60 and 100 cm were tested (Table A1 in Appendix A). However, none of those significant relationships were established by the significance of the Spearman correlation coefficient (rs). In addition, the significance of relations between DSF and the density of Norway spruce up to 80 and 90 cm was narrowly rejected with p-values of 0.0529 and 0.0562, respectively. All significant models showed a gentle decrease in density with increasing light intensities (i.e., negative correlation). In general, the effect of light conditions on the density of Norway spruce juveniles was found to be very weak and limited; when a relationship was found, it occurred only for juveniles up to 1 m in height.
3.2. General Morphological Patterns of Juveniles under Size-Independent Evaluation
3.2.1. Height Growth
A significant relationship between light intensities and relative height was established for all five light or canopy openness variables. Moreover, all of the discovered models were highly significant (p < 0.001), and their significance was proven to be robust against negative influences by the significance of the Spearman correlation coefficient (Table 5). Relative height growth (RHG) increased moderately with increasing low light intensities; the increment became progressive with approximately 20% of the light intensity of open area conditions. This means the terminal length related to total height was higher in high light intensities. A comparison of RHG and the apical dominance ratio (ADR) is stated below (see Section 3.2.2) and visualized in Figure 2A. Parameter H was not found to significantly correlate with light intensities.
3.2.2. Lateral Crown Growth
The apical dominance ratio was significantly influenced by light intensities for all five light or canopy openness variables (p < 0.01). Moreover, all five regression models were proven to be robust against negative influences by the significance of the Spearman correlation coefficient (Table 5). For all five regression models, a positive correlation was observed when ADR was increasing with light intensity. This means the terminal length increased under higher light intensities while the lateral growth was slower. In low light intensities, lateral growth prevailed, and the annual height increment was suppressed. ADR, comprising both branch length (Bl) and terminal length (Tl) and thus expressing shifts within the level of height increment and lateral growth, was shown to be a suitable index for observation of this phenomenon. When considering only lateral growth expressed by relative crown width (RCW) within such a large gradient of juvenile dimensions (although H was the denominator for RCW), no significant correlation with light intensities was found.
In addition, changes within both RHG and ADR along the light gradient were reasonably similar. When the ranges of median values of sub-plots were compared, RHG was found to range within 15.2 times (the ratio of the highest median value of the sub-plot to the smallest median value of the sub-plot), while the same approach showed a range of 23.3 times for ADR. However, when all sets of juveniles were compared, the range was much wider and represented approximately 68 times and 131 times for RHG and ADR, respectively. In addition, the visualization of both indexes was performed (Figure 2A) on the largest research plot, Drtič (A). This demonstrated a similar rate of photo-morphological acclimations for both indexes. The same positive correlation of both ADR and RHG was also confirmed by RDA, which showed a similar level of effect of both DSF and ISF (i.e., direct and indirect components of light (Figure 3)).
3.2.3. Relative Crown Length
A significant positive correlation between light intensities and relative crown length (RCL) was established for all five light or canopy openness variables. All of the models were highly significant (p < 0.001), and their significance was proven to be robust against negative influences by the significance of the Spearman correlation coefficient (Table 5). RCL increased with light intensities, which proved the ability of Norway spruce juveniles to reduce crown length under low light intensity. The range of photo-plasticity of this index was lower compared to both RHG and ADR when within the comparison of median values of sub-plots (the highest median value of sub-plot/the smallest median value of sub-plot); the range was a multiple of 4.3 (when the whole set of juveniles was investigated, the range was a multiple of approximately 6.3). The variation of RCL within the largest research plot (A) is shown in Figure 2B. Within the RDA analysis, huge similarities were found between the effects of DSF and ISF on RCL, RHG, and ADR (Figure 3).
3.2.4. Regeneration Index—RI
A significant positive correlation between the regeneration index (RI; RI = the number of individuals × median of the height) and three variables (GFr, Op, ISF) was established. For those three regression models, a high level of significance was found (p < 0.001), and the significance of the Spearman correlation coefficient was shown for all three (Table 5). However, when both DSF and TSF were tested, no significant influence was revealed.
This means that if dimension was not considered, the density of natural regeneration weakly correlated with light conditions within a limited range of its height (maximally up to 1 m (see Section 3.1)). However, when RI was tested, significance was proven. In addition, the common density (pieces/m2) negatively correlated with light conditions (albeit poorly), while the regeneration index (cm/m2) correlated positively. This shows the fundamental importance of regeneration height within the regeneration index. The total height (and other parameters or indexes expressing the height growth) correlated positively with light in this study as well. Furthermore, based on the RDA, a positive correlation of RI with light intensity can also be concluded (Figure 3).
3.2.5. Stem Diameter
Statistical analyses did not prove the effect of light intensities on the thickness of the stem when diameter (D) did not correlate with light intensities. Moreover, no significant influence of light intensities was found on the height–diameter ratio (HDR) where D is included as a denominator (when H alone was also not found to significantly correlate with light intensities in this general approach of size-independent evaluation).
3.3. Morphological Patterns of Juveniles under Size-Dependent Evaluation
3.3.1. Height Growth
Terminal length (Tl) and total height (H) were tested, and significant regression models for both were established with a positive correlation between height growth and light intensities. The Tl was more dependent on light intensities; it was significantly influenced by light in three height classes (10–50 cm, 51–100 cm, >151 cm) (Table A2 in Appendix A). By contrast, total height was significantly correlated only with light intensities in the tallest height class (>151 cm) (Table A2 in Appendix A). A distinctive effect of light on Tl was found within the smallest height class (10–50 cm), where it significantly correlated with four variables of light (GFr, Op, ISF, TSF) with a high level of significance (p < 0.01).
3.3.2. Lateral Crown Growth
To observe morphological development at the level of crown lateral growth, three parameters (branch length (Bl), crown width 1 (CW1), crown width 2 (CW2)) and three indexes (relative crown width (RCW), crown projection (CP), index of spatial distribution (ISD)) were tested. All of them were significantly correlated with light conditions within observed height classes (Table A3 in Appendix A). In general, all observed parameters and indexes (where crown width was situated as a numerator within indexes) demonstrated a strong negative correlation with light intensities that expressed an initiation of the lateral growth under low light and its suppression under high light. The parameters Bl and CW1 and the index CP were correlated with light intensities only in two cases each (throughout the whole gradient of height classes), and thus they were rarely correlated with light compared to other observed parameters and indexes of lateral crown growth. This significance was established for all three in height classes 51–100 cm and 101–150 cm. For a similar range of natural regeneration (height ranging from 51 to 150 cm), the correlation of CW2 was also proven; however, four regression models were proven for this parameter. The ISD significantly correlated with light conditions only when the highest class of juveniles was considered (>151 cm); however, for this height class, the correlation was proven by three significant regression models. The highest level of correlation was demonstrated by RCW, as eight significant regression models were proven for this index, which was correlated with light conditions within a wide range of dimensions—for juveniles taller than 51 cm, in particular (i.e., the height classes 51–100, 101–150, and >151 cm). This index was especially appropriate for the tallest juveniles (height class >151 cm), where four significant regression models were found.
These results clearly demonstrate that photo-morphological plasticity at the level of the lateral growth of the crown has not yet developed within the smallest height class (10–50 cm) of Norway spruce natural regeneration. In this height class, no significant influence of light conditions on observed parameters and indexes of the lateral crown growth was established.
3.3.3. Relative Crown Length and General Shape of the Crown
The number of established regression models that covered all observed height classes showed the highest capability to acclimation at the level of crown length and general crown shape. Cl and RCL were shown to be correlated with light intensities within three height classes (10–50 cm, 51–100 cm, >151 cm) through 8 and 10 significant regression models, respectively. The correlation of CWLR was demonstrated within all four height classes through 16 significant regression models. Since Cl was a parameter and RCL an index where the crown length was situated as a numerator of the index, both showed the same trend within the light gradient. Thus, the crown length was positively correlated with light intensities, which means it was suppressed under low light and enhanced under high light. Compared to the photo-morphological plasticity of lateral growth that was not found within the smallest dimension of juveniles of 10–50 cm (see Section 3.3.2), the photo-plasticity of the crown length was shown even in this initial stage of the natural regeneration. In particular, RCL was frequently found to be significantly affected by light intensities (five regression models) in the smallest height class. Furthermore, three models both for Cl and CWLR were also proven for the smallest juveniles (Table A4 in Appendix A).
CWLR, which aggregated both the lateral growth of the crown and its length, showed particular importance—it expressed the general shape of the crown. CWLR highly correlated with light intensities as 16 significant regression models through all dimensions of juveniles were proven (Table A4 in Appendix A). The lateral growth was situated as a numerator and the crown length as a denominator within the index; CWLR demonstrated a significantly negative correlation with light intensities (when the lateral growth alone demonstrated the same negative correlation while the crown length exhibited a positive correlation). This means that under low light intensities, juveniles were creating umbrella-shaped crowns (i.e., a high value of CWLR) through an acceleration of the lateral growth and shortening of the crown length. An exception was seen in this pattern only within the smallest juveniles (10–50 cm) where the CWLR changes were created through crown length acclimations. This was due to a lack of significant photo-plasticity in the lateral growth found for the smallest juveniles (see Section 3.3.2), while the acclimations of crown length within the smallest height class were broadly demonstrated by the significant plasticity of both Cl and RCL.
3.3.4. Stem Diameter and Height–Diameter Ratio
A significant relation between light intensities and D within all observed height classes was not established, fully proving previous findings of no relation of this natural regeneration parameter on light (see Section 3.2). However, while no effect of light intensities on HDR was found within general evaluation (under size-independent evaluation), these analyses showed the effect of the light on HDR in three height classes (Table A5 in Appendix A). No relationship between light and HDR was found in the smallest height class (10–50 cm), while the most distinctive relationship was found for the tallest height class (˃151 cm). This finding clearly confirms the correlation of total height (H) and light intensities which was shown for the same height class (˃ 151 cm), while within other height classes the correlation of the H and the light was missing and was represented (within the height growth) through a distinctive correlation of Tl (see Section 3.3.1). In general, regardless of particular parameters or indexes, height growth was clearly correlated with light conditions. There was no correlation between stem diameter in this or other analyses. Thus, these proven relations between HDR and light conditions took place through acclimations of the H to light intensities while D remained unchanged throughout the changing light gradient. This was confirmed by a positive correlation between HDR and light when all significant regression models exhibited an increment in HDR with the increment in light. This shows the same trend of correlation as with height growth.
3.3.5. Crown Volume
No effect of light intensities on the crown volume was found regardless of which algorithm for the crown volume calculation was used for the testing (crown volume according to equilateral cone or crown volume according to quadratic paraboloid).
4. Discussion
Other authors have established the same positive correlation between light conditions and height growth of Norway spruce natural regeneration [19,45]. The lower correlation of total height (H) compared to the terminal length (Tl) can be explained in that the response of height growth to particular light conditions is not immediate. On the contrary, it takes time from when the height growth is again in full compliance with light conditions, as has been established by Nilson and Lundqvist (2001) [46], Robakowski et al. (2004) [41], and Chrimes and Nilson (2005) [19]. This is in compliance with the results of Diaci and Firm (2011) [3], who demonstrated a significant correlation between Tl and light intensity both for Norway spruce and silver fir (Abies alba Mill.) seedlings, but did not find a significant correlation with H. Tl has a higher probability of being adaptive to current light conditions, while H reflects the history of height growth through changing light conditions. Although light conditions were reasonably stable for a long time (at least for 15 years or more) in this study, some changes did occur (due to overstory growth and overstory canopy development). A similar situation can be concluded for the index RHG, as RHG plasticity was more carried out through Tl changes than H changes. The parameter of Tl was also proven by Jaloviar et al. (2013) [16] as being associated with light intensities both for Norway spruce natural regeneration and silver fir underplantings. By contrast, they found no significant effect of light on the RHG of either tree species [16].
A high level of photo-morphological plasticity in this study was found for lateral crown growth. However, within the evaluation involving height classes, none of those adaptations (at the level of parameters Bl, CW1, and CW2 or indexes RCW, CP, and ISD) were employed in the smallest height class (10–50 cm). Similar results were established by Duchesneau et al. (2001) [37] for balsam fir (Abies balsamea (L.) Mill.) when they found a generally higher level of correlations of morphological plasticity and light for the height class of 100–200 cm compared to the height class of 50–100 cm. Similar findings were confirmed for other conifer shade-tolerant tree species [28,44]. However, a continual photo-morphological acclimation through a gradient of the dimension of natural regeneration can be limited, because as Wright et al. (1998) [15] found, a height of 6 m can be a threshold for many different tree species when the described trend starts to weaken or even disappears.
It was widely established that the plasticity of crown morphology plays a key role in the adaptation ability to survive under a wide range of light intensities, and thus this feature is uniquely distinctive for shade-tolerant tree species [12,13,47,48]. Crown morphology has a crucial effect on light use efficiency and thus on the competitive strength of an individual [44,48,49,50]. This competitiveness within natural regeneration can increase if light availability becomes limiting due to overstory shelter and can vary according to the ratio of diffuse and direct light in understory microsites [8]. Consequently, shade-tolerant tree species have the ability to adapt their growth just through acclimations via photo-morphological plasticity of the crown, shoots, and needles or leaves [51,52]. Thus, shade-tolerant conifer tree species crown morphology varies from conical under high light conditions to umbrella-shaped under low light conditions [18,53,54]. This morphological development consists of acclimations via a reduction in height growth and crown length [29,55] and initiation of crown lateral growth to maximize carbon gain under shade [41,54,56]. In addition, the described pattern is aimed at reducing self-shading within the crown [18,55,57]. As light intensities increase, height increment is initiated, making the light more available for the lowest whorls, which initiates the establishment of a continual conical-shaped crown [58]. Acclimation ability (expressed as different increment allocation patterns resulting in different architecture) varies between tree species and plays a key role in photosynthetic efficiency (essential under low light conditions) and thus offers a competitive advantage to particular tree species [22,28,49,52].
Within the 10–50 cm height class, juveniles invest in vertical growth (proven significant correlation of Tl and light) to reach the best social position through height increment with no lateral crown growth having yet taken place. However, to optimize increment allocation (i.e., carbon gain) and to avoid self-shading, the ability to reduce crown length is already fully developed even in this early stage of natural regeneration (broadly proven by significant correlations of Cl, RCL, and CWLR). As Takahashi (1996) [43] stated, the whole process is a balance between investment into height growth to reach future profit and investment into surviving when the current total height is preserved, as is broadly shown in other studies [18,22,29,41]. Although the index CWLR integrates both lateral crown growth and crown length, it significantly correlates with light. This takes place through morphological acclimation of crown length and can be concluded from the established plasticity of both Cl and RCL in the smallest height class when no proof of morphological plasticity for lateral crown growth was found. The two described patterns of photo-morphological acclimations (height growth and crown length) were also present in juveniles taller than 51 cm when the ability to employ photo-morphological acclimations to crown lateral growth was supplemented.
As a consequence, other studies considered both ADR and RCL as indexes for expressing the level of shade tolerance, and deducing the light intensities under which juvenile shade-tolerant trees have been growing [29,41].
The crown length is considered the essential photo-morphological characteristic for distinguishing between shade tolerance and semi-tolerance, since an absence of this acclimation for shade semi-tolerant tree species, such as eastern white pine (Pinus strobus L.), has been shown [27,44,55].
Our finding of the correlation between HDR and light verified the classification of Norway spruce as a shade-tolerant tree species because this level of plasticity is also considered a typical ability of shade-tolerant tree species [59] and is absent in shade semi-tolerant tree species [27,44]. Although we did not prove a significant correlation between HDR and light conditions in the general evaluation, it was established for juveniles taller than 51 cm when evaluated according to height classes.
Thus, only the initial stage of natural regeneration did not exhibit acclimation of HDR, whereas a correlation of HDR with all observed light variables for the highest stratum of natural regeneration (height class >151 cm) was established. The observed plasticity of HDR was created through acclimations of height growth when stem thickness was not related to light intensities. No correlation between D and light can be explained by intense intraspecific competition within natural regeneration. To some extent, the increment is invested into height growth to reach a favorable position in relation to neighboring trees. To a greater extent, it is invested into adaptations of the crown to make photosynthesis under shade as effective as possible to reach a high probability of survival [18,43,58] while investment into stem radial growth is reduced and affected by the density of juveniles. In such conditions of dense natural regeneration, the intraspecific competition was a critical factor when compared to the results of Coates and Burton (1999) [60], who established the significant influence of light on D for five different conifer tree species five years after planting. It is clear that in young planted seedlings, competition was substantially lower compared to natural regeneration in our study. Furthermore, the crucial influence of density on D was also described by Chrimes and Nilson (2005) [19], as well as Petritan et al. (2012) [61], who established the significance of this finding for conifers rather than broadleaf species. Thus, the correlation of stem radial increment and light intensities is fully revoked when intraspecific (or interspecific) competition appears; only the pattern of height growth and its dependency on light remains. Consequently, HDR plasticity, fully arranged through height growth plasticity, occurs. This also confirmed the finding of the independence of D on light intensities in the natural regeneration of other conifers, as Kučeravá et al. (2012) [62] found the same for silver fir and Claveau et al. (2002) [44] observed the same for four conifer species from a group of five. On the other hand, in this study, only D was tested when there were no available data about radial increment. Radial increment can be more sensitive to certain light conditions, as was established by Duchesneau et al. (2001) [37] for balsam fir or Greis and Kellomäki (1981) [63] for Norway spruce.
This study established only a weak relationship between regeneration density and light. Lunquist and Fridman (1996) [36] and Hasenauer and Kindermann (2002) [64] also did not find a correlation between Norway spruce regeneration density and the basal area of the overstory. Similarly, Szewczyk and Szwagrzyk (2010) [65] did not find a correlation for Norway spruce either, while for silver fir, they found a significant correlation. Jaduď et al. (2014) [66], who evaluated the influence of light intensity on the density of seedlings after directseeding (using the same amount of seeds within various treatments), found no correlation between light intensities and density for Norway spruce or silver fir. We established that there was a fragile relationship for natural regeneration up to a maximum of 1 m in height, which corresponds well with the findings of Roženbergar et al. (2007) [67]. They did not find a significant correlation between light and the density of silver fir and observed a continual decrease in its density with its increasing height until a height of 110 cm when density developed asymptotically to axis x. Thus, the height of approximately 1 m can work as a general threshold when the (intraspecific) competition (resulting to autoreduction) starts to dominate, and the influence of light (which slightly affects the density of juveniles up to 1 m and is reflected in height growth as well) is retracted. By contrast, the regeneration index (RI) where dimension was considered was significantly correlated with light in this study, which was confirmed by Grassi et al. (2004) [68] both for Norway spruce and silver fir. The importance of dimension (height) on the development of density has been clearly demonstrated. Furthermore, the importance of microclimates in microsites is an important factor, as shown by Kupferschmid and Bugmann (2005) [69], Hunziker and Brang (2005) [70], and Kathke and Bruelheide (2010) [71]. More studies focused on the complex mechanisms of various factors affecting Norway spruce natural regeneration density should be conducted in the future.
5. Conclusions
The results of our research indicate that Norway spruce juveniles have immense photo-morphological plasticity in lateral crown growth, crown length, and height growth. The ranges of plasticity (expressed by the maximal and minimal values of RHG and ADR) for height growth and crown lateral growth acclimated to light conditions to a similar extent. However, the plasticity of lateral crown growth was absent in the smallest height class (10–50 cm). The capability for acclimations in crown length was established robustly throughout the whole range of natural regeneration dimensions. HDR showed a significant positive correlation with light intensities for juveniles from 51 cm in height. This shows the positive impact of overstory shelter on the mechanical stability of juveniles (making the HDR value smaller due to the shade of the overstory shelter) and is a representative example of nature’s automation (also known as biological automation) principles in tending in young forest stands. However, this means that when the overstory canopy is intensively opened (or even removed) by silvicultural intervention or by disturbance, the risk of mechanical lability of Norway spruce understory will occur if no further tending is applied in this natural regeneration.
The existence and intensity of photo-morphological acclimations firmly established Norway spruce as a shade-tolerant species. Thus, light conditions in the forest stand understory (which can be easily influenced by silvicultural techniques aimed at the forest stand overstory) can effectively encourage forest stand structural heterogeneity as Norway spruce juveniles follow light conditions with their growth. Moreover, through the use of appropriate silviculture techniques, it is possible to take full control of the growth vigor of Norway spruce juveniles. This can be effectively used for the transformation of Norway spruce monocultures to uneven-aged mixed stands, once it is deemed appropriate for Norway spruce to be one of the species in the future species composition of the forest stand. For such silviculture practice, two main growth regimes can be generally distinguished: suppressed and enhanced. These regimes are not distinguished by distinct thresholds but can be found at the level of ca. 0.2 TSF. From this intensity, both RHG and ADR progressively increase, whereas until ca. 0.15 TSF they very slightly increase with light (RCL increases constantly with TSF within the whole range). When it is required to suppress the vigor of Norway spruce juveniles (e.g., the target being to encourage advanced artificial regeneration of reintroduced tree species during Norway spruce monoculture transformation), light intensity should not exceed this threshold by too much (to support reintroduced species). When Norway spruce is to be encouraged to reach advanced growing stages earlier, the light intensity should be over 0.2 TSF. However, regardless of these two main growth regimes, the growing response to different light conditions is continual after the threshold is exceeded, and therefore the encouraged heterogeneity of the overstory canopy openness leads to high growth diversity and also a high structure of Norway spruce regeneration. Therefore, variability of patches of overstory canopy created by a combination of sections with a closed canopy, mid-open canopy, and small gaps can be favorable for this purpose. Regeneration density did not correlate well with light intensities (and if some weak trends were found, they demonstrated a negative correlation with light). These results demonstrated that the regeneration establishment is more an issue of appropriate forest microclimate, where perhaps both temperature and humidity regimes play key roles and light is the further additional variable, which indicates that a shelter-wood cut can be more favorable for regeneration establishment than the creation of gaps. And after it reaches certain growing stage of about 1 m in height, intraspecific competition and autoreduction start to be driving forces of its density.
Supplementary Materials
The following supporting information can be downloaded at: https://www.mdpi.com/article/10.3390/f13111804/s1. Figure S1.
Author Contributions
Conceptualization, P.B.; idea, P.B. and J.S.; methodology, P.B.; investigation, P.B.; measurements, P.B. and J.Č.; data acquisition, P.B.; data curation, P.B. and J.Č.; data processing, P.B.; data analysis, P.B.; formal analysis, P.B.; interpretation of results, P.B.; validation, P.B.; visualization P.B. and J.K.; supervision, P.B.; funding acquisition, P.B.; funding administration, P.B.; writing—original draft, P.B.; writing—reviewing & editing, J.K., J.Č. and J.S. All authors have read and agreed to the published version of the manuscript.
Funding
This research was funded by the Ministry of Agriculture of the Czech Republic, institutional support MZE-RO0118, and by National Agency for Agricultural Research (NAZV)—project number NAZV QK1810443 “Methods for minimization of damage caused by wind and snow in forests stands in connection with climate change”.
Data Availability Statement
The data presented in this study are available on request from the corresponding author.
Acknowledgments
We thank our practical forestry colleagues, namely František Slavíček, Jiří Bína, and Petr Bednář, who were involved in this research activity and research plot establishment. We thank Estelle Noyer for valuable help and Padraig O’Tuama for his language corrections and for text comments. We thank Lena Macrie Hunt for her very valuable help with language correction and with text improvements and comments. We thank technicians Luboš Janáček; Jan Škareda and Petr Smutný for helping us with fieldwork. We thank the two anonymous reviewers for their valuable reviews, comments, and recommendations.
Conflicts of Interest
The authors declare no conflict of interest. The funders had no role in the design of the study; in the collection, analyses, or interpretation of data; in the writing of the manuscript; or in the decision to publish the results.
Appendix A
Table A1.
Significant regression models of Norway spruce natural regeneration density and light intensities.
Table A1.
Significant regression models of Norway spruce natural regeneration density and light intensities.
| Variable (x) | Height up to (cm) | Equation; DEN (No. of Juveniles/m2) | R2 | p | rs |
|---|---|---|---|---|---|
| DSF | 30 | DEN = 16.5597 − 71.5915 × x + 91.067 × x2 | 0.09 | 0.0334 * | −0.0786 NS |
| 40 | DEN = 14.2696 − 42.8019 × x + 39.1018 × x2 | 0.06 | 0.0366 * | −0.0826 NS | |
| 50 | DEN = 15.5823 − 46.297 × x + 38.3294 × x2 | 0.07 | 0.0145 * | −0.1196 NS | |
| 60 | DEN = 12.6875 − 12.4916 × x − 25.0481 × x2 | 0.04 | 0.0464 * | −0.0804 NS | |
| 70 | DEN = 13.5962 − 20.4831 × x − 11.5114 × x2 | 0.05 | 0.0257 * | −0.0858 NS | |
| 100 | DEN = 12.4144 + 8.674 × x − 71.9446 × x2 | 0.04 | 0.0419 * | −0.0830 NS | |
| TSF | 30 | DEN = 16.9492 − 72.669 × x + 91.9606 × x2 | 0.09 | 0.0334 * | −0.0546 NS |
| 40 | DEN = 14.3836 − 42.0798 × x + 36.6371 × x2 | 0.06 | 0.0423 * | −0.0878 NS | |
| 50 | DEN = 15.2769 − 41.107 × x + 26.4127 × x2 | 0.06 | 0.0193 * | −0.0937 NS | |
| 70 | DEN = 13.33 − 16.5955 × x − 20.0969x2 | 0.04 | 0.0367 * | −0.0679 NS |
Note: DEN: total density of all juveniles regardless of their height (pieces/m2); DSF: direct site factor; ISF: indirect site factor; TSF: total site factor; p < 0.05 (*), p ˃ 0.05 (NS).
Table A2.
Significantly proved regression models of light intensities and morphological parameters expressing height growth of Norway spruce natural regeneration under size-dependent evaluation.
Table A2.
Significantly proved regression models of light intensities and morphological parameters expressing height growth of Norway spruce natural regeneration under size-dependent evaluation.
| Height Class | Regression Model | Variable (x) | R2 | p | rs |
|---|---|---|---|---|---|
| 10–50 cm | Tl = 3.5544 − 0.2377 × x + 0.009 × x2 | GFr | 0.18 | 0.0001 *** | 0.4052 * |
| 10–50 cm | Tl = 3.4941 − 0.2304 × x + 0.0088 × x2 | Op | 0.18 | 0.0001 *** | 0.4020 * |
| 10–50 cm | Tl = 3.458 − 20.8439 × x + 72.033 × x2 | ISF | 0.22 | 0.0000 *** | 0.4187 * |
| 10–50 cm | Tl = 1.9048 + 5.5023 × x + 0.4773 × x2 | TSF | 0.06 | 0.0059 ** | 0.1944 * |
| 51–100 cm | Tl = 9.7984 − 48.9895 × x + 151.7929 × x2 | ISF | 0.09 | 0.0275 * | 0.3180 * |
| 51–100 cm | Tl = 8.1192 − 17.2793 × x + 73.168 × x2 | TSF | 0.08 | 0.0469 * | 0.2650 * |
| ˃151 cm | Tl = 17.7294 − 90.283 × x + 356.3486 × x2 | DSF | 0.48 | 0.0001 *** | 0.5342 * |
| ˃151 cm | Tl = −0.6218 + 46.0722 × x + 41.9031 × x2 | ISF | 0.14 | 0.0363 * | 0.4228 * |
| ˃151 cm | Tl = 21.1318 − 126.4246 × x + 439.5598 × x2 | TSF | 0.48 | 0.0001 *** | 0.5471 * |
| ˃151 cm | H = 20.712 + 1827.4301 × x − 3017.8096 × x2 | DSF | 0.21 | 0.0139 * | 0.4374 * |
| ˃151 cm | H = −68.8182 + 2527.9261 × x − 4391.4594 × x2 | TSF | 0.22 | 0.0134 * | 0.4194 * |
Note: Tl: terminal length (cm); H: total height (cm); GFr: gap fraction; Op: canopy openness; DSF: direct site factor; ISF: indirect site factor; TSF: total site factor; p < 0.05 (*), p < 0.01 (**), p < 0.001 (***).
Table A3.
Significantly proved regression models of light intensities and morphological parameters and indexes expressing lateral growth of Norway spruce natural regeneration under size-dependent evaluation.
Table A3.
Significantly proved regression models of light intensities and morphological parameters and indexes expressing lateral growth of Norway spruce natural regeneration under size-dependent evaluation.
| Height Class | Regression Model | Variable (x) | R2 | p | rs |
|---|---|---|---|---|---|
| 51–100 cm | Bl = 19.2155 + 228.5272 × x − 540.4043 × x2 | ISF | 0.11 | 0.0256 * | −0.3692 * |
| 51–100 cm | CW1 = 34.4871 + 408.7886 × x − 978.2429 × x2 | ISF | 0.13 | 0.0124 * | −0.4541 * |
| 51–100 cm | CW2 = 76.9358 − 0.3667 × x − 0.0132 × x2 | GFr | 0.09 | 0.0266 * | −0.3917 * |
| 51–100 cm | CW2 = 79.166 − 0.5299 × x − 0.01 × x2 | Op | 0.09 | 0.0235 * | −0.3987 * |
| 51–100 cm | CW2 = 59.6086 + 102.3799 × x − 358.9949 × x2 | ISF | 0.11 | 0.0124 * | −0.4040 * |
| 51–100 cm | RCW = 1.8688 − 0.051 × x + 0.0006 × x2 | GFr | 0.26 | 0.0001 *** | −0.5712 * |
| 51–100 cm | RCW = 1.9707 − 0.0579 × x + 0.0007 × x2 | Op | 0.28 | 0.0000 *** | −0.6031 * |
| 51–100 cm | RCW = 1.8489 − 4.0591 × x + 3.2983 × x2 | ISF | 0.37 | 0.0000 *** | −0.6643 * |
| 51–100 cm | CP = 672.2795 + 33124.752 × x − 80280.9727 × x2 | ISF | 0.12 | 0.0182 * | −0.4297 * |
| 101–150 cm | Bl = 561.0136 − 3200.0795 × x + 5035.5044 × x2 | ISF | 0.59 | 0.0193 * | −0.5000 NS |
| 101–150 cm | CW1 = 640.0183 − 3323.1949 × x + 5071.6685 × x2 | ISF | 0.48 | 0.0331 * | −0.5091 NS |
| 101–150 cm | CW2 = 645.9867 − 3606.0909 × x + 5750.5151 × x2 | ISF | 0.59 | 0.0251 * | −0.4455 NS |
| 101–150 cm | RCW = 6.4675 − 36.6654 × x + 58.6871 × x2 | ISF | 0.71 | 0.0120 * | −0.4727 NS |
| 101–150 cm | CP = 1.0569 × 10⁵ − 6.2668 × 10⁵ × x + 9.8709 × 10⁵ × x2 | ISF | 0.61 | 0.0180 * | −0.5000 NS |
| ˃151 cm | RCW = 3.6175 − 0.2223 × x + 0.0042 × x2 | Op | 0.18 | 0.0409 * | −0.5015 * |
| ˃151 cm | RCW = 1.0578 − 1.698 × x + 0.336 × x2 | DSF | 0.55 | 0.0000 *** | −0.7449 * |
| ˃151 cm | RCW = 1.6269 − 4.1525 × x + 3.1664 × x2 | ISF | 0.29 | 0.0014 ** | −0.5806 * |
| ˃151 cm | RCW = 1.129 − 2.0758 × x + 0.8032 × x2 | TSF | 0.56 | 0.0000 *** | −0.7423 * |
| ˃151 cm | ISD = 5.5782 − 5.3475 × x − 2.0348 × x2 | DSF | 0.32 | 0.0008 *** | −0.5711 * |
| ˃151 cm | ISD = 10.0399 − 32.7416 × x + 44.103 × x2 | ISF | 0.16 | 0.0267 * | −0.4280 * |
| ˃151 cm | ISD = 5.9229 − 7.584 × x + 1.7462 × x2 | TSF | 0.32 | 0.0008 *** | −0.5583 * |
Note: Bl: branch length (cm); CW1: crown width 1; CW2: crown width 2; RCW: relative crown length; CP: crown projection (cm2); ISD: index of spatial distribution; GFr: gap fraction; Op: canopy openness; DSF: direct site factor; ISF: indirect site factor; TSF: total site factor; p < 0.05 (*), p < 0.01 (**), p < 0.001 (***); p ˃ 0.05 (NS).
Table A4.
Significantly proved regression models of light intensities and morphological parameters and indexes expressing the crown length of Norway spruce natural regeneration under size-dependent evaluation.
Table A4.
Significantly proved regression models of light intensities and morphological parameters and indexes expressing the crown length of Norway spruce natural regeneration under size-dependent evaluation.
| Height Class | Regression Model | Variable (x) | R2 | p | rs |
|---|---|---|---|---|---|
| 10–50 cm | RCL = 0.5913 − 0.0065 × x + 0.0003 × x2 | GFr | 0.08 | 0.0051 ** | 0.3511 * |
| 10–50 cm | RCL = 0.5899 − 0.0063 × x + 0.0003 × x2 | Op | 0.08 | 0.0046 ** | 0.3528 * |
| 10–50 cm | RCL = 0.5333 + 0.4538 × x − 0.304 × x2 | DSF | 0.05 | 0.0122 * | 0.2499 * |
| 10–50 cm | RCL = 0.5936 − 0.549 × x + 2.2822 × x2 | ISF | 0.08 | 0.0051 ** | 0.3372 * |
| 10–50 cm | RCL = 0.5244 + 0.4743 × x − 0.2612 × x2 | TSF | 0.06 | 0.0084 ** | 0.2685 * |
| 10–50 cm | CWLR = 1.1184 + 0.0573 × x − 0.0019 × x2 | GFr | 0.06 | 0.0455 * | −0.2854 * |
| 10–50 cm | CWLR = 1.1229 + 0.0563 × x − 0.0018 × x2 | Op | 0.06 | 0.0436 * | −0.2899 * |
| 10–50 cm | CWLR = 1.1199 + 4.9663 × x − 14.5085 × x2 | ISF | 0.07 | 0.0447 * | −0.2868 * |
| 10–50 cm | Cl = 12.868 − 0.1274 × x + 0.0082 × x2 | GFr | 0.04 | 0.0409 * | 0.2121 * |
| 10–50 cm | Cl = 12.7175 − 0.1159 × x + 0.008 × x2 | Op | 0.04 | 0.0354 * | 0.2149 * |
| 10–50 cm | Cl = 12.7194 − 11.4916 × x + 68.5436 × x2 | ISF | 0.05 | 0.0195 * | 0.2264 * |
| 51–100 cm | CWLR = 2.6967 − 0.0429 × x − 0.0001 × x2 | GFr | 0.14 | 0.0041 ** | −0.5547 * |
| 51–100 cm | CWLR = 2.8315 − 0.0496 × x − 6.3876 × 10⁻⁵ × x2 | Op | 0.16 | 0.0018 ** | −0.5969 * |
| 51–100 cm | CWLR = 1.9634 − 2.0859 × x + 0.6197 × x2 | DSF | 0.08 | 0.0341 * | −0.3290 * |
| 51–100 cm | CWLR = 2.2819 + 0.6117 × x − 11.3368 × x2 | ISF | 0.26 | 0.0001 *** | −0.6968 * |
| 51–100 cm | CWLR = 2.2373 − 3.9869 × x + 3.5742 × x2 | TSF | 0.10 | 0.0180 * | −0.3747 * |
| 51–100 cm | RCL = 0.5197 + 0.9095 × x − 0.897 × x2 | DSF | 0.08 | 0.0331 * | 0.2753 * |
| 51–100 cm | RCL = 0.8403 − 2.2948 × x + 5.8313 × x2 | ISF | 0.11 | 0.0181 * | 0.3168 * |
| 51–100 cm | RCL = 0.4589 + 1.3188 × x − 1.5389 × x2 | TSF | 0.10 | 0.0247 * | 0.2902 * |
| 51–100 cm | Cl = 41.4323 − 29.6034 × x + 180.7043 × x2 | DSF | 0.14 | 0.0065 ** | 0.2624 * |
| 51–100 cm | Cl = 12.3012 + 155.6449 × x − 143.2971 × x2 | ISF | 0.07 | 0.0449 * | 0.2665 * |
| 51–100 cm | Cl = 38.9685 − 14.9096 × x + 162.9465 × x2 | TSF | 0.14 | 0.0053 ** | 0.2773 * |
| 101–150 cm | CWLR = 13.8824 − 0.8997 × x + 0.0157 × x2 | GFr | 0.58 | 0.0322 * | −0.4182 NS |
| 101–150 cm | CWLR = 15.3481 − 1.0121 × x + 0.0178 × x2 | Op | 0.60 | 0.0292 * | −0.4364 NS |
| 101–150 cm | CWLR = 10.3003 − 56.1753 × x + 84.8293 × x2 | ISF | 0.62 | 0.0087 ** | −0.5546 NS |
| ˃151 cm | CWLR = 6.399 − 0.397 × x + 0.0072 × x2 | GFr | 0.34 | 0.0013 ** | −0.6320 * |
| ˃151 cm | CWLR = 6.1167 − 0.3702 × x + 0.0066 × x2 | Op | 0.33 | 0.0014 ** | −0.6173 * |
| ˃151 cm | CWLR = 1.8672 − 5.1136 × x + 5.0869 × x2 | DSF | 0.62 | 0.0000 *** | −0.7537 * |
| ˃151 cm | CWLR = 2.3706 − 4.9823 × x + 0.7249 × x2 | ISF | 0.30 | 0.0012 ** | −0.5762 * |
| ˃151 cm | CWLR = 2.0488 − 6.1746 × x + 6.5934 × x2 | TSF | 0.63 | 0.0000 *** | −0.7665 * |
| ˃151 cm | RCL = 0.2823 + 0.0178 × x + 1.239 × 10⁻⁵ × x2 | GFr | 0.19 | 0.0119 * | 0.4051 * |
| 151 cm + | RCL = 0.189 + 0.0264 × x − 0.0002 × x2 | Op | 0.17 | 0.0206 * | 0.3589 * |
| ˃151 cm | Cl = −14.4542 + 1462.7692 × x − 2300.0565 × x2 | DSF | 0.30 | 0.0022 ** | 0.5230 * |
| ˃151 cm | Cl = −83.1842 + 1988.695 × x − 3314.3855 × x2 | TSF | 0.30 | 0.0022 ** | 0.5171 * |
Note: Cl: crown length (cm); RCL: relative crown length; CWLR: crown width–length ratio; GFr: gap fraction; Op: canopy openness; DSF: direct site factor; ISF: indirect site factor; TSF: total site factor; p < 0.05 (*), p < 0.01 (**), p < 0.001 (***); p ˃ 0.05 (NS).
Table A5.
Significantly proved regression models of light intensities and the height–diameter ratio of Norway spruce natural regeneration under size-dependent evaluation.
Table A5.
Significantly proved regression models of light intensities and the height–diameter ratio of Norway spruce natural regeneration under size-dependent evaluation.
| Height Class | Regression Model | Variable (x) | R2 | p | rs |
|---|---|---|---|---|---|
| 51–100 cm | HDR = 4.7679 + 0.0172 × x + 0.0018 × x2 | GFr | 0.13 | 0.0054 ** | 0.4334 * |
| 51–100 cm | HDR = 3.9528 + 0.0839 × x + 0.0004 × x2 | Op | 0.14 | 0.0045 ** | 0.4442 * |
| 51–100 cm | HDR = 3.6928 + 9.0674 × x + 1.4289 × x2 | ISF | 0.17 | 0.0015 ** | 0.4481 * |
| 101–150 cm | HDR = −31.7919 + 253.2491 × x − 414.6227 × x2 | ISF | 0.65 | 0.0400 * | 0.3091 NS |
| ˃151 cm | HDR = −2.9996 + 0.6657 × x − 0.0117 × x2 | GFr | 0.20 | 0.0151 * | 0.4995 * |
| ˃151 cm | HDR = −1.6448 + 0.5431 × x − 0.009 × x2 | Op | 0.20 | 0.0121 * | 0.4875 * |
| ˃151 cm | HDR = 5.4822 + 1.3029 × x + 7.8746 × x2 | DSF | 0.23 | 0.0065 ** | 0.4172 * |
| ˃151 cm | HDR = 7.439 − 18.9085 × x + 50.8065 × x2 | ISF | 0.16 | 0.0254 * | 0.3861 * |
| ˃151 cm | HDR = 5.5556 − 0.2287 × x + 12.4244 × x2 | TSF | 0.23 | 0.0057 ** | 0.4322 * |
Note: HDR: height–diameter ratio; GFr: gap fraction; Op: canopy openness; DSF: direct site factor; ISF: indirect site factor; TSF: total site factor; p < 0.05 (*), p < 0.01 (**); p ˃ 0.05 (NS).
References
- Clark, J.S.; Beckage, B.; Camill, P.; Cleveland, B.; HilleRisLambers, J.; Lichter, J.; McLachlan, J.; Mohan, J.; Wyckoff, P. Interpreting recruitment limitation in forests. Am. J. Bot. 1999, 86, 1–16. [Google Scholar] [CrossRef] [PubMed] [Green Version]
- Collet, C.; Piboule, A.; Leroy, O.; Frochot, H. Advance Fagus sylvatica and Acer pseudoplatanus seedlings dominate tree regeneration in a mixed broadleaved former coppice-with-standarts forest. Forestry 2008, 81, 135–150. [Google Scholar] [CrossRef] [Green Version]
- Diaci, J.; Firm, D. Long-term dynamics of a mixed conifer stand in Slovenia managed with a farmer selection system. For. Ecol. Manag. 2011, 262, 931–939. [Google Scholar] [CrossRef]
- Čater, M.; Levanič, T. Response of Fagus sylvatica L. and Abies alba L. in different silvicultural systems of high Dinaric karst. For. Ecol. Manag. 2013, 289, 278–288. [Google Scholar] [CrossRef]
- Čater, M.; Schmid, I.; Kazda, M. Instantaneous and potential radiation effect on underplanted European beech below Norway spruce canopy. Eur. J. For. Res. 2013, 132, 23–32. [Google Scholar] [CrossRef]
- Tesař, V.; Klimo, E.; Kraus, M.; Souček, J. Long-Term Transformation of the Conifer Stand at Hetlín District; Mendel University in Brno: Brno, Czech Republic, 2004. (In Czech) [Google Scholar]
- Schütz, J.P. Silvicultural tools to develop irregular and diverse forest structures. Forestry 2002, 75, 329–337. [Google Scholar] [CrossRef] [Green Version]
- Čater, M.; Diaci, J.; Roženbergar, D. Gap size and position influence variable response of Fagus sylvatica L. and Abies alba Mill. For. Ecol. Manag. 2014, 325, 128–135. [Google Scholar] [CrossRef]
- Matthews, J.D. Silvicultural Systems; Oxford University Press: Oxford, UK, 1999. [Google Scholar]
- Bončina, A. History, current status and future prospects of uneven-aged forest management in the Dinaric region: An overview. Forestry 2011, 84, 467–478. [Google Scholar] [CrossRef]
- O’Hara, K.L.; Gersonde, R.F. Stocking control concepts in uneven-aged silviculture. Forestry 2004, 77, 131–143. [Google Scholar] [CrossRef]
- Canham, C.D. Different responses to gaps among shade tolerant tree species. Ecology 1989, 70, 548–550. [Google Scholar] [CrossRef]
- Gravel, D.; Canham, C.D.; Beaudet, M.; Messier, C. Shade tolerance, canopy gaps and mechanism of coexistence of forest trees. Oikos 2010, 119, 475–486. [Google Scholar] [CrossRef] [Green Version]
- Kimmins, J.P. Forest Ecology—A Foundation for Sustainable Management, 3rd ed.; Prentice Hall: Upper Saddle River, NJ, USA, 1997. [Google Scholar]
- Wright, E.F.; Coates, K.D.; Canham, C.D.; Bartemucci, P. Species variability in growth response to light across climatic regions in northwestern British Columbia. Can. J. For. Res. 1998, 28, 871–886. [Google Scholar] [CrossRef]
- Jaloviar, P.; Saniga, M.; Kucbel, S. Importance of light conditions for the height growth of underplantings in Norway spruce stands in the Oravské Beskydy Mts. Beskydy 2013, 6, 53–58. [Google Scholar] [CrossRef] [Green Version]
- Givnish, T.J. Adaptation to sun and shade: A whole-plant perspective. Aust. J. Plant Physiol. 1988, 15, 63–92. [Google Scholar] [CrossRef] [Green Version]
- Grassi, G.; Giannini, R. Influence of light and competition on crown and shoot morphological parameters of Norway spruce and silver fir saplings. Ann. For. Sci. 2005, 62, 269–274. [Google Scholar] [CrossRef]
- Chrimes, D.; Nilson, K. Overstorey density influence on the height of Picea abies regeneration in northern Sweden. Forestry 2005, 78, 433–442. [Google Scholar] [CrossRef] [Green Version]
- Collet, C.; Lanter, O.; Pardos, M. Effects of canopy opening on height and diameter growth in naturally regenerated beech seedlings. Ann. For. Sci. 2001, 58, 127–134. [Google Scholar] [CrossRef] [Green Version]
- Löf, M.; Karlsson, M.; Sonesson, K.; Welander, T.N.; Collet, C. Growth and mortality in underplanted tree seedlings in response to variations in canopy closure of Norway spruce stands. Forestry 2007, 80, 371–383. [Google Scholar] [CrossRef]
- Ferlin, F. The growth potential of understorey silver fir and Norway spruce for uneven-aged forest management in Slovenia. Forestry 2002, 75, 375–383. [Google Scholar] [CrossRef]
- Plíva, A. Trvale Udržitelné Obhospodařování lesů Podle Souborů Lesních Typů; Ústav pro Hospodářskou Úpravu Lesů: Brandýs nad Labem, Czech Republic, 2000; Volume 34. (In Czech) [Google Scholar]
- Vrška, T.; Hort, L.; Adam, D.; Odehnalová, P.; Horal, D. Developmental Dynamics of Virgin Forest Reserves in the Czech Republic; Academia: Praha, Czech Republic, 2002. [Google Scholar]
- Uher, P. Přirozená Obnova na Vysočině. Master’s Thesis, Mendel University in Brno, Brno, Czech Republic, 2003. (In Czech). [Google Scholar]
- Quitt, E. Klimatické oblasti Československa; ČAV-GÚ: Brno, Czech Republic, 1974. (In Czech) [Google Scholar]
- Messier, C.; Parent, S.; Chengaou, M.; Beaulieu, J. Juvenile growth and crown morphological plasticity of eastern white pines (Pinus strobus L.) planted along a natural light gradient: Results after six years. For. Chron. 1999, 75, 275–279. [Google Scholar] [CrossRef]
- Williams, H.; Messier, C.; Kneeshaw, D.D. Effects of light availability and sapling size on the growth and crown morphology of understory Douglas-fir and lodgepole pine. Can. J. For. Res. 1999, 29, 222–231. [Google Scholar] [CrossRef]
- Szymura, T.H. Silver fir sapling bank in seminatural stand: Individuals architecture and vitality. For. Ecol. Manag. 2005, 212, 101–108. [Google Scholar] [CrossRef]
- Du Cros, E.T.; Thiebaut, B.; Duval, H. Variability in beech: Budding, height growth and tree form. Ann. Sci. For. 1988, 45, 383–398. [Google Scholar] [CrossRef]
- Collet, C.; Le Moguedec, G. Individual seedling mortality as a function of size, growth and competition in naturally regenerated beech seedlings. Forestry 2007, 80, 359–370. [Google Scholar] [CrossRef] [Green Version]
- Leblanc, S.G.; Chen, J.M.; Fernandes, R.; Deering, D.W.; Conley, A. Methodology comparison for canopy structure parameters extraction from digital hemispherical photography in boreal forests. Agric. For. Meteorol. 2005, 129, 187–207. [Google Scholar] [CrossRef] [Green Version]
- Rich, P.M.; Clark, D.B.; Clark, D.A.; Oberbauer, S.F. Long-term study of solar radiation regimes in a tropical wet forest using quantum sensors and hemispherical photography. Agric. For. Meteorol. 1993, 65, 107–127. [Google Scholar] [CrossRef]
- Régent Instruments, Inc. User Manual for WinSCANOPY 2012; Régent Instruments Inc.: Quebec City, QC, Canada, 2009. [Google Scholar]
- Dai, X. Influence of light conditions in canopy gaps on forest regeneration: A new gap light index and its application in a boreal forest in east-central Sweden. For. Ecol. Manag. 1996, 84, 187–197. [Google Scholar] [CrossRef]
- Lundqvist, L.; Fridman, E. Influence of local stand basal area on density and growth of regeneration in uneven-aged Picea abies stands. Scand. J. For. Res. 1996, 11, 364–369. [Google Scholar] [CrossRef]
- Duchesneau, R.; Lesage, I.; Messier, C.; Morin, H. Effects of light and intraspecific competition on growth and crown morphology of two size classes of understory balsam fir saplings. For. Ecol. Manag. 2001, 140, 215–225. [Google Scholar] [CrossRef] [Green Version]
- R Core Team. R: A Language and Environment for Statistical Computing; R Foundation for Statistical Computing: Vienna, Austria, 2019; Available online: https://www.R-project.org/ (accessed on 29 June 2019).
- R Studio Team. RStudio: Integrated Development for R; R Studio, Inc.: Boston, MA, USA, 2018; Available online: http://www.rstudio.com/ (accessed on 29 June 2019).
- Oksanen, J.; Blanchet, F.G.; Friendly, M.; Kindt, R.; Legendre, P.; McGlinn, D.; Minchin, P.R.; O’Hara, R.B.; Simpson, G.L.; Solymos, P.; et al. Vegan: Community Ecology Package. R Package Version 2.5-5. 2019. Available online: https://CRAN.R-project.org/package=vegan (accessed on 29 June 2019).
- Robakowski, P.; Wyka, T.; Samardakiewicz, S.; Kierzkowski, D. Growth, photosynthesis, and needle structure of silver fir (Abies alba Mill.) seedlings under different canopies. For. Ecol. Manag. 2004, 201, 211–227. [Google Scholar] [CrossRef]
- Šebík, L.; Polák, L. Science of Wood Production; Príroda: Bratislava, Slovakia, 1990. (In Slovak) [Google Scholar]
- Takahashi, K. Plastic response of crown architecture to crowding in understorey trees of two co-dominating conifers. Ann. Bot. 1996, 77, 159–164. [Google Scholar] [CrossRef]
- Claveau, Y.; Messier, C.; Comeau, P.G.; Coates, K.D. Growth and crown morphological responses of boreal conifer seedlings and saplings with contrasting shade tolerance to a gradient of light and height. Can. J. For. Res. 2002, 32, 458–468. [Google Scholar] [CrossRef] [Green Version]
- Stancioiu, P.T.; O’Hara, K.L. Regeneration growth in different light environments of mixed species, multiaged, mountainous forest in Romania. Eur. J. For. Res. 2006, 125, 151–162. [Google Scholar] [CrossRef]
- Nilson, K.; Lundqvist, L. Effect of stand structure and density on development of natural regeneration in two Picea abies stands in Sweden. Scand. J. For. Res. 2001, 16, 253–259. [Google Scholar] [CrossRef]
- Canham, C.D. Growth and canopy architecture of shade tolerant trees: Response to canopy gaps. Ecology 1988, 69, 786–795. [Google Scholar] [CrossRef]
- Larcher, W. Physiological Plant Ecology: Ecophysiology and Stress Physiology of Functional Groups, 4th ed.; Springer: Berlin/Heidelberg, Germany, 2003. [Google Scholar]
- Stancioiu, P.T.; O’Hara, K.L. Morphological plasticity of regeneration subject to different levels of canopy cover in mixed-species, multiaged forests of the Romanian Carpathians. Trees 2006, 20, 196–209. [Google Scholar] [CrossRef]
- Vieillendent, G.; Courbaud, B.; Kunstler, G.; Dhôte, J.F. Mortality of silver fir and Norway spruce in the Western Alps—A semi-parametric approach combining size-dependent and growth-dependent mortality. Ann. For. Sci. 2010, 67, 305. [Google Scholar] [CrossRef] [Green Version]
- Chen, H.Y.H.; Klinka, K.; Kayahara, G.J. Effects of light on growth, crown architecture and specific leaf area for naturally established Pinus contorta var. latifolia and Psedotsuga menziesii var. glauca saplings. Can. J. For. Res. 1996, 26, 1149–1157. [Google Scholar] [CrossRef]
- Messier, C.; Nikinmaa, E. Effects of light availability and sapling size on the growth, biomass allocation, and crown morphology of understory sugar maple, yellow birch, and beech. Ecoscience 2000, 7, 345–356. [Google Scholar] [CrossRef] [Green Version]
- Parent, S.; Messier, C. Effects of light gradient on height growth and crown morphology of balsam fir natural regeneration. Can. J. For. Res. 1995, 25, 878–885. [Google Scholar] [CrossRef]
- Oliver, D.C.; Larson, B.C. Forest Stand Dynamics; John and Wiley: New York, NY, USA, 1996. [Google Scholar]
- O’Connell, B.; Kelty, M.J. Crown architecture of understory and open-grown white pine (Pinus strobus L.) saplings. Tree Physiol. 1993, 14, 89–102. [Google Scholar] [CrossRef] [PubMed]
- Klinka, K.; Wang, Q.; Kayahara, G.J.; Carter, R.E.; Blackwell, B.A. Light-growth response relationships in Pacific silver fir (Abies amabilis) and subalpine fir (Abies lasiocarpa). Can. J. Bot. 1992, 70, 1919–1930. [Google Scholar] [CrossRef]
- Kohyama, T. A functional model describing sapling growth under a tropical forest canopy. Funct. Ecol. 1991, 5, 83–90. [Google Scholar] [CrossRef]
- Kato, K.; Yamamoto, S. Branch growth and allocation patterns of saplings of two Abies species under different canopy conditions in subalpine old-growth forest in central Japan. Ecoscience 2002, 9, 98–105. [Google Scholar] [CrossRef]
- Chen, H.Y.H.; Klinka, K. Light availability and photosynthesis of Pseudotsuga menziesii seedlings grown in the open and forest understory. Tree Physiol. 1997, 17, 23–29. [Google Scholar] [CrossRef] [Green Version]
- Coates, K.D.; Burton, P.J. Growth of planted tree seedlings in response to ambient light levels in northwestern interior cedar-hemlock forests of British Columbia. Can. J. For. Res. 1999, 29, 1374–1382. [Google Scholar] [CrossRef]
- Petritan, I.C.; von Lüpke, B.; Petritan, A.M. Response of planted beech (Fagus sylvatica L.) and Douglas-fir (Pseudotsuga menziesii (Mirb.) Franco) saplings to herbaceous and small shrubs control on clearcuts. J. For. Res. 2012, 17, 164–174. [Google Scholar] [CrossRef] [Green Version]
- Kučeravá, B.; Dobrovolný, L.; Remeš, J. Responses of Abies alba seedlings to different site conditions in Picea abies plantations. Dendrobiology 2012, 69, 49–58. [Google Scholar] [CrossRef] [Green Version]
- Greis, I.; Kellomäki, S. Crown structure and stem growth of Norway spruce undergrowth under varying shading. Silva Fenn. 1981, 15, 306–322. [Google Scholar] [CrossRef] [Green Version]
- Hasenauer, H.; Kinderman, G. Methods for assessing regeneration establishment and height growth in uneven-aged mixed species stands. Forestry 2002, 75, 385–394. [Google Scholar] [CrossRef]
- Szewczyk, J.; Szwagrzyk, J. Spatial and temporal variability of natural regeneration in a temperate old-growth forest. Ann. For. Sci. 2010, 67, 202. [Google Scholar] [CrossRef] [Green Version]
- Jaďuď, J.; Pittner, J.; Snopková, Z. Vplyv klimatických a svetelných faktorov na klíčenie a prežívanie semenáčikov jedle bielej (Abies alba Mill.) a smreka obyčajného (Picea abies L. KARST.) vo výberkovom lese. Zpr. lesnického výzkumu/Rep. For. Res. 2014, 59, 167–174. (In Slovak) [Google Scholar]
- Roženbergar, D.; Mikac, S.; Anić, I.; Diaci, J. Gap regeneration patterns in relationship to light heterogeneity in two old-growth beech-fir forest reserves in South East Europe. Forestry 2007, 80, 431–443. [Google Scholar] [CrossRef] [Green Version]
- Grassi, G.; Minotta, G.; Tonon, G.; Bagnaresi, U. Dynamics of Norway spruce and silver fir natural regeneration in a mixed stand under uneven-aged management. Can. J. For. Res. 2004, 34, 141–149. [Google Scholar] [CrossRef]
- Kupferschmid, A.D.; Bugmann, H. Effect of microsites, logs and ungulate browsing on Picea abies regeneration in a mountain forest. For. Ecol. Manag. 2005, 205, 251–265. [Google Scholar] [CrossRef]
- Hunziker, U.; Brang, P. Microsite patterns of conifer seedlings establishment and growth in a mixed stand in the southern Alps. For. Ecol. Manag. 2005, 210, 67–79. [Google Scholar] [CrossRef]
- Kathe, S.; Bruelheide, H. Interaction of gap age and microsite type for the regeneration of Picea abies. For. Ecol. Manag. 2010, 259, 1597–1605. [Google Scholar] [CrossRef]
Figure 1.
Location of research plots for applied measurements showing the positions both within Europe and the Czech Republic.
Figure 1.
Location of research plots for applied measurements showing the positions both within Europe and the Czech Republic.

Figure 2.
Example of visualized similarities between relative height growth (RHG) and apical dominance ratio (ADR) (A) and example of relative crown length (RCL) (B) of Norway spruce juveniles under a mature overstory canopy on the largest research plot Drtič (A). For all three indexes, a deep green color indicates highly suppressed growth regimes characterized by (i) short terminal length (as numerator in RHG and ADR); (ii) lateral crown growth encouraged by long branch length (as denominator in ADR); (iii) shortened crown length (as numerator in RCL).

Figure 3.
The results of redundancy analysis (RDA) where two factors were involved—indirect site factor (ISF) and direct site factor (DSF).
Figure 3.
The results of redundancy analysis (RDA) where two factors were involved—indirect site factor (ISF) and direct site factor (DSF).

Table 1.
Fundamental characteristics of the research plots.
| Plot Name (ID) | Geographical Coordinates | Elevation (m a.s.l.) | Dimension (m) | Area (m2) | Number of Sampled Sub-Plots |
|---|---|---|---|---|---|
| Drtič (A) | 49°36′50″ N; 15°53′05″ E | 672 | 27 × 42 | 1134 | 126 |
| Tornádová (B) | 49°40′12″ N; 15°55′56″ E | 737 | 12 × 21 | 252 | 28 |
| Odvozní (C) | 49°40′17″ N; 15°56′13″ E | 766 | 9 × 12 | 108 | 12 |
Table 2.
Parameters of Norway spruce natural regeneration that were measured within the study.
| Parameter | Acronym | Juveniles Involved |
|---|---|---|
| Total density | DEN | all |
| Total height | H (cm) | above 10 cm |
| Live crown length | Cl (cm) | above 10 cm |
| Terminal leader length | Tl (cm) | above 10 cm |
| Length of the longest branch | Bl (cm) | above 10 cm |
| Width of crown in the widest part of crown | CW1 (cm) | above 10 cm |
| Width of crown perpendicular to the widest part of crown | CW2 (cm) | above 10 cm |
| Diameter at height of 5 cm above ground | D (mm) | above 10 cm |
Table 3.
Characteristics of light intensities and canopy openness based on hemispherical photography evaluation used in this study.
Table 3.
Characteristics of light intensities and canopy openness based on hemispherical photography evaluation used in this study.
| Entity | Acronym | Description | Open Area Conditions |
|---|---|---|---|
| Gap Fraction | GFr | pixels of “Sky” in two dimensions | 100% |
| Openness | Op | pixels of “Sky” in three dimensions | 100% |
| Direct Site Factor | DSF | sum of direct light of a growing season | 1 |
| Indirect Site Factor | ISF | sum of indirect light of a growing season | 1 |
| Total Site Factor | TSF | sum of total light of a growing season | 1 |
Table 5.
Significantly proven regression models of light intensities and photo-morphological acclimations of Norway spruce natural regeneration under size-independent evaluation.
Table 5.
Significantly proven regression models of light intensities and photo-morphological acclimations of Norway spruce natural regeneration under size-independent evaluation.
| Index | Regression Model | Variable (x) | R2 | p | rs |
|---|---|---|---|---|---|
| RHG | RHG = 0.1904 − 0.0151 × x + 0.0005 × x2 | GFr | 0.26 | 0.0000 *** | 0.3698 * |
| RHG = 0.1911 − 0.015 × x + 0.0005 × x2 | Op | 0.26 | 0.0000 *** | 0.3577 * | |
| RHG = 0.1104 − 0.1592 × x + 0.8724 × x2 | DSF | 0.10 | 0.0004 *** | 0.1949 * | |
| RHG = 0.1813 − 1.1899 × x + 3.5281 × x2 | ISF | 0.25 | 0.0000 *** | 0.2878 * | |
| RHG = 0.1105 − 0.1999 × x + 1.0346 × x2 | TSF | 0.12 | 0.0002 *** | 0.2097 * | |
| ADR | ADR = 0.3433 − 0.0285 × x + 0.001 × x2 | GFr | 0.24 | 0.0000 *** | 0.4362 * |
| ADR = 0.347 − 0.0287 × x + 0.001 × x2 | Op | 0.25 | 0.0000 *** | 0.4218 * | |
| ADR = 0.1865 − 0.0733 × x + 1.1619 × x2 | DSF | 0.08 | 0.0015 ** | 0.2257 * | |
| ADR = 0.3402 − 2.4533 × x + 7.4787 × x2 | ISF | 0.25 | 0.0000 *** | 0.3784 * | |
| ADR = 0.179 − 0.0943 × x + 1.374 × x2 | TSF | 0.09 | 0.0006 *** | 0.2442 * | |
| RCL | RCL = 0.5603 − 0.0024 × x + 0.0002 × x2 | GFr | 0.12 | 0.0001 *** | 0.4242 * |
| RCL = 0.559 − 0.0023 × x + 0.0002 × x2 | Op | 0.12 | 0.0001 *** | 0.4301 * | |
| RCL = 0.5272 + 0.6574 × x − 0.53 × x2 | DSF | 0.11 | 0.0001 *** | 0.3337 * | |
| RCL = 0.5723 − 0.3511 × x + 2.2008 × x2 | ISF | 0.14 | 0.0000 *** | 0.4395 * | |
| RCL = 0.5113 + 0.7212 × x − 0.5476 × x2 | TSF | 0.12 | 0.0000 *** | 0.3560 * | |
| RI | RI = 116.5526 − 10.4147 × x + 0.798 × x2 | GFr | 0.09 | 0.0006 *** | 0.2430 * |
| RI = 126.1057 − 12.5477 × x + 0.8617 × x2 | Op | 0.10 | 0.0003 *** | 0.2568 * | |
| RI = 215.7408 − 2436.291 × x + 10498.1164 × x2 | ISF | 0.16 | 0.0000 *** | 0.3567 * |
Note: RHG: relative height growth; ADR: apical dominance ratio; RCL: relative crown length; RI: regeneration index (cm/m2); GFr: gap fraction; Op: canopy openness; DSF: direct site factor; ISF: indirect site factor; TSF: total site factor; p < 0.05 (*), p < 0.01 (**), p < 0.001 (***).
Publisher’s Note: MDPI stays neutral with regard to jurisdictional claims in published maps and institutional affiliations. |
© 2022 by the authors. Licensee MDPI, Basel, Switzerland. This article is an open access article distributed under the terms and conditions of the Creative Commons Attribution (CC BY) license (https://creativecommons.org/licenses/by/4.0/).
Share and Cite
MDPI and ACS Style
Bednář, P.; Souček, J.; Krejza, J.; Černý, J. Growth and Morphological Patterns of Norway Spruce (Picea abies (L.) Karst.) Juveniles in Response to Light Intensities. Forests 2022, 13, 1804. https://doi.org/10.3390/f13111804
AMA Style
Bednář P, Souček J, Krejza J, Černý J. Growth and Morphological Patterns of Norway Spruce (Picea abies (L.) Karst.) Juveniles in Response to Light Intensities. Forests. 2022; 13(11):1804. https://doi.org/10.3390/f13111804
Chicago/Turabian StyleBednář, Pavel, Jiří Souček, Jan Krejza, and Jakub Černý. 2022. "Growth and Morphological Patterns of Norway Spruce (Picea abies (L.) Karst.) Juveniles in Response to Light Intensities" Forests 13, no. 11: 1804. https://doi.org/10.3390/f13111804
Note that from the first issue of 2016, this journal uses article numbers instead of page numbers. See further details here.