Article

Interactive Effect of Elevated CO2 and Reduced Summer Precipitation on Photosynthesis is Species-Specific: The Case Study with Soil-Planted Norway Spruce and Sessile Oak in a Mountainous Forest Plot

1
Global Change Research Institute, Czech Academy of Sciences, Bělidla 986/4a, 603 00 Brno, Czech Republic
2
Mendel University in Brno, Zemědělská 1665/1, 613 00 Brno, Czech Republic
3
Slovak Technical University Bratislava, Vazovova 5, 812 43 Bratislava, Slovakia
4
School of GeoSciences, University of Edinburgh, Crew Bldg, Kings Bldgs, Alexander Crum Brown Rd, Edinburgh EH9 3FF, Midlothian, UK
*
Author to whom correspondence should be addressed.
Forests 2021, 12(1), 42; https://doi.org/10.3390/f12010042
Submission received: 14 October 2020 / Revised: 26 December 2020 / Accepted: 29 December 2020 / Published: 30 December 2020

Abstract

:
We investigated how reduced summer precipitation modifies photosynthetic responses of two model tree species—coniferous Norway spruce and broadleaved sessile oak—to changes in atmospheric CO2 concentration. Saplings were grown under mountainous conditions for two growing seasons at ambient (400 μmol CO2 mol–1) and elevated (700 μmol CO2 mol–1) CO2 concentration. Half were not exposed to precipitation during the summer (June–August). After two seasons of cultivation under modified conditions, basic photosynthetic characteristics including light-saturated rate of CO2 assimilation (Amax), stomatal conductance (GSmax), and water use efficiency (WUE) were measured under their growth CO2 concentrations together with in vivo carboxylation rate (VC) and electron transport rate (J) derived from CO2-response curves at saturating light. An increase in Amax under elevated CO2 was observed in oak saplings, whereas it remained unchanged or slightly declined in Norway spruce, indicating a down-regulation of photosynthesis. Such acclimation was associated with an acclimation of both J and VC. Both species had increased WUE under elevated CO2 although, in well-watered oaks, WUE remained unchanged. Significant interactive effects of tree species, CO2 concentration, and water availability on gas-exchange parameters (Amax, GSmax, WUE) were observed, while there was no effect on biochemical (VC, J) and chlorophyll fluorescence parameters. The assimilation capacity (Asat; CO2 assimilation rate at saturating light intensity and CO2 concentration) was substantially reduced in spruce under the combined conditions of water deficiency and elevated CO2, but not in oak. In addition, the stimulatory effect of elevated CO2 on Amax persisted in oak, but completely diminished in water-limited spruce saplings. Our results suggest a strong species-specific response of trees to reduced summer precipitation under future conditions of elevated CO2 and a limited compensatory effect of elevated CO2 on CO2 uptake under water-limited conditions in coniferous spruce.

1. Introduction

Forest ecosystems play dominant roles in the ecology and evolution of life on the Earth. Forests have a critical function in regulating the global climate through their effects on the biogeochemical cycles, especially the cycles of carbon and water [1]. It is well known that, due to anthropogenic activities, an increase of CO2 concentration ([CO2]) in the atmosphere is occurring rapidly [2]. Emissions scenarios suggest a range of substantially increased CO2 by the end of this century, ranging between 550 and 900 μmol CO2 mol–1. Since CO2 serves as a substrate for photosynthesis, atmospheric [CO2] strongly influences plant physiology and growth. Although the effects of elevated [CO2] on trees have received great attention [3,4,5,6], investigations of combined effects with other environmental factors are still insufficient to predict future responses, as several other factors are likely to co-vary with the increase in [CO2]. Global climate models suggest an increasing probability of changes in the seasonal pattern of precipitation and severe drought periods in future decades [1,2]. Accordingly, it is important to evaluate the sensitivity of trees grown under elevated [CO2] to limited water availability and to understand the physiological mechanisms contributing to their adaptation capacity.
Generally, CO2 is an activator of Rubisco (ribulose-1,5-bisphosphate carboxylase/oxygenase) enzyme activity (carbamylation), and it is the substrate of the Calvin cycle leading to the formation of triose phosphates (carboxylation). Elevated [CO2] thus results in stimulated carboxylation activity of Rubisco [7,8], while its oxygenase activity is reduced [9,10]. Such adjustments are mediated particularly by an increase of [CO2] in chloroplasts and result in increased CO2 assimilation rates in C3 plants [6,11]. Moreover, elevated [CO2] leads to a reduced stomatal conductance via stomatal closure and/or reduced stomata formation [12], stimulated water use efficiency and growth [13], and particularly an increased ratio between root and shoot biomass [14]. Based on this background information, it is hypothesized that plants growing under elevated [CO2] will have higher tolerance to water-limited conditions than ambient [CO2] plants. However, the previous findings, including those on oak and spruce [15,16,17,18], are highly variable and inconsistent. Among others, it has been shown that CO2 treatment had a persistent stimulatory effect on photosynthesis in well-watered oaks, whereas CO2-treated spruces showed an increased CO2 assimilation rates only when droughted [16]. In contrary with other studies, we present a study on trees planted directly in the soil under mountainous conditions. Such research has so far received only limited attention.
Plant responses to a combined effect of elevated [CO2] and other environmental factors could be also modulated by an occurrence of photosynthetic down-regulation under elevated [CO2]. It is defined as a reduction in [CO2]-enhanced photosynthesis relative to the initial [CO2]-stimulated rate. The degree of these responses is highly variable depending on plant species, root structure, duration of CO2 enrichment, plant age, and growth conditions [19,20]. Photosynthetic down-regulation is particularly associated with insufficient mineral supply, reduced amount and/or activity of Rubisco, and low activity of metabolic carbon sinks [21,22].
To increase our knowledge of how combined long-term elevated [CO2] and reduced water availability influence photosynthetic performance in trees, an experiment was conducted on soil-planted trees under relatively wet mountainous conditions of central Europe. During two summer months, the incoming precipitation, amounting up to 150 mm, was excluded. The specific objectives of this study were: (i) to investigate effects of elevated [CO2] and reduced water availability on two contrasting model tree species, coniferous Norway spruce (Picea abies) and broadleaved sessile oak (Quercus petraea); (ii) to investigate changes in photochemical and gas-exchange parameters; and (iii) to evaluate how the long-term growth under elevated [CO2] (two growing seasons) modifies the tolerance of plants to reduced water availability during summer.

2. Materials and Methods

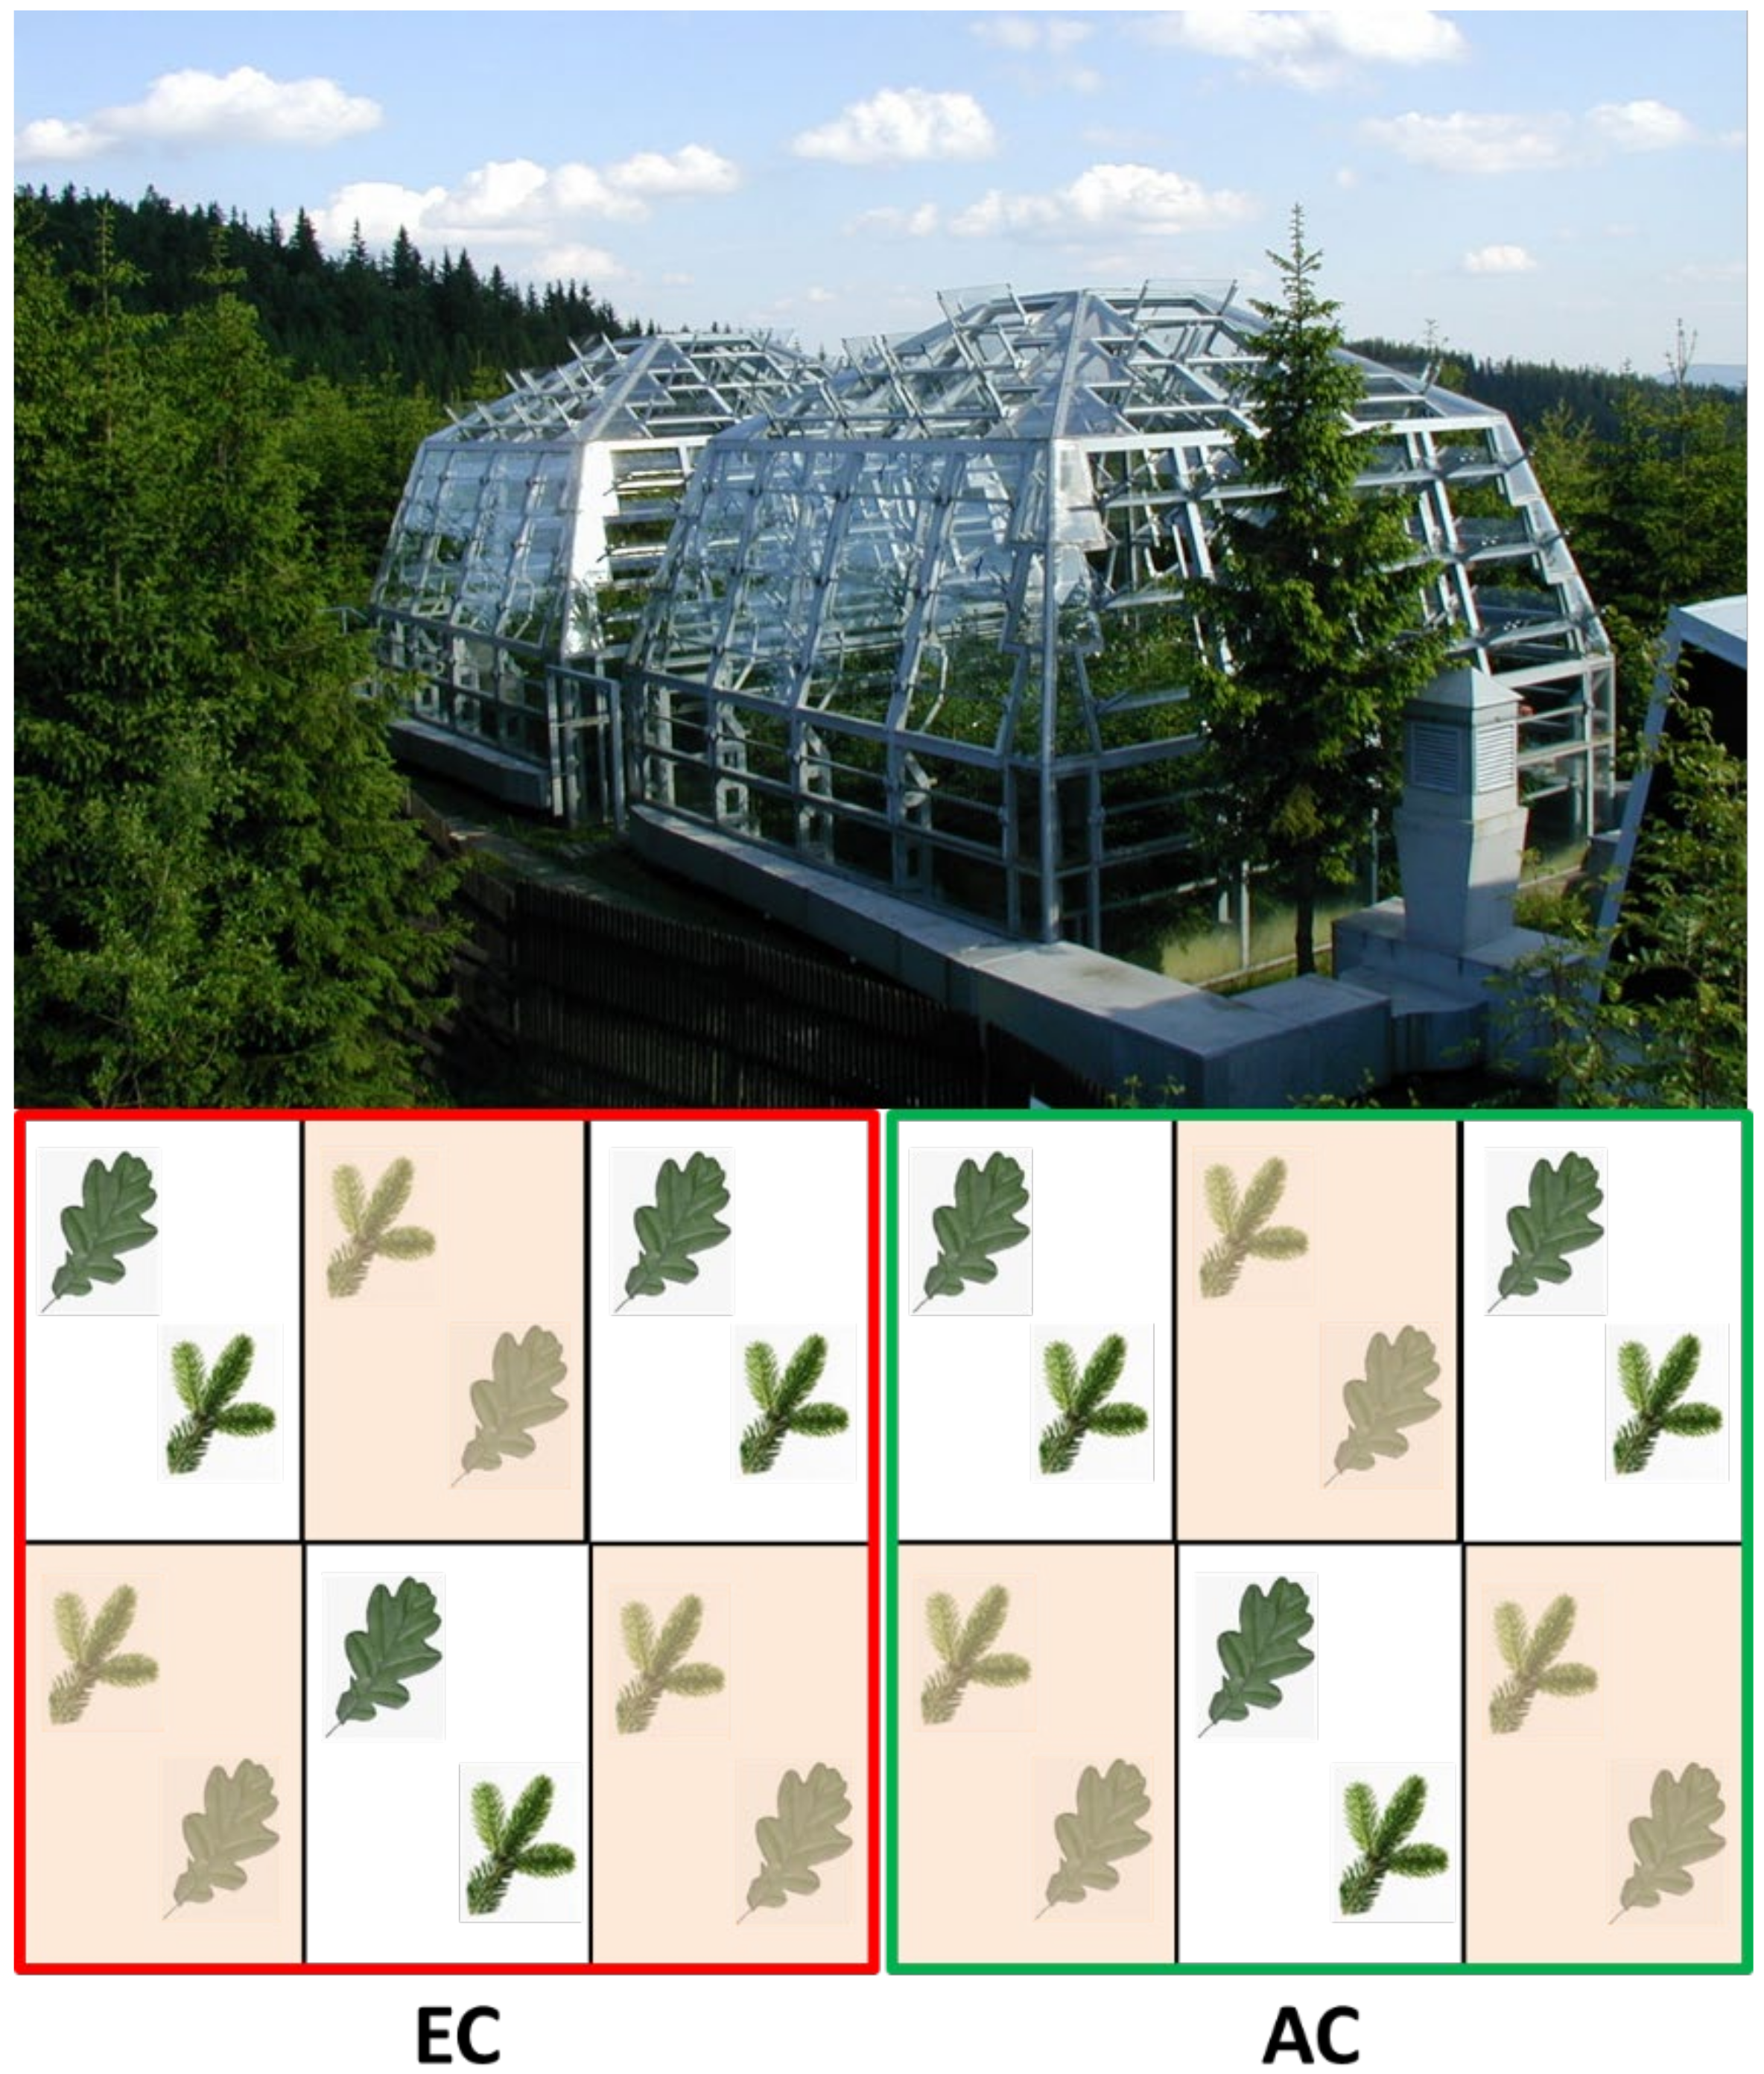
2.1. Plants and Experimental Design

The experiment was conducted at the experimental ecological station Bílý Kříž, located in the Moravian-Silesian Beskydy Mountains, Czech Republic (49°30’77’’ N, 18°32’28’’ E, altitude 908 m a.s.l.). The climate is characterized as moderately cold and moist with an average annual air temperature of 4.9 °C, annual precipitation of 1100 mm, and the average relative air humidity of 80% with high precipitation during the vegetation season of up to 110 mm per month.
Four-year old saplings (mean height 0.5 m) of Norway spruce (Picea abies (L.) Karst.) and sessile oak (Quercus petraea (Matt.) Liebl.) were planted into native soil (Mesozoic Godula sandstone—flysh type) in spring 2017 and then exposed to ambient (~400 μmol CO2 mol–1; hereafter AC) and elevated (~700 μmol CO2 mol–1; hereafter EC) atmospheric [CO2] for two growing seasons using the experimental domes with adjustable windows (Figure 1). Before planting, the soil was homogenized to the depth of 20 cm and thoroughly mixed (10:1 ratio) with a light peat Klasmann base substrate 422 (Klasmann-Deilmann, Geeste, Germany) using a rotary soil tiller. The domes are equipped with a set of sensors for continual monitoring of solar radiation, air and soil humidity, and soil temperatures and a feed-back regulation of internal [CO2] based on the continual monitoring of aerial [CO2] by an infra-red analyzer Li-850 (LI-COR Biosciences, Lincoln, NE, USA). See [5,23] for detailed description.
Each dome (10 × 10 m in size) was split into six blocks (Figure 1). Each block (approximately 16.5 m2) contained 12 saplings of sessile oak and 12 saplings of Norway spruce. Three random blocks (replications; n = 3) were regularly irrigated (WW) while the remaining 3 blocks were left without irrigation during the period of July–August (WL) in two consecutive years. WW plants received regular watering of 20 mm per week during vegetation period, while WL plants had no irrigation for 5 weeks before the measurements. To prevent soil water movement, the blocks were separated by a PVC board (thickness of 5 mm) placed in the soil up to the native bedrock (depth of ca 0.50 m). An ML3 Theta Probe sensor (Delta-T Devices, UK) was used to measure soil water content in the depths of 5–10 cm and 30–40 cm. In topsoil layer, WL treatment led to a decrease of soil water content from 23.5 to 13%, while it remained high (22.5–23.5%) under WW treatment. However, soil water content was the same, 17.5%, under the both water treatments in the deeper soil layer.

2.2. Physiological Measurements

In total, 36 oaks and 36 spruces were measured at the end of August. Leaf- and shoot-level measurements were made on three representative saplings from each block (replication). The average from three sapling measurements per block was used for the consequent statistical analyses. Current-year spruce shoots were examined. All measurements were conducted between 10:00–15:00 CET on intact fully-expanded leaves. A Scholander type of pressure chamber was used to measure leaf water potential (Ψ) at pre-dawn (05:00) and noon (12:00).

2.2.1. Gas-Exchange Measurements

Basic photosynthetic characteristics—CO2 assimilation rate (A), intercellular [CO2] (Ci), stomatal conductance (GS), and transpiration rate (E)—were measured using an open gas-exchange system Li-6400 (LI-COR Biosciences, USA) equipped with an LED light source 6400-02B. The ACi response curves were determined at saturating light intensity (1400 μmol m−2 s−1) and starting at growth [CO2], i.e., at 400 µmol CO2 mol–1 for AC and 700 µmol CO2 mol–1 for EC plants. In this way, instantaneous light-saturated rates of CO2 assimilation (Amax) and stomatal conductance (GSmax) at growth [CO2] were determined. Then, the following set of [CO2] in the assimilation chamber was applied: 1500, 700, 400, 250, 150, 90, and 50 μmol CO2 mol–1. Plants were acclimated approximately 10 min to each [CO2]. Such measuring protocol enabled us to derive CO2 assimilation capacity (Asat), CO2 assimilation rate at saturating light intensity and saturating CO2 concentration (1500 μmol CO2 mol−1), as well as the in vivo Rubisco carboxylation rate (VC) and electron transport (J) at 25 °C. See [24] for the calculation details. Moreover, water use efficiency was calculated under saturating light conditions (WUE, defined as the ratio between Amax and Emax). During all measurements, the leaf temperature was kept at 25 °C (±0.5 °C) using the Peltier thermo-electric cooler mounted on the assimilation chamber. Relative air humidity was maintained during the measurement at 50% (±1%), thus keeping vapor pressure deficit (VPD) at 1.1–1.5 kPa.

2.2.2. Chlorophyll Fluorescence

The efficiency of primary photochemical reactions was determined by chlorophyll fluorescence (Chl-F) following the protocols described in details by Urban et al. [25]. In brief, the emission of the Chl-F signal at the red band (near 690 nm) was measured by a fluorometer PAM-2500 (H. Walz, Effeltrich, Germany). Night-time Chl-F measurement was carried out to estimate maximum quantum yield of photosystem (PS) II photochemistry (Fv/Fm). Leaves adapted to saturating light intensity (1400 μmol m−2 s−1) were used to assess an actual quantum yield of PSII photochemistry (ΦPSII) and thermal energy dissipation (D) according to Demmig-Adams et al. [26]. All measurements were done on intact leaves in situ at growth [CO2].

2.3. Statistical Data Processing

Three-way analysis of variance (ANOVA) was used to analyze effects of tree species (TS), CO2 concentration ([CO2]), water availability (WA), and their interactions (×) on physiological parameters. Tukey’s HSD post-hoc test was used to analyze significant differences between means at p ≤ 0.05. Statistical analyses were conducted using the software STATISTICA 12 (StatSoft, Tulsa, CA, USA). The bar graphs representing means with standard deviations were developed with the software SigmaPlot 11.0 (Systat Software, San Jose, CA, USA).

3. Results

3.1. Growth Conditions

Pre-dawn and noontime leaf water potentials were significantly influenced by tree species (TS) and water availability (WA), but CO2 treatment had significant effect only on Ψpre-dawn (Table 1). No interactive effects of these factors on Ψ values were observed. Exclusion of precipitation led to mild decreases in leaf Ψ at pre-dawn and particularly noon hours. However, the Ψnoon values between −1.0 and −1.3 MPa measured in this experiment for WL plants are not very severe. On average, the noon Ψ decrease amounted up to 22% in oak and up to 25% in spruce. Although there were mostly no significant differences between AC and EC counterparts, lower (more negative) Ψ values were observed in EC plants (Figure 2).

3.2. Gas-Exchange Parameters

3.2.1. Assimilation Capacity (Asat) and Light-Saturated CO2 Assimilation Rate (Amax)

Assimilation capacity (Asat) was significantly influenced by tree species (TS) and water availability (WA), but not by [CO2] (Table 1). Generally, we found higher assimilation capacity in broadleaved oak compared to coniferous spruce (Figure 3A,B). WL treatment led to an increase of Asat in oak saplings treated under both [CO2] conditions. However, the assimilation capacity was substantially reduced in spruce saplings under the combined conditions of WL and EC. Strong interactive effect of all factors investigated (TS × [CO2] × WA) on Asat was also found (Table 1).
Generally, tree species and [CO2] had significant effects on Amax, while the effect of water availability was statistically non-significant (Table 1). A higher stimulatory effect of EC on Amax was found in broadleaved oak compared to coniferous spruce. EC conditions tended to increase Amax values in oak saplings across all water treatments; however, this effect fell short of being statistically significant (Figure 3C). Noticeably, the stimulatory effect of EC on Amax completely diminished in WL-treated spruce saplings (Figure 3D). Analysis of variance revealed significant TS × WA on Amax, while no significant interactive effect of [CO2] and WA was evident (Table 1).

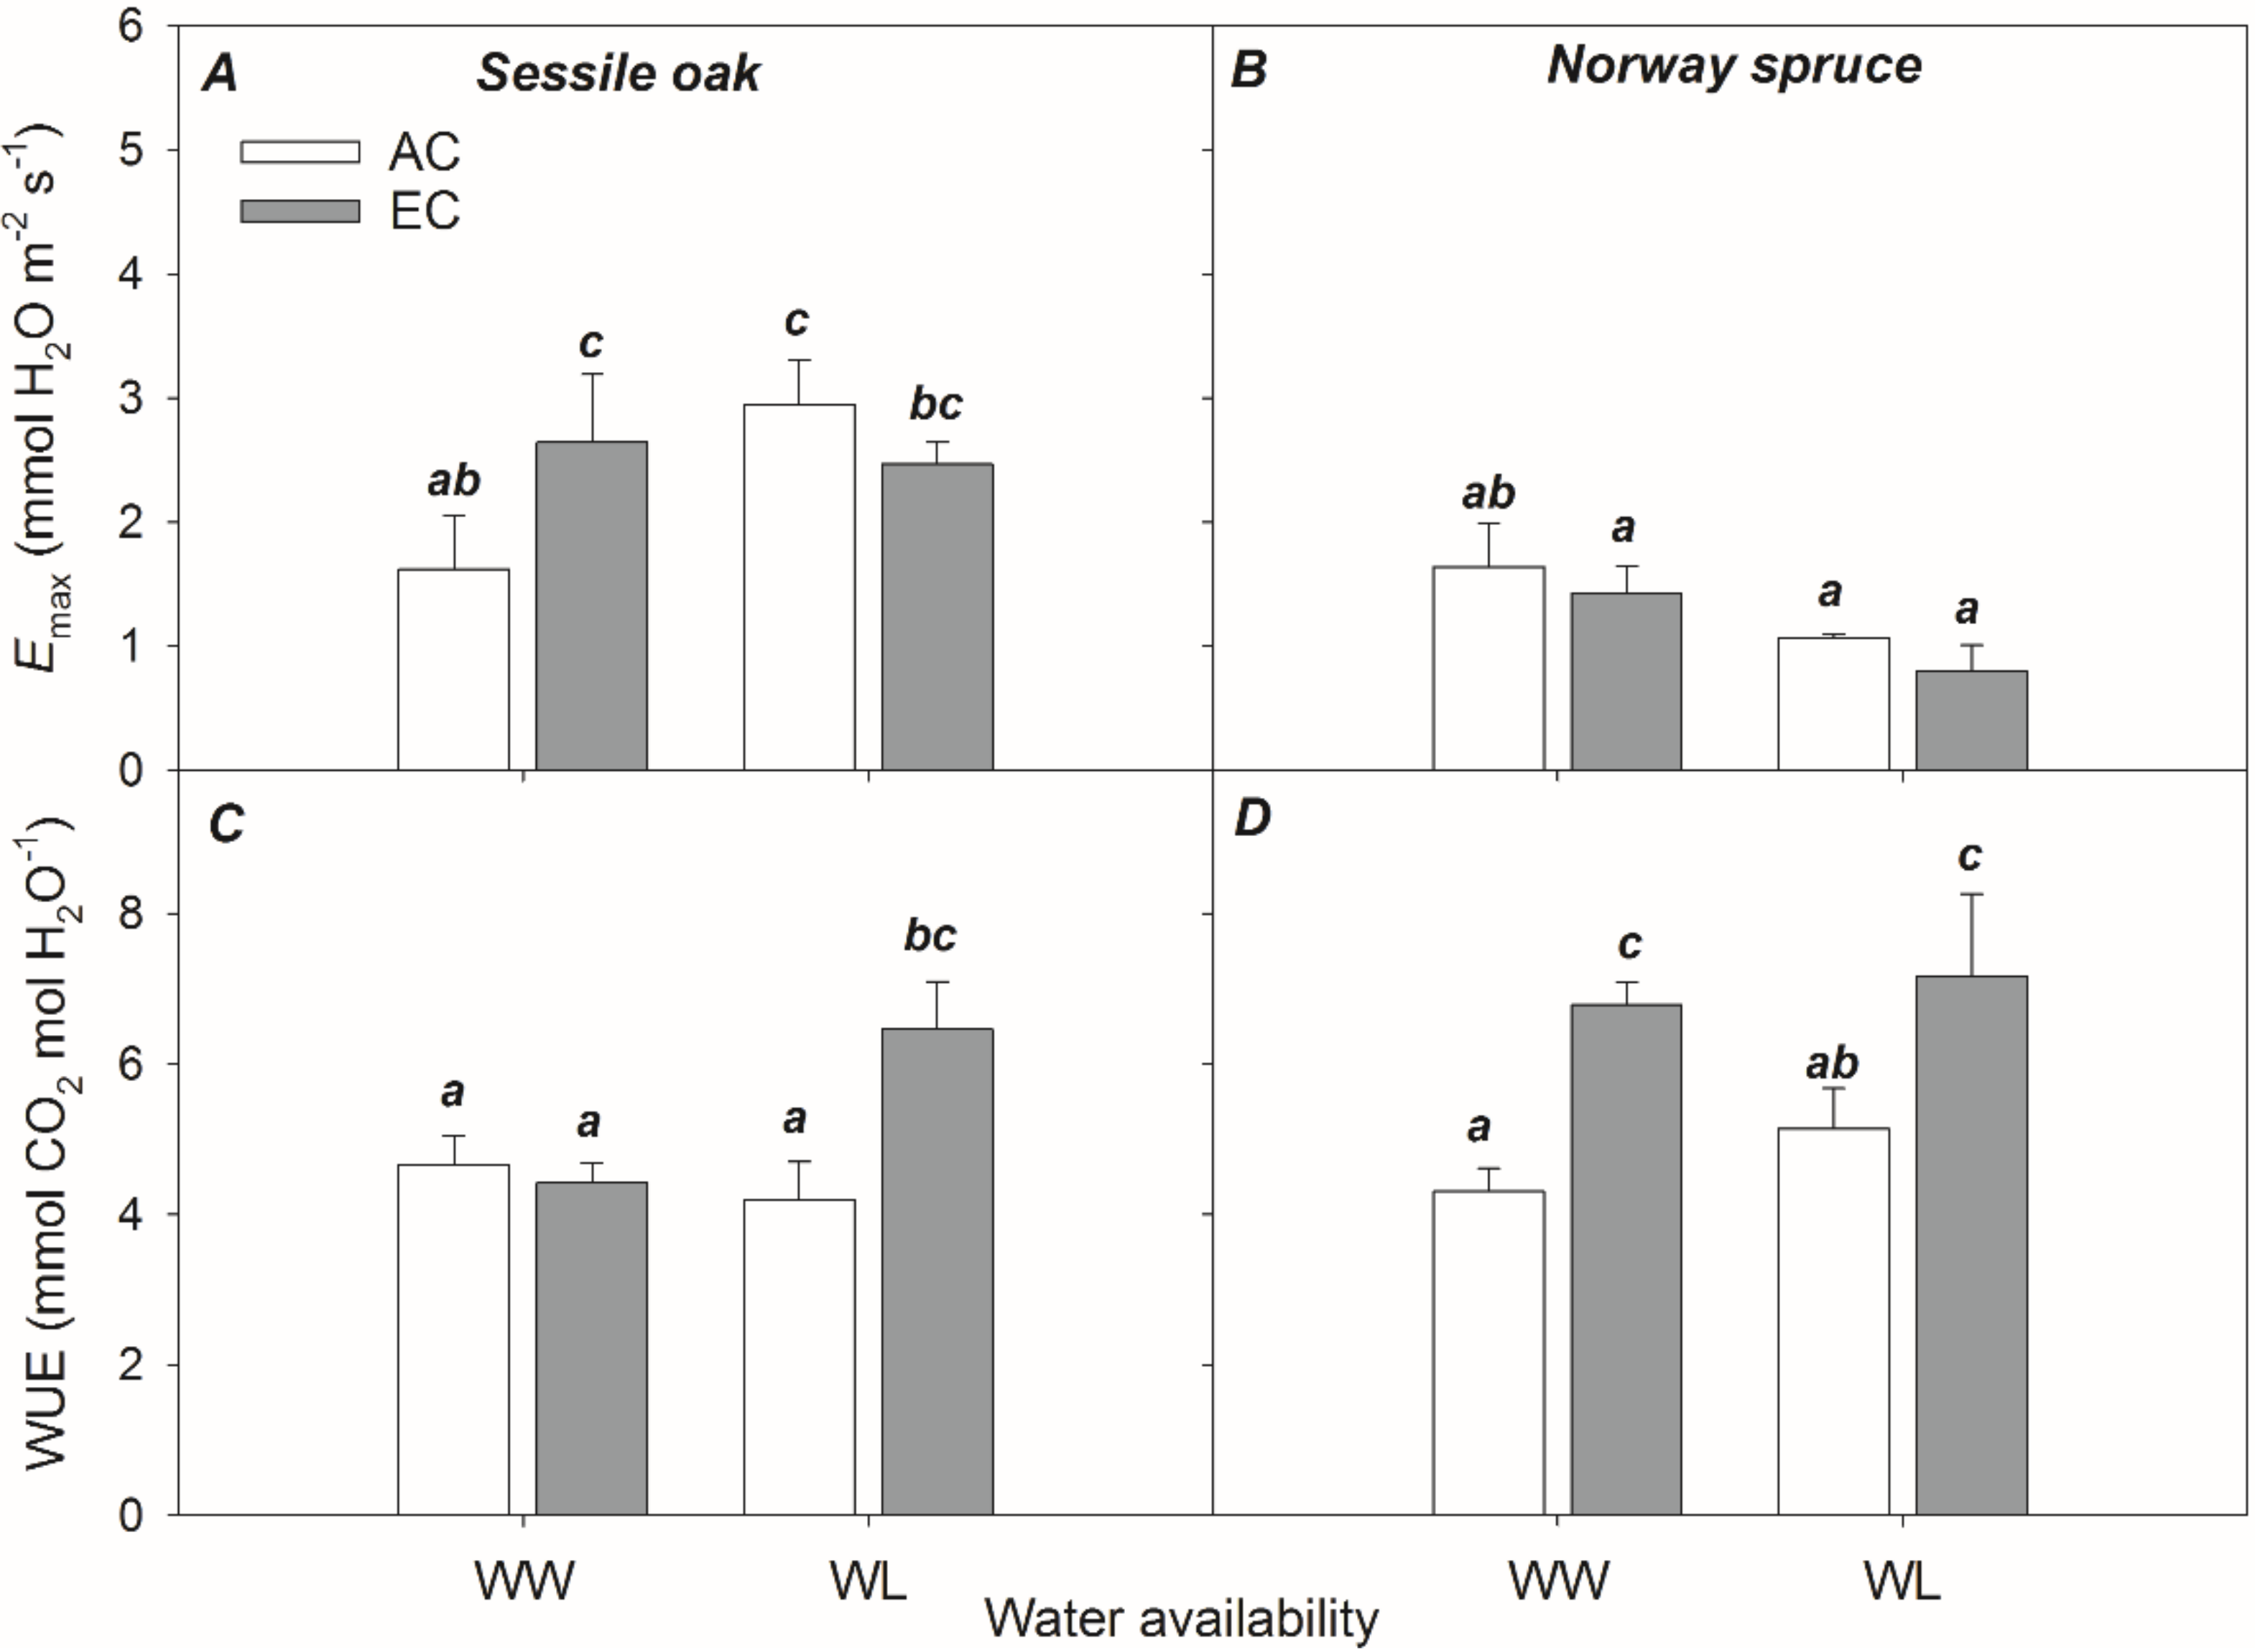
3.2.2. Light-Saturated Stomatal Conductance (GSmax) and Water Use Efficiency (WUE)

Generally, the only significant effect on GSmax and Emax (light-saturated rate of transpiration) was the tree species (TS); rather surprisingly, [CO2] and water availability themselves had no effect (Table 1). There were, however, some interactions. While GSmax decreased under WL conditions in spruce saplings at both [CO2] and oak saplings at EC, an opposite response to WL was observed in broadleaved oak saplings under AC conditions. EC reduced GSmax in spruce irrespective of water availability, but it was true for oak only under WL conditions (Figure 3E,F). The effect of EC was, however, not statistically significant at any water availability. Since the GSmax and Emax are tightly interconnected, the same findings were noted for Emax (Figure 4A,B). WUE, defined as Amax/Emax ratio, was significantly influenced by all factors investigated—tree species, [CO2], and water availability (Table 1). Moreover, significant interactive effects of tree species and [CO2], [CO2] and water availability, as well as tree species, [CO2], and water availability on WUE were found. High [CO2] substantially increased WUE in all saplings under both water regimes, with the exception of the well-watered broadleaved oak (Figure 4C,D).

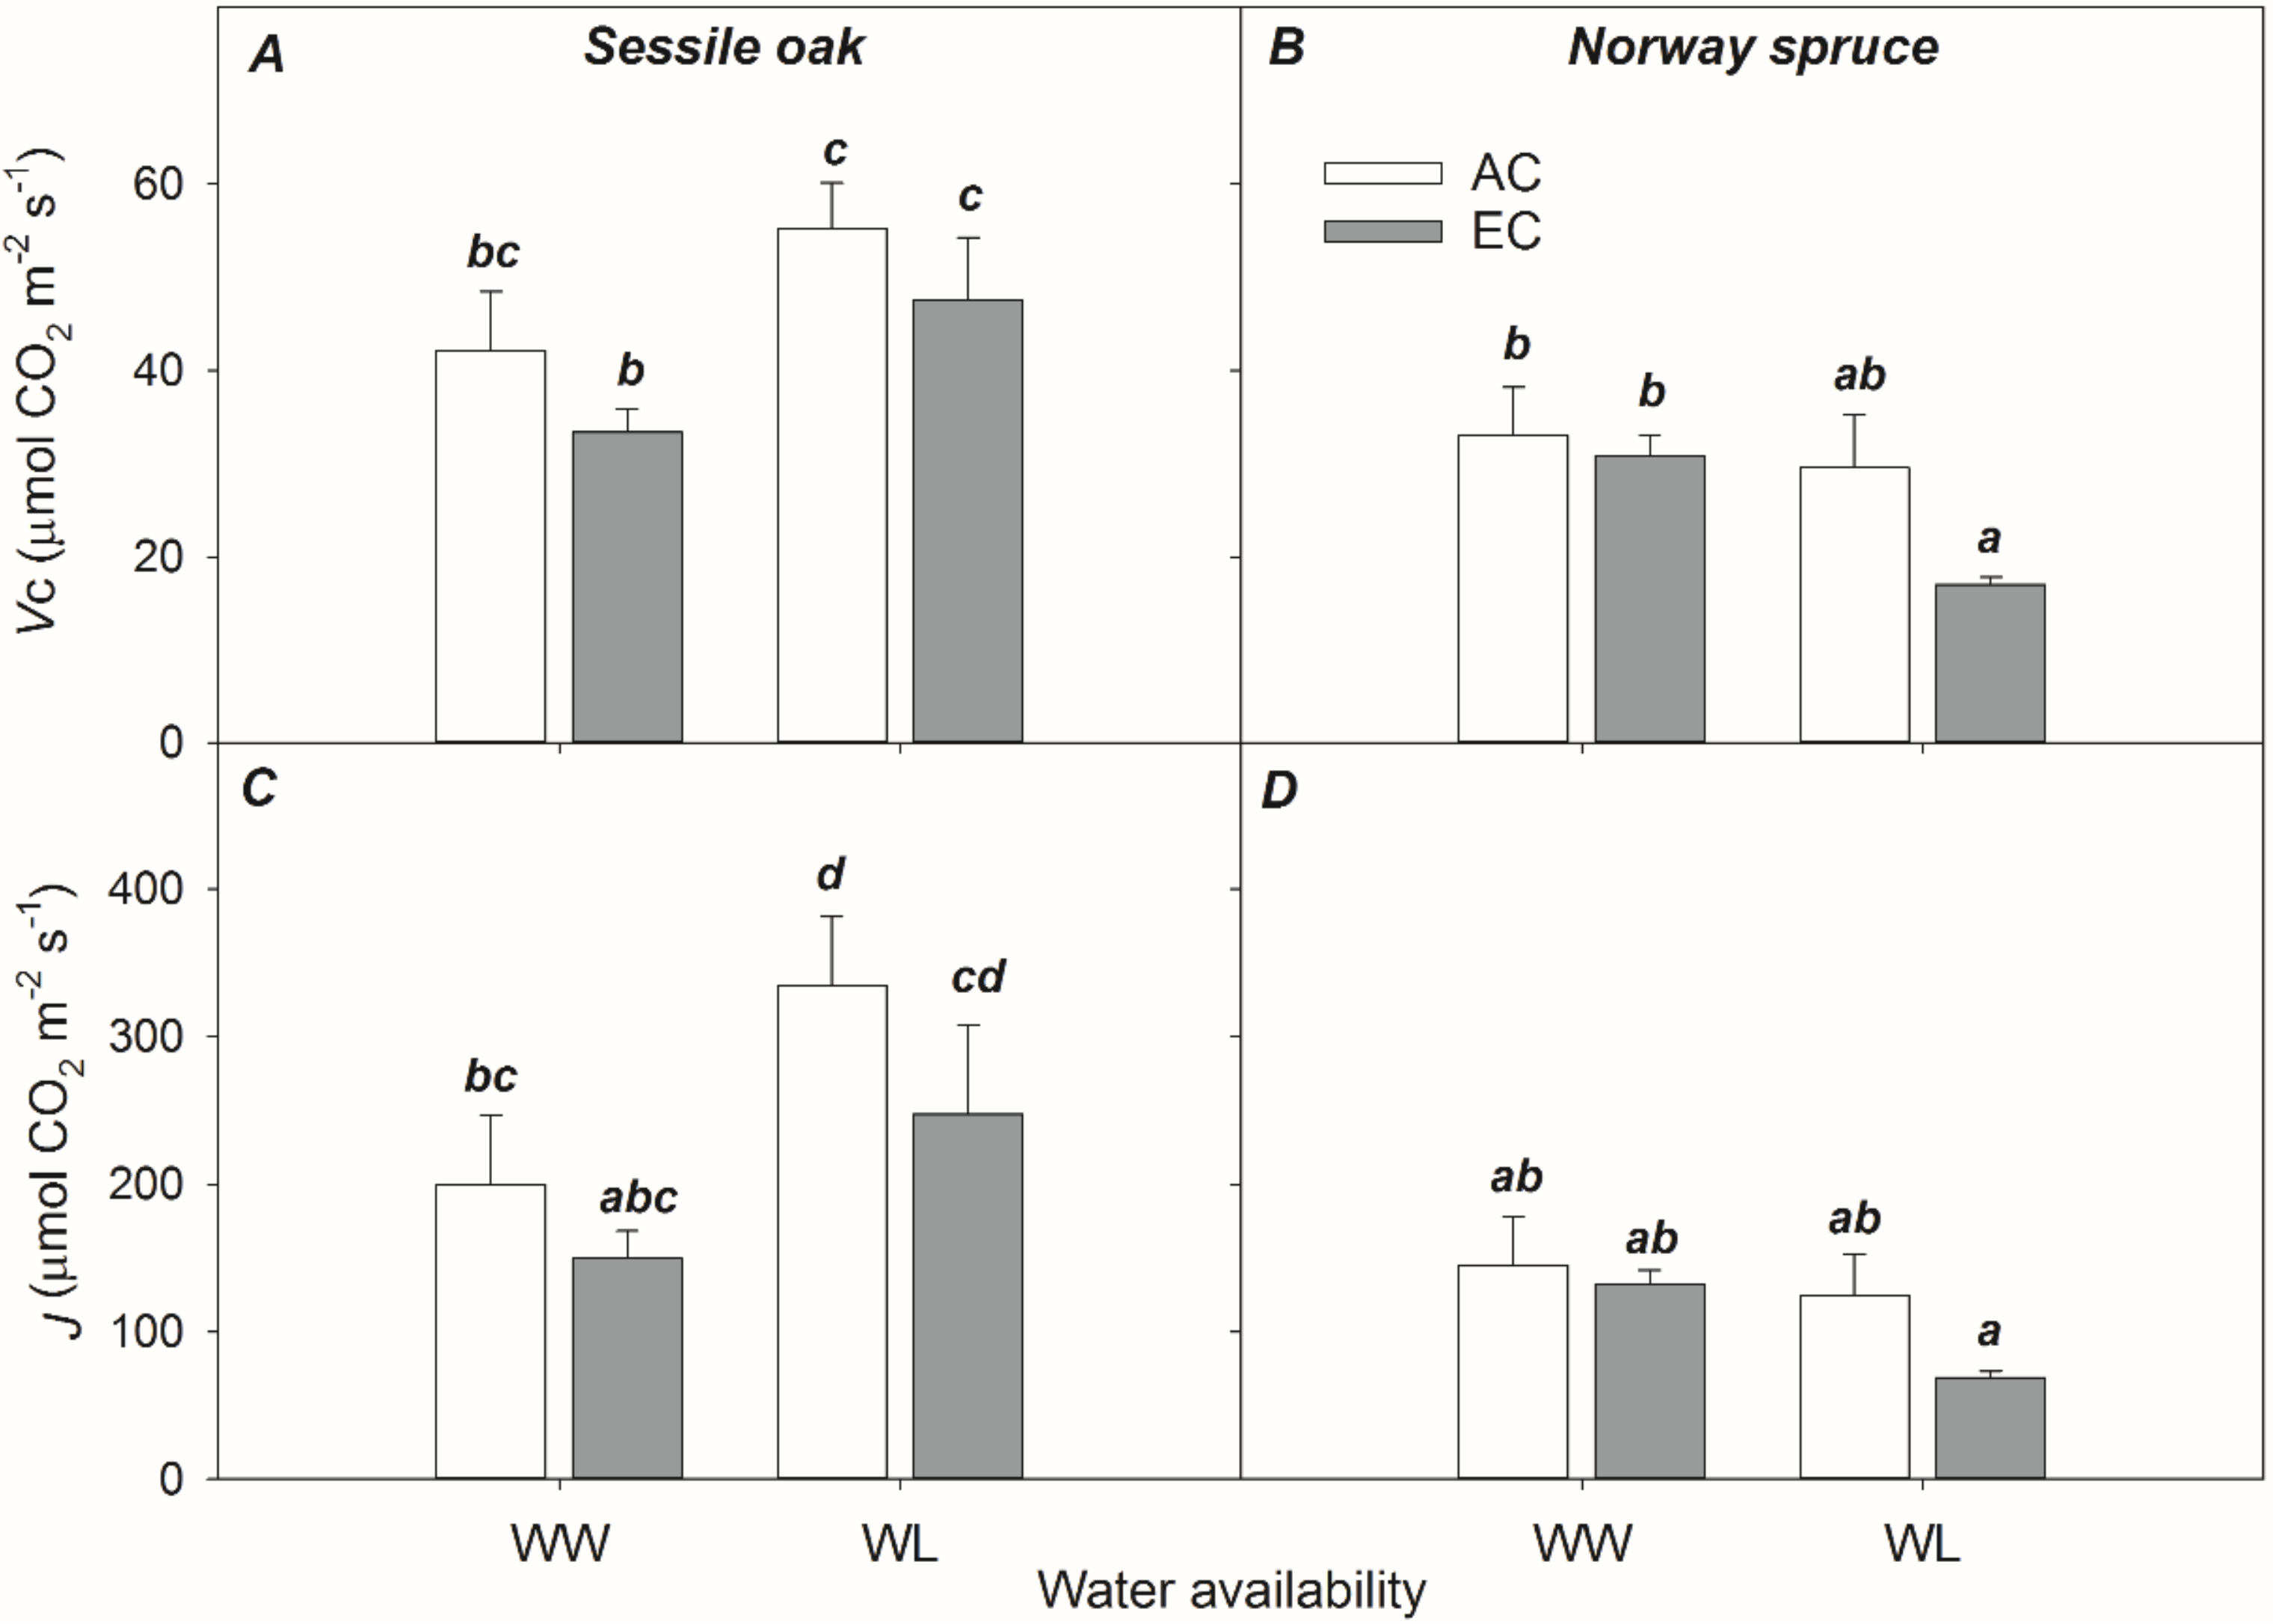
3.2.3. Biochemical Parameters Derived from ACi Response Curves

In vivo rates of Rubisco carboxylation (VC) and electron transport (J) were derived from ACi response curves measured at saturating light intensity and a temperature of 25 °C. Analysis of variance revealed significant effects of tree species and [CO2] on both parameters, while water availability has significant effect only on J (Table 1). Moreover, significant interactive effects of tree species and water availability on VC and J were found. In contrast, no interactive effects of [CO2] with other investigated factors were observed (Table 1).
WL treatment increased VC and J values under both [CO2] conditions in sessile oak saplings, but not in Norway spruce (Figure 5). EC treatment tended to reduce VC and J in oak as well as spruce saplings under both water regimes. These changes, however, are not statistically significant (p > 0.05). The J/VC ratio for EC-WW (4.24) and AC-WL (6.42) were the lowest and highest, respectively, for sessile oak saplings, whereas EC-WL (3.98) and AC-WW (4.73) were the lowest and highest, respectively, for Norway spruce. Values of VC and J were linearly correlated in both tree species irrespective of [CO2] and water availability (Figure 6), suggesting a relatively constant balance between carboxylation and regeneration of RuBP.

3.3. Chl-F Parameters

Maximum quantum yield of PSII photochemistry (Fv/Fm) ranged between 0.790 and 0.810 (data not shown). The Fv/Fm ratio was not influenced by any investigated factor and/or their interactions. Under saturating light conditions, species-specific effects of [CO2] and water availability on ΦPSII and D were observed (see statistically significant interactions TS × [CO2] and TS × WA in Table 1). While ΦPSII values increased with increasing [CO2] and reduced water availability in oak, opposite trends were found in spruce (Figure 7A,B). These differences were, however, statistically not significant (p > 0.05). In contrast to ΦPSII changes, EC-induced differences in D were mostly statistically significant (p ≤ 0.05; Figure 7C,D). Significant interactive effect of TS × [CO2] × WA on investigated fluorescence parameters was not observed.

4. Discussion

4.1. Evaluation of Experimental Conditions

The experiment was carried out on a mountainous site receiving usually a large amount of precipitation (100–150 mm) during the summer months (July–August). The regular watering (20 mm per week) was designed to ensure a common total amount of natural precipitations, while water-limited treatment allowed no moisture into the soil for two months. Such experimental design agrees with expectations of increased frequency, duration, and severity of summer drought periods in the central European region [27]. Applied water regimes led to the desiccation of topsoil layers (5–10 cm), while the soil water content in deeper soil layers (30–40 cm) was unaffected by exclusion of precipitation. Although the experimental conditions led to a reduction of leaf water potentials in both tree species studied (Figure 2), changes in water potentials indicate a rather mild drought stress in both tree species investigated and particularly in oak. Species-specific differences are likely caused by the different architecture of the root system typical for these two species. We assume that the gradual desiccation of topsoil layer influenced particularly shallow-rooting spruce, while deep-rooting oak saplings remained less affected by the exclusion of precipitation. This assumption is supported by higher (less negative) Ψpre-dawn values found in oak then spruce saplings (Table 1).

4.2. Species Specificity in Response to Elevated CO2 and Water Availability

Elevated [CO2] induces many adaptive responses in plants, including reduced stomatal conductance, increased WUE, and stimulated root growth as well as accumulation of osmolytes and phyto-hormones [28,29,30,31]. Since these responses can increase resistance of plants to drought, enhanced resistance of future plants grown under EC conditions is likely. To test this hypothesis, tree species with distinct drought sensitivity and carbon sink capacity were selected. While oaks species are known as drought-tolerant species [17,32], spruce is significantly more drought-sensitive [15,16,33]. Higher sensitivity of spruce to water-limited conditions was indeed evident in the current study by the more pronounced reduction of leaf water potential (Figure 2), CO2 assimilation rate, transpiration, and increased WUE (Figure 3 and Figure 4). In general, measured values of physiological parameters are not so much reduced as observed in other studies on related tree species [15,16,17,18,34]. Exclusion of summer precipitation resulted even in slight increases of VC and J values in oak saplings. The stimulatory effect of mild stress conditions was observed also in other plant species [33,35].
Our results further show significant effect of tree species (Table 1) on most of the gas-exchange, chlorophyll fluorescence, and biochemical parameters investigated. In accordance with previous studies [6,25,28,35,36,37], we have found higher CO2 assimilation rate and capacity in well-watered broadleaved than coniferous trees under ambient [CO2] (Figure 3). Such findings are in agreement with higher values of VC, J, and GSmax in broadleaved saplings (Figure 3 and Figure 5) and document higher strength of carbon sinks in oak as compared to spruce.
Analysis of variance revealed the significant interactive effects of tree species and water availability on almost all parameters investigated (Table 1), while the significant interactive effects of tree species and [CO2] were found only for Asat, WUE, and both fluorescence parameters. Similarly, TS × [CO2] × WA had significant effects only on the assimilation capacity and parameters associated with WUE. Generally, well-watered oak saplings had higher stimulation of Amax by EC as compared to spruce saplings.
Our experiment showed that photosynthesis of Q. petraea was stimulated by elevated [CO2] (an increase of the Amax), but the stimulatory effect of elevated [CO2] diminished in P. abies under the WL conditions. Others have also shown that photosynthesis of sessile oak could be stimulated when subjected to mild drought (simulated or natural) and CO2 [38]. Nevertheless, most of physiological processes associated with photosynthetic carbon uptake tend to decline under severe drought conditions irrespective of [CO2] treatment [18,34]. As expected, water use efficiency improved too, especially in spruce saplings. However, enhancement of WUE in oak saplings was observable only under the combined effect of WL and elevated [CO2]. Such variability could be explained by a stronger CO2 effect on stomatal closure in broadleaved than in coniferous tree species [28,39].

4.2.1. Fluorescence Parameters

Primary photochemical reactions measured as a quantum yield of PSII photochemistry (ΦPSII) and thermal energy dissipation (D) show substantial species-specific response to a combined treatment of EC and WL. While ΦPSII tended to increase in oak under combined EC and WL conditions, substantial decrease was found in spruce (Figure 7). Such findings are consistent with species-specific responses in GSmax. Higher availability of intercellular [CO2] and faster Amax in oak represents higher sink strength for primary photochemical products ATP and NADPH, consequently leading to a higher rate of electron transport measured as ΦPSII [40]. In contrast, reduced carbon sink capacity in spruce saplings resulted in increased demands for alternative pathways of absorbed radiation energy, including non-radiative thermal dissipation (D). Such phenomena have been observed in many stressed plant species having closed stomata [12] and/or having reduced rate of photosynthetic CO2 uptake [41]. Reduced efficiency of photochemical reactions may, vice versa, lead to a deepening of photosynthetic down-regulation as reported in plants exposed to combined heat and drought stress [42] or elevated [CO2] when the stomata remain closed [5,43].

4.2.2. Gas-Exchange Parameters

We have found evidence of substantial photosynthetic down-regulation in spruce saplings exposed to combined impact of EC and WL, but not in oak which probably has access to water in the lower layers of the soil. Down-regulation was associated with decline in both CO2 assimilation capacity (Asat) as well as light-saturated rate of CO2 assimilation (Amax; Figure 3). These findings are in agreement with reduced values of J and VC (Figure 5) reflecting the reduction of RuBP- and Rubisco-limited rate of photosynthesis, respectively [44]. Such phenomena are often observable in sink-limited coniferous trees, while EC usually stimulates CO2 uptake in deciduous trees over long time periods [13,45]. Here we have shown, in addition, that down-regulation of photosynthesis is accelerated by insufficient water availability. Such interactive effects have received only limited attention so far [4,46]. Reduced J is in accordance with reduced ΦPSII value as described above. Suppressed VC in spruce saplings has been earlier linked to a decline in the total amount of Rubisco enzyme, and/or an increase of the proportion of inactive and active Rubisco forms [44]. Generally, biochemical adjustment, including phosphorus redistribution, nitrogen dilution, and/or inhibition of photosynthetic genes that are associated with photosynthetic down-regulation, are induced by an accumulation of non-structural assimilates in leaves [13,29].
Species-specific responses of trees to combined effects of elevated [CO2] and limited water availability could arise from their biological and environmental diversity [39], different feedback mechanisms, such as their ability to export assimilates from leaves to roots and avoiding photosynthetic down-regulation [47]. Moreover, plant metabolic activities can play a key role in the modulation of photosynthetic down-regulation through an accumulation of certain compounds under stress conditions. Drought, among others, triggers increases in contents of some monosaccharides, disaccharides, and their derivatives. These sugars serve as osmolytes, anti-oxidative protectants, and provide energy during drought stress to minimize negative impacts of drought on plants [31]. Accordingly, we assume that an over-accumulation of these assimilates protecting plants against stress conditions may consequently lead to a transient down-regulation of photosynthesis under elevated [CO2].
On the other hand, long-term exposure to elevated [CO2] is known to stimulate root growth [30,48], rooting depth, and proportion of fine roots [49]. Development of the root system could lead to a better acquisition of water and mineral nutrients having a positive effect on stomatal conductance and photosynthesis [50,51]. Accordingly, such morphological adjustment results in a positive effect of elevated [CO2] on photosynthesis in arid regions [4,52], and/or periods of insufficient water availability [13]. In accordance with these findings, we observed an increase of WUE under elevated [CO2] in deep-rooting oak only under WL conditions, while it remained unchanged in well-watered oaks (Figure 4). In contrast, [CO2]-enhanced WUE was found in shallow-rooting spruce irrespective of water regime. Similar species-specific responses were reported by Picon et al. [17] in drought-tolerant Q. petraea and drought-avoiding Pinus pinaster.

5. Conclusions

Limited research has explored responses of mountainous trees to future climate conditions. Accordingly, we have investigated species-specific responses of two widespread tree species of the temperate zone—Norway spruce and sessile oak—exposed to a combined impact of elevated [CO2] and excluded summer precipitation. The experimental setup resulted in a desiccation of the topsoil layers, but not deeper ones. Limited water availability influenced particularly shallow-rooting spruce, while deep-rooting oak saplings remained less affected as documented by higher Ψpre-dawn values. In general, changes in leaf water potential revealed rather mild drought stress. Under water-limited conditions, down-regulation of photosynthesis by elevated [CO2] was observed in drought-sensitive coniferous spruce, but it remained stimulated in drought-tolerant deciduous oak. Down-regulation was associated with reduction of RuBP- as well as Rubisco-limited rate of photosynthesis. We conclude that elevated [CO2] increases resistance to reduced summer precipitation in oak, but not in spruce. Our results thus suggest a strong species-specific response of trees and a limited compensatory effect of elevated [CO2] against even mild drought conditions in coniferous spruce.

Author Contributions

Conceptualization, K.K.O.-A., K.K., and O.U.; methodology, K.K.O.-A., K.K., P.H., and O.U.; validation, K.K.O.-A., K.K., and O.U.; field sampling design, K.K., B.V., O.U., P.H., and K.K.OA.; formal analysis, K.K., K.K.O.-A., and O.U.; investigation, K.K., B.V., O.U., P.H., and K.K.O-A.; resources, M.V.M., K.K., and O.U.; data curation, K.K., B.V., and O.U.; writing—original draft preparation, K.K.O.-A., O.U., and T.A.; writing—review and editing, O.U., K.K.O.-A., T.A., K.K., and J.G.; visualization, O.U., K.K.O.-A., K.K., and J.G.; supervision, O.U., M.V.M., K.K., and J.G. All authors have read and agreed to the published version of the manuscript.

Funding

This work is part of the research supported by the Czech Science Foundation (grant no. 18-23702S), and by Ministry of Education, Youth and Sports of the Czech Republic (grant no. CZ.02.1.01/0.0/0.0/16_019/0000797; SustES—Adaptation strategies for sustainable ecosystem services and food security under adverse environmental conditions).

Data Availability Statement

The data presented in this study are available on request from the corresponding author.

Conflicts of Interest

The authors declare no conflict of interest.

References

  1. Ciais, P.; Sabine, C.; Bala, G.; Bopp, L.; Brovkin, V.; Canadell, J.; Chhabra, A.; DeFries, R.; Galloway, J.; Heimann, M.; et al. Carbon and other biogeochemical cycles. In Climate Change 2013: The Physical Science Basis. Contribution of Working Group I to the Fifth Assessment Report of the Intergovernmental Panel on Climate Change; Stocker, T.F., Qin, D., Plattner, G.-K., Tignor, M., Allen, S.K., Boschung, J., Nauels, A., Xia, Y., Bex, V., Midgley, P.M., Eds.; Cambridge University Press: Cambridge, UK, 2014; pp. 465–570. [Google Scholar]
  2. Intergovernmental Panel on climate Chage (IPCC). Climate Change 2014: Synthesis Report. Contribution of Working Groups I, II and III to the Fifth Assessment Report of the Intergovernmental Panel on Climate Change; Core Writing Team, Pachauri, R.K., Meyer, L.A., Eds.; IPCC: Geneva, Switzerland, 2014; pp. 1–151. [Google Scholar]
  3. Körner, C.; Asshoff, R.; Bignucolo, O.; Hättenschwiler, S.; Keel, S.G.; Peláez-Riedl, S.; Pepin, S.; Siegwolf, R.T.; Zotz, G. Carbon flux and growth in mature deciduous forest trees exposed to elevated CO2. Science 2005, 309, 1360–1362. [Google Scholar] [CrossRef] [PubMed] [Green Version]
  4. Leuzinger, S.; Körner, C. Water savings in mature deciduous forest trees under elevated CO2. Glob. Chang. Biol. 2007, 13, 2498–2508. [Google Scholar] [CrossRef]
  5. Urban, O.; Klem, K.; Holišová, P.; Šigut, L.; Šprtová, M.; Teslová-Navrátilová, P.; Zitová, M.; Špunda, V.; Marek, M.V.; Grace, J. Impact of elevated CO2 concentration on dynamics of leaf photosynthesis in Fagus sylvatica is modulated by sky conditions. Environ. Pollut. 2014, 185, 271–280. [Google Scholar] [CrossRef] [PubMed] [Green Version]
  6. Medlyn, B.E.; Badeck, F.W.; De Pury, D.G.G.; Barton, C.V.M.; Broadmeadow, M.; Ceulemans, R.; De Angelis, P.; Forstreuter, M.; Jach, M.E.; Kellomäki, S.; et al. Effects of elevated [CO2] on photosynthesis in European forest species: A meta-analysis of model parameters. Plant Cell Environ. 1999, 22, 1475–1495. [Google Scholar] [CrossRef]
  7. Crafts-Brandner, S.J.; Salvucci, M.E. Rubisco activase constrains the photosynthetic potential of leaves at high temperature and CO2. Proc. Natl. Acad. Sci. USA 2000, 97, 13430–13435. [Google Scholar] [CrossRef] [Green Version]
  8. Yamori, W.; Hikosaka, K.; Way, D.A. Temperature response of photosynthesis in C3, C4, and CAM plants: Temperature acclimation and temperature adaptation. Photosynth. Res. 2014, 119, 101–117. [Google Scholar] [CrossRef]
  9. Badger, M.R.; von Caemmerer, S.; Ruuska, S.; Nakano, H. Electron flow to oxygen in higher plants and algae: Rates and control of direct photoreduction (Mehler reaction) and rubisco oxygenase. Philos. Trans. R. Soc. B Biol. Sci. 2000, 355, 1433–1446. [Google Scholar] [CrossRef] [Green Version]
  10. Sage, R.F.; Kubien, D.S. The temperature response of C3 and C4 photosynthesis. Plant Cell Environ. 2007, 30, 1086–1106. [Google Scholar] [CrossRef]
  11. Ruan, C.J.; Shao, H.B.; Teixeira da Silva, J.A. A critical review on the improvement of photosynthetic carbon assimilation in C3 plants using genetic engineering. Crit. Rev. Biotechnol. 2012, 32, 1–21. [Google Scholar] [CrossRef]
  12. Xu, Z.; Jiang, Y.; Jia, B.; Zhou, G. Elevated-CO2 response of stomata and its dependence on environmental factors. Front. Plant Sci. 2016, 7, 657. [Google Scholar] [CrossRef] [Green Version]
  13. Leakey, A.D.; Ainsworth, E.A.; Bernacchi, C.J.; Rogers, A.; Long, S.P.; Ort, D.R. Elevated CO2 effects on plant carbon, nitrogen, and water relations: Six important lessons from FACE. J. Exp. Bot. 2009, 60, 2859–2876. [Google Scholar] [CrossRef] [PubMed]
  14. Bloom, A.J.; Asensio, J.S.; Randall, L.; Rachmilevitch, S.; Cousins, A.B.; Carlisle, E.A. CO2 enrichment inhibits shoot nitrate assimilation in C3 but not C4 plants and slows growth under nitrate in C3 plants. Ecology 2012, 93, 355–367. [Google Scholar] [CrossRef] [PubMed]
  15. Townend, J. Effects of elevated carbon dioxide and drought on the growth and physiology of clonal Sitka spruce plants (Picea sitchensis (Bong.) Carr.). Tree Physiol. 1993, 13, 389–399. [Google Scholar] [CrossRef] [PubMed]
  16. Dixon, M.; Thiec, D.L.; Garrec, J.P. The growth and gas exchange response of soil-planted Norway spruce [Picea abies (L.) Karst.] and red oak (Quercus rubra L.) exposed to elevated CO2 and to naturally occurring drought. New Phytol. 1995, 129, 265–273. [Google Scholar] [CrossRef]
  17. Picon, C.; Guehl, J.M.; Ferhi, A. Leaf gas exchange and carbon isotope composition responses to drought in a drought-avoiding (Pinus pinaster) and a drought-tolerant (Quercus petraea) species under present and elevated atmospheric CO2 concentrations. Plant Cell Environ. 1996, 19, 182–190. [Google Scholar] [CrossRef]
  18. Picon, C.; Guehl, J.M.; Aussenac, G. Growth dynamics, transpiration and water-use efficiency in Quercus robur plants submitted to elevated CO2 and drought. Ann. Sci. For. 1996, 53, 431–446. [Google Scholar] [CrossRef] [Green Version]
  19. Tingey, D.T.; Phillips, D.L.; Johnson, M.G. Elevated CO2 and conifer roots: Effects on growth, life span and turnover. New Phytol. 2000, 147, 87–103. [Google Scholar] [CrossRef]
  20. Mildner, M.; Bader, M.K.F.; Baumann, C.; Körner, C. Respiratory fluxes and fine root responses in mature Picea abies trees exposed to elevated atmospheric CO2 concentrations. Biogeochemistry 2015, 124, 95–111. [Google Scholar] [CrossRef]
  21. Arora, V.K.; Boer, G.J.; Christian, J.R.; Curry, C.L.; Denman, K.L.; Zahariev, K.; Flato, G.M.; Scinocca, J.F.; Merryfield, W.J.; Lee, W.G. The effect of terrestrial photosynthesis down regulation on the twentieth-century carbon budget simulated with the CCCma Earth System Model. J. Clim. 2009, 22, 6066–6088. [Google Scholar] [CrossRef]
  22. Ruiz-Vera, U.M.; De Souza, A.P.; Long, S.P.; Ort, D.R. The role of sink strength and nitrogen availability in the down-regulation of photosynthetic capacity in field-grown Nicotiana tabacum L. at elevated CO2 concentration. Front. Plant Sci. 2017, 8, 998. [Google Scholar] [CrossRef]
  23. Urban, O.; Janouš, D.; Pokorný, R.; Marková, I.; Pavelka, M.; Fojtík, Z.; Šprtová, M.; Kalina, J.; Marek, M.V. Glass domes with adjustable windows: A novel technique for exposing juvenile forest stands to elevated CO2 concentration. Photosynthetica 2001, 39, 395–401. [Google Scholar] [CrossRef]
  24. Holub, P.; Klem, K.; Linder, S.; Urban, O. Distinct seasonal dynamics of responses to elevated CO2 in two understorey grass species differing in shade-tolerance. Ecol. Evol. 2019, 9, 13663–13677. [Google Scholar] [CrossRef] [PubMed]
  25. Urban, O.; Hrstka, M.; Holub, P.; Veselá, B.; Večeřová, K.; Novotná, K.; Grace, J.; Klem, K. Interactive effects of ultraviolet radiation and elevated CO2 concentration on photosynthetic characteristics of European beech saplings during the vegetation season. Plant Physiol. Biochem. 2019, 134, 20–30. [Google Scholar] [CrossRef] [PubMed]
  26. Demmig-Adams, B.; Adams, W.W.; Barker, D.H.; Logan, B.A.; Bowling, D.R.; Verhoeven, A.S. Using chlorophyll fluorescence to assess the fraction of absorbed light allocated to thermal dissipation of excess excitation. Physiol. Plant. 1996, 98, 253–264. [Google Scholar] [CrossRef]
  27. Trnka, M.; Balek, J.; Štěpánek, P.; Zahradníček, P.; Možný, M.; Eitzinger, J.; Žalud, Z.; Formayer, H.; Turna, M.; Nejedlík, P.; et al. Drought trends over part of Central Europe between 1961 and 2014. Clim. Res. 2016, 70, 143–160. [Google Scholar] [CrossRef] [Green Version]
  28. Medlyn, B.E.; Barton, C.V.M.; Broadmeadow, M.S.J.; Ceulemans, R.; De Angelis, P.; Forstreuter, M.; Freeman, M.; Jackson, S.B.; Kellomaki, S.; Laitat, E.; et al. Stomatal conductance of forest species after long-term exposure to elevated CO2 concentration: A synthesis. New Phytol. 2001, 149, 247–264. [Google Scholar] [CrossRef]
  29. Urban, O. Physiological impacts of elevated CO2 concentration ranging from molecular to whole plant responses. Photosynthetica 2003, 41, 9–20. [Google Scholar] [CrossRef]
  30. Dieleman, W.I.; Luyssaert, S.; Rey, A.; de Angelis, P.; Barton, C.V.; Broadmeadow, M.S.; Broadmeadow, S.B.; Chigwerewe, K.S.; Crookshanks, M.; Dufrêne, E.; et al. Soil [N] modulates soil C cycling in CO2-fumigated tree stands: A meta-analysis. Plant Cell Environ. 2010, 33, 2001–2011. [Google Scholar] [CrossRef]
  31. Sardans, J.; Gargallo-Garriga, A.; Urban, O.; Klem, K.; Walker, T.W.N.; Holub, P.; Janssens, I.A.; Peñuelas, J. Ecometabolomics for a better understanding of plant responses and acclimation to abiotic factors linked to global change. Metabolites 2020, 10, 239. [Google Scholar] [CrossRef]
  32. Moran-Lopez, T.; Poyatos, R.; Llorens, P.; Sabate, S. Effects of past growth trends and current water use strategies on Scots pine and pubescent oak drought sensitivity. Eur. J. For. Res. 2014, 133, 369–382. [Google Scholar] [CrossRef]
  33. Lévesque, M.; Saurer, M.; Siegwolf, R.; Eilmann, B.; Brang, P.; Bugmann, H.; Rigling, A. Drought response of five conifer species under contrasting water availability suggests high vulnerability of Norway spruce and European larch. Glob. Chang. Biol. 2013, 19, 3184–3199. [Google Scholar] [CrossRef] [PubMed]
  34. Raftoyannis, Y.; Radoglou, K. Physiological responses of beech and sessile oak in a natural mixed stand during a dry summer. Ann. Bot. 2002, 89, 723–730. [Google Scholar] [CrossRef] [PubMed] [Green Version]
  35. Lichtenthaler, H.K.; Ač, A.; Marek, M.V.; Kalina, J.; Urban, O. Differences in pigment composition, photosynthetic rates and chlorophyll fluorescence images of sun and shade leaves of four tree species. Plant Physiol. Biochem. 2007, 45, 577–588. [Google Scholar] [CrossRef] [PubMed]
  36. Košvancová, M.; Urban, O.; Šprtová, M.; Hrstka, M.; Kalina, J.; Tomášková, I.; Špunda, V.; Marek, M.V. Photosynthetic induction in broadleaved Fagus sylvatica and coniferous Picea abies cultivated under ambient and elevated CO2 concentrations. Plant Sci. 2009, 177, 123–130. [Google Scholar] [CrossRef]
  37. Goltsev, V.N.; Kalaji, H.M.; Paunov, M.; Baba, W.; Horaczek, T.; Mojski, J.; Kociel, H.; Allakhverdiev, S.I. Variable chlorophyll fluorescence and its use for assessing physiological condition of plant photosynthetic apparatus. Russ. J. Plant Physiol. 2016, 63, 869–893. [Google Scholar] [CrossRef]
  38. Vander Mijnsbrugge, K.; Turcsán, A.; Maes, J.; Duchêne, N.; Meeus, S.; Steppe, K.; Steenackers, M. Repeated summer drought and re-watering during the first growing year of oak (Quercus petraea) delay autumn senescence and bud burst in the following spring. Front. Plant Sci. 2016, 7, 419. [Google Scholar] [CrossRef]
  39. Klein, T.; Ramon, U. Stomatal sensitivity to CO2 diverges between angiosperm and gymnosperm tree species. Funct. Ecol. 2019, 33, 1411–1424. [Google Scholar] [CrossRef]
  40. Mishra, K.B.; Mishra, A.; Novotná, K.; Rapantová, B.; Hodaňová, P.; Urban, O.; Klem, K. Chlorophyll a fluorescence, under half of the adaptive growth-irradiance, for high-throughput sensing of leaf-water deficit in Arabidopsis thaliana accessions. Plant Methods 2016, 12, 46. [Google Scholar] [CrossRef] [Green Version]
  41. Kitao, M.; Koike, T.; Tobita, H.; Maruyama, Y. Elevated CO2 and limited nitrogen nutrition can restrict excitation energy dissipation in photosystem II of Japanese white birch (Betula platyphylla var. japonica) leaves. Physiol. Plant 2005, 125, 64–73. [Google Scholar] [CrossRef]
  42. Killi, D.; Bussotti, F.; Raschi, A.; Haworth, M. Adaptation to high temperature mitigates the impact of water deficit during combined heat and drought stress in C3 sunflower and C4 maize varieties with contrasting drought tolerance. Physiol. Plant 2017, 159, 130–147. [Google Scholar] [CrossRef]
  43. Wang, M.; Xie, B.; Fu, Y.; Dong, C.; Hui, L.; Guanghui, L.; Liu, H. Effects of different elevated CO2 concentrations on chlorophyll contents, gas exchange, water use efficiency, and PSII activity on C3 and C4 cereal crops in a closed artificial ecosystem. Photosynth. Res. 2015, 126, 351–362. [Google Scholar] [CrossRef] [PubMed]
  44. Urban, O.; Hrstka, M.; Zitová, M.; Holišová, P.; Šprtová, M.; Klem, K.; Calfapietra, C.; De Angelis, P.; Marek, M.V. Effect of season, needle age and elevated CO2 concentration on photosynthesis and Rubisco acclimation in Picea abies. Plant Physiol. Biochem. 2012, 58, 135–141. [Google Scholar] [CrossRef] [PubMed]
  45. Norby, R.J.; Warren, J.M.; Iversen, C.M.; Medlyn, B.E.; McMurtrie, R.E. CO2 enhancement of forest productivity constrained by limited nitrogen availability. Proc. Natl. Acad. Sci. USA 2010, 107, 19368–19373. [Google Scholar] [CrossRef] [PubMed] [Green Version]
  46. Way, D.A.; Oren, R.; Kroner, Y. The space-time continuum: The effects of elevated CO2 and temperature on trees and the importance of scaling. Plant Cell Environ. 2015, 38, 991–1007. [Google Scholar] [CrossRef]
  47. Davey, P.A.; Olcer, H.; Zakhleniuk, O.; Bernacchi, C.J.; Calfapietra, C.; Long, S.P.; Raines, C.A. Can fast-growing plantation trees escape biochemical down-regulation of photosynthesis when grown throughout their complete production cycle in the open air under elevated carbon dioxide? Plant Cell Environ. 2006, 29, 1235–1244. [Google Scholar] [CrossRef]
  48. Pendall, E.; Bridgham, S.; Hanson, P.J.; Hungate, B.; Kicklighter, D.W.; Johnson, D.W.; Law, B.E.; Luo, Y.Q.; Megonigal, J.P.; Olsrud, M.; et al. Below-ground process responses to elevated CO2 and temperature: A discussion of observations, measurement methods, and models. New Phytol. 2004, 162, 311–322. [Google Scholar] [CrossRef]
  49. Iversen, C.M. Digging deeper: Fine-root responses to rising atmospheric CO2 concentration in forested ecosystems. New Phytol. 2010, 186, 346–357. [Google Scholar] [CrossRef]
  50. Ainsworth, E.A.; Rogers, A. The response of photosynthesis and stomatal conductance to rising [CO2]: Mechanisms and environmental interactions. Plant Cell Environ. 2007, 30, 258–270. [Google Scholar] [CrossRef]
  51. Polley, H.; Johnson, H.; Fay, P.; Sanabria, J. Initial response of evapotranspiration from tallgrass prairie vegetation to CO2 at subambient to elevated concentrations. Funct. Ecol. 2008, 22, 163–171. [Google Scholar]
  52. Kanniah, K.D.; Beringer, J.; Hurley, L. Exploring the link between clouds, radiation, and canopy productivity of tropical savannas. Agric. For. Meteorol. 2013, 182, 304–313. [Google Scholar] [CrossRef]
Figure 1. Photograph of cultivation domes with adjustable lamellar windows (top panel) and schematic drawing of the experiment layout (bottom panel). Each dome was divided into six blocks. Individual blocks (repetition; n = 3) are bounded by a thin black line. Open blocks = well-watered treatment (gular watering of 20 mm per week during vegetation period); colored blocks = water-limited treatment (no irrigation for 5 weeks before the measurements); AC = ambient CO2 concentration (~400 µmol CO2 mol–1); EC = elevated CO2 concentration (~700 µmol CO2 mol–1).
Forests 12 00042 g001
Figure 2. Effect of CO2 concentration and water availability on pre-dawn leaf water potential (Ψpre-dawn) and noon leaf water potential (Ψnoon) in sessile oak (left) and Norway spruce (right). Means (columns) and standard deviations (error bars) are presented (n = 3). Different letters indicate significant differences (p ≤ 0.05) between means based on Tukey’s ANOVA post-hoc test. AC—ambient CO2 concentration (~400 µmol CO2 mol–1), EC—elevated CO2 concentration (~700 µmol CO2 mol–1), WW—well-watered (regular watering of 20 mm per week during vegetation period), WL—water-limited (no irrigation for 5 weeks before the measurements).
Forests 12 00042 g002
Figure 3. Effect of CO2 concentration and water availability on CO2 assimilation capacity (Asat; (A,B)), light-saturated CO2 assimilation rate at growth [CO2] (Amax; (C,D)) and light-saturated stomatal conductance (GSmax; (E,F)) in sessile oak (left) and Norway spruce (right). The measurements were done during the second growing season of cultivation under manipulated conditions: AC—ambient CO2 concentration (~400 µmol CO2 mol–1), EC—elevated CO2 concentration (~700 µmol CO2 mol–1), WW—well-watered (regular watering of 20 mm per week during vegetation period), WL—water-limited (no irrigation for 5 weeks before the measurements). Means (columns) and standard deviations (error bars) are presented (n = 3). Different letters indicate significant differences (p ≤ 0.05) between means based on Tukey’s ANOVA post-hoc test.
Forests 12 00042 g003
Figure 4. Effect of CO2 concentration and water availability on transpiration rate (Emax; (A,B)) and water use efficiency (WUE; (C,D)) at saturating light intensity in sessile oak (left) and Norway spruce (right) saplings. The measurements were made during the second growing season of cultivation under manipulated conditions: AC—ambient CO2 concentration (~400 µmol CO2 mol–1), EC—elevated CO2 concentration (~700 µmol CO2 mol–1), WW—well-watered (regular watering of 20 mm per week during vegetation period), WL—water-limited (no irrigation for 5 weeks before the measurements). Means (columns) and standard deviations (error bars) are presented (n = 3). Different letters indicate significant differences (p ≤ 0.05) between means based on Tukey’s ANOVA post-hoc test.
Forests 12 00042 g004
Figure 5. Effect of CO2 concentration and water availability on in vivo rates of Rubisco carboxylation (VC; (A,B)) and electron transport (J; (C,D)) in sessile oak (left) and Norway spruce (right) saplings. Both parameters were derived from ACi response curves estimated at saturating light intensity and temperature of 25 °C. The measurements were made during the second growing season of cultivation under manipulated conditions: AC—ambient CO2 concentration (~400 µmol CO2 mol–1), EC—elevated CO2 concentration (~700 µmol CO2 mol–1), WW—well-watered (regular watering of 20 mm per week during vegetation period), WL—water-limited (no irrigation for 5 weeks before the measurements). Means (columns) and standard deviations (error bars) are presented (n = 3). Different letters indicate significant differences (p ≤ 0.05) between means based on Tukey’s ANOVA post-hoc test.
Forests 12 00042 g005
Figure 6. Relationship between in vivo rates of Rubisco carboxylation (VC) and electron transport (J) at 25 °C in sessile oak and Norway spruce. The solid and dashed lines represent the linear regressions (Fit) of oak and spruce data, respectively. Coefficient of determination (R2) and significance level (**; p < 0.01) are shown.
Forests 12 00042 g006
Figure 7. Effect of CO2 concentration and water availability on actual quantum yield of PSII photochemistry (ΦPSII; upper panels) and thermal energy dissipation ((D); bottom panels) under saturating light intensity in sessile oak (left) and Norway spruce (right). Means (columns) and standard deviations (error bars) are presented (n = 3). Different letters indicate significant differences (p ≤ 0.05) between means based on Tukey’s ANOVA post-hoc test. AC—ambient CO2 concentration (~400 µmol CO2 mol–1), EC—elevated CO2 concentration (~700 µmol CO2 mol–1), WW—well-watered (regular watering of 20 mm per week during vegetation period), WL—water-limited (no irrigation for 5 weeks before the measurements).
Forests 12 00042 g007
Table 1. Summary of significance levels (p-values of the three-way ANOVA) for the factors of trees species (TS), CO2 concentration ([CO2]), water availability (WA), and their interactions (×) on physiological parameters (Ψpre-dawn—pre-dawn leaf water potential, Ψnoon—noon leaf water potential, Amax—light-saturated CO2 assimilation rate, GSmax—light-saturated stomatal conductance, Emax—light-saturated transpiration rate, and WUE—water use efficiency, VC—in vivo Rubisco carboxylation rate, J—in vivo electron transport rate, ΦPSII—actual quantum yield of PSII photochemistry under saturating light intensity, D—thermal energy dissipation under saturating light intensity). Bold p-values indicate significant effect at p ≤ 0.05.
FactorsΨpre-dawnΨnoonVCJAsatAmaxGSmaxEmaxWUEΦPSIID
TS<0.0010.036<0.001<0.001<0.001<0.001<0.001<0.0010.0010.134<0.001
[CO2]0.0010.217<0.0010.0030.6910.0080.5730.921<0.0010.5740.840
WA0.0020.0150.2110.0220.0170.0660.9700.9100.0080.3630.279
TS × [CO2]0.0860.7010.8270.265<0.0010.1280.2280.0710.0160.006<0.001
TS × WA0.3740.217<0.001<0.001<0.001<0.001<0.001<0.0010.6960.0470.002
[CO2] × WA0.3740.9560.2450.1910.0160.4520.0020.0100.0400.5660.973
TS × [CO2]× WA0.0860.7830.1560.9100.0100.1370.0060.0160.0050.6150.234
Publisher’s Note: MDPI stays neutral with regard to jurisdictional claims in published maps and institutional affiliations.

