Influence of Site-Specific Conditions on Estimation of Forest above Ground Biomass from Airborne Laser Scanning
by
 ,
,
Jan Novotný
1,*, 
Barbora Navrátilová
1,
Růžena Janoutová
1,
Filip Oulehle
1,2 and
Lucie Homolová
1 1
Global Change Research Institute of the Czech Academy of Sciences, Bělidla 986/4a, 603 00 Brno, Czech Republic
2
Czech Geological Survey, Klárov 131/3, 118 21 Prague, Czech Republic
*
Author to whom correspondence should be addressed.
Forests 2020, 11(3), 268; https://doi.org/10.3390/f11030268
Submission received: 30 January 2020
/
Revised: 13 February 2020
/
Accepted: 23 February 2020
/
Published: 27 February 2020
(This article belongs to the Special Issue Applications of Remote Sensing Data in Mapping of Forest Growing Stock and Biomass)
Abstract
:Forest aboveground biomass (AGB) is an important variable in assessing carbon stock or ecosystem functioning, as well as for forest management. Among methods of forest AGB estimation laser scanning attracts attention because it allows for detailed measurements of forest structure. Here we evaluated variables that influence forest AGB estimation from airborne laser scanning (ALS), specifically characteristics of ALS inputs and of a derived canopy height model (CHM), and role of allometric equations (local vs. global models) relating tree height, stem diameter (DBH), and crown radius. We used individual tree detection approach and analyzed forest inventory together with ALS data acquired for 11 stream catchments with dominant Norway spruce forest cover in the Czech Republic. Results showed that the ALS input point densities (4–18 pt/m2) did not influence individual tree detection rates. Spatial resolution of the input CHM rasters had a greater impact, resulting in higher detection rates for CHMs with pixel size 0.5 m than 1.0 m for all tree height categories. In total 12 scenarios with different allometric equations for estimating stem DBH from ALS-derived tree height were used in empirical models for AGB estimation. Global DBH models tend to underestimate AGB in young stands and overestimate AGB in mature stands. Using different allometric equations can yield uncertainty in AGB estimates of between 16 and 84 tons per hectare, which in relative values corresponds to between 6% and 37% of the mean AGB per catchment. Therefore, allometric equations (mainly for DBH estimation) should be applied with care and we recommend, if possible, to establish one’s own site-specific models. If that is not feasible, the global allometric models developed here, from a broad variety of spruce forest sites, can be potentially applicable for the Central European region.
1. Introduction
Forests provide multiple ecosystem services at various spatial scales and constitute an important sink of sequestered atmospheric carbon [1,2]. Carbon stocks are an important input in climate models, and responsible forest management is a way to mitigate the impact of global climate change [3]. Accurate and consistent estimation of AGB can help to reduce current uncertainties regarding carbon fluxes [4,5]. Several methods exist for calculating AGB, these range from destructive methods to satellite-based estimations. Estimation can be improved by combining multiple approaches [6,7].
Traditionally, forest AGB and carbon stocks have been assessed by measuring tree dimensions in permanent field plots and then using allometric equations (e.g., [8,9]). In recent years, we have seen a move toward remote sensing as the primary tool for monitoring forest AGB and carbon stocks (e.g., [10]). The rapid development of laser scanning systems is making them great tools for estimating tree heights and forest biomass [11,12]. Airborne laser scanning (ALS), in particular, has been established as a standard technology for high-precision three-dimensional topographic data acquisition [13]. It has a powerful penetrating ability and can obtain vertical structure information for forests, thereby improving accuracy in estimating forest height and structure [14,15]. ALS is mostly operated in form of small-footprint discrete-return or waveform systems and allows for estimating AGB using area-based or individual tree detection approaches [16,17,18,19,20]. Because remote sensing-based AGB estimates are nevertheless indirect, high quality and large quantities of traditional field inventory data and AGB destructive sampling are still needed.
AGB estimates for both approaches depend upon canopy characteristics, such as tree branching and foliage structure, because these elements intercept laser pulses in various canopy height layers. Consequently, the accuracy of ALS-based AGB models can vary by species and forest types [21]. Bouvier et al. [22] demonstrated, that plot size significantly impacted AGB model performance within pine forest in southwestern France. The accuracy of ALS-based models can potentially vary with the ALS data point density. For instance, Montagnoli et al. [23] investigated the utility of low-density ALS data (<2 pt/m2) for estimating AGB within mixed broad-leaved forest in Italy. Wu et al. [24] reported an overall decreasing trend in error of ALS-derived AGB estimates as LiDAR point density increased from 0.5 to 8 pt/m2 within forested landscape in east-central Arizona. Brovkina et al. [25] used high point density LiDAR data (50 pt/m2) for AGB estimation within mixed spruce and beech forest in the Czech Republic.
The main objective of this study is to obtain deeper insight into variables that influence estimation of aboveground biomass from ALS data. Specifically, we will evaluate (i) the effect of various ALS point densities and spatial resolutions of input canopy height model rasters on individual tree detection, and (ii) the impact and transferability of site-specific relationships between tree height and stem diameter at breast height (DBH) on estimates of Norway spruce forest AGB in the Czech Republic. The first part of our study should provide suggestions which ALS data to choose for operational AGB estimation. The second part should fill a gap in assessment of uncertainty in AGB estimates caused by usage of allometric equation from different sources as this issue is rarely addressed in scientific literature.
2. Materials and Methods
The overall methodology of spruce forest AGB estimation from ALS data using the individual tree detection approach and testing the effects of various ALS inputs and allometric equations is depicted in Figure 1 and is described in further detail in the following sections.
2.1. Study Sites
Forest inventory and airborne laser scanning (ALS) data for this study were collected at 11 small forested stream catchments that are located across the Czech Republic (Figure 2). The catchments are part of the GEOMON network that was established primarily to study long-term effects of decreasing acid depositions on the recovery of forested ecosystems, and on soil and water chemistry. Field observations was begun in 1994 [26,27]. The catchments are predominantly covered by productive forests of Norway spruce (Picea abies L. Karst) and they represent a large variety of environmental conditions in the Czech Republic. Catchments’ characteristics are summarized in Table 1, and further details are provided by Oulehle et al. [27].
In addition to the sites from the GEOMON network, we also used forest inventory data from another site to test the impact of local allometric equations on AGB estimation. That external site, known as Bílý Kříž, is located in a mountainous area near the Czech Republic and Slovakia borders within the Moravian-Silesian Beskydy Mountains (49°30′N, 18°32′E, 800 to 920 m a.s.l.). It is an experimental research site for long-term monitoring of CO2 and energy fluxes of a Norway spruce forest monoculture (40 years old in 2018) and, as such, it is included into Integrated Carbon Observation System (ICOS). Site characteristics are reported in Table 1. Hereinafter, this site is referred to as “BK” and allometric equations computed for this site are labeled as “outside”.
2.2. Field Data
Field data (i.e., tree species identification, stem diameter at breast height (DBH), tree height (H), crown radius (R), height to crown base and crown completeness) were measured at the GEOMON sites during the 2015 vegetation season and in the case of NAZ during 2016. These parameters were recorded for all trees with DBH greater than 5 cm within a circular plot of 500 m2 (r = 12.6 m). In total, 81 forest inventory plots were sampled and the numbers of plots varied between 5 and 10 per catchment according to the area of each. Selection of the plots followed stratified random sampling, where strata were determined based on forest management maps, as well as local soil and orography conditions. The center of each plot was recorded using differential GPS with a horizontal accuracy of about 1 m. Mean values of the measured tree parameters per catchment are summarized in Table 2.
Field measurements for H and DBH of Norway spruce trees at the external site Bílý Kříž are recorded differently than at the GEOMON sites. This dataset contains H and DBH measurements that have been recorded in every vegetation season since 1997 for all trees with DBH > 2.0 cm growing within a fenced area (i.e., 290 trees measured in 2017, details in Table 2).
Field measurements of tree parameters were primarily used to construct empirical models (so-called allometric equations), which were either specific for each GEOMON catchment (local models) or for all catchments together (global models) or for the external site (outside models). The first set of allometric equations was established between R and H using a linear model (Equation (1)):
Estimates of R were used to tune a tree detection algorithm (described in Section 2.4). The second set of allometric equations was established between DBH and H using an exponential model (Equation (2), further labeled as local1, global1, or outside1) and a power model (Equation (3), further labeled as local 2, global 2, or outside 2):
DBH estimates were used to compute a single tree biomass and subsequently forest AGB.
The allometric equations (Equations (1)–(3)) were established for two tree species: the dominant Norway spruce and less abundant European beech. The spruce models were applied to all other coniferous trees found in our study sites. The allometric equation for European beech was created only as a global model, as there was not enough data for site-specific local models. The beech global model was applied to all other deciduous trees found in our study sites.
Before the allometric equations were constructed, the input field data were harmonized such that a comparable number of samples was selected across all catchments and all tree height categories. In the first step, all dead and broken trees were removed from the forest inventory database. In the second step, we used stratified random sampling to eliminate the influence of tree height distribution. The remaining trees were assigned into height categories at 5 m intervals (<5 m, 5–10 m, 10–15 m, etc.). From each height category, n samples were randomly selected (n = 20 for spruce local allometric equations, n = 40 for spruce global equations, n = 100 for spruce local equation established for Bílý Kříž, and n = 20 for beech global equation). According to Sullivan et al. [28], stratified sampling should produce smaller prediction error for larger sample pools. In the third step, the models (Equations (1)–(3)) were fitted to input data and outlying samples were removed based on 95% confidence interval of these preliminary models. Final models were constructed then by fitting Equations (1)–(3) to the cleaned data. The quality of the models was assessed by root mean square error (RMSE) computed between the predicted (P) and observed (O) values:
2.3. Airborne Laser Scanning Data
Airborne laser scanning data for 11 GEOMON sites (Table 2) were acquired during August 2017. ALS data were recorded using a Riegl LMS—Q780 scanner on board Flying Laboratory of Imaging Systems [29] that is operated by the Global Change Research Institute CAS (CzechGlobe). ALS data were recorded at two nominal pulse densities: 4 pulses per m2 (flight altitude at 1000 m above the ground level, further labeled as 1000 AGL) and 2 pulses per m2 (flight altitude at 2000 m above the ground level, further labeled as 2000 AGL). For larger catchments, the pulse densities were doubled due to 50% overlap between flight lines. Moreover, because the Riegl system allows for multiple echo recording, the real point cloud densities varied between 8 and 18 pt/m2 for datasets acquired at 1000 AGL and between 4 and 8 pt/m2 for datasets acquired at 2000 AGL.
Pre-processing of the raw ALS data encompassed full-waveform decomposition and georeferencing in RiProcess software (RIEGL GmbH) and exporting a point cloud in LAS format after a strip adjustment. In the next step, the point clouds were transformed into a canopy height model (CHM) raster. The CHM calculation included noise removal, ground filtering, and rasterization using the LAStools software package (Rapidlasso GmbH) and the approach reported by Khosravipour [30] to create a pit-free CHM. In total, four CHMs were prepared for each catchment (i.e., rasters with pixel sizes 0.5 m and 1.0 m for 1000 AGL and 2000 AGL data, respectively).
Because the assessment of ALS input data properties (point density and CHM pixel size) on tree detection and AGB estimates was part of this study, the ALS input datasets were compared at the level of point clouds and at the level of CHM first. We computed histograms for height distribution and descriptive statistics for the entire catchment area and per forest inventory plot.
2.4. Individual Tree Detection and Its Verification
Individual tree detection and estimation of tree H is a prerequisite step for AGB estimation. The individual tree detection was executed for four CHMs per catchment and furthermore expanded by two scenarios to evaluate the effect of local and global models estimating tree crown R. In total eight tree detection results were generated for each catchment. The tree detection algorithm is based on previous work of Novotný [31], and it was further extended and modified in this study. It is fully automated and implemented in Python. The algorithm requires several parameters to be specified by a user to optimize results of the tree detection. Parameter selection and description of basic steps in the algorithm are as follow:
- Identification of local maxima in CHM.
- Applying a forest mask to remove those local maxima that were not classified as trees. (We used a mask of coniferous, broadleaf, and non-forested areas that was prepared from airborne hyperspectral images acquired simultaneously with ALS. For the sake of brevity, this was not described in the methods section.)
- Removal of those local maxima lower than a certain threshold . (We used = 5 m.)
- Estimation of a crown R, which was computed as the weighted mean of R obtained from three methods:
- (a)
- allometric equation R = f(H) based on forest inventory data,
- (b)
- slope breaks—a distance from the local maxima (tree top) to the nearest place where the slope changes from decreasing to increasing,
- (c)
- semivariogram—a range value in a variogram model between height values and a distance from the local maxima.(We used weight factors wa = 0.6, wb = 0.2, wc = 0.1.)
- Removal of those local maxima closer to one another than an expected crown R of the higher tree.
- Removal of false tree detection at the edge of forest stands.(Here, we applied a condition that maximally 5% of all pixels within an expected crown R can be outside the range of .)
- Export to a point shapefile.
Accuracy of the individual tree detection could not be assessed by means of direct comparison with measured tree positions as these had not been recorded during the field surveys. Therefore, we selected six validation plots (50 × 50 m) from our ALS data and identified individual tree positions in the point cloud manually (hereafter termed reference trees). Each validation plot was located in a different catchment and these represented a variety of forest types in terms of mean tree height. Two plots represented forests with mean tree height less than 15 m, two plots were selected for mean tree height between 15 and 25 m, and the last two were selected for mean tree height greater than 25 m. Trees from manual and automated detections were paired by searching the closest neighborhood of our reference trees (in case of CHM with pixel size 0.5 m the maximum distance of three pixels was searched; in case of CHM with pixel size 1.0 m the maximum distance was two pixels). For each validation plot we computed detection, omission, and commission rates.
2.5. Biomass Estimation from ALS
Total AGB (computed as sum of its components including stems, branches, leaves) was computed according to equations established by Wirth et al. [32] for Norway spruce and by Wutzler et al. [33] for European beech and other deciduous tree species. All equations for AGB computation were chosen in their simplest forms, using DBH as the only input variable (summarized in Table 3).
The DBH field measurements were used directly to compute AGB for each field-surveyed plot and subsequently scaled up to represent the entire catchment area (further labeled as “field-based AGB”). The results of individual tree detection with the estimates of tree H from ALS were used to retrieve DBH first and then compute ALS-based estimates of AGB. We used six models for DBH recalculation from ALS-based tree H (local 1 and 2, global 1 and 2, outside 1 and 2). In combination with two input point cloud densities, two CHM pixel sizes, and two allometric equations predicting R from H (local and global), we had 48 scenarios for assessing the effect of different parameters.
The ALS-based AGB estimates were cross-compared between the scenarios and compared with the field-based results. The actual variable to be compared is AGB in tons per hectare of forest. We calculated this value for field data as the sum of AGB for individual trees divided by plot size times the percentage of forest cover. The mean value computed from all plots was taken as an estimate of AGB per catchment. We calculated AGB per plot from ALS data as the sum of individual trees inside a circle with an area of 1000 m2 around the plot center divided by the area times the percentage of forest cover. The decision to double the plot size (1000 for ALS vs. 500 for field) should minimize inaccuracies in geometric position (field GPS vs. aircraft IMU accuracy). We calculated AGB per catchment from ALS data as the sum of all individual trees divided by area of catchment times the percentage of forest cover. The forest cover was estimated from ALS point clouds and publicly available orthophoto maps using Google Earth to visually check differences in forest cover between 2015 and 2017.
Comparison between the ALS-based scenarios and with the field-based results was evaluated using linear fit, R2, and RMSE. Additionally, we evaluated dispersion of points around the 1:1 line and computed 1:1 error as:
3. Results and Discussions
3.1. Allometric Equations
The 11 small forested catchments from the GEOMON network used in this study represented broad regional variability in Norway spruce dominated forest stands. Field data were used to establish allometric equations to predict tree crown R and stem DBH from tree H. All allometric equations are summarized in Table 4. Only a simple linear model was tested for the tree crown R. Two models, the exponential (Equation (2)) and the power (Equation (3)) models, were tested for predicting stem DBH from tree H. Figure 3 shows examples of allometric equations used in spruce DBH estimation for two local sites (LYS and BK) and the global model for spruce and beech trees (graphs with the local allometric equations for all other sites are presented in the Supplementary Material S1).
The allometric equation for tree crown R estimation from tree H is important in our algorithm for individual tree detection from ALS data. However, as this relationship has scarcely any practical use in forest management, it is difficult to find reliable data or existing models in the scientific literature. Therefore, this linear relationship was determined solely from our available field data, with RMSE varying between 0.268 and 0.657 m for local models and equal to 0.553 m for the global model. Its use in tree detection is further discussed in Section 3.3, but, as the detection rates with the global model were generally higher for all tree height categories, we can consider the global model to be more robust and to slightly outperform the local models.
In forestry practice, the relationship between stem DBH and tree H is generally reported as H = f(DBH) and mathematically expressed using various models, including power, exponential, hyperbolic, and others [34]. For the purpose of AGB estimation from ALS, however, the reverse form of DBH = f(H) is required. Simple mathematical inversion is not always feasible, though, due to the asymptotic nature of the published models. Thanks to our own field data collected for a large variety of spruce trees, we could test two mathematical models: the exponential and power expression. RMSE of the exponential model varied between 2.499 and 4.654 m and RMSE of the power model varied between 2.624 and 4.983 m. Although for most of the catchments the exponential model resulted in lower RMSE than did the power model, for biomass estimation, the exponential model seemed to be more sensitive to tree H. For tall trees, therefore, it could yield unrealistic (too high) estimates of DBH and thus of AGB (further discussed in Section 3.4).
3.2. Comparison of ALS Input Data
Before the AGB estimation from the ALS data, we evaluated differences between two ALS input datasets with different point densities (1000 AGL, 2000 AGL). We compared histograms for height distributions extracted from point clouds, as well as from CHM rasters, for the entire catchment area and for each forest inventory plot. Figure 4 shows an example from the CER catchment (for brevity’s sake, the other sites are not presented). The histograms are not identical for point clouds and CHMs because the point cloud data contain all points (including multiple returns from the canopy profile), whereas the CHM rasters refer only to the top-of-canopy layer. Height distribution in CHM with 1 m resolution tends to be slightly shifted to the right compared to CHM with resolution 0.5 m. This is because the rasterization technique we used lays just one 1m pixel over a bunch of points instead of four 0.5 m pixels, which makes the tree tops (and crown borders) less sharp.
Comparison at the level of point clouds and CHM rasters showed very similar canopy height distributions across all the sites. Therefore, we could assume that the point densities of the ALS input data (1000 AGL vs. 2000 AGL) will likely not affect the results of individual tree detection and tree height estimation.
3.3. Tree Detection
Results of tree detection were obtained for eight scenarios combining four CHMs (pixel size 0.5 and 1.0 m, point density from 1000 AGL and 2000 AGL) and two allometric equations for tree crown R estimation. Results from the automated tree detection were verified for six validation squares distributed across three tree height categories (more precisely, located within ANE, CER, LIZ, PLB, UDL, and UHL catchments). In each case, detection and commission rates were computed for each tree height category and for all validation plots together (Figure 5). We achieved detection rates from 0.75 to 0.90, which is in line with other studies. For instance, Luo et al. [35] reported overall accuracy of 0.87 for comparison between automatically segmented trees and visual examination in Tahoe National Forest (USA). Wang et al. [7] reported R2 of 0.8–0.9 for comparison of plot-level field-based and ALS-based tree counts in Heihe River Basin (China).
Almost no differences in detection and commission rates were found between the results obtained from the ALS data of different point densities (1000 AGL, 2000 AGL). This had been expected after comparison of the ALS input data (Figure 4, Section 3.2). Similar conclusions had been reached by Bouvier et al. (2019), who reported almost no influence of ALS pulse densities (0.5, 1, 2, and 4 pulses per m2) on metrics derived for AGB estimation in a pine forest.
Pixel size of the input CHM raster had a stronger effect on tree detection. Detection rates varied between 0.78 and 0.90 for the CHM with 0.5 m pixel size, and lower values between 0.55 and 0.79 were found for the CHM with 1.0 m pixel size. On the contrary, higher commission rates (0.17–0.39) were found for the CHM with 0.5 m pixel size and lower values for the CHM with 1.0 m pixel size (0.05–0.19). Higher detection rates were found for the global model when we quantified the effect of global vs. local allometric equation used to estimate tree crown R in the tree detection phase.
Detection rates also varied between the tree height categories. Detection rates in forests with tree height below 15 m were lowest, whereas those rates for forests with tree height above 25 m were highest. Similar results had been found by Kaartinen et al. [36], who analyzed accuracies of tree detection from ALS data with point densities of 2, 4 and 8 pt/m2 in Southern Finland forests with prevailing Scots pine, Norway spruce, and silver birch. The best accuracy was observed for taller trees. For the local maxima method, the RMSE in tree location was estimated as 1.2 m, 0.7 m, and 0.5 m for tree height classes 10–15 m, 15–20 m, and >20 m, respectively.
From the point of view of the final AGB product, the effect of tree detection omission and commission errors compensated one another to some extent. We saw this especially in the tree height category 15–25 m with the local model and in the tree height category 25–35 m with the global model. One more interaction worth noting is that underestimating of the tree count can be compensated by an overestimation of the DBH model, thus ending up with a false agreement between field- and ALS-based AGB totals. This happened in our case with CHMs having 1.0 m pixel size.
Based on the results of the tree detection we eliminated half of our scenarios. For AGB assessment, we retained only the results of tree detection from CHM with pixel size of 0.5 m from 1000 AGL.
3.4. Biomass Estimation
AGB at plot level and at entire catchment level was computed for 12 scenarios using as input the CHM raster with pixel size 0.5 m from 1000 AGL. The 12 scenarios considered two allometric equations for tree crown R estimation and six allometric equations for tree stem DBH estimation (the power and the exponential local, global, and outside models).
Intercomparison between field-based and ALS-based AGB estimates at plot level is summarized for all scenarios in Table 5. RMSE between field- and ALS-based estimates varied between 93 and 171 t/ha (if we omit two outstanding scenarios with exceptionally high RMSE > 326 t/ha). In general, we can conclude that all ALS-based scenarios overestimated AGB especially for plots with taller trees and higher biomass in comparison with the field-based estimates. ALS-based AGB estimation derived using local allometric equations for both crown radius and DBH was the scenario with best precision as expressed by steep slope (1.054) and low offset (8.561) in linear fit which was also the tightest (R2 = 0.667, RMSE = 93 t/ha). All the plots of all three height classes were evenly distributed around the 1:1 line, which is expressed by the lowest value of 1:1 error equal to 0.264 (see Figure 6, and we refer our readers to the Supplementary Material S2 to see the same figure for the other scenarios).
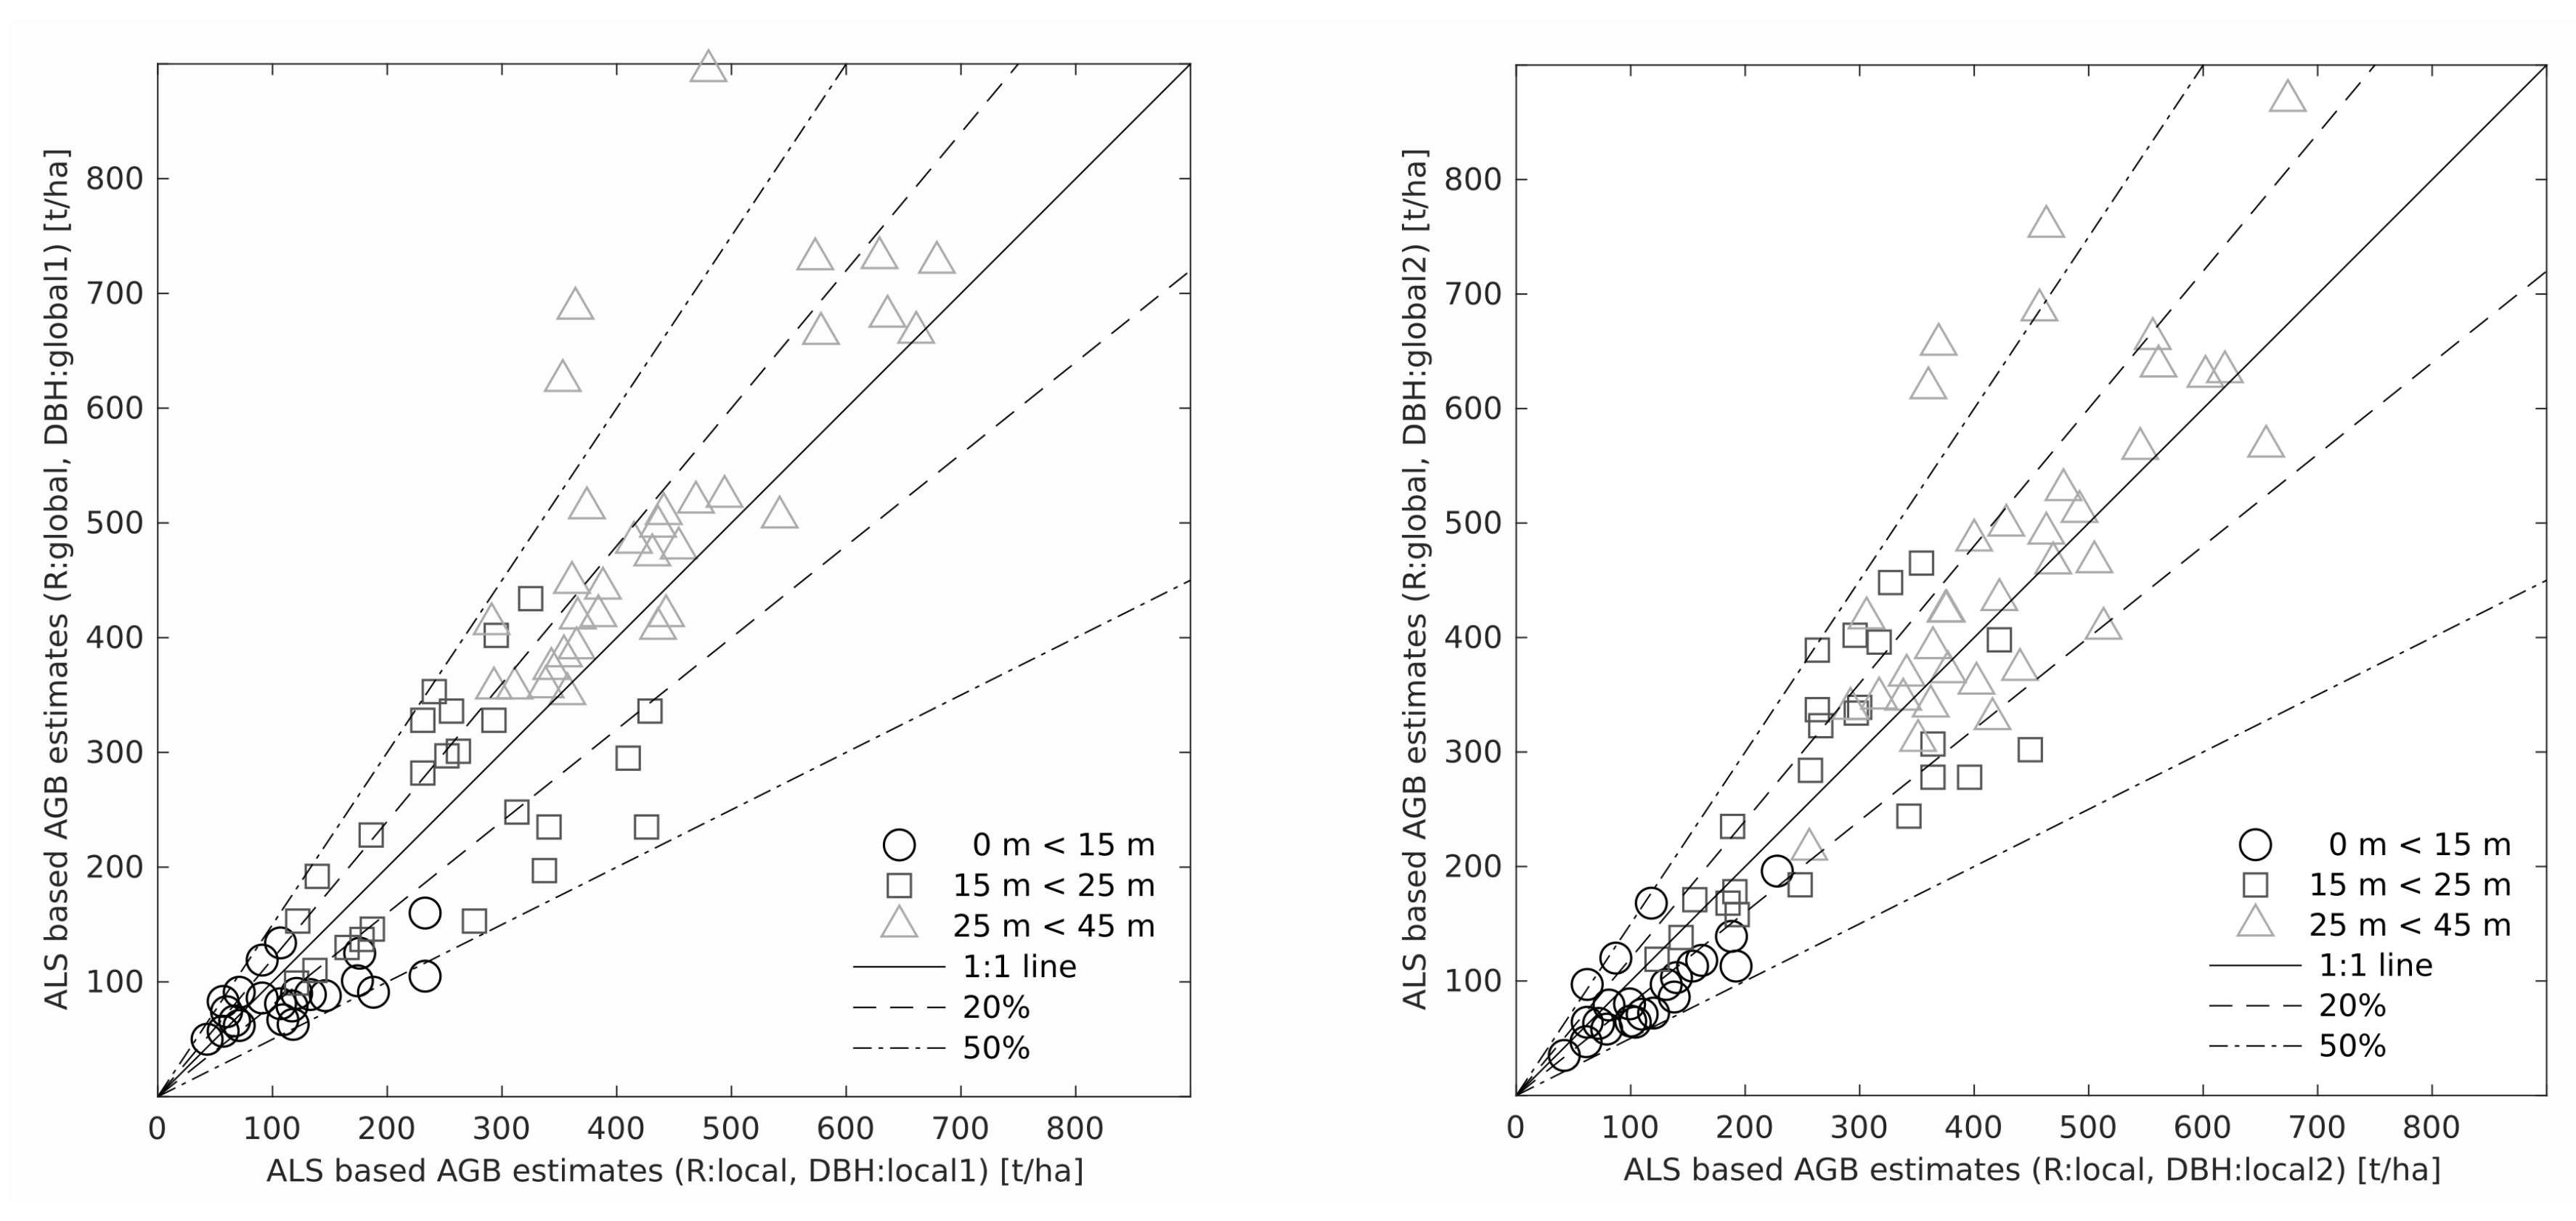
Two comparisons between ALS-based estimates are presented in Figure 7. Both graphs show AGB estimates using the local allometric equations for both crown R and stem DBH vs. global allometric equations, but the two plots show difference by equation type (exponential vs. power type). Most plots differed within the range of , while the majority of those in height class >25 m laid within the range .
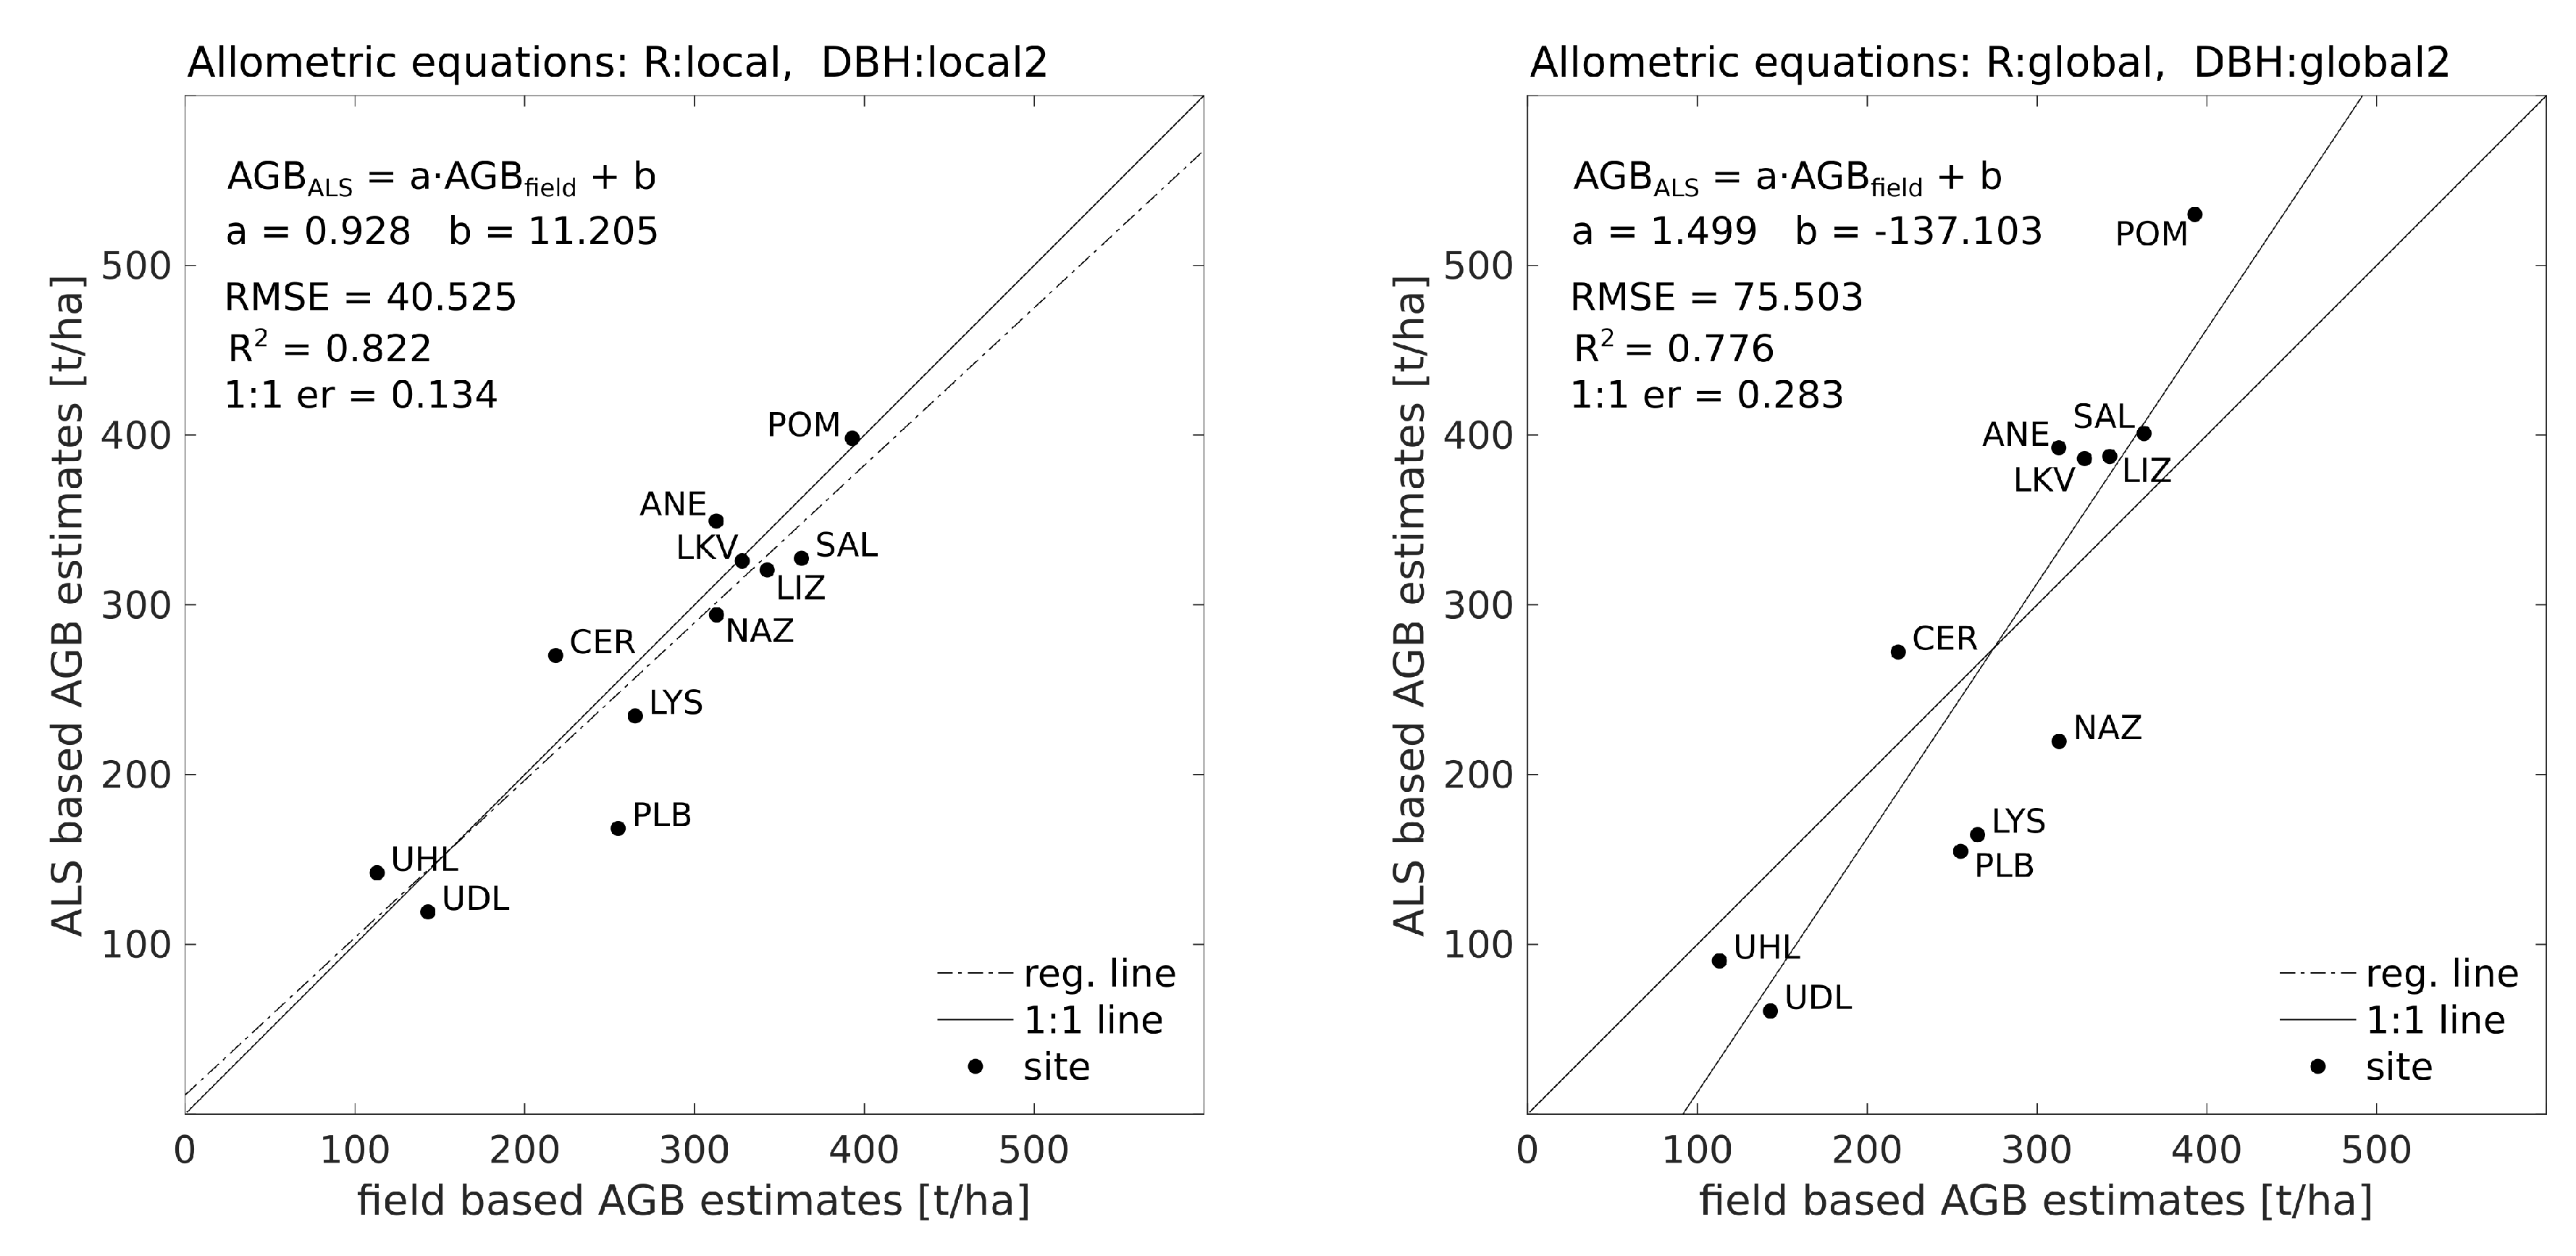
Total AGB estimates for the entire catchment areas under 12 scenarios using ALS data are summarized in Table 6. Comparison between the field- and ALS-based AGB estimates is presented in Figure 8 for two contrasting scenarios, one using the local allometric equations, the other one using only the global equations. Figures for the other scenarios are presented in the Supplementary Material S3.
Forest AGB (as estimated from the R:local, DBH:local 2 scenario) varied between 119 and 398 t/ha according to forest stand age. For example, the lowest AGB was observed at the UDL and UHL sites with mean forest age between 20 and 40 years. In general, global DBH models tend to underestimate AGB in young stands and overestimate AGB in mature stands. This will likely remain true despite the fact that there might be some differences between field- and ALS-based estimates because of the two year gap between the data acquistion. We assume that yearly increment in AGB is not very high (less than 10% for younger stands and less than 5% for mature stands). An exception was seen in the PLB catchment, where AGB was underestimated every time. We know that there was a logging activity between 2015 and 2017 at that site. Furthermore, specific bedrock chemistry (alkaline serpentinite, see Table 1) suppress tree growth due to nutrient imbalance [37] leading to shorter trees with the same DBH compared to other sites.
We achieved linear fit between field-based and ALS-based AGB estimate at catchment level varying from 0.822 to 0.673 in terms of R2 and from 40 to 90 t/ha in terms of RMSE. ALS-based AGB estimation derived using local allometric equations for both crown R and stem DBH had the greatest precision as expressed by steep slope (a = 0.928) and low offset (b = 11.205) in linear fit which was also the tightest (R2 = 0.822, RMSE = 40 t/ha). Our results are in agreement with those from other studies, such as that of Mutwiri et al. [17], who reported R2 of 0.7–0.8 in comparing field- and ALS-based AGB estimates within montane forest in Kenya. Similar levels of accuracy were reported by Shao et al. [20], with R2 of 0.6 for AGB estimates in Yellowwood State Forest (USA), and Wang et al. [7] reporting R2 of 0.6–0.8 for estimates in Heihe River Basin (China). Ferraz et al. [18] analyzed differences between field- and ALS-based AGB estimates for different forest types and reported highly variable results with R2 ranging between 0.37 and 0.99.
Based on the results presented in Table 6 it is clear that the exponential local allometric equation (type 1) for DBH estimation that was established outside the GEOMON catchments produces unrealistic estimates of AGB, especially for sites with mature and tall spruce trees. This could be expected, because the dataset at the Bílý Kříž site contains data only for spruce trees younger than 40 years. Therefore, the allometric equation for DBH estimation, especially the exponential model, is scarcely transferable to older trees. If we remove the results for the “outside 1” model from Table 6, we are able to assess uncertainty or variability in AGB estimation from the remaining scenarios. The uncertainty (measured as standard deviation) in AGB estimates varies from 16 t/ha (observed at catchment CER) up to 84 t/ha (observed at catchment POM). In relative values, it goes from 6% to 37% of the field-based AGB estimation per catchment. Similarly, Bellan et al. [38] reported underestimation of 10% in total AGB when transferring field-based allometric equations AGB = f(DBH) from one spruce stand in the Czech Republic to another.
4. Conclusions
This study explored variables influencing estimation of AGB for Norway spruce dominated forests from ALS data. Specifically, we looked at the influence of ALS data point densities and spatial resolution of corresponding CHM for individual tree detection and role of allometric equations for tree crown radius and stem DBH estimation in forest AGB estimation. We conclude that variable point densities of ALS data (4–18 pt/m2) did not influence the results for individual tree detection. Therefore, we recommend using ALS data with point density around 5 pt/m2 for operational estimation of spruce forest AGB in the Central European region. Spatial resolution of the input CHM rasters had a greater impact on tree detection, higher detection rates were achieved for CHMs with pixel size 0.5 m than 1.0 m for all tree height categories.
AGB estimation from ALS data is largely dependent on the allometric equations that estimate basic tree parameters, such as crown radius and stem diameter, from an easily retrievable tree height. In common forestry practice, these allometric equations often do not exist (such as for crown radius) or they are reported in inverse form (such as estimating tree height from stem diameter). Thanks to the large database of forest inventory parameters that was compiled for small forested catchments within the GEOMON monitoring network in the Czech Republic (about 3000 trees), we could establish our own allometric equations for Norway spruce and European beech. Because the GEOMON sites cover a broad variety of environmental conditions and spruce-dominated forests, we can consider the global allometric models to be representative for the Czech Republic, and potentially for the Central European region.
We computed AGB at the catchment level for 12 scenarios with varying allometric equations and the results showed that uncertainty varied from 16 up to 84 t/ha. In relative values, it goes from 6% to 37% of the field-based AGB estimation per catchment. Therefore, allometric equations mainly for DBH estimation should be applied with care. We can recommend establishing one’s own site-specific models, but this requires investments into field data collection. Direct comparison between ALS-based AGB estimates using local and global models showed variation as much as 20% (both positive and negative) for the highest tree height class and as much as 50% for the lowest tree height class.
The main advantages of the ALS-based approach for estimating forest AGB are full spatial coverage and an ability to detect real spatial distribution of trees whereas field-based estimation relies on a limited number of sampling plots and requires extrapolation to the stand level.
Supplementary Materials
The following are available online at https://www.mdpi.com/1999-4907/11/3/268/s1. Complete set of figures (Figure 3, Figure 6, Figure 8) is provided for different scenarios and study sites. [S1] Local allometric equations; [S2] Comparison of AGB estimates at plot level; [S3] Comparison of AGB estimates at stream catchment level.
Author Contributions
Conceptualization, J.N. and L.H.; methodology, J.N.; software, J.N.; formal analysis, B.N. and R.J.; resources, F.O.; data curation, B.N.; writing–original draft preparation, J.N. and B.N.; writing–review and editing, F.O. and L.H.; visualization, B.N. and R.J.; project administration, L.H. All authors have read and agreed to the published version of the manuscript.
Funding
This work was supported by the Czech Science Foundation, grant number 17-05743S and the Ministry of Education, Youth and Sports of the Czech Republic within the National Sustainability Program I (NPU I), grant number LO1415.
Acknowledgments
We acknowledge the site manager P. Krám (LYS, PLB, NAZ) for help with field work preparation. We would like to thank field researchers R. Hédl, L. Hédlová, M. Chudomelová, J. Šebesta, I. Paukertová, I. Müllerová, A. Kučerová, and J. Šipoš, who collected the forest inventory data at the GEOMON sites and our colleague J. Krejza for sharing forest inventory data from the Bílý Kříž site.
Conflicts of Interest
The authors declare no conflict of interest. The funders had no role in the design of the study; in the collection, analyses, or interpretation of data; in the writing of the manuscript, or in the decision to publish the results.
Abbreviations
The following abbreviations are used in this manuscript:
| AGB | Aboveground biomass |
| 1000AGL | Flight altitude at 1000 m above the ground level |
| ALS | Airborne laser scanning |
| ANE | Anenský potok site |
| BK | Bílý Kříž site |
| CAS | Czech Academy of Sciences |
| CER | Červík site |
| CHM | Canopy height model |
| CHM | Canopy height model |
| CzechGlobe | Global Change Research Institute CAS |
| DBH | Diameter at breast height |
| GEOMON | Network of study sites (see Section 2.1) |
| H | Tree height |
| ICOS | Integrated Carbon Observation System |
| LIZ | Na Lizu site |
| LKV | Loukov site |
| LYS | Lysina site |
| NAZ | Na Zeleném site |
| PLB | Pluhův bor site |
| POM | Polomka site |
| R | Crown radius |
| RMSE | Root mean square error |
| SAL | Salačova Lhota site |
| UDL | U dvou louček site |
| UHL | Uhlířská site |
References
- Pan, Y.; Birdsey, R.A.; Fang, J.; Houghton, R.; Kauppi, P.E.; Kurz, W.A.; Phillips, O.L.; Shvidenko, A.; Lewis, S.L.; Canadell, J.G.; et al. A Large and Persistent Carbon Sink in the World’s Forests. Science 2011, 333, 988–993. [Google Scholar] [CrossRef] [Green Version]
- Goodale, C.L.; Apps, M.J.; Birdsey, R.A.; Field, C.; Heath, L.; Houghton, R.A.; Jenklngsu, N. Forest Carbon Sinks in the Northern Hemisphere. Ecog. Appl. 2002, 12, 897–899. [Google Scholar] [CrossRef]
- Agrawal, A.; Nepstad, D.; Chhatre, A. Reducing Emissions from Deforestation and Forest Degradation. Ann. Rev. Environ. Resour. 2011, 36, 373–396. [Google Scholar] [CrossRef] [Green Version]
- Baccini, A.; Goetz, S.J.; Walker, W.S.; Laporte, N.T.; Sun, M.; Sulla-Menashe, D.; Hackler, J.; Beck, P.S.A.; Dubayah, R.; Friedl, M.A.; et al. Estimated carbon dioxide emissions from tropical deforestation improved by carbon-density maps. Nat. Clim. Chang. 2012, 2, 182–185. [Google Scholar] [CrossRef]
- Harris, N.L.; Brown, S.; Hagen, S.C.; Saatchi, S.S.; Petrova, S.; Salas, W.; Hansen, M.C.; Potapov, P.V.; Lotsch, A. Baseline Map of Carbon Emissions from Deforestation in Tropical Regions. Science 2012, 336, 1573–1576. [Google Scholar] [CrossRef]
- Figueiredo, E.O.; d’Oliveira, M.V.N.; Braz, E.M.; de Almeida Papa, D.; Fearnside, P.M. LIDAR-based estimation of bole biomass for precision management of an Amazonian forest: Comparisons of ground-based and remotely sensed estimates. Remote Sens. Environ. 2016, 187, 281–293. [Google Scholar] [CrossRef] [Green Version]
- Wang, Z.; Liu, L.; Peng, D.; Liu, X.; Zhang, S.; Wang, Y. Estimating woody aboveground biomass in an area of agroforestry using airborne light detection and ranging and compact airborne spectrographic imager hyperspectral data: Individual tree analysis incorporating tree species information. J. Appl. Remote Sens. 2016, 10, 036007. [Google Scholar] [CrossRef]
- Anderson-Teixeira, K.J.; Davies, S.J.; Bennett, A.C.; Gonzalez-Akre, E.B.; Muller-Landau, H.C.; Joseph Wright, S.; Abu Salim, K.; Almeyda Zambrano, A.M.; Alonso, A.; Baltzer, J.L.; et al. CTFS-ForestGEO: A worldwide network monitoring forests in an era of global change. Glob. Chang. Biol. 2015, 21, 528–549. [Google Scholar] [CrossRef] [PubMed] [Green Version]
- Malek, S.; Miglietta, F.; Gobakken, T.; Næsset, E.; Gianelle, D.; Dalponte, M. Prediction of stem diameter and biomass at individual tree crown level with advanced machine learning techniques. iForest Biogeosci. Forestry 2019, 12, 323–329. [Google Scholar] [CrossRef] [Green Version]
- Avitabile, V.; Herold, M.; Heuvelink, G.B.M.; Lewis, S.L.; Phillips, O.L.; Asner, G.P.; Armston, J.; Ashton, P.S.; Banin, L.; Bayol, N.; et al. An integrated pan-tropical biomass map using multiple reference datasets. Glob. Chang. Biol. 2016, 22, 1406–1420. [Google Scholar] [CrossRef] [PubMed] [Green Version]
- Lefsky, M.A.; Cohen, W.B.; Harding, D.J.; Parker, G.G.; Acker, S.A.; Gower, S.T. Lidar remote sensing of above-ground biomass in three biomes. Glob. Ecol. Biogeogr. 2002, 11, 393–399. [Google Scholar] [CrossRef] [Green Version]
- Asner, G.P.; Mascaro, J.; Muller-Landau, H.C.; Vieilledent, G.; Vaudry, R.; Rasamoelina, M.; Hall, J.S.; van Breugel, M. A universal airborne LiDAR approach for tropical forest carbon mapping. Oecologia 2012, 168, 1147–1160. [Google Scholar] [CrossRef] [PubMed]
- Jochem, A.; Höfle, B.; Rutzinger, M. Extraction of Vertical Walls from Mobile Laser Scanning Data for Solar Potential Assessment. Remote Sens. 2011, 3, 650–667. [Google Scholar] [CrossRef] [Green Version]
- Gwenzi, D.; Lefsky, M.A. Modeling canopy height in a savanna ecosystem using spaceborne lidar waveforms. Remote Sens. Environ. 2014, 154, 338–344. [Google Scholar] [CrossRef]
- Hao, H.; Li, W.; Zhao, X.; Chang, Q.; Zhao, P. Estimating the Aboveground Carbon Density of Coniferous Forests by Combining Airborne LiDAR and Allometry Models at Plot Level. Front. Plant Sci. 2019, 10, 917. [Google Scholar] [CrossRef] [PubMed] [Green Version]
- Garcia, M.; Saatchi, S.; Ferraz, A.; Silva, C.A.; Ustin, S.; Koltunov, A.; Balzter, H. Impact of data model and point density on aboveground forest biomass estimation from airborne LiDAR. Carbon Balance Manag. 2017, 12, 4. [Google Scholar] [CrossRef] [Green Version]
- Mutwiri, F.K.; Odera, P.A.; Kinyanjui, M.J. Estimation of Tree Height and Forest Biomass Using Airborne LiDAR Data: A Case Study of Londiani Forest Block in the Mau Complex, Kenya. Open J. Forestry 2017, 7, 255–269. [Google Scholar] [CrossRef] [Green Version]
- Ferraz, A.; Saatchi, S.; Mallet, C.; Jacquemoud, S.; Gonçalves, G.; Silva, C.; Soares, P.; Tomé, M.; Pereira, L. Airborne Lidar Estimation of Aboveground Forest Biomass in the Absence of Field Inventory. Remote Sens. 2016, 8, 653. [Google Scholar] [CrossRef] [Green Version]
- Hansen, E.; Ene, L.; Mauya, E.; Patočka, Z.; Mikita, T.; Gobakken, T.; Næsset, E. Comparing Empirical and Semi-Empirical Approaches to Forest Biomass Modelling in Different Biomes Using Airborne Laser Scanner Data. Forests 2017, 8, 170. [Google Scholar] [CrossRef] [Green Version]
- Shao, G.; Shao, G.; Gallion, J.; Saunders, M.R.; Frankenberger, J.R.; Fei, S. Improving Lidar-based aboveground biomass estimation of temperate hardwood forests with varying site productivity. Remote Sens. Environ. 2018, 204, 872–882. [Google Scholar] [CrossRef]
- Deo, R.; Russell, M.; Domke, G.; Andersen, H.E.; Cohen, W.; Woodall, C. Evaluating Site-Specific and Generic Spatial Models of Aboveground Forest Biomass Based on Landsat Time-Series and LiDAR Strip Samples in the Eastern USA. Remote Sens. 2017, 9, 598. [Google Scholar] [CrossRef] [Green Version]
- Bouvier, M.; Durrieu, S.; Fournier, R.A.; Saint-Geours, N.; Guyon, D.; Grau, E.; de Boissieu, F. Influence of Sampling Design Parameters on Biomass Predictions Derived from Airborne LiDAR Data. Canad. J. Remote Sens. 2019, 45, 650–672. [Google Scholar] [CrossRef] [Green Version]
- Montagnoli, A.; Fusco, S.; Terzaghi, M.; Kirschbaum, A.; Pflugmacher, D.; Cohen, W.B.; Scippa, G.S.; Chiatante, D. Estimating forest aboveground biomass by low density lidar data in mixed broad-leaved forests in the Italian Pre-Alps. Forest Ecosyst. 2015, 2, 10. [Google Scholar] [CrossRef] [Green Version]
- Wu, Z.; Dye, D.; Stoker, J.; Vogel, J.; Velasco, M.; Middleton, B. Evaluating Lidar Point Densities for Effective Estimation of Aboveground Biomass. Int. J. Adv. Remote Sens. GIS 2016, 5, 1483–1499. [Google Scholar] [CrossRef] [Green Version]
- Brovkina, O.; Novotny, J.; Cienciala, E.; Zemek, F.; Russ, R. Mapping forest aboveground biomass using airborne hyperspectral and LiDAR data in the mountainous conditions of Central Europe. Ecol. Eng. 2017, 100, 219–230. [Google Scholar] [CrossRef]
- Fottová, D. Regional evaluation of mass element fluxes: Geomon network of small catchments. Environ. Monitor. Assess. 1995, 34, 215–221. [Google Scholar] [CrossRef]
- Oulehle, F.; Chuman, T.; Hruška, J.; Krám, P.; McDowell, W.H.; Myška, O.; Navrátil, T.; Tesař, M. Recovery from acidification alters concentrations and fluxes of solutes from Czech catchments. Biogeochemistry 2017, 132, 251–272. [Google Scholar] [CrossRef]
- Sullivan, M.J.P.; Lewis, S.L.; Hubau, W.; Qie, L.; Baker, T.R.; Banin, L.F.; Chave, J.; Cuni-Sanchez, A.; Feldpausch, T.R.; Lopez-Gonzalez, G.; et al. Field methods for sampling tree height for tropical forest biomass estimation. Methods Ecol. Evol. 2018, 9, 1179–1189. [Google Scholar] [CrossRef] [Green Version]
- Hanuš, J.; Fabiánek, T.; Fajmon, L. Potential of airborne imaging spectroscopy at CzechGlobe. ISPRS Int. Arch. Photogram. Remote Sens. Spat. Inf. Sci. 2016, XLI-B1, 15–17. [Google Scholar] [CrossRef]
- Khosravipour, A.; Skidmore, A.K.; Isenburg, M.; Wang, T.; Hussin, Y.A. Generating Pit-free Canopy Height Models from Airborne Lidar. Photogramm. Eng. Remote Sens. 2014, 80, 863–872. [Google Scholar] [CrossRef]
- Novotný, J. MAtematické Metody Segmentace Obrazu Pro DáLkový PrůZkum Země (Mathematical Methods of Image Segmentation for Remote Sensing Applications). Doctoral’s Thesis, Faculty of Mechanical Engineering, Brno University of Technology, Brno, Czech Republic, 2015. [Google Scholar]
- Wirth, C.; Schumacher, J.; Schulze, E.D. Generic biomass functions for Norway spruce in Central Europe—A meta-analysis approach toward prediction and uncertainty estimation. Tree Physiol. 2004, 24, 121–139. [Google Scholar] [CrossRef] [PubMed] [Green Version]
- Wutzler, T.; Köstner, B.; Bernhofer, C. Spatially explicit assessment of carbon stocks of a managed forest area in eastern Germany. Eur. J. Forest Res. 2007, 126, 371–383. [Google Scholar] [CrossRef]
- Adamec, Z.; Drápela, K. Comparison of parametric and nonparametric methods for modeling height-diameter relationships. iForest Biogeosc. Forestry 2017, 10, 1–8. [Google Scholar] [CrossRef] [Green Version]
- Luo, L.; Zhai, Q.; Su, Y.; Ma, Q.; Kelly, M.; Guo, Q. Simple method for direct crown base height estimation of individual conifer trees using airborne LiDAR data. Opt. Express 2018, 26, A562. [Google Scholar] [CrossRef] [PubMed]
- Kaartinen, H.; Hyyppä, J.; Yu, X.; Vastaranta, M.; Hyyppä, H.; Kukko, A.; Holopainen, M.; Heipke, C.; Hirschmugl, M.; Morsdorf, F.; et al. An International Comparison of Individual Tree Detection and Extraction Using Airborne Laser Scanning. Remote Sens. 2012, 4, 950–974. [Google Scholar] [CrossRef] [Green Version]
- Krám, P.; Oulehle, F.; Štědrá, V.; Hruška, J.; Shanley, J.B.; Minocha, R.; Traister, E. Geoecology of a Forest Watershed Underlain by Serpentine in Central Europe. Northeast. Nat. 2009, 16, 309–328. [Google Scholar] [CrossRef]
- Bellan, M.; Světlík, J.; Krejza, J.; Rosík, J.; Marková, I. Chyba odhadu nadzemní biomasy v případě použití lokálních alometrických rovnic na příkladu dvou mladých smrkových porostů (Error of above-ground biomass estimation by using site specific allometric equations on the example of the example of two young spruce stands). Zprávy LesnickéHo VýZkumu 2018, 63, 173–183. [Google Scholar]
Figure 1.
Methodological design of this study (DBH = diameter at breast height, R = crown radius, H = tree height, AGB = aboveground biomass, ALS = airborne laser scanning, CHM = canopy height model).
Figure 1.
Methodological design of this study (DBH = diameter at breast height, R = crown radius, H = tree height, AGB = aboveground biomass, ALS = airborne laser scanning, CHM = canopy height model).

Figure 2.
Location of small forested stream catchments within the GEOMON long-term monitoring network (circles with labels) and the Bílý Kříž site (cross with BK label) in the Czech Republic. The sites are characterized (and abbreviations explained) in Table 1.
Figure 2.
Location of small forested stream catchments within the GEOMON long-term monitoring network (circles with labels) and the Bílý Kříž site (cross with BK label) in the Czech Republic. The sites are characterized (and abbreviations explained) in Table 1.

Figure 3.
Allometric equations for prediction of stem diameter at breast height (DBH) from tree height (H). (a) local model for Norway spruce established for the LYS catchment, (b) local model for the external site Bílý Kříž, (c) global model for Norway spruce computed from all catchments, and (d) global model for European beech computed from all catchments. Graphs for local equations from other sites are presented in Supplementary Material S1.

Figure 4.
Histograms for height distributions of ALS input data acquired at point density of 8 pt/m2 (1000 AGL) and 4 pt/m2 (2000 AGL) at the level of the entire Červík (CER) catchment (top graphs) and at the level of a single forest inventory plot (CER 8k) of size 500 m2 (bottom graphs). Comparison of height distribution is shown for point cloud data (left) and for the canopy height model rasters with pixel sizes of 0.5 m (middle) and 1.0 m (right).

Figure 5.
Verification of tree detection. Detection and commission rates calculated for three forest height categories (a–c) and all categories together (d) using manual identification of trees.
Figure 5.
Verification of tree detection. Detection and commission rates calculated for three forest height categories (a–c) and all categories together (d) using manual identification of trees.

Figure 6.
AGB comparison at plot level between estimates based on field data and ALS data (scenario based on the CHM raster with pixel size of 0.5 m and combination of two local models, one for tree crown R estimation and the other for the stem diameter at breast height estimation). The linear regression line (dash-dot) is presented together with the 1:1 line (solid) and symbols differentiate tree height categories. Histograms on the right-hand side show deviation from the 1:1 line for different tree height categories.

Figure 7.
Comparison of AGB estimates at plot level based solely on ALS data. The effect of local vs. global model for DBH estimation is shown: exponential eq. (left) and power eq. (right). Solid line highlights 1:1 line and the dashed lines indicate 20% and 50% deviation from 1:1 line.
Figure 7.
Comparison of AGB estimates at plot level based solely on ALS data. The effect of local vs. global model for DBH estimation is shown: exponential eq. (left) and power eq. (right). Solid line highlights 1:1 line and the dashed lines indicate 20% and 50% deviation from 1:1 line.

Figure 8.
Comparison of total AGB for entire catchment areas based on estimates obtained from field data and from ALS data using local allometric equations (left) and global allometric equations (right). Linear regression line (dashed) is presented together with a 1:1 line (solid).
Figure 8.
Comparison of total AGB for entire catchment areas based on estimates obtained from field data and from ALS data using local allometric equations (left) and global allometric equations (right). Linear regression line (dashed) is presented together with a 1:1 line (solid).


Table 1.
Characteristics of small forested stream GEOMON catchments located across the Czech Republic (mean characteristics computed for the period 1994–2016). Last row reports characteristics of an external Bílý Kříž site (computed for the period 1988–2018).
Table 1.
Characteristics of small forested stream GEOMON catchments located across the Czech Republic (mean characteristics computed for the period 1994–2016). Last row reports characteristics of an external Bílý Kříž site (computed for the period 1988–2018).
| Catchment Name (Abbreviation) | Area (ha) | Elevation (m a.s.l.) | Mean temp. (°C) | Mean ann. precip. (mm) | Forest Floor pH | Mineral Soil pH | Bedrock Type | Forest Age (yr) |
|---|---|---|---|---|---|---|---|---|
| Anenský potok (ANE) | 27 | 480–540 | 8.0 | 673 | 4.00 | 4.67 | Paragneiss | 40–60 |
| Červík (CER) | 185 | 640–960 | 6.0 | 1212 | 3.40 | 4.13 | Sandstone, Claystone | 40–60 |
| Na Lizu (LIZ) | 98 | 830–1025 | 5.5 | 892 | 3.50 | 4.38 | Paragneiss | 60–100 |
| Loukov (LKV) | 66 | 470–660 | 7.5 | 754 | 3.64 | 4.33 | Granite | 40–80 |
| Lysina (LYS) | 27 | 830–950 | 5.0 | 1005 | 3.37 | 4.33 | Granite | 40–60 |
| Na Zeleném (NAZ) | 60 | 740–800 | 6.0 | 800 | 3.86 | 5.07 | Amphibolite | 60–100 |
| Pluhův bor (PLB) | 22 | 690–800 | 6.0 | 861 | 3.85 | 5.82 | Serpentinite | 60–100 |
| Polomka (POM) | 69 | 510–640 | 7.0 | 697 | 3.77 | 4.37 | Paragneiss, Orthogneiss | 61–80 |
| Salačova Lhota (SAL) | 168 | 560–7745 | 7.0 | 675 | 3.46 | 4.30 | Paragneiss | 60–80 |
| U dvou louček (UDL) | 33 | 880–950 | 5.0 | 1502 | 3.75 | 4.43 | Gneiss | 20–40 |
| Uhlířská (UHL) | 187 | 780–870 | 5.5 | 1250 | 3.50 | 4.33 | Granite, Granodiorite | 20–40 |
| Bílý Kříž (BK) | 0.25 | 800–920 | 6.3 | 1230 | n.a. | n.a. | Sandstone, Claystone | 40 |
Table 2.
Forest characteristics per stream catchment as measured in field surveys during 2015–2016. Mean values are presented together with standard deviation. Last row reports characteristics measured at the Bílý Kříž site in 2017.
Table 2.
Forest characteristics per stream catchment as measured in field surveys during 2015–2016. Mean values are presented together with standard deviation. Last row reports characteristics measured at the Bílý Kříž site in 2017.
| Catchment | No. of Plots | No. of Sampled Trees | Mean Tree Height H(m) | Mean Stem DBH (cm) | Mean Crown Radius R(m) | Norway Spruce (%) | Beech (%) | Others (%) |
|---|---|---|---|---|---|---|---|---|
| ANE | 5 | 108 | 30.1 ± 3.3 | 36.6 ± 8.8 | 3.0 ± 0.9 | 81.5 | 0.9 | 17.6 1 |
| CER | 9 | 359 | 16.2 ± 10.3 | 19.8 ± 14.3 | 2.3 ± 1.1 | 68.8 | 26.5 | 4.7 |
| LIZ | 10 | 431 | 21.6 ± 8.7 | 24.6 ± 12.1 | 2.0 ± 0.9 | 80.3 | 4.6 | 15.1 2 |
| LKV | 7 | 312 | 20.6 ± 9.2 | 23.7 ± 12.7 | 2.1 ± 1.2 | 81.7 | 4.2 | 14.1 3 |
| LYS | 5 | 358 | 11.8 ± 6.9 | 16.5 ± 11.5 | 1.8 ± 0.7 | 100.0 | 0.0 | 0.0 |
| NAZ | 7 | 216 | 19.1 ± 7.0 | 26.9 ± 11.1 | 1.7 ± 0.7 | 90.7 | 0.5 | 8.8 |
| PLB | 5 | 143 | 20.7 ± 5.7 | 27.8 ± 9.5 | 2.6 ± 0.9 | 93.7 | 5.6 | 0.7 |
| POM | 7 | 143 | 30.7 ± 6.5 | 39.4 ± 12.1 | 2.8 ± 1.2 | 94.4 | 3.5 | 2.1 |
| SAL | 10 | 345 | 25.2 ± 7.6 | 28.6 ± 12.9 | 2.4 ± 1.0 | 74.2 | 0.6 | 25.2 4 |
| UDL | 6 | 372 | 9.2 ± 2.8 | 15.9 ± 5.6 | 2.0 ± 0.5 | 100.0 | 0.0 | 0.0 |
| UHL | 10 | 399 | 10.7 ± 3.9 | 16.8 ± 6.8 | 1.7 ± 0.8 | 96.5 | 0.2 | 3.3 |
| BK outside | 1 | 290 | 16.9 ± 2.0 | 20.1 ± 4.1 | 1.9 ± 0.3 | 100.0 | 0.0 | 0.0 |
Other common tree species are 1 European larch (Larix decidua) 10% and Scots pine (Pinus sylvestris) 5%. 2 Silver birch (Betula pendula) 10% and European larch 4%. 3 Scots pine 9% and common alder (Alnus glutinosa) 3%. 4 Scots pine 17% and European larch 8%.
Table 3.
Parameters of the allometric models used for tree biomass (and its components) for estimating spruce and beech biomass and its components. W is dry mass of the biomass component, DBH is diameter at breast height, and H is tree height.
Table 3.
Parameters of the allometric models used for tree biomass (and its components) for estimating spruce and beech biomass and its components. W is dry mass of the biomass component, DBH is diameter at breast height, and H is tree height.
| Spruce Simple Model (Wirth et al. [32]) | Beech (Wutzler et al. [33]) | ||||||
|---|---|---|---|---|---|---|---|
| Components | ln(W) | α | β | W | α | β | γ |
| stem | −2.50602 | 2.44277 | 0.0293 | 0.974 | - | ||
| needles/leaves | −3.19632 | 1.9162 | 0.0377 | 2.430 | −0.913 | ||
| living branches | −3.96201 | 2.2552 | 0.1230 | 3.090 | −1.170 | ||
| dry branches | −3.22406 | 1.6732 | - | - | - | - | |
Table 4.
Allometric equations for estimating tree crown radius (R) and stem diameter at breast height (DBH) from the measured tree height (H) for Norway spruce. Local equations are computed for each catchment and the global equation is computed for all catchments together. In the last row, we also included the local model that was computed outside the GEOMON catchments for the Bílý Kříž study site.
| R = aH + b | DBH = exp(aH + b) | DBH = aHb | |||||||
|---|---|---|---|---|---|---|---|---|---|
| (Local/Global) | (Local1/Global1/Outside1) | (Local2/Global2/Outside2) | |||||||
| Catchment | a | b | RMSE | a | b | RMSE | a | b | RMSE |
| ANE | 0.124 | −0.841 | 0.639 | 0.065 | 1.640 | 4.484 | 0.051 | 1.933 | 4.641 |
| CER | 0.067 | 0.947 | 0.322 | 0.050 | 2.038 | 3.848 | 0.688 | 1.182 | 4.431 |
| LIZ | 0.038 | 1.174 | 0.618 | 0.055 | 1.900 | 3.276 | 0.753 | 1.125 | 3.523 |
| LKV | 0.076 | 0.517 | 0.657 | 0.063 | 1.714 | 3.063 | 0.487 | 1.266 | 3.630 |
| LYS | 0.095 | 0.668 | 0.268 | 0.073 | 1.821 | 3.995 | 1.002 | 1.121 | 3.325 |
| NAZ | 0.063 | 0.443 | 0.471 | 0.044 | 2.401 | 4.654 | 1.051 | 1.096 | 3.828 |
| PLB | 0.111 | 0.259 | 0.576 | 0.060 | 1.971 | 4.398 | 0.891 | 1.120 | 4.983 |
| POM | 0.069 | 0.458 | 0.846 | 0.051 | 2.044 | 5.911 | 0.265 | 1.450 | 6.294 |
| SAL | 0.072 | 0.559 | 0.593 | 0.064 | 1.623 | 2.499 | 0.332 | 1.366 | 2.798 |
| UDL | 0.135 | 0.709 | 0.336 | 0.122 | 1.595 | 2.875 | 2.431 | 0.846 | 3.152 |
| UHL | 0.142 | 0.193 | 0.479 | 0.085 | 1.786 | 2.540 | 1.518 | 1.096 | 2.624 |
| ALL global | 0.056 | 1.052 | 0.553 | 0.050 | 2.086 | 4.651 | 1.036 | 1.059 | 4.736 |
| BK outside | n.a. | n.a. | n.a. | 0.970 | 1.417 | 1.591 | 1.232 | 0.991 | 1.095 |
Table 5.
Numerical comparison of different scenarios for AGB estimation from ALS data. The first two columns describe the scenario itself by specifying which type of allometric equation was used in the tree detection phase for estimating tree crown radius (R = f(H)) and for stem diameter estimation (DBH = f(H)). The remaining variables evaluate the agreement between field- and ALS-based estimates of AGB (R2 and RMSE were computed based on linear regression with equation AGBALS = a·AGBfield + b; 1:1 error tells how far the points deviate from the 1:1 line).
| Scenario Definition | Agreement between Field- and ALS-Based AGB Estimates | |||||
|---|---|---|---|---|---|---|
| R = f(H) | DBH = f(H) | a | b | R2 | RMSE | 1:1 Err |
| global | local 1 | 1.361 | −45.178 | 0.566 | 148 | 0.331 |
| global | local 2 | 1.206 | −10.008 | 0.584 | 127 | 0.318 |
| global | global 1 | 1.513 | −82.611 | 0.549 | 171 | 0.421 |
| global | global 2 | 1.236 | −26.731 | 0.606 | 124 | 0.352 |
| global | outside 1 | 1.775 | −180.363 | 0.314 | 326 | 0.569 |
| global | outside 2 | 1.308 | −20.776 | 0.594 | 134 | 0.396 |
| local | local 1 | 1.185 | −23.365 | 0.631 | 113 | 0.272 |
| local | local 2 | 1.054 | 8.561 | 0.667 | 93 | 0.264 |
| local | global 1 | 1.327 | −55.018 | 0.580 | 140 | 0.365 |
| local | global 2 | 1.111 | −10.644 | 0.630 | 106 | 0.322 |
| local | outside 1 | 1.565 | −150.356 | 0.301 | 296 | 0.507 |
| local | outside 2 | 1.175 | −3.875 | 0.620 | 114 | 0.354 |
Table 6.
Total aboveground biomass estimates per catchment (t/ha) obtained directly from the field data (in the first row) and from airborne laser scanning data for 12 scenarios, differing in their combinations of local or global allometric equations for (i) estimation of tree crown radius R in tree detection and (ii) stem diameter estimation in biomass computation.
| Scenario Definition | Total Aboveground Biomass Per Catchment (t/ha) | |||||||||||
|---|---|---|---|---|---|---|---|---|---|---|---|---|
| R = f(H) | DBH = f(H) | ANE | CER | LIZ | LKV | LYS | NAZ | PLB | POM | SAL | UDL | UHL |
| field | field | 313 | 218 | 343 | 328 | 265 | 313 | 255 | 393 | 363 | 143 | 113 |
| global | local 1 | 371 | 239 | 330 | 346 | 241 | 275 | 160 | 563 | 355 | 195 | 158 |
| global | local 2 | 359 | 273 | 319 | 332 | 240 | 302 | 170 | 547 | 326 | 127 | 150 |
| global | global 1 | 359 | 268 | 355 | 341 | 134 | 192 | 121 | 572 | 376 | 67 | 80 |
| global | global 2 | 393 | 272 | 387 | 386 | 165 | 220 | 155 | 530 | 401 | 61 | 90 |
| global | outside 1 | 2470 | 2680 | 2165 | 2081 | 359 | 1040 | 348 | 6082 | 2717 | 57 | 108 |
| global | outside 2 | 344 | 242 | 346 | 344 | 152 | 197 | 142 | 461 | 352 | 61 | 87 |
| local | local 1 | 362 | 236 | 331 | 335 | 234 | 268 | 158 | 403 | 354 | 176 | 147 |
| local | local 2 | 349 | 270 | 321 | 326 | 235 | 294 | 168 | 398 | 327 | 119 | 142 |
| local | global 1 | 352 | 264 | 356 | 334 | 131 | 186 | 120 | 410 | 377 | 64 | 77 |
| local | global 2 | 387 | 270 | 389 | 382 | 161 | 214 | 153 | 393 | 403 | 56 | 86 |
| local | outside 1 | 2373 | 2564 | 2171 | 1958 | 346 | 973 | 341 | 4051 | 2694 | 52 | 100 |
| local | outside 2 | 339 | 240 | 347 | 341 | 149 | 193 | 140 | 343 | 354 | 57 | 83 |
© 2020 by the authors. Licensee MDPI, Basel, Switzerland. This article is an open access article distributed under the terms and conditions of the Creative Commons Attribution (CC BY) license (http://creativecommons.org/licenses/by/4.0/).
Share and Cite
MDPI and ACS Style
Novotný, J.; Navrátilová, B.; Janoutová, R.; Oulehle, F.; Homolová, L. Influence of Site-Specific Conditions on Estimation of Forest above Ground Biomass from Airborne Laser Scanning. Forests 2020, 11, 268. https://doi.org/10.3390/f11030268
AMA Style
Novotný J, Navrátilová B, Janoutová R, Oulehle F, Homolová L. Influence of Site-Specific Conditions on Estimation of Forest above Ground Biomass from Airborne Laser Scanning. Forests. 2020; 11(3):268. https://doi.org/10.3390/f11030268
Chicago/Turabian StyleNovotný, Jan, Barbora Navrátilová, Růžena Janoutová, Filip Oulehle, and Lucie Homolová. 2020. "Influence of Site-Specific Conditions on Estimation of Forest above Ground Biomass from Airborne Laser Scanning" Forests 11, no. 3: 268. https://doi.org/10.3390/f11030268
Note that from the first issue of 2016, this journal uses article numbers instead of page numbers. See further details here.