Input-Output Budgets of Nutrients in Adjacent Norway Spruce and European Beech Monocultures Recovering from Acidification


1
Czech Geological Survey, Klárov 3, 118 21 Prague, Czech Republic
2
Department of Physical Geography, Faculty of Science, Charles University, Albertov 6, 128 43 Prague, Czech Republic
3
Global Change Research Institute, AS CR, Bělidla 986/4a, 603 00 Brno, Czech Republic
4
Environmental Measuring Systems, Turistická 5, 621 00 Brno, Czech Republic
*
Author to whom correspondence should be addressed.
Forests 2019, 10(1), 68; https://doi.org/10.3390/f10010068
Submission received: 30 November 2018
/
Revised: 7 January 2019
/
Accepted: 11 January 2019
/
Published: 16 January 2019
(This article belongs to the Special Issue Effects of Climate Change and Air Pollutants on Forest Tree Species)
Abstract
:Soil acidification has constituted an important ecological threat to forests in Central Europe since the 1950s. In areas that are sensitive to acid pollution, where the soil buffering capacity is naturally low, tree species can significantly modulate the extent of soil acidification by affecting throughfall deposition and the composition of litter. A principal difference can be expected between coniferous and broadleaf tree species. The aim of our study was to compare long-term trends in element cycling in two stands representing the main types of forest ecosystem in the region (Picea abies vs. Fagus sylvatica). In the period of 2005–2017, we continually measured element concentrations and fluxes in bulk precipitation, throughfall precipitation, and soil leachates. A continuous decline of acid deposition was detected in both bulk precipitation and throughfall. Declining deposition of S and N in both forests has led to the recovery of soil solution chemistry in the mineral soil, manifested by rising pH from 4.25 to 4.47 under spruce and from 4.42 to 4.69 in the beech stand. However, soil water in the spruce stand was more acidic, with higher concentrations of SO42− and Al when compared to the beech stand. While the acidity of soil leachates from organic horizons was driven mainly by organic anions, in lower mineral horizons it was controlled by inorganic acid anions. NO3− concentrations in deeper horizons of the spruce stand have diminished since 2006; however, in the beech plot, episodically elevated NO3− concentrations in mineral horizons are a sign of seasonal processes and of nearby perturbations. Higher output of S when compared to the input of the same element indicates slow S resorption, delaying the recovery of soil chemistry. Our results indicate that, although forest ecosystems are recovering from acidification, soil S retention and the ability to immobilize N is affected by the dominant tree species.
1. Introduction
In the second half of the twentieth century, atmospheric deposition of sulfur (S) and nitrogen (N) has caused the acidification and eutrophication of forest soils in Europe and North America, leading to the degradation of forest stands. Initially, the dominant component of acidic deposition was sulfate (SO42−) and the influence of nitrogen compounds (NO3− and NH4+) became important only later. Since the 1990s, S deposition declined rapidly in Central Europe, but N deposition has decreased only slightly [1]. However, in Europe, concentrations are still declining, although the decline is not so sharp as that observed during the 1990s [2].
Sulfate and nitrate anions are neutralized by cations in soil and deplete the cation exchange complex. Due to their increased mobility, nutrients are lost from the rooting zone, and soil base saturation decreases. Furthermore, decreases in pH result in the dissolution of Al3+, which has toxic effects on plant roots [3]. Increased input of atmospheric N may lead to the saturation of ecosystems with N, manifested by subsequent leaching of NO3− [4]. In response to air pollution abatement policies, ecosystems are gradually undergoing a phase of recovery, but due to deterioration of soils the return to the pre-industrial state will take a long time [5]. Decreases of acid inputs led to the partial improvements of stream [6,7] and lake chemistry [8,9], and the consequent amelioration of the soil solution chemistry take place slower than was expected [10,11]. Although some positive changes in soil environment were observed i.e. declining trend in soil solution NO3− concentrations [12] or decline in total Al concentrations [13], soil solution pH, and acid neutralization capacity (ANC) showed nonuniform trends [11,14].
The tree species composition of forest stands plays a key role in the intensity of processes causing acidification and N saturation. Many studies have shown that conifers are able to more efficiently (higher leaf area index, evergreen character) scavenge atmospheric compounds when compared to deciduous species, which is reflected in the different composition of both throughfall precipitation and of the soil solution [15]. Moreover, conifers are characterized by higher interception, so throughfall under them is less diluted and more efficient in the changing of soil chemistry [16,17]. Other factors, such as the distribution of the root system in the soil profile, the quality/degradability of organic matter, or the amount of topsoil, also play a role in the overall effect on soil chemistry [15]. It is generally argued that species composition is manifested mainly in the topsoil [18]. However, S and N deposition can shift the effect to deep soil through the processes of leaching and nutrient transport. The influence of tree species composition has been detected in many sites in Europe previously affected by acid deposition [19,20,21], generally showing an adverse effect of conifers on the soil acid-base status. Thus, the greater intensity of acidification, caused by forests of an unsuitable type, means that ecosystems will take longer to recover. Many studies have been conducted to compare the effect of tree species on the restoration of forest stands recovering from the effects of increased atmospheric pollution [13,22,23,24].
Mid-mountain areas of Central Europe, situated mainly on acidic bedrock, were once naturally covered by European beech forests. During the 18th and 19th centuries, most of these forests were replaced with monocultural Norway spruce plantations to meet the demand for timber. Since the 1970s, this region has been subjected to greater atmospheric deposition. The most affected was a region on the Czech-German-Polish border, called the Black Triangle. Since 2003, throughfall precipitation was measured and the soil solution was analysed in spruce and beech stands. A temporal record spanning 13 years was used to assess the trends of recovery from acidification under these two tree species. The aim of this study was to compare the dynamics of solute concentrations and to determine nutrient fluxes under beech and spruce stands recovering from high atmospheric deposition.
2. Materials and Methods
2.1. Site Description
The spruce and beech stands under study are located in the Czech Republic in the Ore Mountains near the German border, close to the village of Načetín (50°35′26″ N, 13°15′14″ E). Both of the stands lie close to each other (ca. 700 m), so they are exposed to the same geological and climatic conditions. The average annual temperature is 7.1 °C and average annual precipitation is 1110 mm (2005–2017). Paragneiss underlies both stands, which are sloped to the north-west. The dominant soil type is dystric cambisol. The spruce stand lies at an elevation of 784 m a.s.l. and it is covered by 80 years old monoculture of Norway spruce (Picea abies). The beech stand is situated at an elevation of 823 m a.s.l. and it is composed predominantly of European beech trees (Fagus sylvatica) that are approximately 140 years old [25]. Today, both stands are part of a nature reserve, but conventional forest management is still being applied. The spruce stand has been studied since 1980s as part of research into the phenomenon of acid rain [26,27,28].
2.2. Water Chemistry
Bulk precipitation was collected monthly by two funnels that were located in an open area between the two stands. Throughfall precipitation below the spruce and beech canopy was collected monthly by nine collectors spaced in a 15 × 15 m grid in each of the two plots. The precipitation was gathered into polyethylene funnels (area of 122 cm2) during the vegetation season (April–October); these were replaced in winter by open plastic vessels (area of 167 cm2). Precipitation from all collectors were together creating one composite sample. At the beech plot, one stemflow collector was installed to measure stemflow element fluxes in monthly time step.
The soil solution was collected in both stands using PRENART suction lysimeters (Prenart Equipment ApS, Frederiksberg, Denmark) at depths of 30, 60, and 90 cm in the mineral soil. At each depth, a composite sample from 3–9 lysimeters was collated. The soil solution from organic horizons (i.e., the forest floor) was collected by zero-tension lysimeters as a composite sample of three replicates. All of the lysimeters were sampled monthly.
The pH of the collected precipitation and soil water was measured using a Radiometer TTT-85 pH meter with a combination electrode GK-2401C Radiometer (Radiometer Corp., Copenhagen, Denmark). Anion concentrations of Cl−, NO3−, and SO42− were determined by high-performance liquid chromatography (Knauer 1000, Hegauer Weg 38, Berlin, Germany). NH4+ concentrations were detected by indolphenol blue colourimetry, and concentrations of Ca, Mg, Na, K, and Al were measured by atomic absorption spectrometry (AAS, Analyst Perkin Elmer 100 and 200, Perkin Elmer co., LTD, Waltham, MA, USA). Ionic concentrations of Ca2+, Mg2+, Na+, and K+ were assumed to equal total concentrations.
Total monomeric Al (Alm) and organic monomeric Al (Alorg) concentrations were determined by the pyrocatechol violet method that is described in [29] and then modified by [30]. Alorg was separated using a strong cation exchange resin (Dowex 50 W; Sigma-Aldrich, St. Louis, MO, USA) in mixed H+ (98%) and Na+ (2%) forms [31]. The difference between Alm and Alorg was assumed to be inorganic monomeric Al (Alin). Acid-soluble Al (Alas), assumed to be mainly in particulate or microcrystalline form, was calculated as the difference between Altot (AAS) and Alm.
Samples for the analysis of dissolved organic carbon (DOC) and total nitrogen (TN) were filtrated using a 0.4 µm glass fibre Macherey–Nagel GF 5 filter. DOC was determined by oxidation and CO2 was detected using a Apollo 9000 (Tekmar-Dohrmann, Mason, OH, USA) device. Analysis of dissolved nitrogen (DN) uses the oxidation of the sample to NO and emission of light after its reaction with O3. The light emitted is detected by a chemiluminescence detector and correlated to a specific amount of nitrogen. The difference between TN and the sum of N-NO3 and N-NH4 is denoted as dissolved organic nitrogen (DON).
For bulk and throughfall, volume-weighted mean annual concentrations were calculated from the monthly values. The sum of SO42−, NO3−, NH4+, and non-salt Cl− concentrations in atmospheric deposition was denoted according to Meesenburg et al. [23] as potential acidity (ACpot), which indicates the potential acidity of the soil environment. Annual aboveground element input fluxes were obtained by summarizing the monthly input fluxes. Also incorporated in beech throughfall deposition fluxes were stemflow fluxes. Belowground fluxes were calculated multiplying element concentration by month water fluxes, which were than summarized into annual fluxes. The molar ratio of base cations K+ + Ca2+ + Mg2+ to the inorganic form of Al (Bc/Alin) was used as an indicator of potential soil toxicity to tree roots [32]. Critical limits for spruce (1.2) and beech (0.6) were derived from literature [32].
2.3. Data Handling
For the calculation of element fluxes through the soil profile, it is necessary to calculate the volume of passing water. We modelled water percolation outflowing from four horizons (forest floor, 30 cm, 60 cm, and 90 cm). For these purposes, the model Simpel was used (http://www.hydrology.uni-kiel.de/de/forschung/projekte/simpel). This model is based on water bucket storages and enables the calculation of actual evapotranspiration and water passage through soil horizons with daily time step resolution. Input climatic data (daily sum of precipitation, main air temperature, main relative humidity, duration of sunshine, and wind speed) were obtained from a 15 km distant meteorological station (Nová Ves). Since 2017, on-site meteorological data (air temperature and humidity, photosynthetic active radiation—PAR, precipitation, soil moisture, and soil water potential) were measured. Input data about the forest stands (albedo, geographic position, height of the stand, leaf area index time series, and soil physical parameters) were acquired during previous research or derived from the literature [27]. The Simpel model computes water outputs as actual evapotranspiration (i.e., the sum of evaporation and transpiration), the amount of water in snowpack, and infiltration of water through the soil profile. The Simpel model was further calibrated according to measurements of actual transpiration and soil moisture during the vegetation season of 2017.
Since 2017, in each forest stand, eight trees representing stand DBH variation were selected and equipped with continuously measuring sap flow devices. Tree sap flow was measured by the tissue heat balance method with constant heating power (EMS; Brno, Czech Republic). The scaling up of sap flow from sample trees to the stand level was based on the DBH distribution of the trees in each forest stand [33].
2.4. Statistical Analysis
For the determination of significant trends over the period of 2005–2017, the non-parametric seasonal Mann-Kendall (MK) test was used [34]. This model can determine the statistical significance of a trend, despite its seasonal variability. The data were aggregated into three-month groups representing the four seasons (January–March, April–June, July, September, October–December). If a linear trend was present, then real slope (change per unit time) was estimated using Sen′s slope [35]. To estimate differences between stands, a Shapiro–Wilk normality test was conducted. If the data had a normal distribution, the ANOVA test was used, otherwise the non-parametric Kruskal-Wallis test was applied. All statistical tests were performed with a significance level of 5% (α ≤ 0.05).
3. Results
3.1. Atmospheric Deposition Chemistry
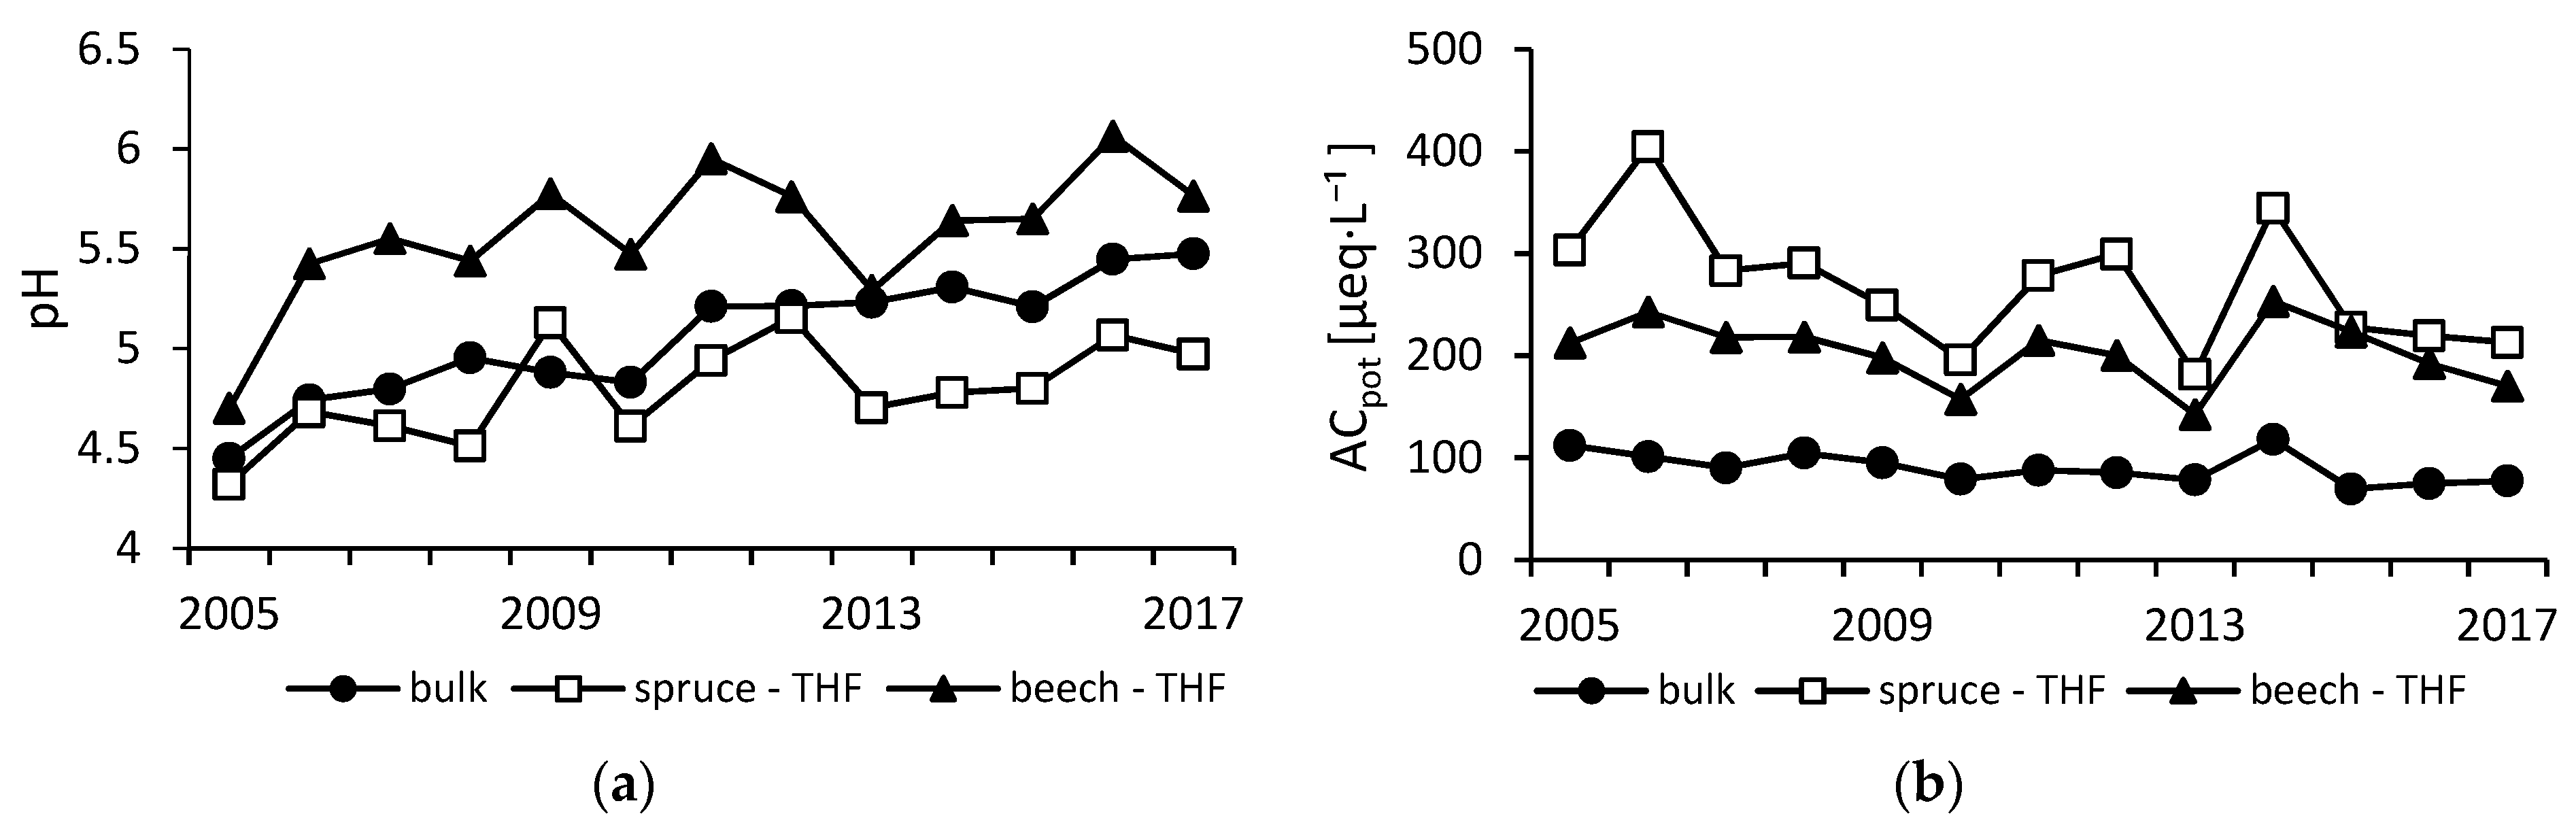
A significant increase of bulk precipitation pH from 4.5 to 5.5 was detected between 2005 and 2017. Similarly, throughfall precipitation pH increased significantly in both stands. Throughfall pH under the spruce canopy increased from 4.3 to 5.0, whereas beech throughfall pH increased from 4.7 to 5.8 (Figure 1).
The decrease of precipitation acidity was driven by downward trends of most acidic anions. SO42− concentrations in bulk precipitation decreased significantly by 53%, from 36 µeq·L−1 in 2005 to 17 µeq·L−1 in 2017. Throughfall spruce SO42− decreased from 112 µeq·L−1 to 75 µeq·L−1, which is a decrease by 33% over the 2005–2017 period. Beech throughfall SO42− concentrations decreased from 71 µeq·L−1 in 2005 to 44 µeq·L−1 in 2017, albeit insignificantly. Over the period of 2005−2017, NO3− concentrations in bulk precipitation decreased by 30% from 33 µeq·L−1 to 23 µeq·L−1. Similarly, spruce throughfall NO3− decreased significantly by 29% from 96 µeq·L−1 to 68 µeq·L−1. Throughfall NO3− concentrations in the beech stand decreased insignificantly from 72 µeq·L−1 to 63 µeq·L−1 (decrease of 13%). Annual concentrations of Cl− varied around 11 ± 3.2 µeq·L−1 in bulk precipitation, 39 ± 12 µeq·L−1 in spruce throughfall, and 22 ± 7 µeq·L−1 in beech throughfall, without any trend detected.
Concentrations of dissolved organic carbon (DOC) decreased significantly in bulk precipitation (from 120 µmol·L−1 in 2005 to 83 µmol·L−1 in 2017). No trend in throughfall DOC concentrations was detected in either of the stands. However, DOC concentrations under the spruce canopy were 2.5× greater when compared to beech throughfall (944 ± 279 µmol·L−1 vs. 393 ± 114 µmol·L−1).
Among concentrations of base cations (BC = K+ + Mg2+ + Ca2+) in bulk precipitation only, K+ exhibited a significant change, as its concentration increased from 2.1 µeq·L−1 in 2005 to 2.9 µeq·L−1 in 2017. Concentrations of other cations varied over the study period around 10 ± 3.3 µeq·L−1, 10 ± 1.6 µeq·L−1, 5 ± 1.4 µeq·L−1, and 40 ± 7.9 µeq·L−1 for Na+, Ca2+, Mg2+, and NH4+, respectively, without any temporal change. Sampling of both types of throughfall precipitation revealed higher concentrations in the spruce stand, where BC concentrations were ca. 1.3 × greater than under beech (Na+ = 1.5×, K+ = 1.3×, Mg2+ = 1.1×, and Ca2+ = 1.4×). Only NH4+ concentrations were comparable (spruce: 76 ± 17 µeq·L−1 vs. beech: 77 ± 17 µeq·L−1). Decreases in throughfall were detected only for Ca2+ concentrations in the spruce stand. Throughfall concentration of Na+ in the spruce stand were 189% greater and in the beech plot 88% greater than in bulk precipitation. As a result, concentrations of potential acidity ACpot decreased since 2005 by about 30% in the spruce and by 20% in the beech stand (Figure 1).
3.2. Soil Solution Chemistry
3.2.1. Anion Concentrations
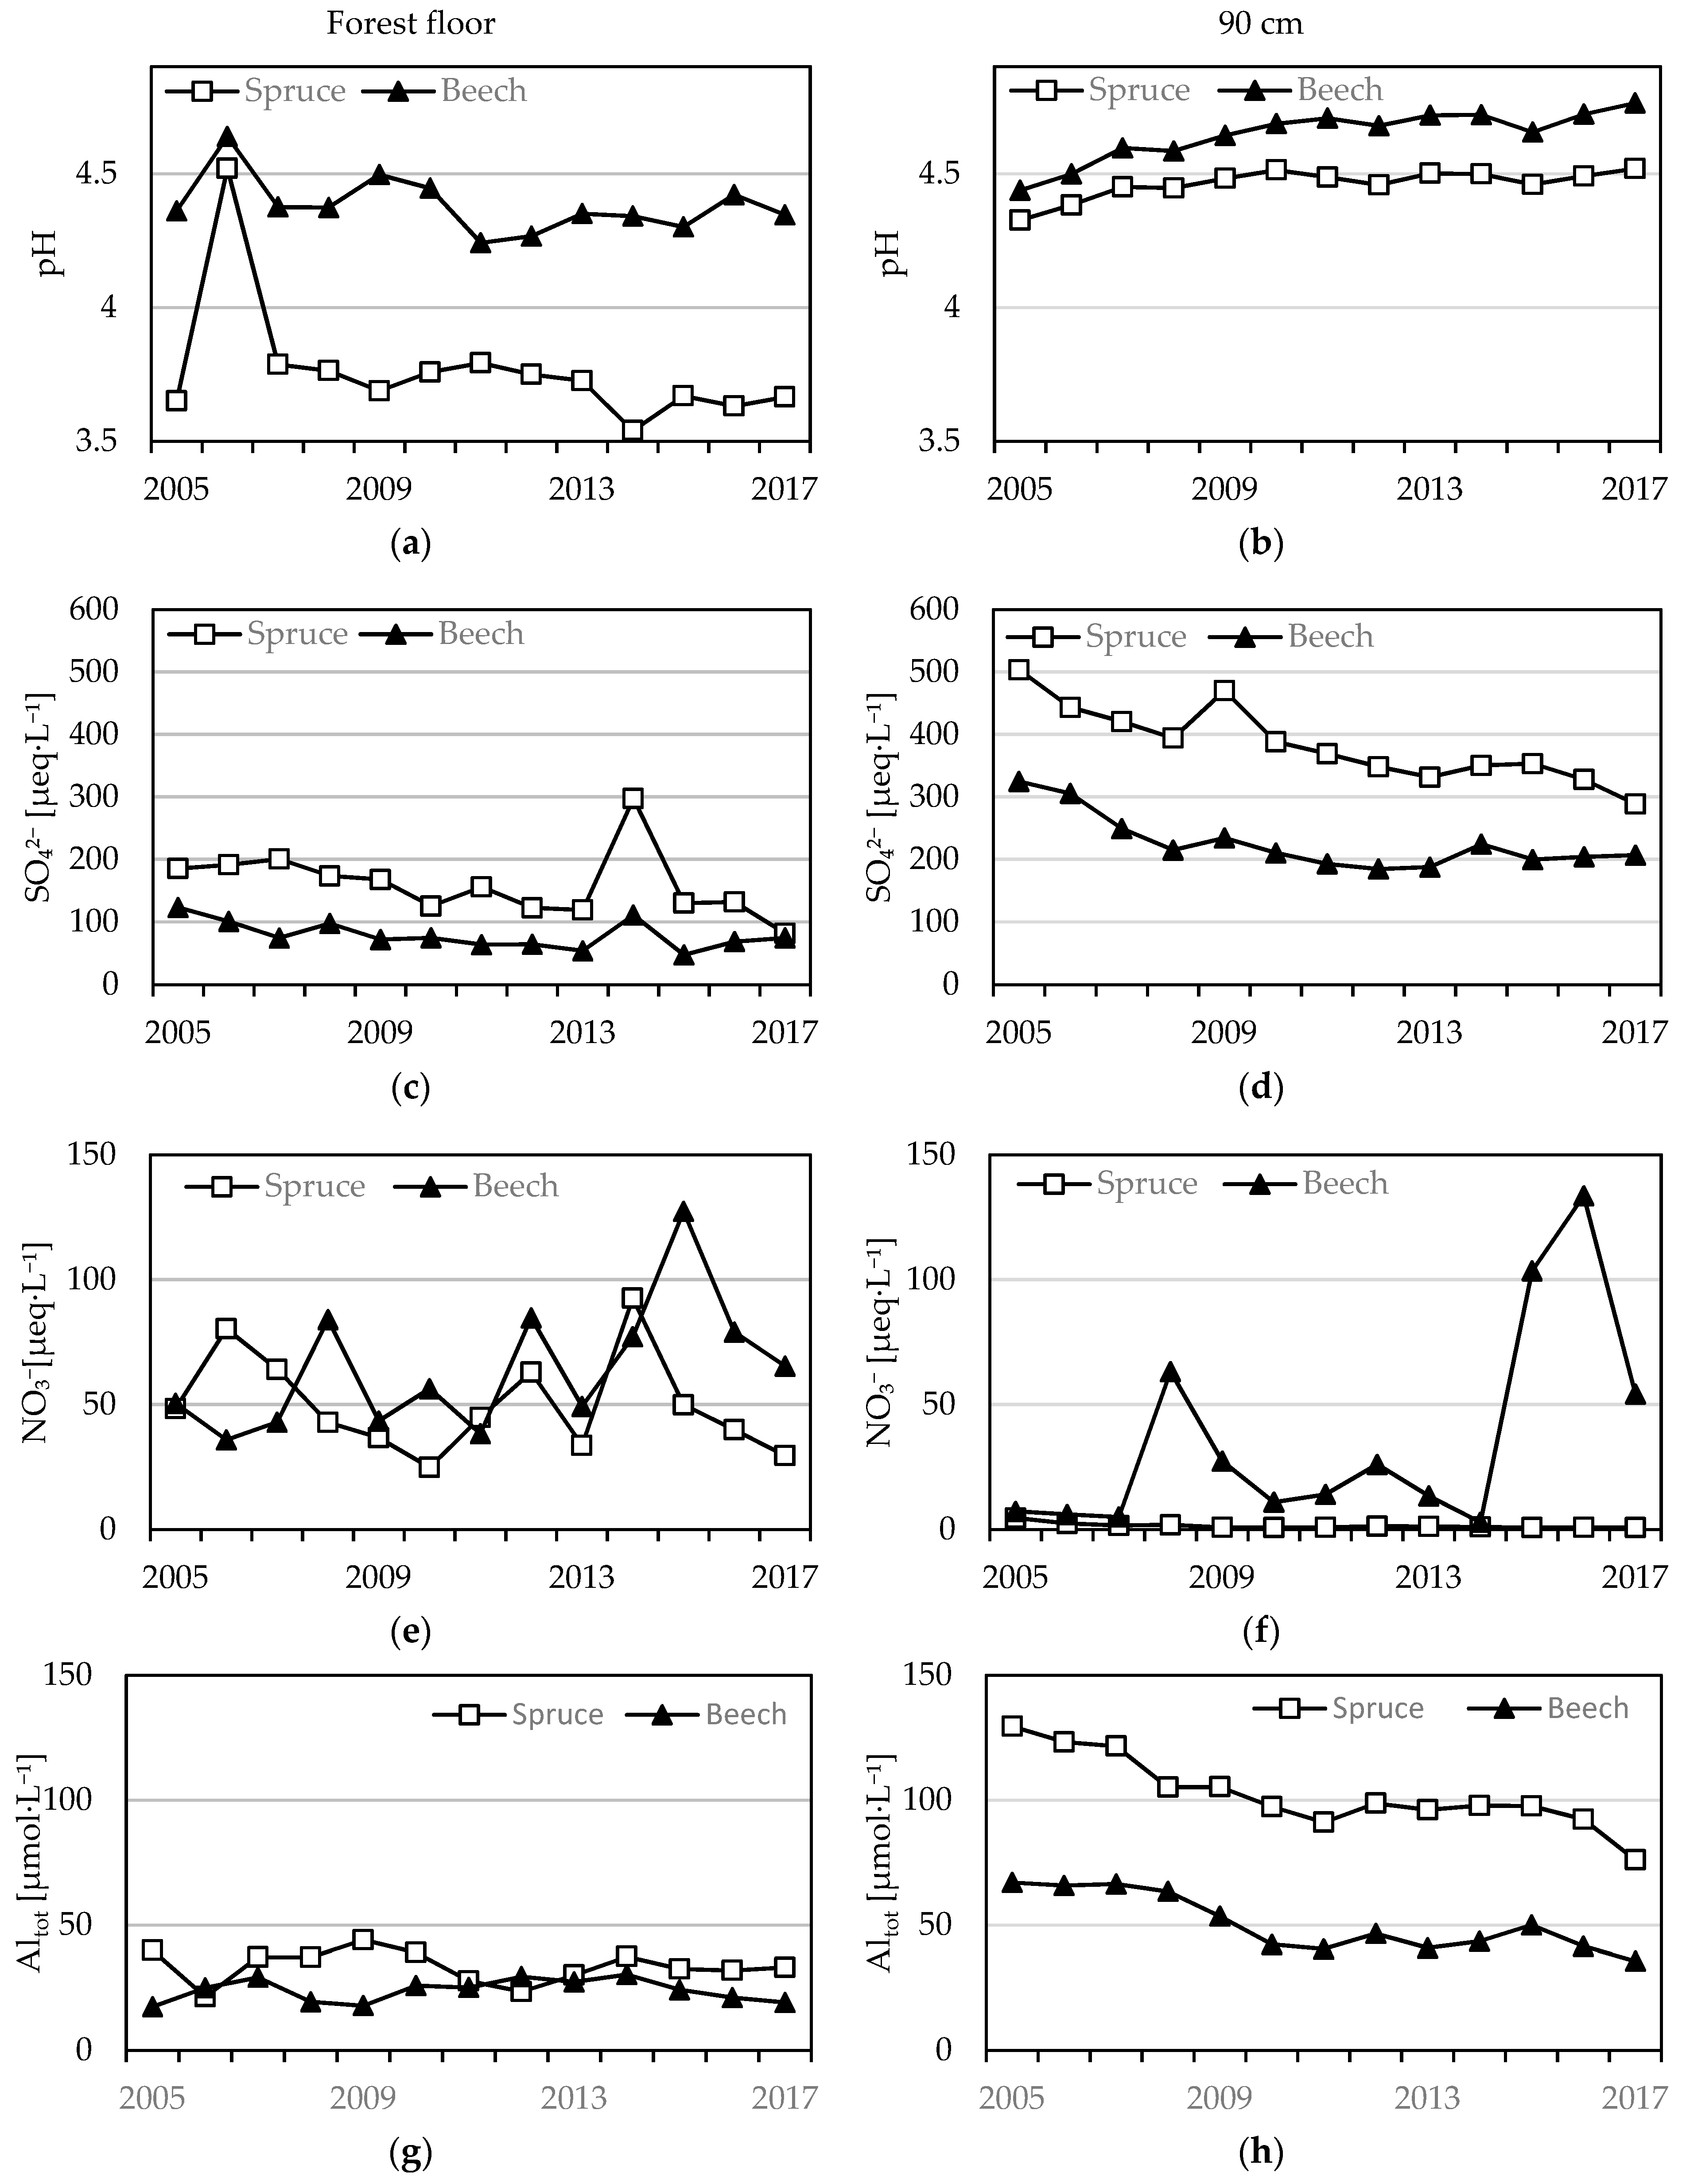
SO42− concentrations decreased over the course of the study period at all depths in both stands. SO42− concentrations in all soil horizons of the spruce stand were greater than in the beech stand (Table 1). The lowest SO42− concentrations were measured in forest floor solutions, where they declined from 185 to 81 µeq·L−1 under spruce, whereas in the beech they averaged 78 ± 22 µeq·L−1 (Figure 2).
Concentrations of SO42 in mineral soil in the spruce stand were similar across the soil profile and significant declines from 494, 467, and 504 µeq·L−1 in 2005 to 341, 359, and 289 µeq·L−1 in 2017 at 30 cm, 60 cm, and 90 cm, respectively, were detected (Figure 2). The annual average concentrations in the beech stand were 97, 244, and 324 µeq·L−1 in 2005 and significantly (except at 30 cm depth) declined to 79, 155, and 206 µeq·L−1 in 2017 at 30 cm, 60 cm, and 90 cm depths, respectively (Table 1).
Annual NO3− concentrations significantly differed between the plots. Mean NO3− concentrations from each horizon of the spruce stand were significantly lower compared to the beech stand. In the forest floor soil solution, NO3− concentrations averaged 50 ± 53 µeq·L−1 and 65 ± 25 µeq·L−1 in the spruce and beech, respectively (Figure 2). In the mineral soil in the spruce stand, NO3− concentrations declined with increasing depth (from 8 µeq·L−1 in 30 cm to 4.7 µeq·L−1 in 90 cm in 2005) and continually declined (at 30 and 90 cm significantly), until they dropped under the detection limits in 2017 (Figure 2). Conversely, in the beech stand, NO3− concentrations insignificantly increased over time. Between 2014 and 2017 enhanced NO3− concentrations were measured, however without detected trends. NO3− concentrations varied around 28 ± 86 µeq·L−1, 52 ± 16 µeq·L−1, and 36 ± 75 µeq·L−1 in 30 cm, 60 cm, and 90 cm, respectively (Table 1).
Mean annual Cl− concentrations in mineral soil increased with depth from 27 to 44 µeq·L−1 under spruce and from 37 to 50 µeq·L−1 under beech without any temporal trends.
3.2.2. pH, Al Concentrations and Al Speciation
In both stands, the measured pH of the soil solution from the forest floor was lower when compared to mineral soil water (Figure 2). The pH of the forest floor solution from the spruce stand decreased significantly from 3.98 to 3.66. The soil solution pH from the forest floor in the beech stand decreased slightly from 4.36 to 4.34, albeit insignificantly. Over the observation period, the soil solution pH in the mineral soil increased in both stands. The pH in the spruce mineral soil solution was similar among all horizons and significantly increased from 4.25 to 4.47. In the beech stand, pH at 30 cm depth remained unchanged (4.53 ± 0.13), but at 60 cm and 90 cm it increased significantly from 4.45 to 4.79 and from 4.43 to 4.76 (Table 1).
Soil solution total Al (Altot) concentrations from the forest floor of both stands were stable during the observed period (Figure 2). The concentrations of Altot in the spruce stand were significantly greater (33 ± 15 µmol·L−1) than in the beech stand (24 ± 8 µmol·L−1). In both stands, the Altot concentrations from mineral soil solutions were greater when compared to water draining the forest floor and decreased significantly over the course of the study period. Soil solution Altot concentrations from all depths in the mineral soil under spruce were similar, ranging between 131 and 121 µmol·L−1 in 2005, and the concentrations decreased significantly to values ranging from 98 to 76 µmol·L−1 in 2017. Soil solution Altot concentrations in the mineral soil in the beech stand solution increased insignificantly at 30 cm from 30 µmol·L−1 to 36 µmol·L−1. Altot concentrations in deeper horizons simultaneously decreased from 51 µmol·L−1 at 60 cm and 67 µmol·L−1 at 90 cm in 2005 and then convergated around 32 µmol·L−1 in 2017 (Table 1).
Out of the Al forms composing Altot, organically bound Alorg concentrations in the spruce stand gradually decreased with depth from 11.8 ± 2.1 µmol·L−1 in the forest floor to 2.5 ± 0.6 µmol·L−1 at 90 cm. By contrast, Alorg in the beech stand showed similar values in forest floor soil solutions (9.8 ± 2.0 µmol·L−1) and at 30 cm (10.2 ± 1.5 µmol·L−1). In deeper horizons, Alorg concentrations were similar (5.3 ± 1.2 µmol·L−1 and 3.7 ± 0.9 µmol·L−1 in 60 cm and 90 cm). Inverse concentrations as compared to Alorg were detected by inorganic monomeric Alin in both stands, with low concentrations in the forest floor solution and high concentrations in mineral soil horizons. Alin concentrations were low in the forest floor solution from both stands (9.0 ± 4.1 µmol·L−1 and 2.6 ± 1.0 µmol·L−1 in spruce and beech stands, respectively). Whereas, in the mineral soil under spruce, Alin concentrations were similar, ranging from 100 to 118 µmol·L−1 in 2005 and converged in 2017 to a roughly similar value across the whole profile ≈ 80 µmol·L−1, in the beech stand, Alin concentrations continuously increased with depth from 13.8 ± 4.0 µmol·L−1 at 30 cm, over 28.8 ± 10.6 µmol·L−1 at 60 cm to 38.1 ± 9.4 µmol·L−1 at 90 cm. Alin concentrations in the mineral soil at both sites followed the trend of Altot concentrations. Acid-soluble Al (Alas) concentrations in the spruce stand were stable in the forest floor (14.0 ± 3.3 µmol·L−1). In mineral soil horizons, they decreased by about 60–70% from 28 µmol·L−1 at all depths to the range of 3–8 µmol·L−1. In upper beech horizons, Alas concentrations were stable, and in lower horizons they decreased in the period 2005–2017 from 17 to 6 µmol·L−1 in 60 cm and from 19 to 5 µmol·L−1 in 90 cm.
When comparing the distribution of particular Al forms to Altot, we can conclude that Alin from the forest floor soil solution consisted of 27% of Altot in the spruce stand and only 11% in the less acidic beech stand. The contribution of Alin to Altot under spruce was stable (84%, 83%, and 89% at 30 cm, 60 cm, and 90 cm), and in the mineral soil under beech it continuously increased with depth (39%, 67%, and 74% in 30 cm, 60 cm, and 90 cm). Similar proportions of organically-bound Al (Alorg) were found in both forest floor solutions (spruce: 35% vs. beech: 40%); however, in the spruce stand, with increasing depth Alorg was lower (4%, 6%, and 2% at 30 cm, 60 cm, and 90 cm, respectively) as compared to the beech stand, where Alorg accounted for 28%, 12%, and 7% at 30 cm, 60 cm, and 90 cm, respectively (Figure 3).
3.2.3. NH4+, Na+, K+, Mg2+, Ca2+, and the Bc/Alin Ratio
In both stands, NH4+ concentrations decrease very rapidly with depth. A sharp decrease was measured between the forest floor and the mineral soil. In forest floor leachates, the NH4+ concentrations were stable at around 39 ± 52 µeq·L−1 and 17 ± 17 µeq·L−1 under spruce and beech, respectively (Figure 4). Analysis of variance proved significantly higher NH4+ concentrations in mineral soil solutions under beech when compared to under spruce at the depths of 30 cm (1.8 vs. 1.4 µeq·L−1) and 60 cm (2.5 vs. 1.4 µeql·L−1). However, annual concentrations at 90 cm were significantly greater in the spruce stand (1.2 vs. 0.94 µeq·L−1) (Figure 5).
In the soil solution, the Na+ concentrations increased with depth. The lowest Na+ concentrations were recorded on the forest floor; in the spruce stand, the concentrations varied around 39 ± 9 µeq·L−1, whereas in the beech stand were around 25 ± 13 µeq·L−1 (Figure 4). In the mineral soil under spruce, the concentrations were 86 ± 17 µeq·L−1, 102 ± 15 µeq·L−1, 72 ± 8 µeq·L−1 at the depths of 30, 60, and 90 cm, respectively. No trends in Na+ concentrations were observed in the beech stand, the average concentration being 49 ± 14 µeq·L−1 at 30 cm, 51 ± 9 µeq·L−1 at 60 cm, and 69 ± 31 µeq·L−1 at 90 cm depth (Figure 5).
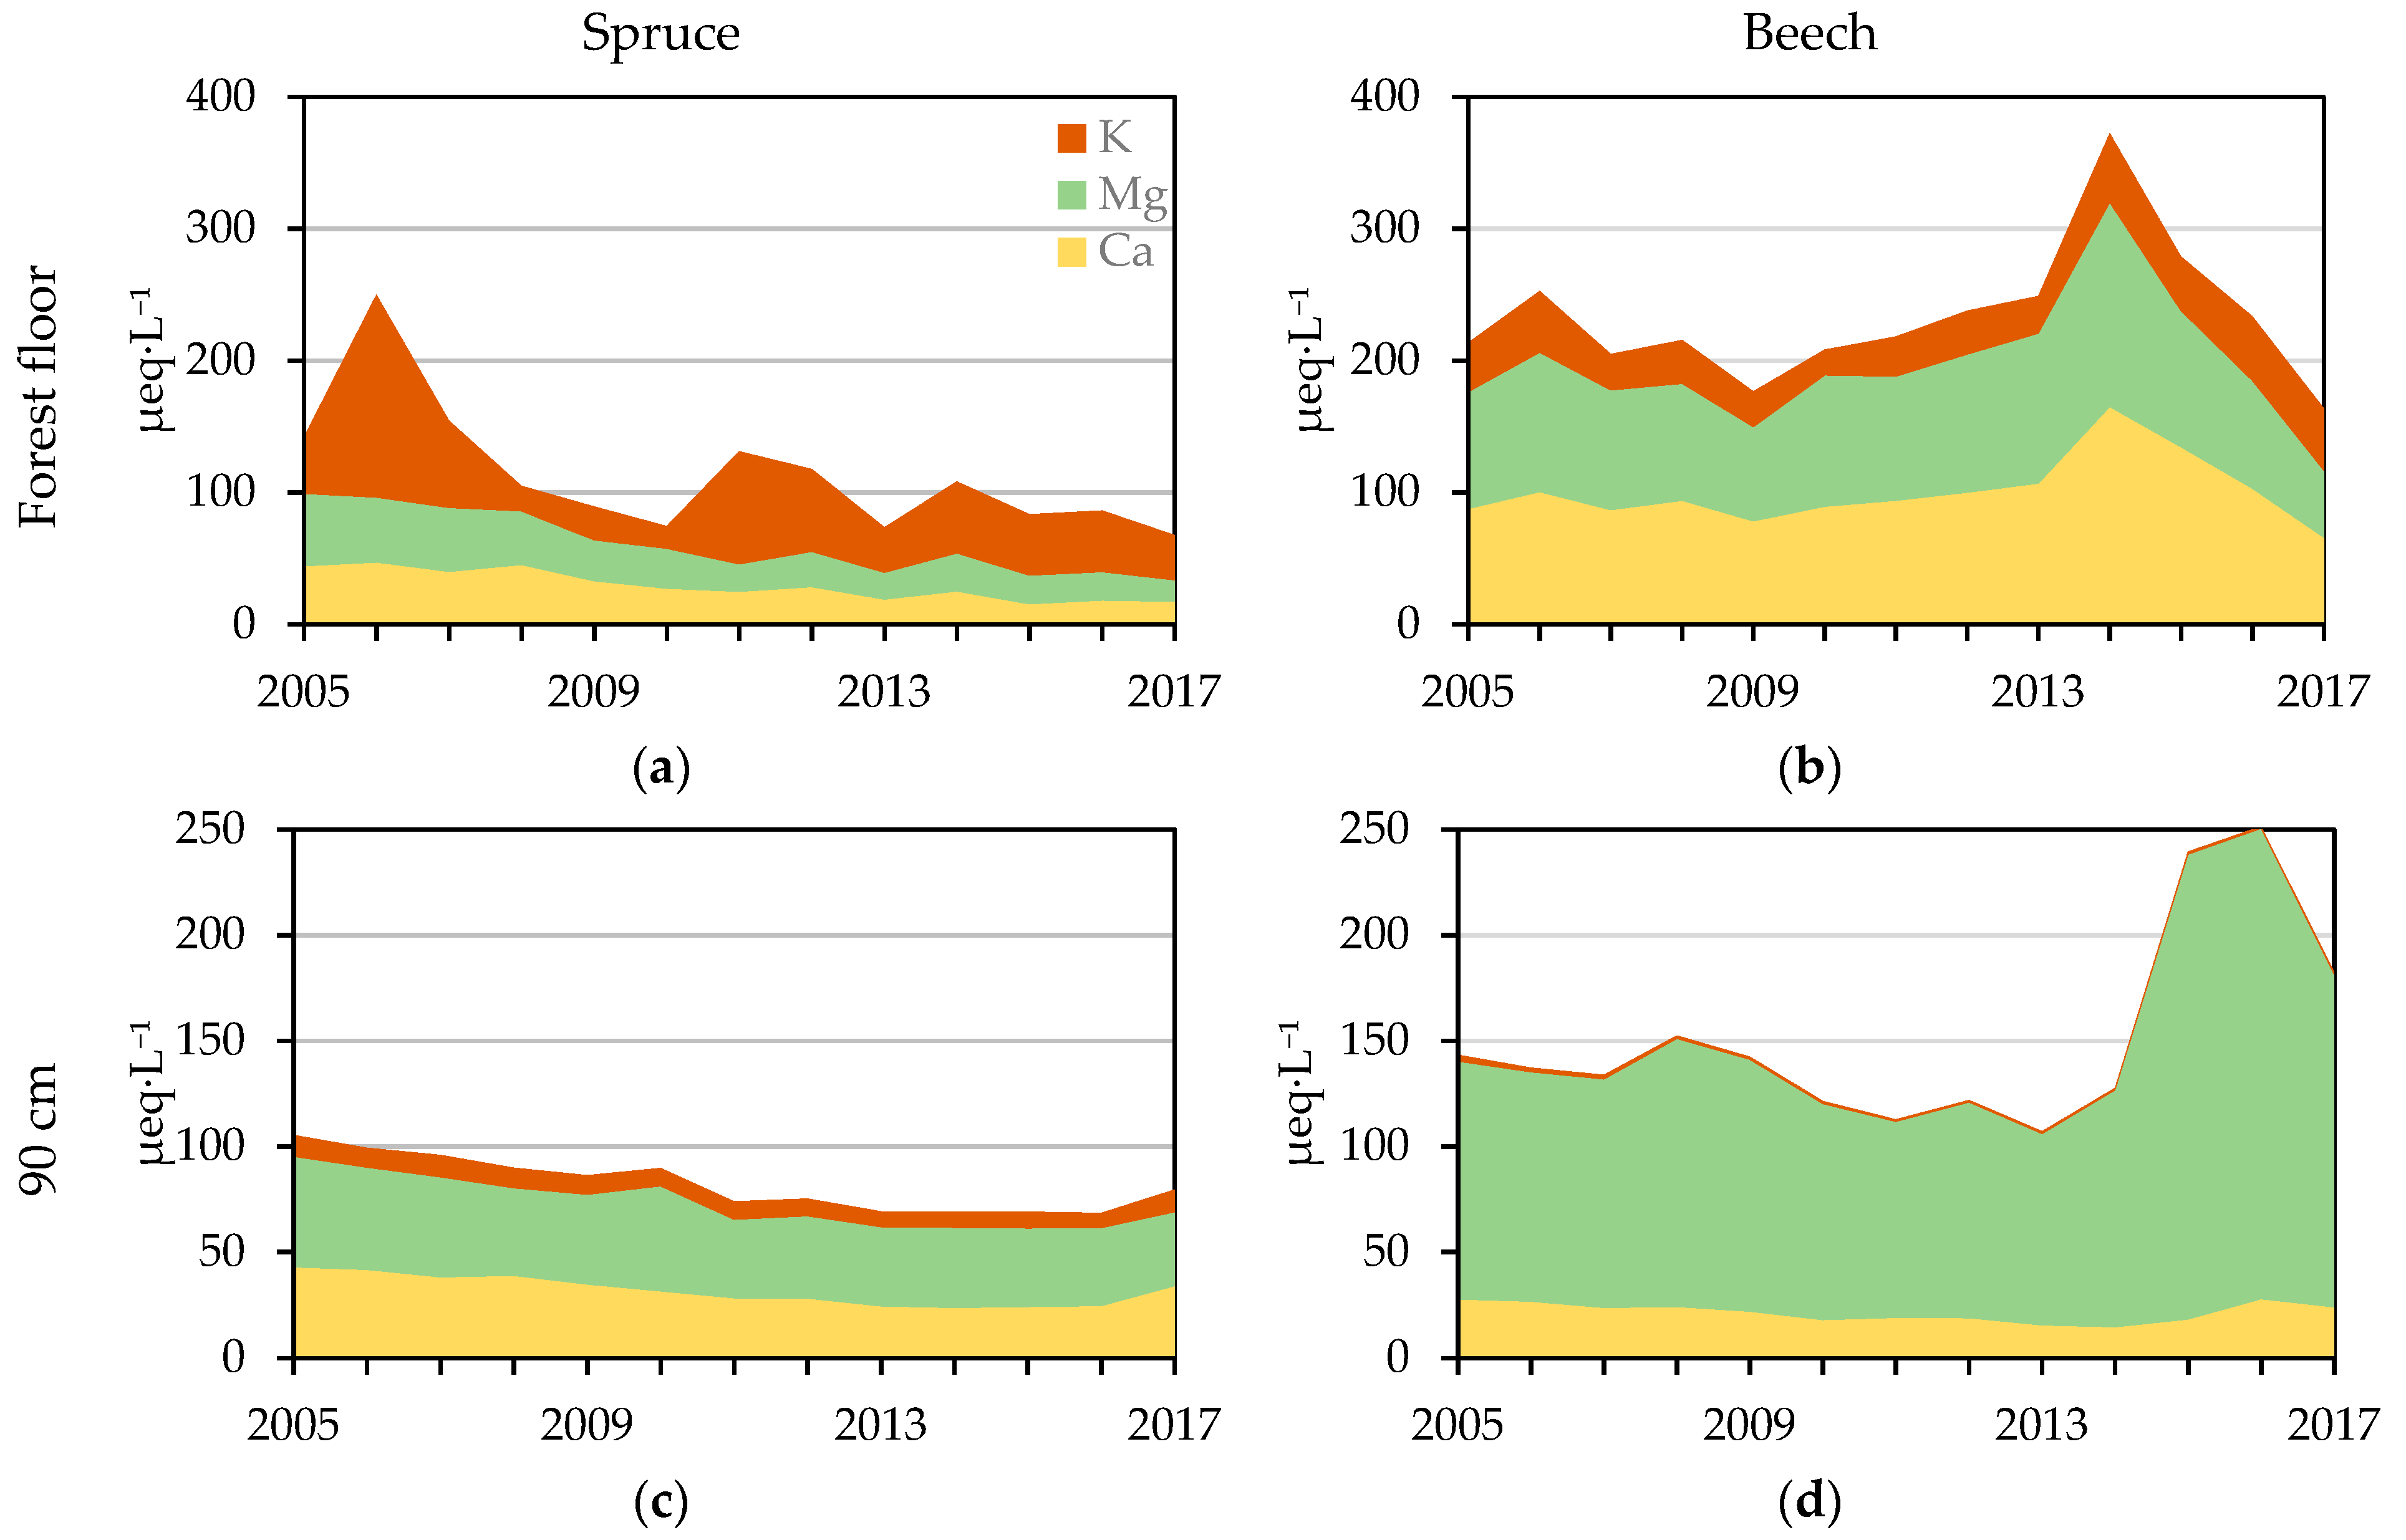
K+ concentrations in forest floor soil solutions were significantly greater when compared to mineral horizons. While, in the spruce stand, the K+ concentrations were 49 ± 72 µeq·L−1, in the beech stand they were lower, 36 ± 30 µeq·L−1 (Figure 6). Under spruce, K+ concentrations exhibited a downward trend at 30 cm and 90 cm (from 8.9, and 10.1 µeql·L−1 in 2005 to 5.8, and 7.1 µeq·L−1 in 2017 at 30 and 90 cm, respectively). Only at 60 cm (4.2 ± 2.5 µeql·L−1) no trend was observed. In the upper mineral soil horizon in beech stand, no change was detected (3.2 ± 1.8 µeql·L−1 and 2.7 ± 1.0 µeql·L−1 at 30 and 60 cm, respectively). Only at 90 cm a decreasing trend was recorded (from 3.1 µeq·L−1 in 2005 to 2.11 µeq·L−1 in 2017).
Spruce stand Ca2+ concentrations in the forest floor soil solution were significantly lower when compared to the beech stand. Although no significant trend in the beech stand was observed, the Ca2+ concentrations (101 ± 50 µeq·L−1) were three times greater when compared to the spruce stand, where a significant decrease was detected—decrease from 44 µeq·L−1 in 2005 to 18 µeq·L−1 in 2017. Differences in the mineral soil of both stands were not large. In the spruce stand, the Ca2+ concentrations increased with depth but Ca2+ concentration decreased with time (from 24, 31 and 43 µeq·L−1 in 2005 to 8, 16, and 34 µeq·L−1 in 2017 at 30 cm, 60 cm, and 90 cm, respectively). Ca2+ concentrations in all mineral horizons in the beech stand were similar. The main decrease was detected at 30 cm, where the Ca2+ concentrations decreased significantly from 43 µeq·L−1 in 2005 to 13 µeq·L−1 in 2017. In other horizons, the decrease was not pronounced; only at 90 cm an insignificant decline from 27 µeq·L−1 in 2005 to 24 µeq·L−1 in 2017 was detected (Figure 6).
A similar course was detected for Mg2+ concentrations (Figure 6). In the spruce stand, a significant decline was detected in all horizons—from 55, 87, 61, and 53 µeq·L−1 in 2005 to 16, 32, 45, and 35 µeq·L−1 in 2017 in the soil solution from the forest floor at 30 cm, 60 cm, and 90 cm, respectively. In contrast to the spruce stand, no decline was observed in Mg2+ concentrations in anyone horizon in the beech stand. Average Mg2+ concentrations were 96 ± 23 µeq·L−1, 77 ± 19 µeql·L−1, 119 ± 32 µeq·L−1, 129 ± 42 µeq·L−1 in the forest floor and at 30 cm, 60 cm, and 90 cm, respectively.
The sum of BC cations (K + Ca + Mg) differed significantly between the stands. At all depths in the spruce stand, BC declined significantly from 142, 120, 104, and 105 µeq·L−1 in 2005 to 68, 46, 67, and 79 µeq·L−1 in 2017 in the soil solution from the forest floor and at the depths of 30 cm, 60 cm, and 90 cm, respectively (Figure 4, Figure 5 and Figure 6). In the beech stand, BC concentrations decreased between 2005 and 2013, but in the period of 2013–2016, higher concentrations in all mineral horizons were recorded. Therefore, a significant decrease (from 180 µeq·L−1 in 2005 to 136 µeq·L−1 in 2017) was detected only at the depth of 30 cm. Mean BC concentrations were the highest in the forest floor soil solution (233 ± 102 µeq·L−1), followed by those at the depth of 90 cm (151 ± 60 µeq·L−1), and then those at 60 cm (147 ± 44 µeq·L−1).
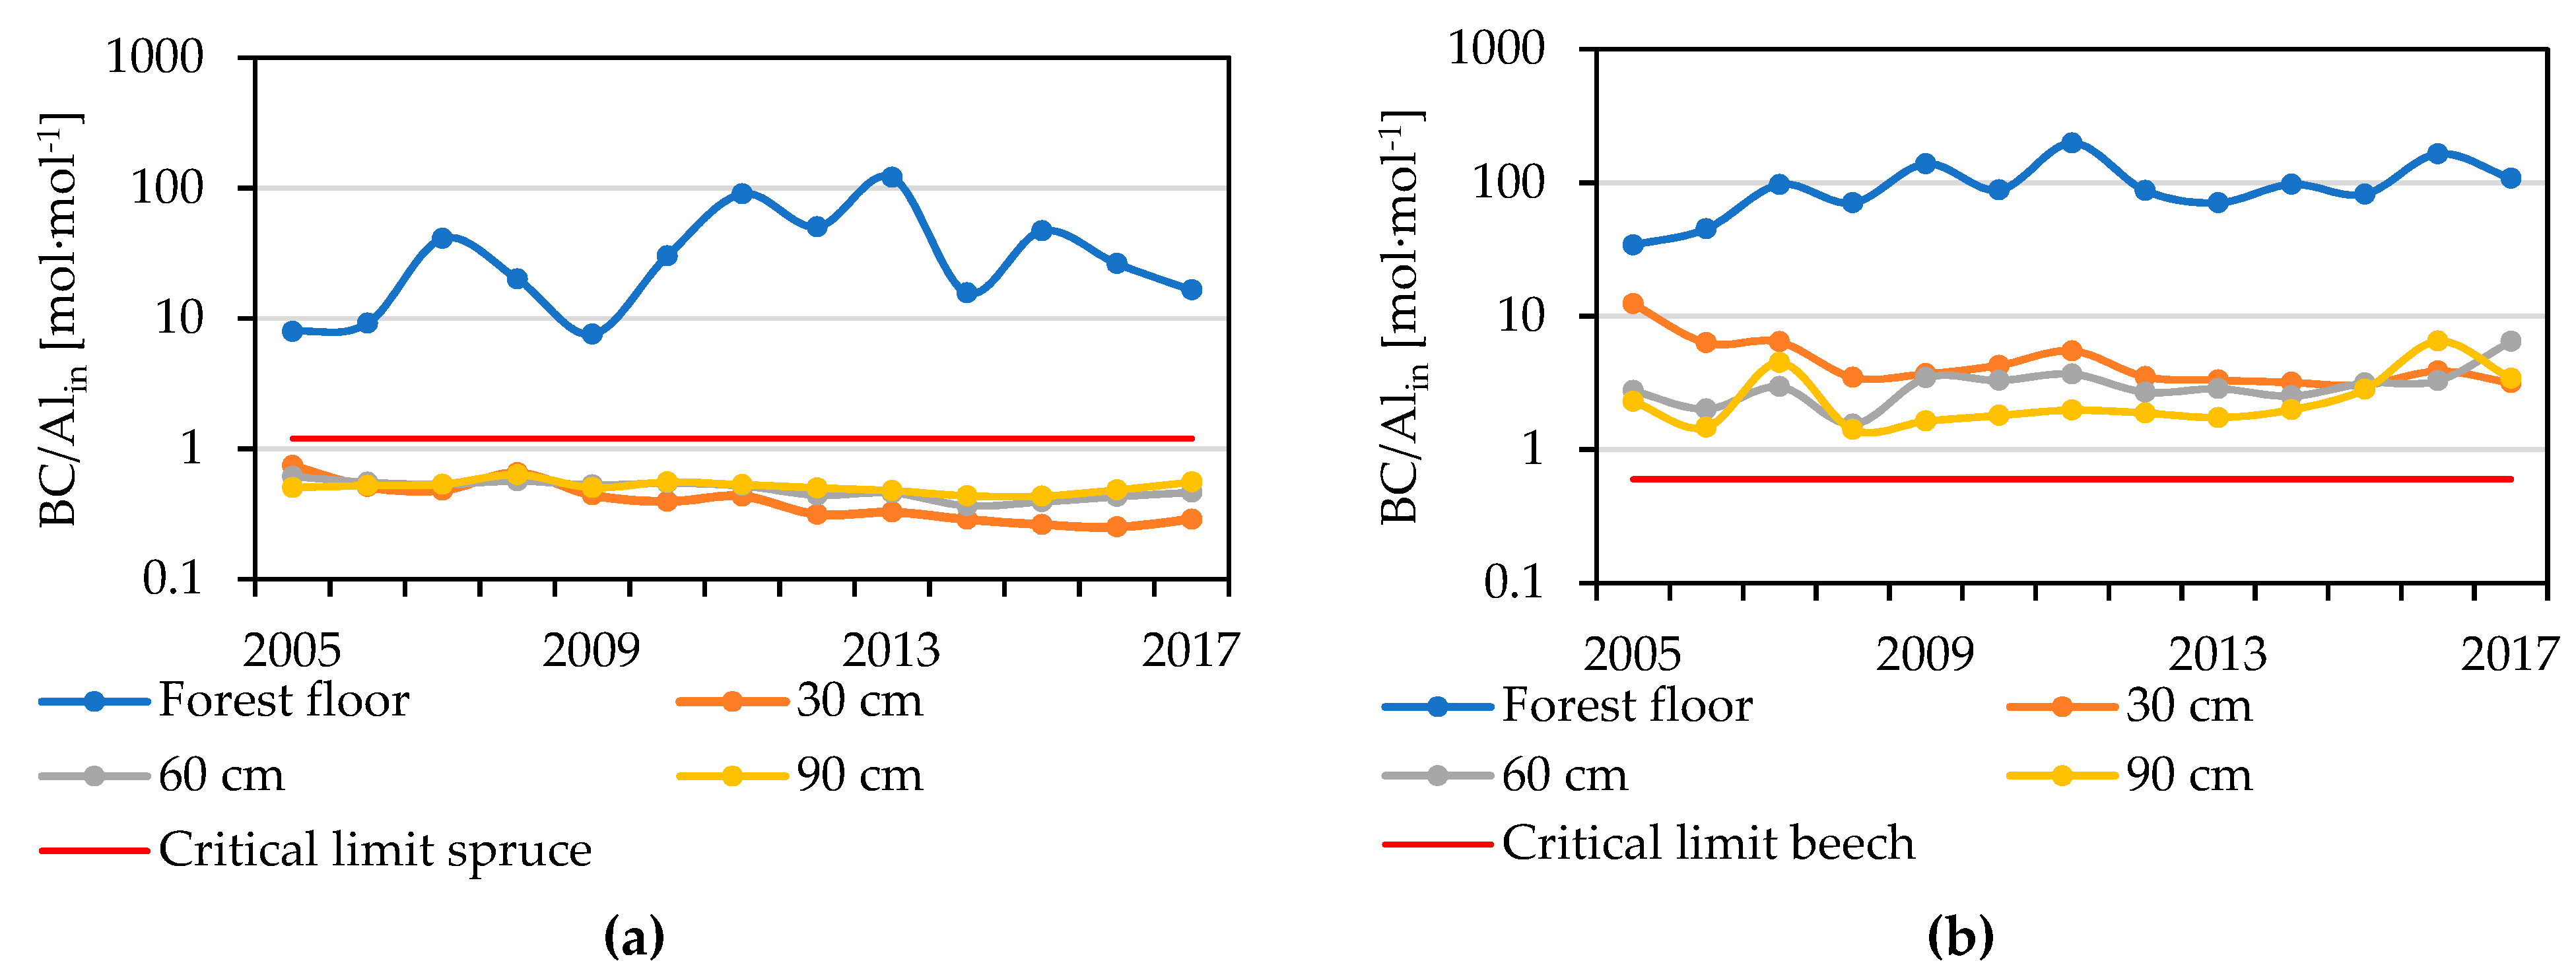
The molar ratio of base cation concentrations to Alin (Bc/Alin) fluctuated in the forest floor of spruce stand around 37 ± 32 and significantly increased from 34 to 142 in the beech stand (Table 1). In the mineral soil of the spruce stand, Bc/Alin ratios were below the critical limit of 1.2 (Figure 7), but significant declines were observed at the depths of 30 cm and 60 cm (from 0.7 to 0.3 at 30 cm and from 0.6 to 0.4 at 60 cm) between 2005 and 2017; at 90 cm, the ratios varied around 5.3 ± 0.9 during this period. Bc/Alin ratios in the mineral soil solutions in the beech stand decreased significantly from 11.3 to 3.1 at 30 cm, levelled off around 3.1 ± 1.1 at 60 cm, and significantly increased from 2.3 to 3.4 at 90 cm, which is above the critical limit for beech roots 0.6 (Figure 7).
3.2.4. DOC, DON Concentrations, and the DOC/DON Ratio
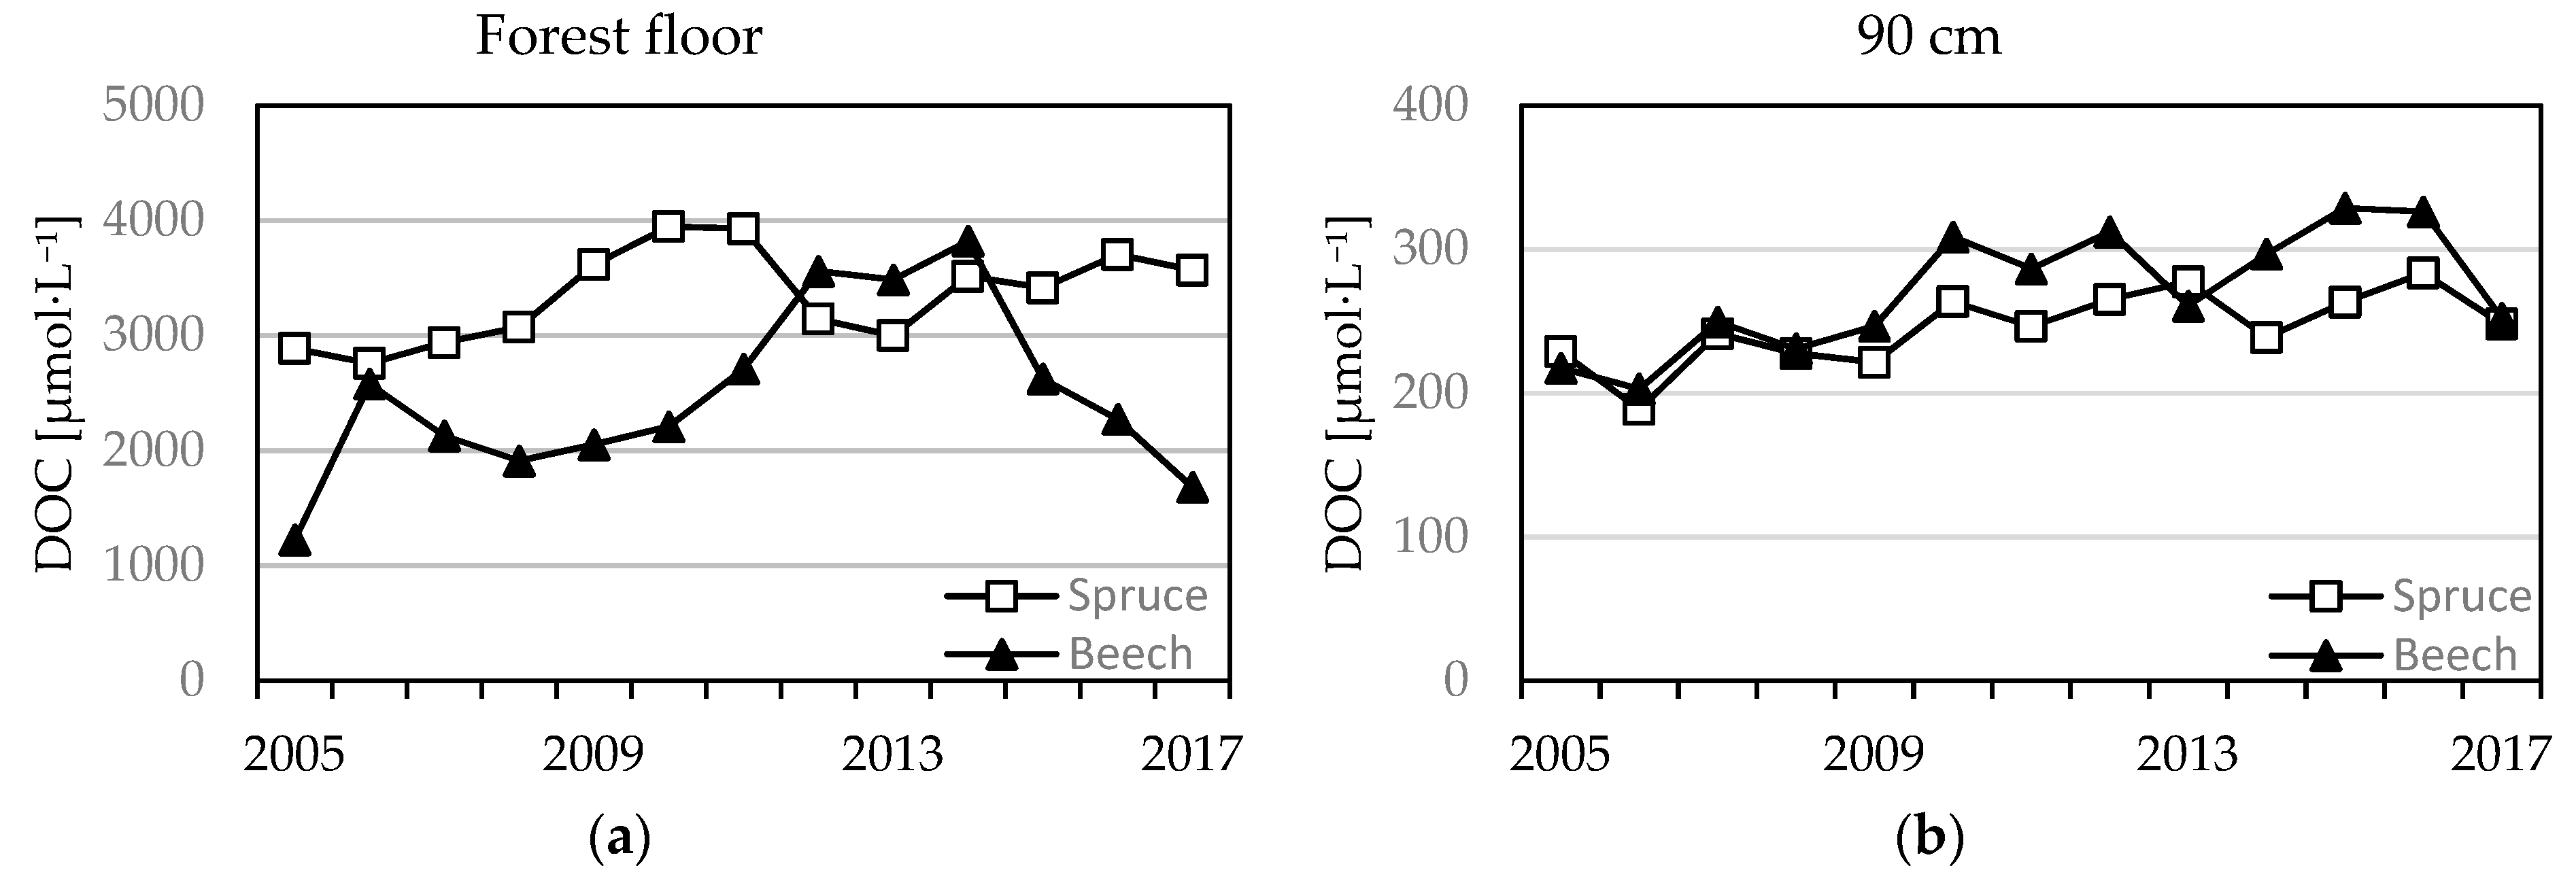
Soil solution DOC concentrations that were collected from the forest floor were greater in the spruce stand when compared to the beech stand (Figure 8). Significant change was detected only at spruce stand (from 2900 to 3600 µmol·L−1), at the beech no change was observed (2500 ± 730 µmol·L−1). Soil solution DOC concentrations in the mineral soil were lower at both stands when compared to forest floor leachates. Significant increases in the spruce stand were observed only at 90 cm (Figure 8). DOC concentrations in the mineral soil under beech decreased with soil depth; however, the observed temporal trends differed across soil depths. In the 30 and 60 cm horizons, concentrations declined significantly (from 1040 to 680 µmol·L−1 at 30 cm and from 420 to 360 µmol·L−1 at 60 cm), but in the 90 cm (Table 1), a significant increase was detected (from 220 to 250 µmol·L−1).
Concentrations of dissolved organic nitrogen (DON) in both forest floor solutions showed no change and they levelled off around 79 ± 18 µmol·L−1 in the spruce stand and 59 ± 14 µmol·L−1 in the beech stand between 2005–2017. In the mineral soil, DON concentrations were lower when compared to the forest floor soil solution in both stands. Under the spruce canopy, the DON concentrations remained stable in the whole profile (13 ± 3 µmol·L−1, 16 ± 2 µmol·L−1 6 ± 1 µmol·L−1 at 30 cm, 60 cm, and 90 cm). The same trend was observed under beech stand (24 ± 6 µmol·L−1, 18 ± 8 µmol·L−1, and 15 ± 9 µmol·L−1 at 30 cm, 60 cm, and 90 cm).
Average values of the DOC/DON ratio in the forest floor solution in the spruce and beech plot were 48 ± 9 mol·mol−1 and 52 ± 18 mol·mol−1, respectively, without any significant temporal trend. Whereas, the mean DOC/DON ratio under spruce at 30 cm depth was comparable with that at the beech plot (spruce: 40 ± 9 mol·mol−1 and beech: 42 ± 12 mol·mol−1), in lower horizons, this ratio was greater under spruce (39 ± 7 mol·mol−1 and 48 ± 12 mol·mol−1 at 60 cm and 90 cm, respectively) as compared to beech (27 ± 9 mol·mol−1 and 31 ± 12 mol·mol−1 at 60 cm and 90 cm, respectively).
3.3. Water Balance
At both stands, no significant temporal trend in annual bulk and throughfall precipitation was detected over the period of 2005–2017. Mean annual bulk precipitation was 1122 ± 117 mm, and throughfall precipitation was 941 ± 95 mm and 756 ± 109 mm under the beech and spruce canopy, so interception accounted for 17% and 33%, respectively. Stemflow was an important part of beech throughfall, accounting for 20% of bulk precipitation. In the spruce stand, the Simpel model calculated a large decrease in seepage water flux below the organic horizon. In the beech stand, a main water seepage flux decrease was calculated between 30 cm and 60 cm of soil depth. The water flux draining soil in the 90 cm horizon was 430 ± 130 mm in the spruce stand (38% of bulk precipitation) and 511 ± 101 mm in the beech stand (45% of bulk precipitation). Annual average bulk and throughfall precipitation, calculated seepage water flux and actual transpiration are presented in Table 2. Calculated mean annual actual transpiration was 207 ± 31 mm in the spruce stand and 345 ± 27 mm in the beech stand. Measured transpiration during the vegetation season of 2017 well represented the modelled data from the Simpel model. During 2017, actual measured transpiration was 165 mm and 337 mm in the spruce and beech stand, respectively.
3.4. Mass Balance
The BC flux in precipitation did not change since 2005 and averaged 4.2 ± 0.8 kg·ha−1·year−1 in bulk precipitation, 30 ± 10.5 kg·ha−1·year−1 in beech throughfall (including stemflow), and 30 ± 4.1 kg·ha−1·year−1 in spruce throughfall. Furthermore, no temporal changes were detected in the bulk fluxes of individual cations (average deposition: Na = 2.5 ± 1 kg·ha−1·year−1, K = 1.4 ± 0.5 kg·ha−1·year−1, Ca = 2.2 ± 0.4 kg·ha−1·year−1, and Mg = 0.64 ± 0.2 kg·ha−1·year−1). Measured fluxes in throughfall were greater when compared to bulk fluxes, especially for K (beech: 14.5 ± 6 kg·ha−1·year−1 vs. spruce: 19.8 ± 3.1 kg·ha−1·year−1). The throughfall flux of Ca exhibited a significant decrease under spruce (from 9 to 6 kg·ha−1·year−1), whereas under beech the Ca throughfall flux remained unchanged (6.8 ± 1.5 kg·ha−1·year−1). Mg and Na fluxes in throughfall were 2.3 ± 0.3 kg Mg·ha−1·year−1 and 4.9 ± 1.3 kg Na·ha−1·year−1 under spruce and 2.1 ± 0.5 kg Mg·ha−1·year−1 3.1 ± 0.9 kg Na·ha−1·year−1 under beech, without any temporal change.
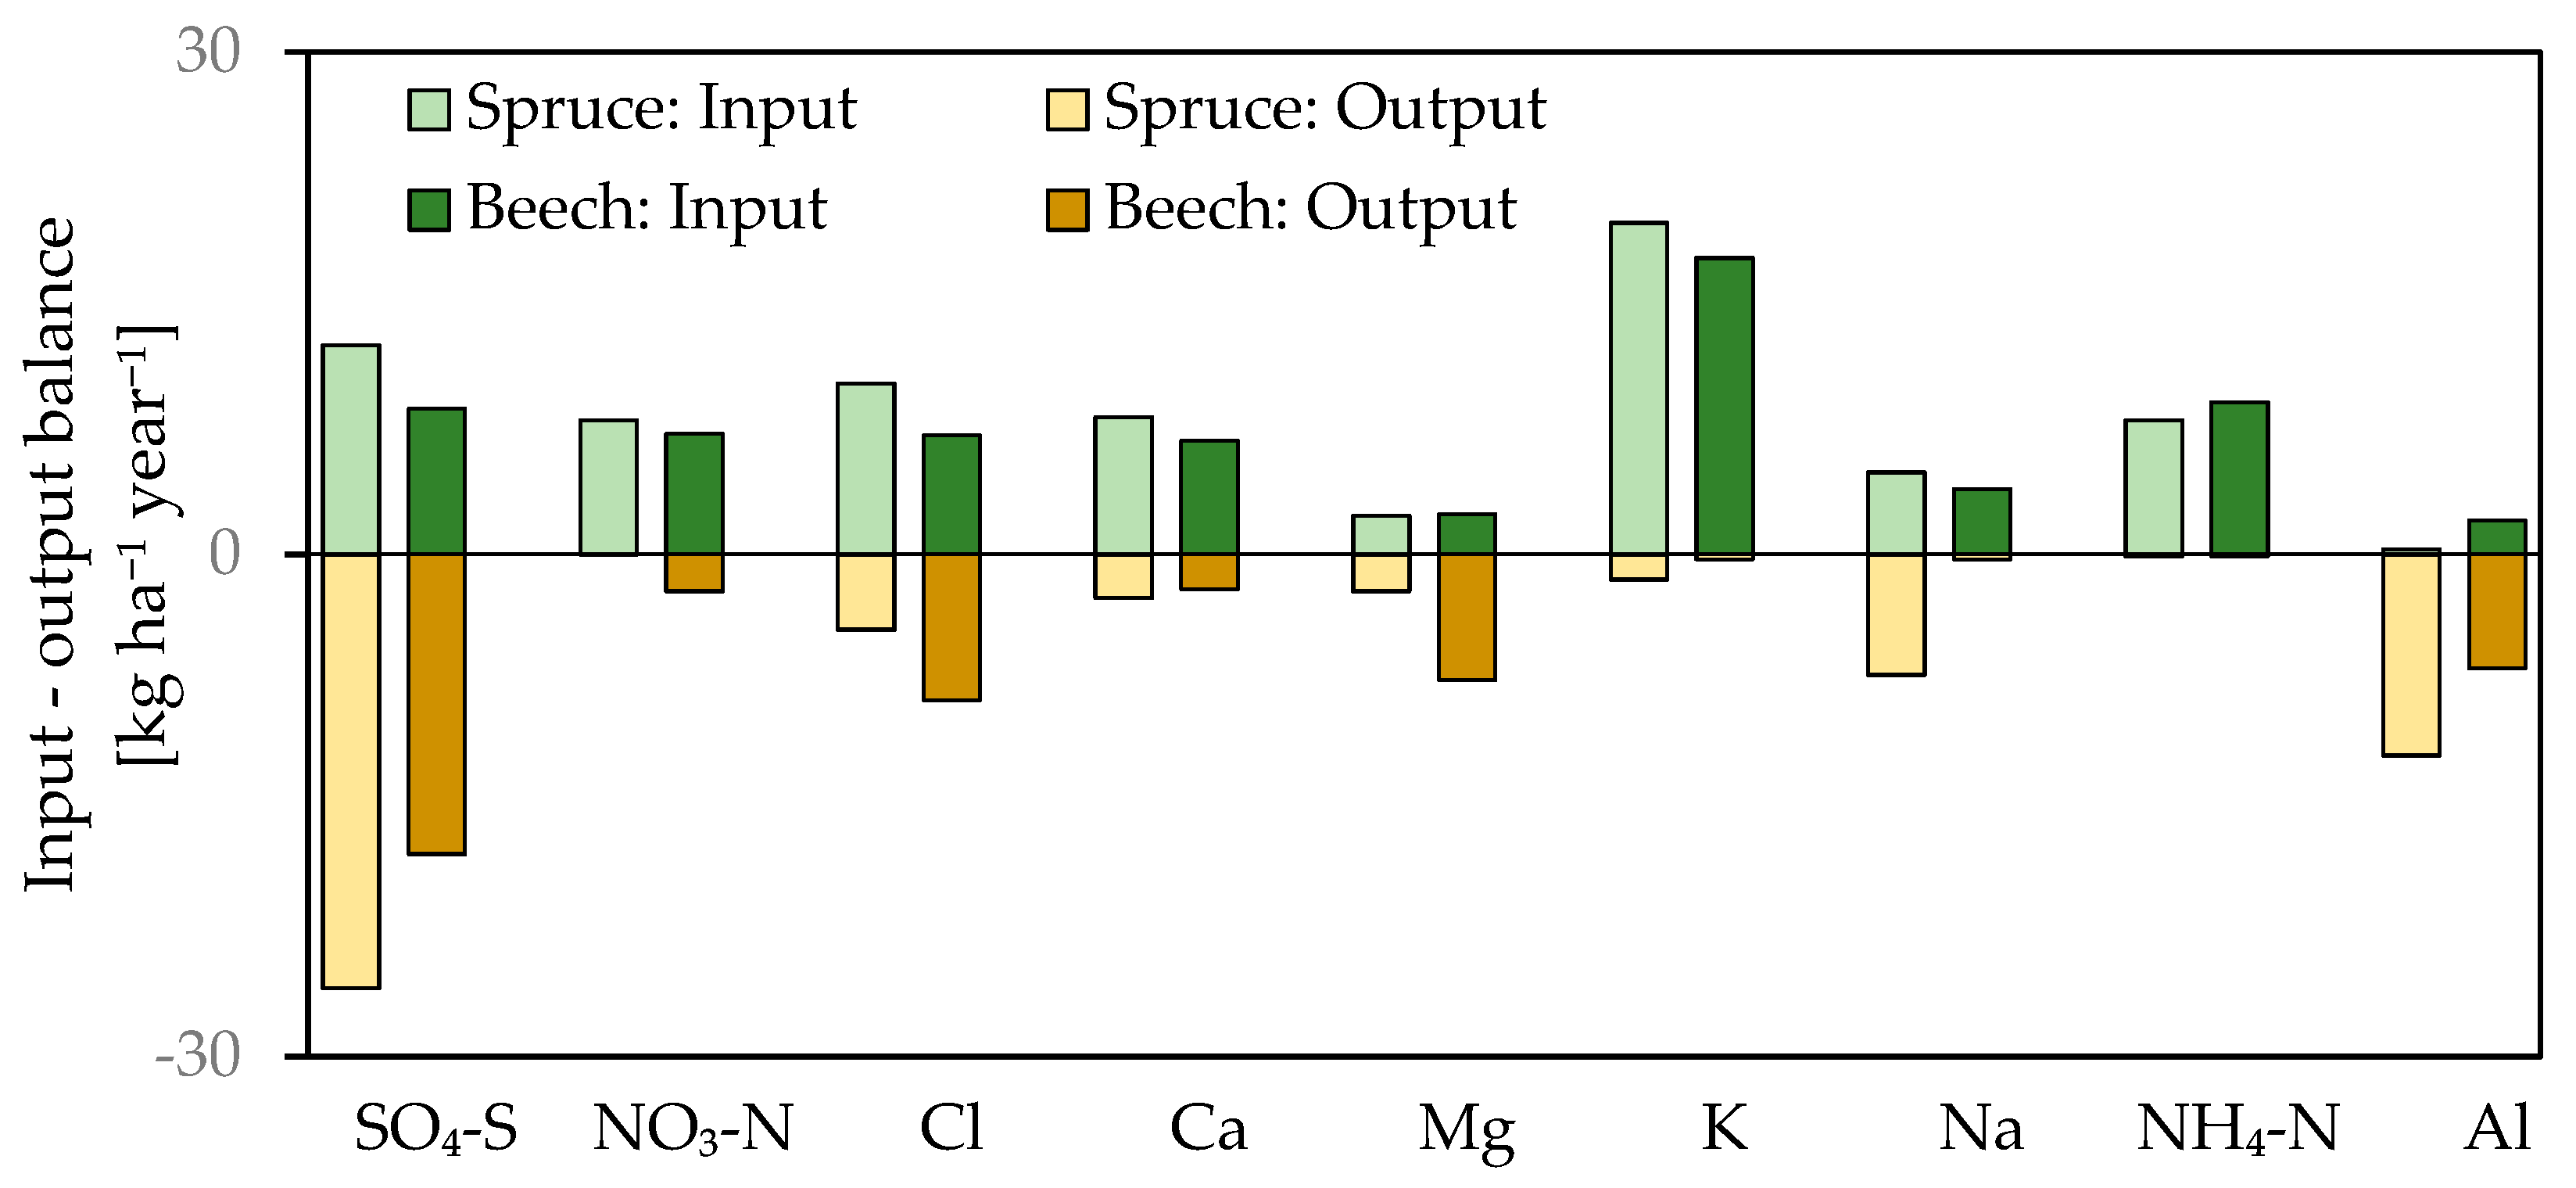
Within the soil profile of both stands, almost all K was retained (Figure 9). K flux decreased from 7 kg·ha−1·year−1 in the forest floor to 1 kg·ha−1·year−1 in 90 cm in the spruce stand, whereas under beech there was a rapid decline from the average of 12.5 kg·ha−1·year−1 in the forest floor to values around 1 kg·ha−1·year−1 in deep mineral soil. The Na flux increased at both stands from 4.5 kg·ha−1·year−1 in the forest floor to 8 kg·ha−1·year−1 at 90 cm. Significant differences were observed in Ca and Mg soil flux between the stands. The Ca flux from the forest floor in spruce varied around 2–3 kg·ha−1·year−1 within the whole soil profile, whereas under beech it decreased from 15 kg·ha−1·year−1 in the forest floor to 3 kg·ha−1·year−1 in 90 cm. The Mg flux was unchanged within the soil profile in both stands; however, in the spruce stand, the flux of Mg was lower when compared to the beech stand (spruce: 3 kg·ha−1·year−1 vs. beech: 7 kg·ha−1·year−1). Values of Al flux were lowest in the forest floor (5.7 kg·ha−1·year−1 and 5 kg·ha−1·year−1 under spruce and beech, respectively) and increased with depth to 13 kg·ha−1·year−1 and 7 kg·ha−1·year−1 in 90 cm in the spruce and beech stand, respectively.
Sulfur deposition in bulk precipitation decreased significantly from 5.8 to 2.9 kg·ha−1·year−1 between 2005 and 2017 (Table 3). The same trend was measured in the throughfall (+ stemflow) of both stands; in the spruce stand, the S flux decreased from 15.2 to 8 kg·ha−1·year−1 and in the beech stand from 10.9 to 5.5 kg·ha−1·year−1. Values of S fluxes within the soil profile were similar. In the beech stand, the flux of S increased continuously with depth (8.6 ± 1.7 kg·ha−1·year−1 in the forest floor, 10 ± 2.3 kg·ha−1·year−1 at 30 cm, 14.6 ± 4.4 kg·ha−1·year−1 at 60 cm, and 17.9 ± 3.7 kg·ha−1·year−1 at 90 cm, respectively); in the spruce stand, the increase was more pronounced when compared to the beech stand (15 ± 4.5 kg·ha−1·year−1 in the forest floor, 32 ± 11 kg·ha−1·year−1 at 30 cm, 30 ± 12 kg·ha−1·year−1 at 60 cm, and 26 ± 7.6 kg·ha−1·year−1 at 90 cm). When comparing throughfall inputs to 90 cm outputs, the S soil solution budget had negative balance under both stands (Figure 9), thus soil was the source of S.
Annual deposition of nitrate (N-NO3−) in bulk precipitation decreased significantly from 5.1 to 3.4 kg N·ha−1·year−1 (Table 3). N-NH4+ deposition remained unchanged (5.8 ± 0.9 kg·ha−1·year−1). In spruce throughfall, a significant decrease in N-NO3− flux was observed—from 11 kg·ha−1·year−1 to 6 kg·ha−1·year−1 between 2005 and 2017, whereas beech throughfall (+ stemflow) flux did not change since 2005 (7.2 ± 1.6 kg·ha−1·year−1). Leaching of N-NO3 from the forest floor was observed in both the spruce and beech stands. Under spruce, the mean annual flux was lower (3.9 ± 1.8 kg N-NO3·ha−1·year−1) when compared to beech (6.4 ± 2.0 kg N-NO3·ha−1·year−1). The N-NO3 flux in the mineral soil under spruce was 0.08 ± 0.05 kg N-NO3·ha−1·year−1 in 90 cm, whereas in the mineral soil under beech, leaching was higher with a mean N-NO3 flux at 90 cm of 2.2 ± 2.1 kg N-NO3 ·ha−1·year−1. Therefore, 98% and 42% of deposited N-NO3− in bulk precipitation was retained in the soil environment in both stands (Figure 9). The N-NH4+ flux in spruce throughfall declined significantly from 10.3 to 5.1 kg·ha−1·year−1, but in beech throughfall (+stemflow) no change was detected (9.1 ± 2.5 kg·ha−1·year−1). The leaching flux of N-NH4 from the forest floor was greater under spruce (3.4 ± 4.8 kg N-NH4 ·ha−1·year−1 under spruce and 1.8 ± 0.6 kg N-NH4 ha−1·year−1 under beech). A low NH4 flux (mostly below the detection limit) was measured in the mineral soil of both stands.
The mean DOC flux in bulk precipitation was 19 ± 6 kg·ha−1·year−1. Throughfall (+stemflow) was 85 ± 27 kg·ha−1·year−1 in the spruce stand and 46 ± 15 kg·ha−1·year−1 in the beech stand. DOC fluxes from forest floor were comparable in both stands (spruce stand: 253 ± 51 kg·ha−1·year−1 vs. beech stand: 235 ± 72 kg·ha−1·year−1). In the mineral soil, the DOC flux decreased sharply to 29 ± 12 kg·ha−1·year−1 at 30 cm, 33 ± 12 kg·ha−1·year−1 at 60 cm, and 12 ± 4 kg·ha−1·year−1 at 90 cm in the spruce stand, whereas in the beech stand the fluxes were 78 ± 14 kg·ha−1·year−1, 27 ± 9 kg·ha−1·year−1, and 16 ± 4 kg·ha−1·year−1 at 30 cm, 60 cm, and 90 cm, respectively (Table 3).
The annual DON flux in throughfall (+stemflow) deposition was 3.2 ± 2.2 kg·ha−1·year−1 in the spruce stand and 3.0 ± 1.6 kg·ha−1·year−1 in the beech stand. In the mineral soil, the values of DON flux were comparable between the stands; in the spruce stand, the DON flux decreased from 6.9 ± 1.8 kg·ha−1·year−1 in the forest floor to 0.4 ± 0.1 kg·ha−1·year−1 at 90 cm depth, whereas in the beech stand, the DON flux was highest in the forest floor (6.9 ± 2.1 kg·ha−1·year−1) and declined to 1.0 ± 0.4 kg·ha−1·year−1 at 90 cm depth (Table 3).
Atmospheric deposition of Cl was 4.1 ± 1.6 kg·ha−1·year−1 in bulk precipitation but it increased in spruce throughfall to 10.2 ± 2.8 kg·ha−1·year−1 and to 7.1 ± 3.2 kg·ha−1·year−1 in beech throughfall (+stemflow). Mineral soil Cl leaching was comparable among horizons (7.8 ± 1.7 kg·ha−1·year−1 in the forest floor and 8.6 ± 3.4 kg·ha−1·year−1 in 90 cm) in the beech stand; in the spruce stand, leaching from the forest floor (12.8 ± 3.4 kg·ha−1·year−1) was greater than the output flux from 90 cm (6.8 ± 2.1 kg·ha−1·year−1).
4. Discussion
4.1. Water Fluxes
Our results show that, in the spruce forest, less water percolates through the soil profile than in the beech forest. This supports the general assumption that the water regime in coniferous stands is drier when compared to deciduous stands [15]. In the spruce stand, interception was 33%, whereas in the beech stand, it was only 17%. Moreover, stemflow plays a significant role in water input into the soil surface in the beech stand. While in the spruce forest this part of throughfall flux was not significant [18], stemflow in the beech stand reached 19.5% of bulk precipitation. This phenomenon, besides enhanced soil moisture around the trunk, might significantly affect soil chemistry [36]. Despite the same soil physical conditions, different tree species differ in how they use their rooting system and therefore influence the percolation of soil water through the soil profile. The shallow-rooting spruce draws water mainly from the organic and upper mineral soil. By contrast, beech, which roots deeper, also takes up water from horizons 60 and 90 cm beneath the surface. The measured (only in 2017) higher transpiration of the beech forest as compared to that of the spruce forest further highlights the importance of additional water flux via stem flow in the beech stand to maintain optimal soil water content. High interception causes the soil under spruce to be drier than under beech [37]. In total, runoff water from the ecosystem was about 38% and 45% of the bulk deposition in the spruce and beech stand. This is in accordance with data measured in other studies. For the same site, Oulehle et al. [24] modelled a runoff/precipitation ratio 44% for spruce and 42% for beech. Berger et al. [38], for a comparable site in the Alps (700 m a.s.l., 7.7 °C, 1180 mm), calculated a ratio of 46% under spruce.
4.2. Deposition
The Načetín site is located in the area formerly known as the Black Triangle, which had been exposed to heavy atmospheric pollution. At the end of the 1980s, the average annual bulk deposition of S was 15.8 kg·ha−1·year−1 [26]. During the 1990s, rapid desulfurization resulted in a radical decrease of SO42− in the precipitation [39] and S deposition, which continued until 2017 (2.9 kg·ha−1·year−1). Although N deposition has also decreased since the 1990s, a decline has been observed mainly in the case of N-NO3. N-NH4 deposition has been reduced only slightly and it still remains 2–2.5 times greater than during the early 20th century [40]. We have observed a declining pattern of N-NO3 and stable N-NH4 in bulk precipitation.
Different properties of the tree canopy modify the concentrations of compounds dissolved in throughfall precipitation, as precipitation solute enrichment in spruce throughfall is usually more pronounced than in beech throughfall. Many studies have shown that conifers are capable of greater atmospheric pollutant scavenging than deciduous species, especially when comparing spruce and beech trees [21]. The main factor affecting higher deposition inputs under spruce is vegetation structure, namely the greater leaf area index, permanent foliage, or higher interception of precipitation [17]. Our results reveal that the concentrations of all measured compounds were higher in throughfall precipitation under spruce as compared to beech. An important role in the solute concentration of throughfall is also played by the internal cycle of elements within the ecosystem, where some elements are released from leaves, for example, K, Mg, and Ca [41]. The stand therefore significantly affects the composition of precipitation and it can partly buffer the acidity reaching the soil, thus affecting the intensity of acidification processes and setting the starting conditions from which soil recovery will take place. As mentioned above, the Načetín study site is located in an area that had experienced a high degree of acidic deposition. At the end of the 1980s, depositions of 150 kg S·ha−1·year−1 and 46 kg N·ha−1·year−1 were measured in spruce forests [26]. For beech stands, there are no available data from the 1980s; however, it can be assumed that the rate of acid deposition was lower. At the end of the observed period, the annual deposition of S was 7 kg·ha−1·year−1 in the spruce stand and 5 kg·ha−1·year−1 in the beech stand. As bulk S deposition decreased, the total S deposition in the two stands converged to the similar values [42]. By contrast, the annual average of N (DIN + DON) in the throughfall flux was about 19.2 kg·ha−1·year−1 and 19.3 kg·ha−1·year−1 under spruce and beech, respectively.
4.3. S, Cl, DOC, and pH
The main cause of anthropogenic acidification of soils is the input of strong inorganic acids that increase H+ concentrations in soil and ion exchange soil complexes and reduce the soil ANC by reacting with base cations [43]. Since anions other than phosphate, and to a lesser extent SO42−, do not interact much with the solid phase of soil, they get rapidly leached out of it. Therefore, anions are what mainly determines the chemical composition of the soil solution. SO42− is primarily supplied by atmospheric deposition. The large decrease in soil SO42−, as a response to declining S deposition, is a pattern that is consistent across most European forest plots [11]. From the calculated balances for both stands, it is clear that more S got leached out from the ecosystem than entered it. Since the net uptake of S by vegetation is low, the main cause of the higher output of S from the subsoil is the permanent remobilization of S accumulating during the period of high deposition in the past [44]. The soil under spruce, which had been exposed to larger S inputs, has a greater S output (26 kg·ha−1·year−1) as compared to the less affected beech stand (18 kg·ha−1·year−1). SO42− is the main acid anion in the mineral soil solutions in both ecosystems, so its decline coincided with increasing soil solution pH. In the mineral soil solution under beech, SO42− was not the sole driver of the pH increase because of higher NO3− concentrations. Nevertheless, decreasing trends in SO42− concentrations in the mineral soil under both stands were the primary cause of increases in pH, despite increasing trends in NO3− in some soil horizons under beech. Thus, the discharge of S from the soil ensures recovery from the unfavourable state.
Cl- in deposition were stable over the investigated period as well as Cl− in soil solution. Cl− is considered to be a relatively unreactive anion in regions with moderate and high Cl− deposition [45], thus the inputs should equal the outputs. These mid-mountain central European forests receive relatively low Cl− in deposition as compared to coastal regions. However, canopies with dry deposition component enhance throughfall Cl− flux. Moreover, substantial part of Cl in soil can originate from organic matter decomposition [46]. This internal Cl− cycle, together with additional concentration of throughfall Cl− via evaporation, could lead to higher Cl− concentrations leaving spruce forest floor.
Another important soil solution constituent is DOC, which is produced by the decomposition of organic matter. DOC represented the main anion charge in the forest floor solution and substantially decreased with depth. Increasing DOC concentrations coincided with decreasing pH over time in the forest floor at both sites. It seems that the rising production of DOC drives the acidity of the forest floor solution, in contrast to the mineral soil. The rising trend in DOC production was probably a result of a gradual recovery from acidification and the creation of more favourable conditions for microbial activity enhancing organic matter decomposition [28]. Less acidic mineral soil and lower ionic strength of soil solution caused the DOC increase in the deep mineral soil due to the higher solubility of organic acids [47,48].
4.4. N Budget
Mean total N (DIN+DON) fluxes during the study period entering the soil in throughfall were very similar in both stands (19.2 and 19.3 kg·ha−1·year−1 under spruce and beech, respectively). Because N is efficiently used in terrestrial ecosystems as a nutrient, under natural conditions main N output from ecosystem is represented by its organic form as DON [49]. However, if the availability of inorganic N exceeds the total combined plant and microbial nutritional demand, ecosystems progress towards N saturation and N leaching occurs, mainly in the form of NO3− [50]. The susceptibility of ecosystems towards NO3− leaching is usually defined in the literature based on the C/N ratio of the organic soil horizon [51], or it is postulated to occur when dissolved inorganic N concentrations (DIN) in seepage water are greater than 1 mg·L−1 [52]. The main leaching constituent is NO3−, because NH4+ is effectively immobilized in the soil by plants or microbes [53]. However, after N deposition starts to decrease, a change of NO3− concentrations in the soil solution can be soon detected [12]. Iost et al. [14] reported an exceedance of critical limits in DIN (N-NO3− + N-NH4+) concentrations across most forest monitoring plots in Europe. Also, under both stands were exceeded critical limits in mean annual DIN concentrations in forest floor (spruce: 1.25 mg·L−1 vs. beech: 1.13 mg·L−1). In the mineral soil under spruce, NO3− concentrations decreased during 1990s in the deep soil solution from 175 µeq·L−1 [39] and diminished further around 2006. Since then, only low NO3− concentrations in the top mineral soil have been measured. A higher NH4+ flux in the mineral soil is a sign that nitrification processes in the forest floor were retarded, therefore NH4+ leaching occurred [38]. At the beech plot, NO3− leaching was observed from upper horizons (6.4 kg·ha−1·year−1) and from the subsoil (2.2 kg·ha−1·year−1). This stands in contrast to studies reporting higher N leaching under spruce [38,42] as a result of higher deposition of N. However, a comparison of the C/N ratio of the two organic horizons [25] revealed a lower C/N ratio in the FH horizon under beech (beech stand: 19.9 vs. spruce stand: 23.3). According to Gundersen et al. [51], when the C/N ratio is less than or equal to 25, there is a high probability that leaching will occur. Under similar N inputs, a lower C/N ratio could be responsible for N leaching from upper mineral horizons in the beech stand. However, the deep-rooting beech is able to retain NO3−, so NO3− leakage from the subsoil occurs irregularly. NO3− leaching from the subsoil occurred mainly during the winter and spring seasons, when deciduous stands are in a dormant phase and unable to retain mineralized N. Accumulation of N during the winter, together with freeze-thaw cycles, can cause N leaching from the soil during the spring snowmelt period [54]. However, this seasonally enhanced N leaching rarely exceeded the critical limit of 1 mg·L−1. Higher NO3− leaching was detected between 2015 and 2016 (DIN of up to 3.5 mg·L−1) in the winter and spring seasons. During this period of higher N leaching, this could have been partially caused by clearcutting at the end of 2014 that took place in the vicinity of the sampling plots. This disturbance could have temporarily released N by altering the environmental conditions (the microclimate, which influences the rates of decomposition and mineralization of organic matter, causing a surplus of unused N). This fact, together with the spring flushing of the soil profile by water from melting snow, could have been responsible for elevated NO3− concentrations in the deep soil between 2015 and 2016. Furthermore, the exceptionally dry and hot year of 2015 possibly partly triggered the release of inorganic N from soil organic matter decomposition. In both stands, an increase in DON concentrations in the soil solution was observed. In forest floor solutions at both sites, DON fluxes were reported to be 6.9 kg·ha−1·year−1 on average. However, in seepage water from the depth of 90 cm in the spruce stand, DON was the major form of N (0.4 kg·ha−1·year−1). Verstraeten et al. [55] reported increasing DON concentrations, accompanied by a decrease in the DOC/DON ratio, as a sign that an advanced process of recovery from acidification is underway. However, no DON increase accompanied by a decrease in the DOC/DON ratio was detected in any of the examined horizons. More likely, the DON increase was related to a DOC increase as a result of lower ionic strength and the greater dissolution of organic acids [47].
4.5. Base Cations, Aluminium and BC/Alin
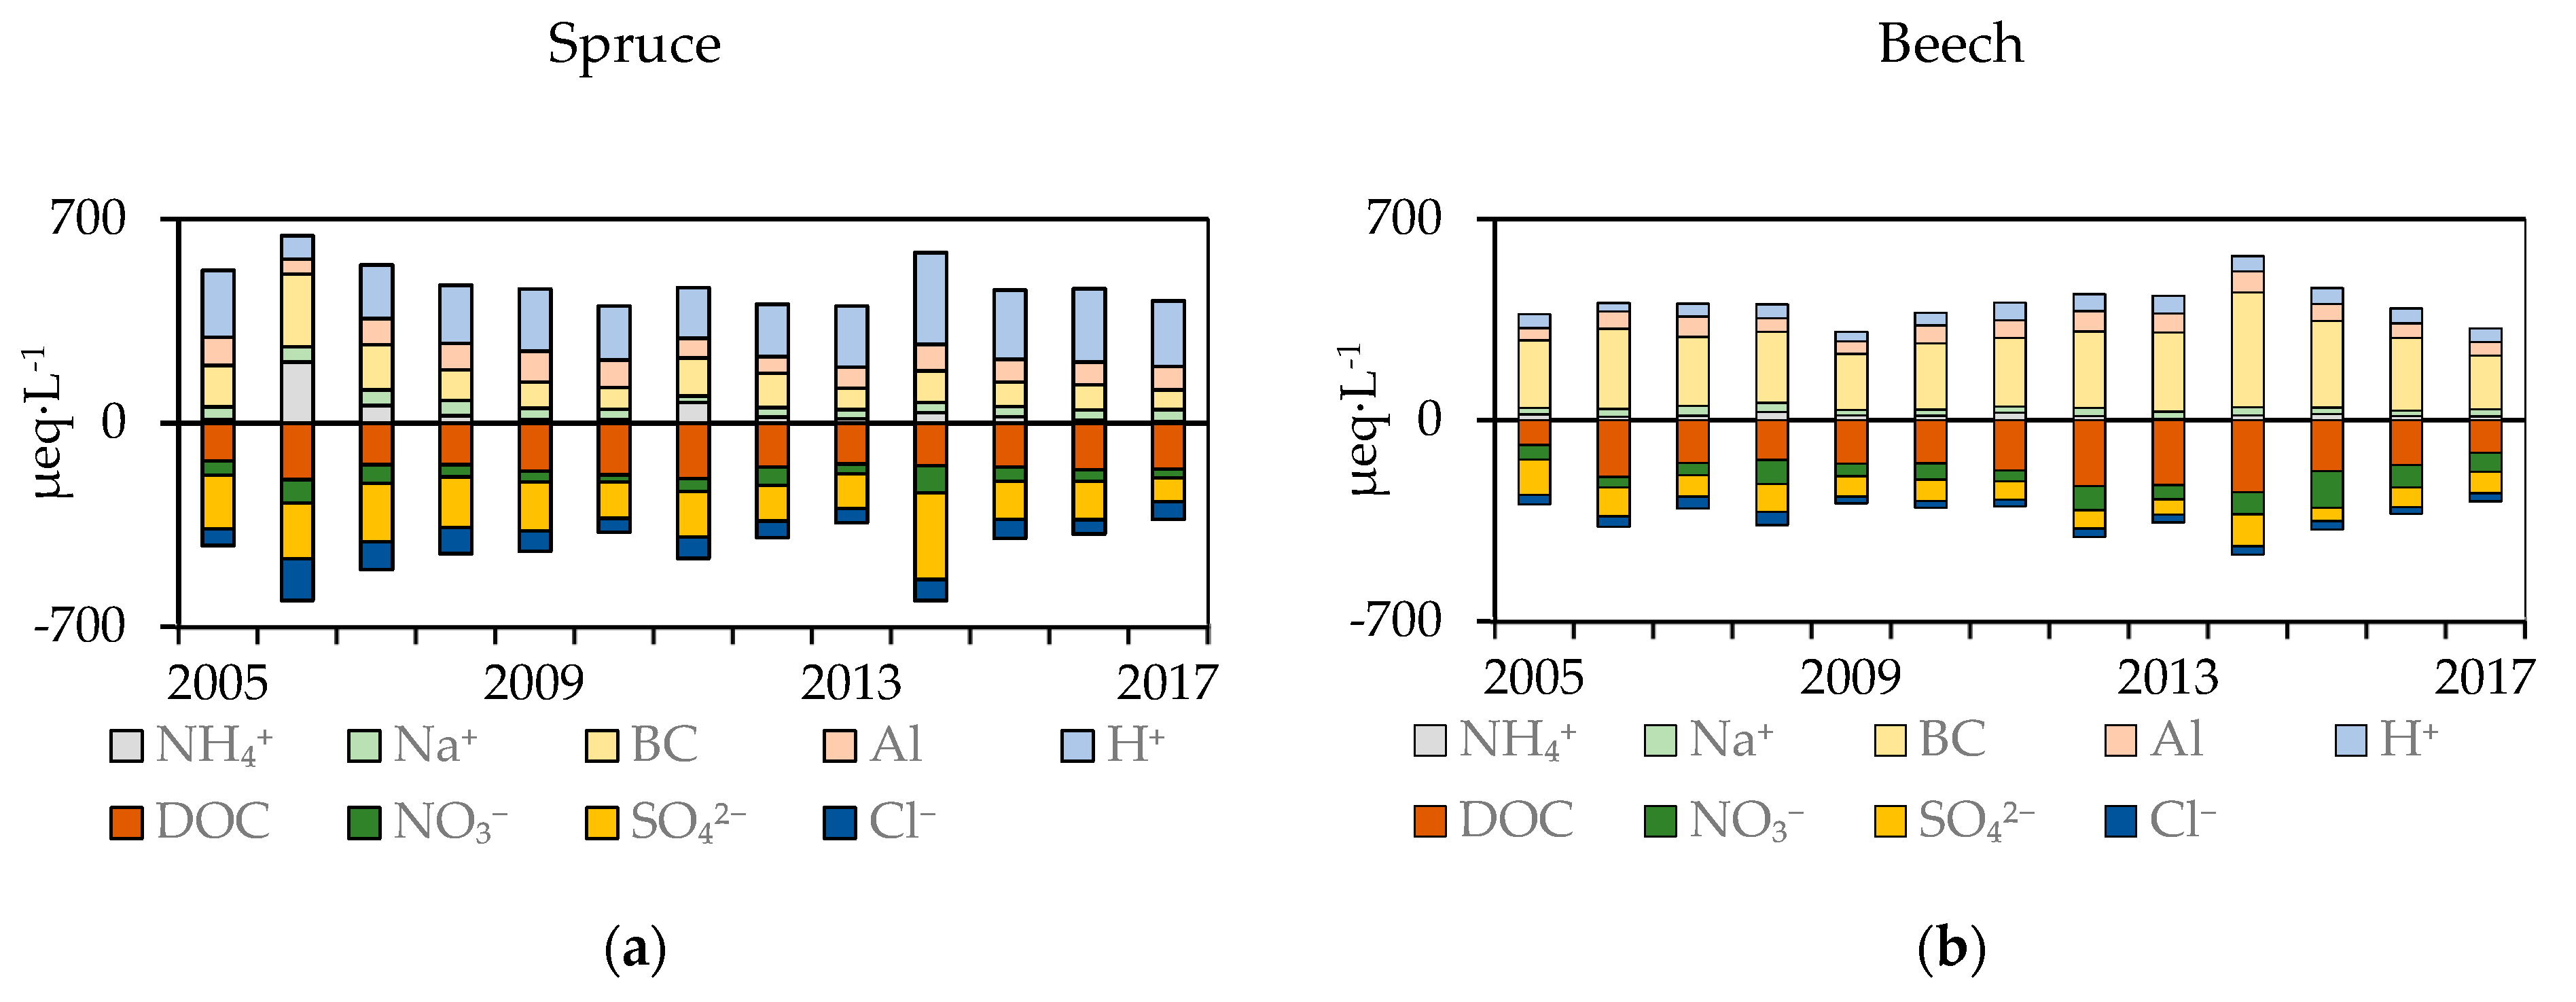
Base cations concentrations showed a different pattern for each stand. While in the spruce stand, the BC concentration decreased significantly in all horizons, trends in the beech forest were not coherent in comparison to spruce. Moreover, a large decrease in BC concentration was measured between the forest floor and mineral soil solutions in the beech plot. The described reduction in concentrations between the forest floor and the mineral soil is probably related to the different distribution of roots under both stands. The forest floor and the upper mineral topsoil receive large amount of nutrients from throughfall and from decomposing organic matter. Beech, which has deeper roots, receives nutrients from the upper mineral soil, whereas the shallower-rooting spruce acquires them mostly from the transition between the forest floor and the mineral soil. Acidification caused by atmospheric deposition mainly affects upper soil horizons, which contributes to base cations cation depletion (and an increase in Al dissolution). Due to the principle of electroneutrality, anion mobility should be compensated by an equivalent amount of cations. Therefore, the decline in anion concentrations should be followed by an equivalent cation charge. The decline in BC in the soil solution under spruce was connected with the decline of acid anions. This pattern can be seen in air pollution affected acidic soils with small BC pools and low weathering rates [56]. Long-term atmospheric pollution caused the depletion of base cations and then changes in throughfall Ca2+ and Mg2+ may influence soil solution cations. Connection between BC deposition and BC soil solution was also reported from other monitoring plots [5,11,22]. At the beech plot, a decline was detected between 2005 and 2013; since then, episodic increases of NO3− concentrations between 2014 and 2016 caused elevated BC concentrations. Whereas, a distinct reduction in K and Ca concentrations between the forest floor and the mineral soil under beech was observed, Mg concentrations were similar across the whole profile (≈100 µeq L−1).
Dissolution of mineral Al into the soil solution is a pivotal consequence of the soil acidification process. It is well known for its potential toxic effect on tree roots. Al in the soil solution is a composite of several forms of Al (Altot = Alorg + Alin + Alas), which differ in their toxicity. The most toxic form is monomeric Al (Alin). Based on our results, Altot concentrations in the soil solution are determined by soil acidity and the soil horizon. Despite the low pH in the forest floors of both stands, low Altot values were observed as a result of the absence of an Al source (limited mineral particles). Al inputs via throughfall and litterfall are too low to increase Altot in the forest floor. Altot concentrations in forest floor are therefore comparable at both stands. Due to the presence of DOC in the forest floor, Al is bound predominantly to DOC, forming non-toxic Alorg.
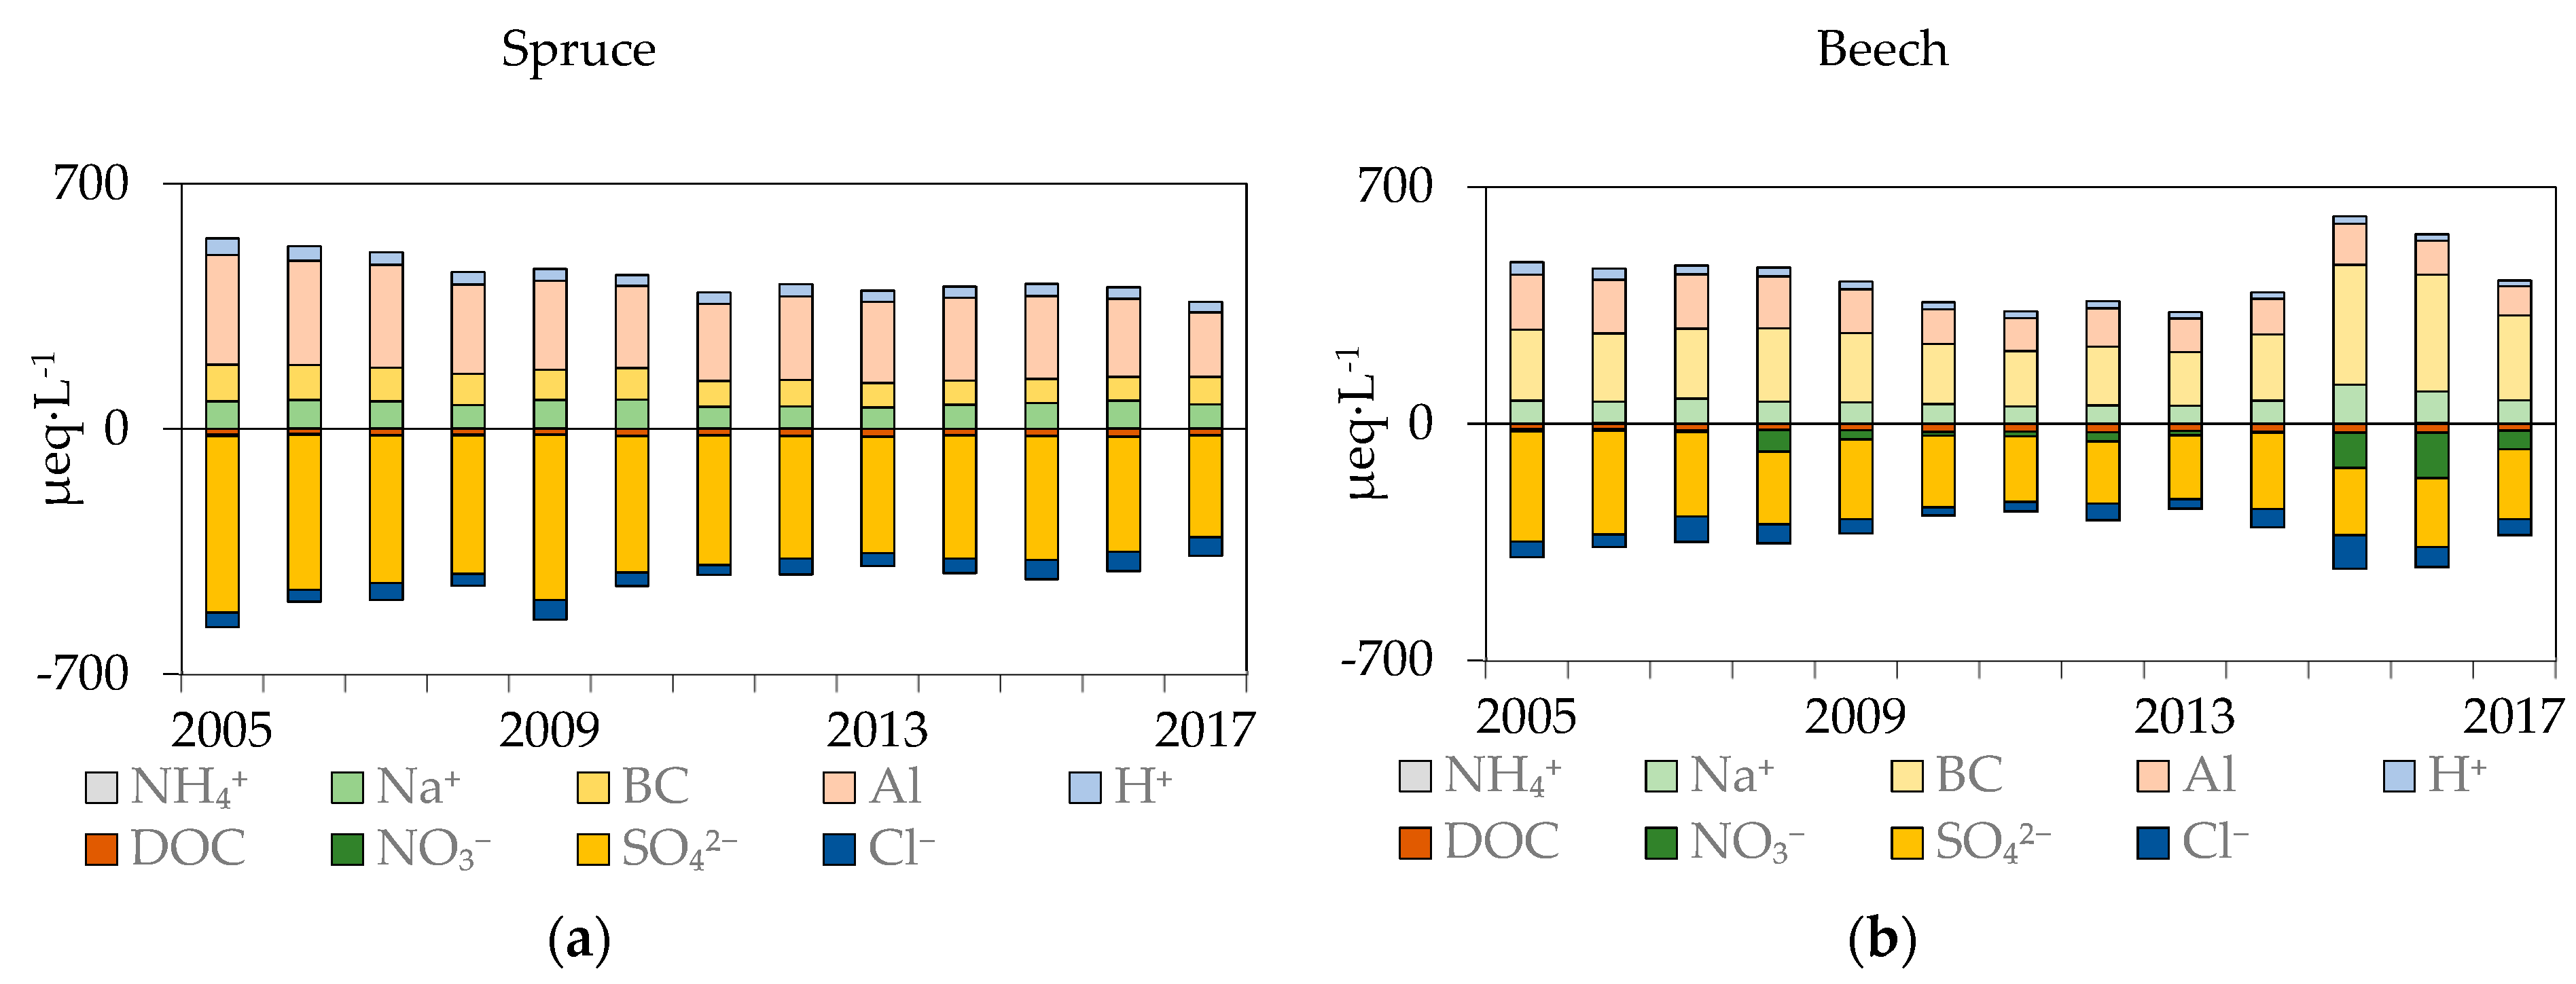
In mineral horizons, where enough Al can be supplied from mineral soil, Altot concentrations were driven by soil acidity. There was a noticeable decreasing temporal trend in Altot associated with reduced atmospheric acid deposition. Identical Altot concentrations across the soil profile in the spruce stand and increasing Altot concentrations with depth in the beech stand are related to the inverse pH pattern. As already mentioned, soil acidification progressed from the top downwards. Analogically, acidification recovery should take place in the same direction. Therefore, the conditions of the beech stand, with its low Altot together with high pH in the upper soil, can be considered to be more favourable as compared to the spruce stand. The main form of Al in the mineral soil was inorganic monomeric Al (Alin) constituting, on average, 85% and 60% of Altot under spruce and beech, respectively. The lower Alin/Altot ratios under beech are a result of high DOC concentrations in upper horizons, as Al binds to DOC.
One parameter often used to describe the chemistry of soil subjected to acidification is the BC/Al ratio [32]. Sverdrup and Warfvinge [32] suggested critical limits under which the roots of particular tree species are more likely to be exposed to toxic Al, adversely influencing the vitality of the trees. Cronan and Grigal [57] recommended the determination of the ratio to the sum of toxic Al (Alin = Al3+ + AlOH2+ + + ), because there might be a large share of other, non-toxic forms. In the beech stand, the Bc/Alin ratio was high above the critical limit of 0.6 in the mineral soil (1.5–1.9), whereas in the spruce stand, the soil solution from all horizons was below the critical limit of 1.2 (0.4–0.5), indicating potential serious root damage or stress. This low ratio should be reflected in the health-related conditions of the spruce stand. Although we did not carry out any measurements of stand vitality, we observed no signs of damage (defoliation, needle yellowing). The question of the practical relevance of the Bc/Al ratio has been asked by Hansen et al. [58] and European-scale comparison has been performed by Iost et al. [14]. Iost et al. [14] rarely observed exceedance of critical limit. However, they used the Altot fraction, whereas we considered only the toxic form Alin. Hruška et al. [59] found a relationship between the health status of spruce and the Bc/Al ratio only when examining the forest floor soil solution. They did not find any relationship with the Bc/Al ratio in the mineral soil solution. Spruce can perhaps avoid the toxic area by redistributing its roots closer to the forest floor, where the BC/Alin ratio was about 37. However, this shallow rooting very often leads to exposure to other threats, such as drought.
5. Conclusions
Atmospheric SO42− deposition has decreased in both stands and a decline in NO3− deposition was detected only in the spruce stand. These changes are reflected in the soil chemistry as a decrease in SO42− in both stands and a decline in NO3− concentrations under spruce. The episode of NO3− leaching from the beech stand is a consequence of the ecosystem‘s greater susceptibility to perturbations. Increasing pH and decreasing Al concentrations are a sign of ongoing successful recovery from acidification. However, low Bc/Alin ratios under spruce in the upper mineral soil still indicate unfavourable conditions in the rooting zone.
Author Contributions
Conceptualization, M.R. and F.O.; methodology, F.O.; validation, M.R. and F.O.; formal analysis, F.O. and O.M.; investigation, F.O., O.M., J.K.; resources, F.O.; data curation, M.R.; writing—original draft preparation, M.R.; writing—review and editing, M.R. and F.O.; visualization, M.R.; supervision, F.O.; project administration, F.O.; funding acquisition, F.O.
Funding
The authors acknowledge the Czech Science Foundation Grant no.16-11571S. This work was supported by the Ministry of Education, Youth and Sports of CR within the National Sustainability Program I (NPU I), grant number LO1415.
Acknowledgments
We would like to thank Fred Rooks for proof reading.
Conflicts of Interest
The authors declare no conflict of interest.
References
- Fowler, D.; Smith, R.; Muller, J.; Cape, J.N.; Sutton, M.; Erisman, J.W.; Fagerli, H. Long term trends in sulphur and nitrogen deposition in Europe and the cause of non-linearities. Water Air Soil Pollut. Focus 2007, 7, 41–47. [Google Scholar] [CrossRef]
- Waldner, P.; Marchetto, A.; Thimonier, A.; Schmitt, M.; Rogora, M.; Granke, O.; Mues, V.; Hansen, K.; Pihl Karlsson, G.; Žlindra, D.; et al. Detection of temporal trends in atmospheric deposition of inorganic nitrogen and sulphate to forests in Europe. Atmos. Environ. 2014, 95, 363–374. [Google Scholar] [CrossRef] [Green Version]
- de Wit, H.A.; Eldhuset, T.D.; Mulder, J. Dissolved Al reduces Mg uptake in Norway spruce forest: Results from a long-term field manipulation experiment in Norway. For. Ecol. Manag. 2010, 259, 2072–2082. [Google Scholar] [CrossRef]
- Dise, N.B.; Wright, R.F. Forest Ecology and Management Nitrogen leaching from European forests in relation to nitrogen deposition. For. Ecol. Manag. 1995, 71, 153–169. [Google Scholar] [CrossRef]
- Alewell, C.; Manderscheid, B.; Gerstberger, P.; Matzner, E. Effects of reduced atmospheric deposition on soil solution chemistry and elemental contents of spruce needles in NE—Bavaria, Germany. J. Plant Nutr. Soil Sci. 2000, 163, 509–516. [Google Scholar] [CrossRef]
- Monteith, D.T.; Stoddard, J.L.; Evans, C.D.; de Wit, H.A.; Forsius, M.; Høgåsen, T.; Wilander, A.; Skjelkvåle, B.L.; Jeffries, D.S.; Vuorenmaa, J.; et al. Dissolved organic carbon trends resulting from changes in atmospheric deposition chemistry. Nature 2007, 450, 537–540. [Google Scholar] [CrossRef]
- Oulehle, F.; Chuman, T.; Hruška, J.; Krám, P.; McDowell, W.H.; Myška, O.; Navrátil, T.; Tesař, M. Recovery from acidification alters concentrations and fluxes of solutes from Czech catchments. Biogeochemistry 2017, 132, 251–272. [Google Scholar] [CrossRef]
- Evans, C.D.; Jones, T.G.; Burden, A.; Ostle, N.; Zieliński, P.; Cooper, M.D.A.; Peacock, M.; Clark, J.M.; Oulehle, F.; Cooper, D.; et al. Acidity controls on dissolved organic carbon mobility in organic soils. Glob. Change Biol. 2012. [Google Scholar] [CrossRef]
- Oulehle, F.; Chuman, T.; Majer, V.; Hruška, J. Chemical recovery of acidified Bohemian lakes between 1984 and 2012: the role of acid deposition and bark beetle induced forest disturbance. Biogeochemistry 2013, 116, 83–101. [Google Scholar] [CrossRef]
- Martinson, L.; Lamersdorf, N.; Warfvinge, P. The Solling roof revisited—slow recovery from acidification observed and modeled despite a decade of “clean-rain” treatment. Environ. Pollut. 2005, 135, 293–302. [Google Scholar] [CrossRef]
- Johnson, J.; Pannatier, E.G.; Carnicelli, S.; Cecchini, G.; Clarke, N.; Cools, N.; Hansen, K.; Meesenburg, H.; Nieminen, T.M.; Pihl-Karlsson, G.; et al. The response of soil solution chemistry in European forests to decreasing acid deposition. Glob. Change Biol. 2018, 24, 3603–3619. [Google Scholar] [CrossRef] [PubMed]
- Schmitz, A.; Sanders, T.G.M.; Bolte, A.; Bussotti, F.; Dirnböck, T.; Johnson, J.; Peñuelas, J.; Pollastrini, M.; Prescher, A.-K.; Sardans, J.; et al. Responses of forest ecosystems in Europe to decreasing nitrogen deposition. Environ. Pollut. 2019, 244, 980–994. [Google Scholar] [CrossRef]
- Verstraeten, A.; Neirynck, J.; Genouw, G.; Cools, N.; Roskams, P.; Hens, M. Impact of declining atmospheric deposition on forest soil solution chemistry in Flanders, Belgium. Atmos. Environ. 2012, 62, 50–63. [Google Scholar] [CrossRef]
- Iost, S.; Rautio, P.; Lindroos, A.-J. Spatio-temporal Trends in Soil Solution Bc/Al and N in Relation to Critical Limits in European Forest Soils. Water. Air. Soil Pollut. 2012, 223, 1467–1479. [Google Scholar] [CrossRef]
- Augusto, L.; De Schrijver, A.; Vesterdal, L.; Smolander, A.; Prescott, C.; Ranger, J. Influences of evergreen gymnosperm and deciduous angiosperm tree species on the functioning of temperate and boreal forests. Biol. Rev. 2015, 90, 444–466. [Google Scholar] [CrossRef] [PubMed]
- Augusto, L.; Ranger, J.; Ponette, Q.; Rapp, M. Relationships between forest tree species, stand production and stand nutrient amount. Ann. For. Sci. 2000, 57, 313–324. [Google Scholar] [CrossRef] [Green Version]
- De Schrijver, A.; Geudens, G.; Augusto, L.; Staelens, J.; Mertens, J.; Wuyts, K.; Gielis, L.; Verheyen, K. The effect of forest type on throughfall deposition and seepage flux: A review. Oecologia 2007, 153, 663–674. [Google Scholar] [CrossRef]
- Augusto, L.; Ranger, J.; Binkley, D.; Rothe, A. Impact of several common tree species of European temperate forests on soil fertility. Ann. For. Sci. 2002, 59, 233–253. [Google Scholar] [CrossRef] [Green Version]
- Oulehle, F.; Hruška, J. Tree species (Picea abies and Fagus sylvatica) effects on soil water acidification and aluminium chemistry at sites subjected to long-term acidification in the Ore Mts., Czech Republic. J. Inorg. Biochem. 2005, 99, 1822–1829. [Google Scholar] [CrossRef]
- Rothe, A.; Kreutzer, K. Influence of tree species composition on soil and soil solution properties in two mixed spruce-beech stands with contrasting history in Southern Germany. Plant Soil 2002, 240, 47–56. [Google Scholar] [CrossRef]
- Berger, T.W.; Untersteiner, H.; Toplitzer, M.; Neubauer, C. Nutrient fluxes in pure and mixed stands of spruce (Picea abies) and beech (Fagus sylvatica). Plant Soil 2009, 322, 317–342. [Google Scholar] [CrossRef]
- Vanguelova, E.I.; Benham, S.; Pitman, R.; Moffat, A.J.; Broadmeadow, M.; Nisbet, T.; Durrant, D.; Barsoum, N.; Wilkinson, M.; Bochereau, F.; et al. Chemical fluxes in time through forest ecosystems in the UK - Soil response to pollution recovery. Environ. Pollut. 2010, 158, 1857–1869. [Google Scholar] [CrossRef] [PubMed]
- Meesenburg, H.; Ahrends, B.; Fleck, S.; Wagner, M.; Fortmann, H.; Scheler, B.; Klinck, U.; Dammann, I.; Eichhorn, J.; Mindrup, M.; et al. Long-term changes of ecosystem services at Solling, Germany: Recovery from acidification, but increasing nitrogen saturation? Ecol. Indic. 2016, 65, 103–112. [Google Scholar] [CrossRef]
- Oulehle, F.; Hofmeister, J.; Hruška, J. Modeling of the long-term effect of tree species (Norway spruce and European beech) on soil acidification in the Ore Mountains. Ecol. Model. 2007, 204, 359–371. [Google Scholar] [CrossRef]
- Oulehle, F.; Růžek, M.; Tahovská, K.; Bárta, J.; Myška, O. Carbon and Nitrogen Pools and Fluxes in Adjacent Mature Norway Spruce and European Beech Forests. Forests 2016, 7, 282. [Google Scholar] [CrossRef]
- Dambrine, E.; Kinkor, V.; Jehlička, J.; Gelhaye, D. Fluxes of dissolved mineral elements through a forest ecosystem submitted to extremely high atmopsheric pollution inputs (Czech Republic). Ann. Sci. For. 1993, 50, 147–157. [Google Scholar] [CrossRef]
- Dambrine, E.; Probst, A.; Viville, D.; Biron, P.; Belgrand, M.C.; Paces, T.; Novak, M.; Buzek, F.; Cerny, J.; Groscheova, H. Spatial Variability and Long-Term Trends in Mass Balance of N and S in Central European Forested Catchments. In Carbon and Nitrogen Cycling in European Forest Ecosystems; Schulze, E.-D., Ed.; Ecological Studies; Springer: Berlin/Heidelberg, Germany, 2000; pp. 405–418. ISBN 978-3-642-57219-7. [Google Scholar]
- Oulehle, F.; Evans, C.D.; Hofmeister, J.; Krejčí, R.; Tahovská, K.; Persson, T.; Cudlín, P.; Hruška, J. Major changes in forest carbon and nitrogen cycling caused by declining sulphur deposition. Glob. Change Biol. 2011, 17, 3115–3129. [Google Scholar] [CrossRef]
- Røgeberg, E.J.S.; Henriksen, A. Automatic method for fractionation and determination of aluminium species in fresh waters. Vaten 1985, 41, 48–53. [Google Scholar]
- LaZerte, B.D.; Chun, C.; Evans, D.; Tomassinl, F. Measurement of Aqueous Aluminum Species: Comparison of Dialysis and Ion-Exchange Techniques. Environ. Sci. Technol. 1988, 22, 1106–1108. [Google Scholar] [CrossRef]
- Driscoll, C.T.; Schecher, W.D. Aluminium in the environment. In Metal Ions in Biological Systems; Sigel, H., Sigel, A., Eds.; Marcel Dekker: New York, NY, USA, 1988; pp. 59–122. [Google Scholar]
- Sverdrup, H.; Warfvinge, P. The Effect of Soil Acidification on the Growth of Trees, Grass and Herbs as Expressed by the (Ca+Mg+K)/Al Ratio; Reports in Ecology and Environmental Engineering, Report 2: 1993, KF-Sigma; Department of Chemistry Engineering, Lund University: Lund, Sweden, 1993. [Google Scholar]
- Kučera, J.; Brito, P.; Jiménez, M.S.; Urban, J. Direct Penman–Monteith parameterization for estimating stomatal conductance and modeling sap flow. Trees - Struct. Funct. 2017, 31, 873–885. [Google Scholar] [CrossRef]
- Hirsch, R.M.; Slack, J.R.; Smith, R.A. Techniques of trend analysis for monthly water quality data. Water Resour. Res. 1982, 18, 107–121. [Google Scholar] [CrossRef]
- Sen, K.P. Estimates of the Regression Coefficient Based on Kendall’ s Tau Pranab Kumar Sen. J. Am. Stat. Assoc. 1968, 63, 1379–1389. [Google Scholar] [CrossRef]
- Falkengren-Grerup, U. Effect of Stemflow on Beech Forest Soils and Vegetation in Southern Sweden. J. Appl. Ecol. 1989, 26, 341. [Google Scholar] [CrossRef]
- Vesterdal, L.; Elberling, B.; Christiansen, J.R.; Callesen, I.; Schmidt, I.K. Soil respiration and rates of soil carbon turnover differ among six common European tree species. For. Ecol. Manag. 2012, 264, 185–196. [Google Scholar] [CrossRef]
- Berger, T.W.; Inselsbacher, E.; Mutsch, F.; Pfeffer, M. Nutrient cycling and soil leaching in eighteen pure and mixed stands of beech (Fagus sylvatica) and spruce (Picea abies). For. Ecol. Manag. 2009, 258, 2578–2592. [Google Scholar] [CrossRef]
- Oulehle, F.; Hofmeister, J.; Cudlín, P.; Hruška, J. The effect of reduced atmospheric deposition on soil and soil solution chemistry at a site subjected to long-term acidification, Nacetín, Czech Republic. Sci. Total Environ. 2006, 370, 532–544. [Google Scholar] [CrossRef]
- Engardt, M.; Simpson, D.; Schwikowski, M.; Granat, L. Deposition of sulphur and nitrogen in Europe 1900–2050. Model calculations and comparison to historical observations. Tellus B Chem. Phys. Meteorol. 2017, 69, 1328945. [Google Scholar] [CrossRef] [Green Version]
- Balestrini, R.; Tagliaferri, A. Atmospheric deposition and canopy exchange processes in alpine forest ecosystems (northern Italy). Atmos. Environ. 2001, 35, 6421–6433. [Google Scholar] [CrossRef]
- Rothe, A.; Huber, C.; Kreutzer, K.; Weis, W. Deposition and soil leaching in stands of Norway spruce and European beech: Results from the Höglwald research in comparison with other European case studies. Plant Soil 2002, 240, 33–45. [Google Scholar] [CrossRef]
- Van Breemen, N. Soil Acidification and Alkalinization. In Soil Acidity; Springer: Berlin/Heidelberg, Germany, 1991; pp. 1–7. ISBN 978-3-642-74444-0. [Google Scholar]
- Prechtel, A.; Alewell, C.; Armbruster, M.; Bittersohl, J.; Cullen, J.M.; Evans, C.D.; Helliwell, R.; Kopáček, J.; Marchetto, A.; Matzner, E.; et al. Response of sulphur dynamics in European catchments to decreasing sulphate deposition. Hydrol. Earth Syst. Sci. 2001, 5, 311–326. [Google Scholar] [CrossRef] [Green Version]
- Svensson, T.; Lovett, G.M.; Likens, G.E. Is chloride a conservative ion in forest ecosystems? Biogeochemistry 2012, 107, 125–134. [Google Scholar] [CrossRef]
- Redon, P.-O.; Abdelouas, A.; Bastviken, D.; Cecchini, S.; Nicolas, M.; Thiry, Y. Chloride and Organic Chlorine in Forest Soils: Storage, Residence Times, And Influence of Ecological Conditions. Environ. Sci. Technol. 2011, 45, 7202–7208. [Google Scholar] [CrossRef] [PubMed]
- Oulehle, F.; Jones, T.G.; Burden, A.; Cooper, M.D.A.; Lebron, I.; Zieliński, P.; Evans, C.D. Soil-solution partitioning of DOC in acid organic soils: Results from a UK field acidification and alkalization experiment. Eur. J. Soil Sci. 2013, 64, 787–796. [Google Scholar] [CrossRef]
- Hruška, J.; Krám, P.; McDowell, W.H.; Oulehle, F. Increased Dissolved Organic Carbon (DOC) in Central European Streams is Driven by Reductions in Ionic Strength Rather than Climate Change or Decreasing Acidity. Environ. Sci. Technol. 2009, 43, 4320–4326. [Google Scholar] [CrossRef]
- Perakis, S.S.; Hedin, L.O. Nitrogen loss from unpolluted South American forests mainly via dissolved organic compounds. Nature 2002, 415, 416–419. [Google Scholar] [CrossRef] [PubMed]
- Aber, J.D.; Nadelhoffer, K.J.; Steudler, P.; Melillo, J.M. Nitrogen Saturation in Northern Forest Ecosystems. BioScience 1989, 39, 378–386. [Google Scholar] [CrossRef]
- Gundersen, P.; Emmett, B.A.; Kjønaas, O.J.; Koopmans, C.J.; Tietema, A. Impact of nitrogen deposition on nitrogen cycling in forests: A synthesis of NITREX data. For. Ecol. Manag. 1998, 101, 37–55. [Google Scholar] [CrossRef]
- Gundersen, P.; Schmidt, I.K.; Raulund-Rasmussen, K. Leaching of nitrate from temperate forests - effects of air pollution and forest management. Environ. Rev. 2006, 14, 1–57. [Google Scholar] [CrossRef]
- Corre, M.D.; Brumme, R.R.; Veldkamp, E.; Beese, F.O. Changes in nitrogen cycling and retention processes in soils under spruce forests along a nitrogen enrichment gradient in Germany. Glob. Change Biol. 2007, 13, 1509–1527. [Google Scholar] [CrossRef]
- Joseph, G.; Henry, H.A.L. Soil nitrogen leaching losses in response to freeze–thaw cycles and pulsed warming in a temperate old field. Soil Biol. Biochem. 2008, 40, 1947–1953. [Google Scholar] [CrossRef]
- Verstraeten, A.; Verschelde, P.; De Vos, B.; Neirynck, J.; Cools, N.; Roskams, P.; Hens, M.; Louette, G.; Sleutel, S.; De Neve, S. Increasing trends of dissolved organic nitrogen (DON) in temperate forests under recovery from acidification in Flanders, Belgium. Sci. Total Environ. 2016, 553, 107–119. [Google Scholar] [CrossRef]
- Watmough, S.A.; Aherne, J.; Alewell, C.; Arp, P.; Bailey, S.; Clair, T.; Dillon, P.; Duchesne, L.; Eimers, C.; Fernandez, I.; et al. Sulphate, Nitrogen and Base Cation Budgets at 21 Forested Catchments in Canada, the United States and Europe. Environ. Monit. Assess. 2005, 109, 1–36. [Google Scholar] [CrossRef] [PubMed]
- Cronan, C.S.; Grigal, D.F. Use of Calcium/Aluminum Ratios as Indicators of Stress in Forest Ecosystems. J. Environ. Qual. 1995, 24, 209. [Google Scholar] [CrossRef]
- Hansen, K.; Vesterdal, L.; Bastrup-Birk, A.; Bille-Hansen, J. Are Indicators for Critical Load Exceedance Related to Forest Condition? Water. Air. Soil Pollut. 2007, 183, 293–308. [Google Scholar] [CrossRef]
- Hruška, J.; Laudon, H.; Johnson, C.E.; Köhler, S.; Bishop, K. Acid/base character of organic acids in a boreal stream during snowmelt. Water Resour. Res. 2001, 37, 1043–1056. [Google Scholar] [CrossRef] [Green Version]
Figure 1.
pH (a) and mean annual concentrations of potential acidity ACpot (sum of SO42−, NO3−, NH4+, and non-salt Cl−) (b) in bulk, throughfall (THF) spruce, and THF beech precipitation.
Figure 1.
pH (a) and mean annual concentrations of potential acidity ACpot (sum of SO42−, NO3−, NH4+, and non-salt Cl−) (b) in bulk, throughfall (THF) spruce, and THF beech precipitation.

Figure 2.
Mean annual pH, SO42−, NO3−, and total Al (Altot) concentrations from forest floor (left – a, c, e, g) and 90 cm (right – b, d, f, h) horizons of beech and spruce soil solutions.
Figure 2.
Mean annual pH, SO42−, NO3−, and total Al (Altot) concentrations from forest floor (left – a, c, e, g) and 90 cm (right – b, d, f, h) horizons of beech and spruce soil solutions.

Figure 3.
Mean concentrations of Al fractions in the soil solution from the forest floor and from the mineral soil in the soil water in different depths (upper column—beech, lower column—spruce).
Figure 3.
Mean concentrations of Al fractions in the soil solution from the forest floor and from the mineral soil in the soil water in different depths (upper column—beech, lower column—spruce).

Figure 4.
Soil solution concentrations from the forest floor in the spruce (a) and the beech (b) stand. DOC, NO3−, SO42−, and Cl− concentrations were reversed to show how reductions in acid anions were compensated by reductions of base cations, Al and H+.
Figure 4.
Soil solution concentrations from the forest floor in the spruce (a) and the beech (b) stand. DOC, NO3−, SO42−, and Cl− concentrations were reversed to show how reductions in acid anions were compensated by reductions of base cations, Al and H+.

Figure 5.
Soil solution concentrations from the depth of 90 cm in the spruce (a) and the beech (b) stand. DOC, NO3−, SO42−, and Cl− concentrations were reversed to show how reductions in acid anions were compensated by reductions of base cations, Al and H+.
Figure 5.
Soil solution concentrations from the depth of 90 cm in the spruce (a) and the beech (b) stand. DOC, NO3−, SO42−, and Cl− concentrations were reversed to show how reductions in acid anions were compensated by reductions of base cations, Al and H+.

Figure 6.
Mean annual BC (K++Mg2++Ca2+) concentrations in forest floor (a,b) and 90 cm (c,d) soil solution in spruce (left) and beech (right) stand.
Figure 6.
Mean annual BC (K++Mg2++Ca2+) concentrations in forest floor (a,b) and 90 cm (c,d) soil solution in spruce (left) and beech (right) stand.

Figure 7.
Annual molar Bc/Alin ratios in the soil solution below the forest floor and at 30 cm, 60 cm and 90 cm of the mineral soil in the spruce (a) and the beech (b) stand. Critical limits are presented according to Sverdrup and Warfvinge [32].
Figure 7.
Annual molar Bc/Alin ratios in the soil solution below the forest floor and at 30 cm, 60 cm and 90 cm of the mineral soil in the spruce (a) and the beech (b) stand. Critical limits are presented according to Sverdrup and Warfvinge [32].

Figure 8.
Mean annual molar DOC concentrations from forest floor (a) and the 90 cm (b) horizons of beech and spruce soil solutions.
Figure 8.
Mean annual molar DOC concentrations from forest floor (a) and the 90 cm (b) horizons of beech and spruce soil solutions.

Figure 9.
Input–output element budgets for the spruce and the beech stand. Inputs are represented by THF (+STEM) deposition, and outputs are calculated as fluxes passing the 90 cm horizon. Outputs were reversed to show element balances.
Figure 9.
Input–output element budgets for the spruce and the beech stand. Inputs are represented by THF (+STEM) deposition, and outputs are calculated as fluxes passing the 90 cm horizon. Outputs were reversed to show element balances.


Table 1.
Seasonal Mann-Kendall trends for bulk, throughfall and soil solution concentrations, pH and the BC/Alin ratio with mean values in µeq·L−1 (SO42−, NO3−, Cl−, NH4+, BC) or µmol·L−1 (dissolved organic carbon (DOC), Altot) and Sen’s slope with significance (*: p 0.05, **: p 0.01, ***: p 0.001).
| Plot | SO42− | NO3− | Cl | DOC | NH4+ | BC | pH | Altot | BC/Alin | |||||||||
|---|---|---|---|---|---|---|---|---|---|---|---|---|---|---|---|---|---|---|
| Mean | Slope | Mean | Slope | Mean | Slope | Mean | Slope | Mean | Slope | Mean | Slope | Mean | Slope | Mean | Slope | Mean | Slope | |
| BULK | 28 | −1.1 * | 29 | 11 | 165 | 45 | 31 | 5.06 | +0.07 *** | |||||||||
| THF | ||||||||||||||||||
| Spruce | 147 | 97 | −3.0 ** | 48 | 1067 | 95 | 190 | 4.79 | +0.04 * | |||||||||
| Beech | 79 | 78 | 29 | 435 | 280 | 148 | 5.59 | +0.04 * | ||||||||||
| Forest floor | ||||||||||||||||||
| Spruce | 160 | −6.6 * | 50 | 69 | 3355 | +63 * | 32 | 115 | −7.6 * | 3.73 | −0.01 * | 33 | 42.0 | |||||
| Beech | 78 | 65 | 30 | 2519 | 17 | 259 | 4.38 | 24 | 101.6 | +4.69 * | ||||||||
| Mineral soil | ||||||||||||||||||
| 30 cm | ||||||||||||||||||
| Spruce | 400 | −11.9 ** | 2 | −0.1 ** | 27 | 445 | 1 | 68 | −6.2 *** | 4.43 | +0.01 ** | 109 | −3.4 *** | 0.4 | −0.03 *** | |||
| Beech | 89 | 28 | 37 | 875 | −30 *** | 2 | 152 | −5.5 * | 4.53 | 36 | 5.0 | −0.26 * | ||||||
| 60 cm | ||||||||||||||||||
| Spruce | 424 | −12.5 *** | 2 | 38 | 610 | 1 | 84 | −3.5 *** | 4.32 | +0.01 ** | 110 | −1.9 *** | 0.5 | −0.02 ** | ||||
| Beech | 166 | −8.2 *** | 52 | 37 | 392 | −6 * | 3 | 199 | 4.62 | +0.02 *** | 41 | −1.4 ** | 3.0 | |||||
| 90 cm | ||||||||||||||||||
| Spruce | 386 | −13.9 *** | 2 | −0.1 *** | 44 | 245 | +4 * | 1 | 82 | −3.4 *** | 4.46 | +0.01 ** | 103 | −3.2 *** | 0.5 | |||
| Beech | 228 | −7.6 *** | 36 | 50 | 272 | +9 *** | 1 | 220 | 4.64 | +0.02 *** | 51 | −2.5 ** | 2.6 | +0.09 * |
Table 2.
Mean annual water percolating through particular layers of forest stands and actual transpiration. THF—throughfall, STEM—stemflow.
Table 2.
Mean annual water percolating through particular layers of forest stands and actual transpiration. THF—throughfall, STEM—stemflow.
| Horizon (mm) | Spruce | Beech |
|---|---|---|
| Bulk | 1122 ± 117 | 1122 ± 117 |
| THF (STEM) | 756 ± 109 | 721 ± 79 (220 ± 21) |
| Organic horizon | 632 ± 110 | 834 ± 91 |
| 30 cm | 520 ± 113 | 742 ± 93 |
| 60 cm | 462 ± 120 | 591 ± 101 |
| 90 cm | 430 ± 130 | 511 ± 101 |
| Actual transpiration (modelled average 2005–2017) | 207 ± 33 | 345 ± 27 |
| Actual transpiration (measured in 2017) | 165 | 337 |
Table 3.
Selected mean annual element fluxes in spruce and beech stands. Base cation (BC) is the sum of K + Ca + Mg.
Table 3.
Selected mean annual element fluxes in spruce and beech stands. Base cation (BC) is the sum of K + Ca + Mg.
| Spruce | Na | K | Ca | Mg | Al | S-SO4 | N-NH4 | N-NO3 | DON | DOC | BC | Cl |
| kg·ha−1·year−1 | ||||||||||||
| Bulk | 2.5 | 1.4 | 2.2 | 0.6 | 0.1 | 4.3 | 5.9 | 3.8 | – | 19.0 | 4.2 | 4.1 |
| THF | 4.9 | 19.8 | 8.2 | 2.3 | 0.3 | 12.5 | 8.0 | 8.0 | 3.2 | 85.0 | 30.3 | 10.2 |
| Forest Floor | ||||||||||||
| 5.6 | 12.5 | 3.6 | 2.3 | 5.7 | 14.5 | 3.4 | 0.3 | 6.9 | 253.2 | 18.4 | 12.8 | |
| Mineral Soil | ||||||||||||
| 30 cm | 10.8 | 1.2 | 1.5 | 2.9 | 15.1 | 32.2 | 0.1 | 0.0 | 1.0 | 29.1 | 5.6 | 4.7 |
| 60 cm | 10.3 | 0.8 | 2.1 | 3.1 | 13.4 | 29.6 | 0.1 | 0.0 | 1.0 | 33.5 | 6.0 | 6.0 |
| 90 cm | 7.2 | 1.5 | 2.6 | 2.2 | 12.0 | 25.9 | 0.1 | 0.0 | 0.4 | 12.7 | 6.3 | 6.8 |
| Beech | Na | K | Ca | Mg | Al | S-SO4 | N-NH4 | N-NO3 | DON | DOC | BC | Cl |
| kg·ha−1·year−1 | ||||||||||||
| Bulk | 2.5 | 1.4 | 2.2 | 0.6 | 0.1 | 4.3 | 5.9 | 3.8 | 19.0 | 4.2 | 4.1 | |
| THF | 3.1 | 14.5 | 5.7 | 2.1 | 0.2 | 7.0 | 7.8 | 6.3 | 2.3 | 34.6 | 22.3 | 5.7 |
| STEM | 0.8 | 3.2 | 1.1 | 0.3 | 0.1 | 1.7 | 1.3 | 0.9 | 0.7 | 11.1 | 4.6 | 1.4 |
| Forest floor | ||||||||||||
| 4.3 | 10.9 | 14.8 | 8.6 | 5.1 | 8.6 | 1.8 | 6.4 | 6.9 | 234.8 | 34.4 | 7.8 | |
| Mineral soil | ||||||||||||
| 30 cm | 8.3 | 0.9 | 3.1 | 6.8 | 7.0 | 10.0 | 0.2 | 2.4 | 2.6 | 78.2 | 10.8 | 9.0 |
| 60 cm | 7.0 | 0.7 | 3.1 | 8.0 | 6.3 | 14.6 | 0.2 | 4.0 | 1.4 | 26.7 | 11.8 | 8.2 |
| 90 cm | 7.6 | 0.3 | 2.1 | 7.5 | 6.8 | 17.9 | 0.1 | 2.2 | 1.0 | 15.8 | 9.9 | 8.7 |
© 2019 by the authors. Licensee MDPI, Basel, Switzerland. This article is an open access article distributed under the terms and conditions of the Creative Commons Attribution (CC BY) license (http://creativecommons.org/licenses/by/4.0/).
Share and Cite
MDPI and ACS Style
Růžek, M.; Myška, O.; Kučera, J.; Oulehle, F. Input-Output Budgets of Nutrients in Adjacent Norway Spruce and European Beech Monocultures Recovering from Acidification. Forests 2019, 10, 68. https://doi.org/10.3390/f10010068
AMA Style
Růžek M, Myška O, Kučera J, Oulehle F. Input-Output Budgets of Nutrients in Adjacent Norway Spruce and European Beech Monocultures Recovering from Acidification. Forests. 2019; 10(1):68. https://doi.org/10.3390/f10010068
Chicago/Turabian StyleRůžek, Michal, Oldřich Myška, Jiří Kučera, and Filip Oulehle. 2019. "Input-Output Budgets of Nutrients in Adjacent Norway Spruce and European Beech Monocultures Recovering from Acidification" Forests 10, no. 1: 68. https://doi.org/10.3390/f10010068
Note that from the first issue of 2016, this journal uses article numbers instead of page numbers. See further details here.